 Shyam Chand
 Harald Brunstad2
 Terje Thorsnes
 Jon Halvard Pedersen
- 1Geological Survey of Norway (NGU), Trondheim, Norway
- 2Expres Aker BP, Lysaker, Norway
The Loppa High is a subsurface structural high located in SW Barents Sea flanked by regional fault complexes where many hydrocarbon discoveries have been made along its peripheries during recent years. Since the petroleum exploration started in the late 1970’s, extensive studies have been undertaken giving a good understanding of the subsurface stratigraphy and the presence and maturation of hydrocarbon sources, fluid migration processes into hydrocarbon traps and seabed seeps. Many shallow gas anomalies are observed in this region due to fluid migration from the deeper reservoirs. Taking advantage of modern echo sounder and sonar technology, a more precise mapping of shallow subsurface became possible as well as detection of seafloor seeps to be inspected and sampled by advanced ROV technology. Presence of thermogenic hydrocarbons in seeps would indicate remobilisation from reservoirs in the subsurface that remained after the Late Paleogene/Neogene tectonism and the Pleistocene glacial rebound. Results of multibeam echosounder mapping of selected areas have been used to select seep sites for detailed investigation using ROV’s, and HUGIN AUV equipped with synthetic aperture sonar (HISAS), methane sniffers and optical cameras. This has aided the selection of optimal sampling sites and the collection of a large amount of sample material including seeping fluids, carbonate crusts and sediments which has been used for geochemical characterization and geochronology. Here, we present the evidence of the hydrocarbon migration and seepage from reservoirs mainly of deep thermogenic origin and altered by shallow storage during and after glaciation. The thermogenic signature of the seeping fluids indicates the long term and large-scale supply of methane to the global methane budget also from similar areas of potential natural leakage from the subsurface to the water column.
Introduction
Seafloor observations of fluid flow features have become more of interest recently since they have provided many clues not only about what has happened in the past but a peep in to the present subsurface hydrocarbon potential and its relation to the geological formations (Capozzi et al., 2017; Crémière et al., 2018). The seafloor anomalies also give an insight into the relation between fluid seepage and habitats for different life-forms, and geo hazards that might be relevant to future drilling (Sen et al., 2016; Sen et al., 2018). Fluid seepage at the seafloor is often associated with circular seabed depressions called pockmarks which are generated when the strength of fluid flow is sufficient to remove surface sediments and/or prevent sedimentation (King and MacLean, 1970; Judd and Hovland, 2007). It has been suggested that pockmarks are not necessary criteria for tracking fluid seepage since they are only formed where there is a recording medium present in the form of soft sediments (Rise et al., 2015). Hence, even though the seepage can be marked by the presence of acoustic gas flares in the water column (Leifer and MacDonald, 2003; Römer et al., 2014; Dupré et al., 2015), many flares do not associate with pockmarks (Chand et al., 2012). The fluid seepage along passive margins is linked to many factors depending on the structural, geological and palaeo geographic evolution history of the region. These include the proximity to active plate boundaries, active zones of sediment loading, faulting and the effects of glaciations in the form of ice loading and unloading (Einsele, 2013; Khader and Novakowski, 2014; Fjeldskaar and Amantov, 2018).
At high latitudes, waxing and waning of glaciers have the most important direct and indirect effect on seepage. Most of the studies from the Norwegian offshore regions link fluid flow anomalies to glacial loading and unloading cycles (Chand et al., 2008; Chand et al., 2012; Crémière et al., 2016a; Portnov et al., 2016; Winsborrow et al., 2016; Andreassen et al., 2017; Serov et al., 2023) or to sudden sediment loading resulting from glacial retreat melt water inflows and associated sediment discharges during glacial retreat (Hustoft et al., 2009; Karstens et al., 2018). Moreover, the glacial cycles create or expand a hydrate stable zone in sediments during loading, holding a reservoir of gas and hydrates. Gases from such reservoirs are released during and after the glacial unloading due to the removal of the load which is needed to keep the hydrates in stable form (Sloan and Koh, 2007). Glacial loading can also affect the fluid flow in the fault systems and result in the sealing of normal faults causing a quiescent period of no movements followed by enhanced activity during and after unloading (Hampel and Hetzel, 2006). Analysis using fault stress modelling from North Sea area indicates that the reactivation of faults might have happened during Pleistocene deglaciations and therefore potential hydrocarbon seepage might have occurred (Grollimund and Zoback, 2000). The large-scale erosion and uplift that has happened during the past glaciations resulted in overturned formations and near seafloor subcropping of source and reservoir rocks (Henriksen et al., 2011) influencing the fluid flow.
Seafloor and water column data collected during number of surveys have yielded important observations about the seabed features such as pockmarks, iceberg ploughmarks, glacial prodmarks, carbonate crusts, bacterial mats and ongoing/past gas seepage of SW Barents Sea (Chand et al., 2009; Chand et al., 2012; Chand et al., 2014; Crémière et al., 2016a; Crémière et al., 2016b; Crémière et al., 2018). The prodmarks are formed when detached icebergs plunges making a rounded depression on seafloor and when these icebergs plough away creating a ploughmark in seafloor sediments can be many tens of meters deep affecting the subsurface stratigraphy also. The subsurface has also been investigated many years through the acquisition of 2D and 3D seismic data and resulted in many important hydrocarbon discoveries (Vadakkepuliyambatta et al., 2013; NPD, 2016). Geochemical analysis of seeping free gas, methane derived authigenic carbonate crusts and biomarkers indicated a deep seated origin of fluids that is leaking/leaked through the Barents Sea seafloor (Nickel et al., 2013; Crémière et al., 2016b; Thiagarajan et al., 2022) showing the importance in using these proxies for hydrocarbon exploration.
This study focuses on the Loppa High, a fault bounded structural high in the SW Barents Sea and the surrounding basins and fault structures (Figure 1). Based on the geological and geophysical information from many surveys, this site was chosen as a laboratory site to investigate various factors related to fluid flow. Properties of the gases released at the seafloor and associated carbonate crusts can be linked to the sources of the gases and thereby analyse the possibility that the hydrocarbons were leaking during and after the glaciations. Comparison of results from seep to the reservoir gases can give a direct information of source to seep relationships and gas modifications along the migration pathways. Here, we have the unique opportunity to compare results from reservoir level to the seafloor thereby envisage the entire route for the gases. The influence of faults and properties of near seafloor sediments are analysed to study their impact on the formation of the present focussed fluid flow locations. Results from the nearby area are also presented to compare the regional development of the fluid flow.
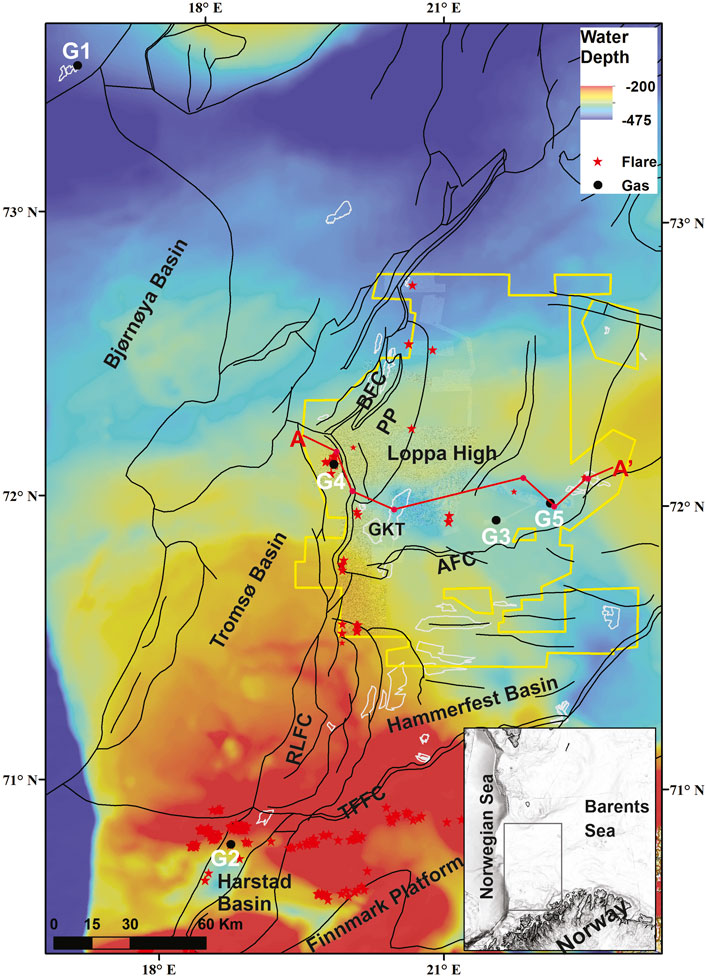
Figure 1. Regional bathymetry of the SW Barents Sea showing the boundaries of structural blocks (black lines). Also shown are the locations of gas flares (red stars) (Thorsnes et al., 2023), sites (black dots with white labels) where gas samples for geochemical studies were collected (G1-Well 7316/5-1, G2-Harstad Basin, G3-Håbrann, G4-Loppa High, G5-Svanefjell), seismo-geological section A-A’ (red line, Figure 2), exploration wells along the line (red dots), hydrocarbon discoveries (white polygons) and 3D seismic cube LN12M01 (yellow polygon, Figure 5). The high-resolution bathymetry indicates the new locations where multibeam water column data were interpreted. BFC- Bjørnoyrenna Fault Complex, AFC-Asteria Fault Complex, TFFC- Tromsø Finnmark Fault Complex, RLFC- Ringvassøy Loppa Fault Complex, PP–Polheim Platform, GKT-Gohta.
Geological setting
The Barents Sea is a shallow epicontinental sea surrounded by a Tertiary rifted margin to the west and the Norway, Russia and Svalbard landmasses lying on the south, east and north respectively (Eldholm et al., 1984). The SW Barents shelf formed in late Devonian and is underlain by metamorphic basement formed during Caledonian orogeny (Smelror et al., 2009) (Figure 2). Extensional tectonic movements dominated the late Palaeozoic and Mesozoic tectonic history of the region (Johansen et al., 1993), locally influenced by wrench tectonics (Brunstad and Rønnevik, 2022). The late Devonian to early Carboniferous crustal extension resulted in the formation of Hammerfest Basin followed by extension faulting affecting the Loppa High area during late Carboniferous to early Permian period (Faleide et al., 1993; Cavanagh et al., 2006). The main depocenters were located in intra-cratonic basins in the Mesozoic and early Cenozoic, shifting to the continental margin following the early Eocene opening of the Norwegian Sea (Spencer et al., 1984). The late Jurassic Hekkingen Formation is the major source rock along the Loppa High and Hammerfest Basin area (Doré, 1995), even though, Lower to Middle Triassic shales (mainly Klapmyss and Kobbe formations) also have hydrocarbon potential (Bjorøy et al., 2010) (Figure 2). In the flanking Hammerfest, Tromsø and Bjørnøya basins and the Fingerdjupet, higher levels of TOC are present in the Hauterivian-Cenomanian intervals of Cretaceous (Hagset et al., 2022) and are considered as gas and locally oil sources. Moreover, there are indications that source rocks of Eocene and possibly Miocene age (Daszinnies et al., 2021) are present west of Svalbard margin, and could potentially be present also along the western Barents Sea margin further south. The Selis Ridge of the crestal parts of the Loppa high acts as the major divide separating the pre-Triassic sediments on either sides and therefore the likelihood of potential traps prior to this age along the flanks of the Loppa High (Figure 2A).
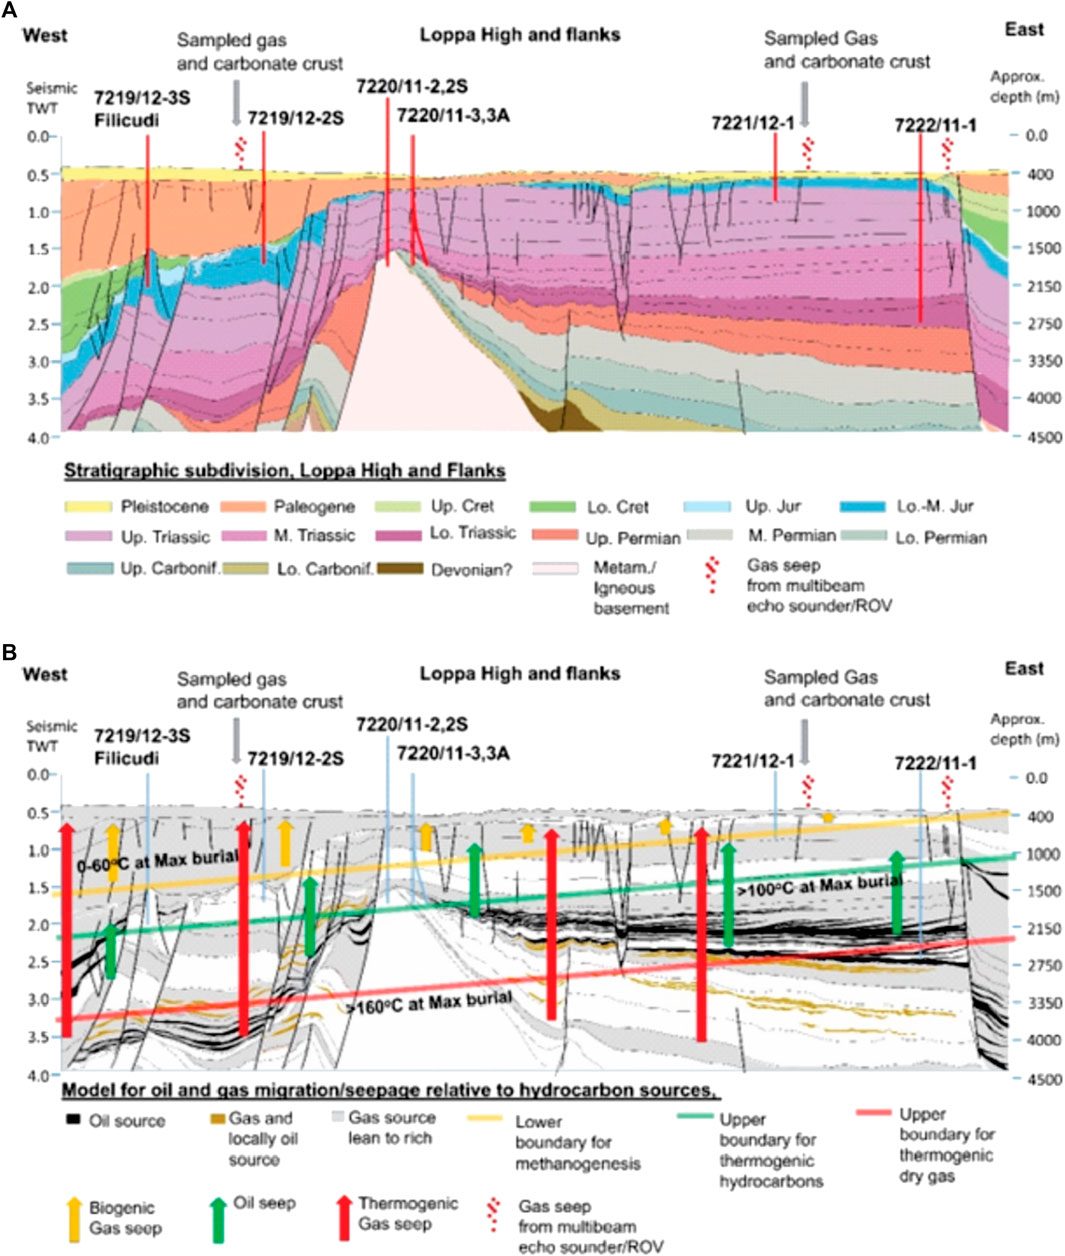
Figure 2. (A) Geological section across the study area showing the major structural features and the seepage routes. The sites of two surface gas samples are also indicated. (B) Section showing the hydrocarbon generation and seepage history across the study area. Petroleum generation and escape history was modelled by Lundin Petroleum AS using information from the exploration wells and sedimentation history of various formations established from palaeo-geographic modelling (Thiagarajan et al., 2022).
Seafloor geomorphology of the SW Barents Sea has been shaped by several glacial-interglacial cycles since the Pliocene. Glaciers have reached the shelf edge many times with the most extensive coverage occurring during the last glacial maximum (Vorren et al., 1991; Laberg et al., 2010; Laberg et al., 2012). Numerous erosional channels were carved in to the lithified sedimentary rocks with the main channel being the Bjørnøyrenna resulting in deposition of more than 3000 m sediments at the Bear Island Fan (Eidvin and Riis, 1989; Vorren et al., 1991; Riis and Fjeldskaar, 1992; Faleide et al., 1996; Laberg et al., 2012). The glacial and erosional unloading resulted in 900–1,400 m of late Cenozoic uplift (Riis and Fjeldskaar, 1992) and the formation of a prominent erosional surface known as the upper regional unconformity (URU) which represents the base of the glacial sediments (Solheim and Kristoffersen, 1984; Vorren et al., 1986). On the westward transect from the Tromsø and Bjørnøya basins to the shelf margin, there is a transition from areas of net erosional uplift to that of net deposition. The area west of this transition to net deposition consists of a thick wedge of Pleistocene sediments. This change from net erosional uplift to net burial has implications on the hydrocarbon generation history. In general, the areas of net erosional uplift are believed to have reached maximum burial in the Eocene/Oligocene ending petroleum generation. The areas of net burial have their petroleum source rocks at maximum burial today and are believed to have ongoing petroleum generation (Henriksen et al., 2011). Seismo-stratigraphic interpretations and glacial modelling indicate that grounded glaciers may have reached the shelf break of the southern Barents Sea 5–10 times during the Pleistocene (Solheim and Kristoffersen, 1984; Vorren et al., 1988; Sættem et al., 1991; Siegert and Dowdeswell, 2004; Patton et al., 2015a; 2015b), with ice thickness estimated at 800–2000 m during the last glacial maximum (Siegert et al., 2001; Svendsen et al., 2004; Patton et al., 2015a; 2015b; Auriac et al., 2016). Dating of carbonate crusts and sediments cores from various locations of the SW Barents Sea indicate that the deglaciation started ∼17.5 kyr ago (Winsborrow et al., 2010; Crémière et al., 2016a). This was followed/coincident with pockmark formation in the Loppa High area around 15 kyr ago (Pau et al., 2014), by which time the entire Barents Sea was ice-free. Sedimentation decreased from 40–70 cm/kyr during deglaciation to ∼6 cm/kyr during the last 9 kyr (Aagaard-Sørensen et al., 2010).
Material and methods
Multibeam echosounder (MBE) data collected using EM710 MBE by the Norwegian Defence Research Establishment (FFI) ship RV H.U. Sverdrup II have been used to generate terrain models and identify water column acoustic gas flares (hereafter referred as flares) (Figure 1). Fledermaus (FM) Midwater package was used to detect and analyse water column gas anomalies. Details about water column analysis can be found in Thorsnes et al. (2023). The autonomous underwater vehicle (AUV) HUGIN, equipped with a high-resolution interferometric synthetic aperture sonar (HISAS 1030) and MBE EM2040 was used to map the seabed in detail in selected areas with detected gas flares (Figures 3, 4). The HISAS system gives a range-independent resolution of approximately 3x3 cm and swath of 400 m at a speed of 2 m/s. The data were merged into high-resolution mosaics using Reflection software from Kongsberg Maritime. Methane sniffer (Franatech) installed on HUGIN was used to detect methane seepage in the water column at identified flare locations using EM710 data. Still photos were also collected using the TFish Black & White camera onboard HUGIN at selected locations. High resolution Topas and sub bottom profiler (SBP) seismic data were also collected from selected locations using Ship’s Topas PS18 system and EdgeTech 2200 full spectrum chirp SBP system on HUGIN respectively. Details about sampling and analyses of seep and reservoir gases from the study area can be found in Crémière et al. (2018) and Thiagarajan et al. (2022), respectively.
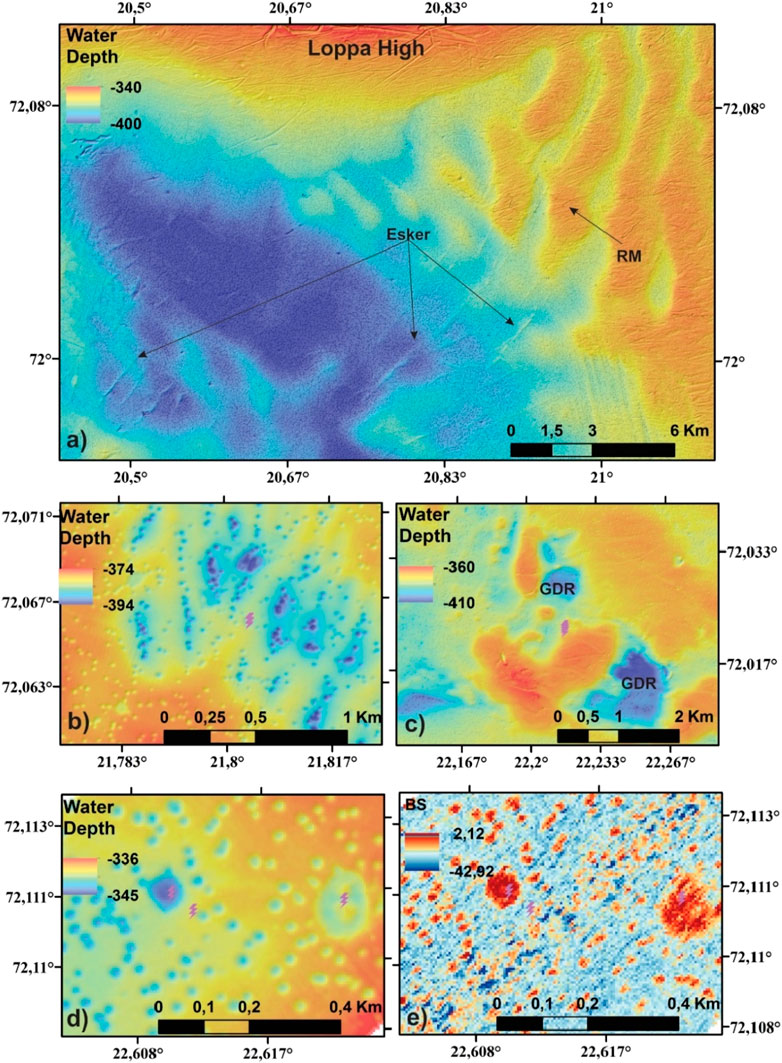
Figure 3. Multibeam bathymetry from four areas (A–D) showing the locations of pockmarks, flares (pink lightning symbol) in coexistence with various glacial seafloor features such as eskers, retreat moraine ridges (RM), glacio-tectonic depressions (GDR, hill-hole pairs). (A) Notice that the eskers cross the retreat moraines indicating that they formed after RM. (B) The pockmarks occur as chains in ploughmarks due to the availability of more soft sediments. (C) The GDRs appear to be depression formed after blocks of sediments moved from east to west. (D) bathymetry and (E) backscatter map showing the properties associated with small and mega pockmarks and the flare locations.
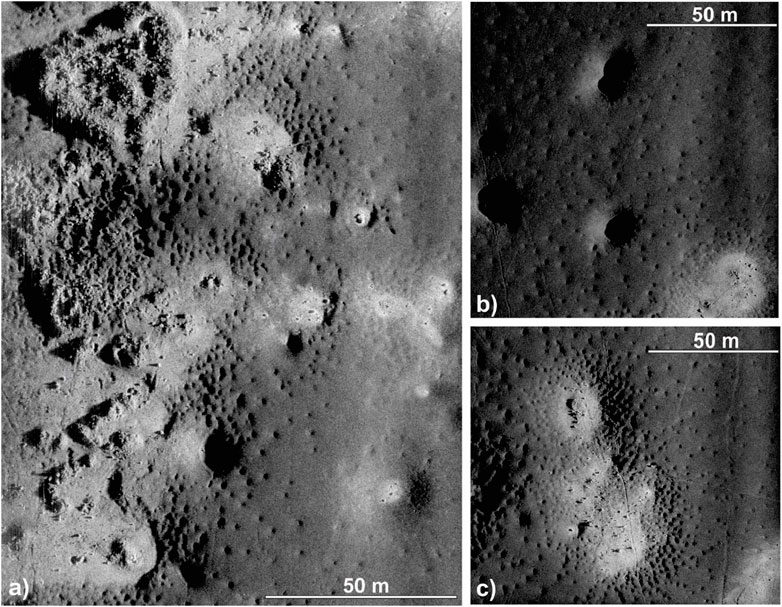
Figure 4. HISAS image from Hammerfest basin flare area showing (A) carbonate crust with micro pockmarks (∼1 m), (B) normal pockmarks (∼15 m) and micro pockmarks, (C) normal pockmarks closer to the HUGIN AUV nadir showing high resolution image from the inside of pockmarks with stones and carbonates.
The gas samples from the flare sites were collected using a gas sampler connected to the manipulator arm of the ROV and the reservoir gas sample using MDT (modular formation tester) and DST (drill stem tester) fluid sampling tools. The stable isotope ratios and molecular proportions hydrocarbons were analyzed at the Applied Petroleum Technology labs in Oslo, Norway. As described by Thiagarajan et al. (2022), aliquots of gas sample were transferred to exetainers and 0.1–1.0 mL of each sample was as extracted using a Gerstel MPS2 autosampler and injected into an Agilent 7890 RGA GC equipped with Mol sieve 5A, 4–8 mesh and Poraplot Q columns, a flame ionisation detector (FID) and 2 thermal conductivity detectors. Hydrocarbon concentrations were measured by FID. The carbon isotope compositions of hydrocarbons were determined using a GC-CIRMS system. Repeated analyses of standards indicate that the reproducibility of δ13C values is better than 1‰ (2 RSD).
Regional stratigraphic and structural boundaries were mapped using available 2D and 3D seismic data and presented in Chand et al. (2012). Spatial subsurface coverage was obtained for most of the Loppa High area with data interpretation based on 2D and 3D seismic data using Petrel software. The 2D and 3D seismic data were provided by Lundin Petroleum AS and consists of mega merged 3D cube LN12M01 covering many surveys from the study area and 2D lines available in DISKOS database. The 3D seismic is with 4 ms sampling interval and 25 m horizontal resolution. Resolution was sufficiently high to identify the position and vertical extent of deep local fault structures. Petroleum generation and escape history was modelled by Lundin Petroleum AS using information from the exploration wells and sedimentation history of various formations established from palaeogeographic modelling (details given in Thiagarajan et al., 2022). Different phases of petroleum generation and expulsion have been suggested based on the modelling (Figure 2B). The sources of gases from different generation scenarios and probable locations of their escape are indicated on a composite seismic section along the geological section given in Figure 2A (Figure 2B).
Results
Seafloor and water column inspection
Multibeam echosounder and HISAS data were used to inspect the water column and seafloor for fluid flow features. The study area consists of locations covering different structural, stratigraphic and glacial features which can control fluid flow. The seafloor consists of iceberg ploughmarks and glacial features such as eskers and end morains (Figure 3). Partially covered retreat moraine (RM) ridges can be observed indicating the region was influenced by multiple glacial advances during the last glaciation (Figure 3A). The eskers observed are also partially covered by the retreat moraines indicating that they belong to an early stage (Figure 3A). The pockmarks are concentrated along iceberg ploughmarks either due to the presence of soft sediments as recording medium in these depressions or that the ploughmarks acts as easier pathways for fluid escape being an incision into the relatively less permeable glacial deposits (Figure 3B). Glacio-tectonic depressions (GDR) are also observed in the study area indicating the influence from grounded ice (Figure 3C). The pockmarks vary in sizes and depths occurring close to each other indicating difference mechanisms or intensity in fluid flow creating them (Figures 3D, E). As observed elsewhere, the pockmarks consist of relatively coarser/harder sediments indicated by high backscatter (Figure 3E). Flares are observed to be associated with some of the large pockmarks but not always as noted earlier (Figure 3E). Close inspection of the large pockmark using high resolution HISAS data indicate the presence of carbonate crusts and very small pockmarks inside them (Figure 4). The detailed morphology of the pockmark indicates that the fluids are deflected to the rims of the pockmarks creating the small pockmarks probably due to blockage of conduits by authigenic carbonate precipitation cementing fine grain sediments (Figure 4). The carbonate crusts occur as massive pavements covering hundreds of square meters indicating long term release and focussed flow of fluids through the seafloor. In many areas the carbonate crusts fields are seen to be associated with pockmarks. However, there are also numerous pockmarks without any indication of carbonate crusts or current fluid flow.
We have interpreted ∼3800 km2 of water column data and observed 28 flares of varying sizes and magnitudes from the study area. The northernmost flare location of the study area is part of the Bjørnøyrenna fault complex where one flare is observed (Figure 1). The flare occurs close to the Filicudi (well 7219/12-1) hydrocarbon discovery (Figure 1). Three flares are identified in the region along the eastern boundary of the Polhem Platform with Loppa High (Figure 1). Two flares occur close to the boundary whereas one is found ∼10 km west of the boundary (Figure 1). Further south, eight flares occur bounding the Ringvassøy Loppa fault complex (RLFC) along the southwestern part of the Polhem Platform, (Figure 1). Along the southern part of the RLFC bounding the Gohta-Komse Terrace and Hammerfest Basin, eleven flares are observed mostly concentrated along the fault locations (Figures 1, 5). Further east, five flares are observed along the Bjørnøyrenna glacial advance grounding zone wedge deposits (Figure 1).
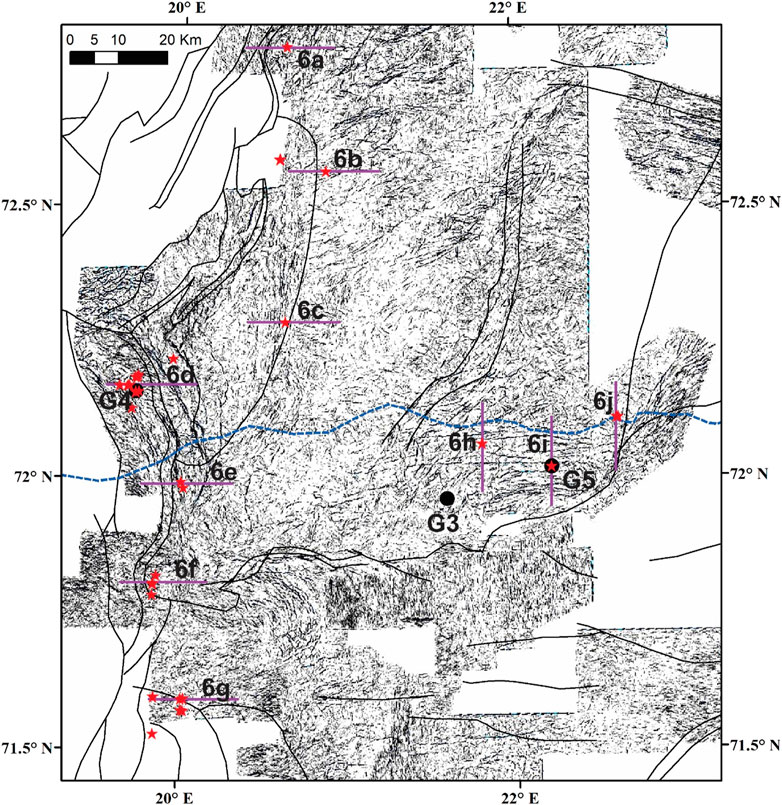
Figure 5. Variance cube slice at 800 ms TWT from sea surface of LN12M01 3D seismic data showing the location of flares (red stars), boundary of Bjørnøyrenna glacial advance grounding zone (blue dashed line), seismic sections in Figure 6 (purple lines), gas sample locations (black dots) and regional faults (black lines). Notice the good correlation of flares with faults locations. Figure location is given in Figure 1.
Fluid flow and the subsurface
The subsurface structure and geology are investigated using 2D and 3D seismic data. The subsurface along northern part of Bjørnøyrenna fault complex indicates the presence of N-S oriented faults in line with the direction of the fault complex (Figure 5). Faults of several other structural trends and directions can also be seen in the variance slice taken at 800 ms TWT from sea level indicating the heavily faulted nature of the subsurface (Figure 5). The flare here is situated above the faults corresponding to the Bjørnøyrenna fault complex (Figure 6A) where the high amplitude anomalies associated with presence of gas can be seen at different stratigraphic levels of the subsurface (Figure 6A). The flare seems to be located ∼5 km away from the traceable deep-seated fault location. The URU surface appears to be blotted with gas leaking from the faults which is probably moving upslope along it to the flare location (Figure 6A). The post URU sediments show a chaotic pattern below the flare compared to either side indicating that the sediments are probably of different character allowing fluid flow through them (Figure 6A).
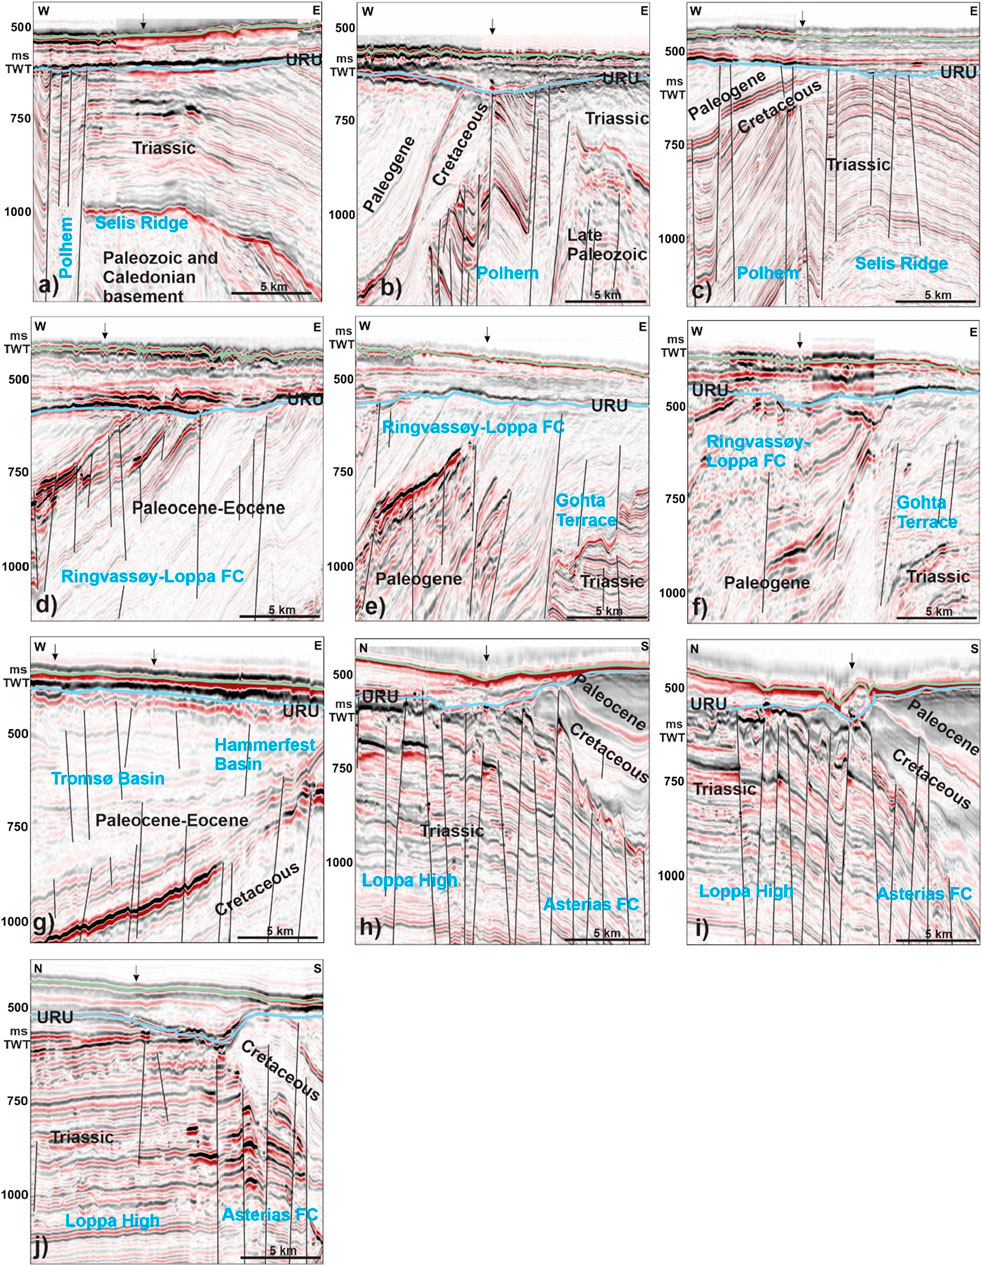
Figure 6. Seismic sections (A–J) showing examples of high amplitude anomalies related to acoustic gas flares (arrows) observed in the study area (Location in Figure 5). Blue line indicates URU surface, and green line for seafloor. The major faults are marked by black lines. The location of two gas samples, G4 and G5, coincides with flare locations shown on 6d and 6i.
Further south along the eastern boundary of Polhem Platform, the seismic data indicate a dome structure (the Selis Ridge) associated with numerous faults (Figure 6B). Some very strong amplitude anomalies are observed at the URU surface at the shallowest part of the dome where the glacial sediments are thick (∼100 ms TWT) and non-tectonized (Figure 6B). The sub-URU stratigraphy is sloping towards west in the west side of the dome whereas it shallows from east to west in the eastern side of the dome. One of the two flares in this area occurs above the fault with a marked high amplitude anomaly close to the URU surface. Many high amplitude anomalies can be seen fringing to the eastern side of the fault below the URU surface as well (Figure 6B). The URU surface is blotted with high amplitude anomaly towards the west of the flare and close to the western end of the seismic line where a second flare is observed (Figure 1). The variance slice (Figure 5) indicates heavy faulting with fault orientations shifting from N-S in the south to NE-SW orientation in the north with the faults becoming more and more bifurcated covering larger areas (Figure 5).
Along the central eastern boundary between the Polhem Platform and Loppa High, the subsurface is faulted with N-S oriented faults (Figures 5, 6C). This location is peculiar with a mixed type of stratigraphic and structural control since the sub-URU sedimentary wedge from the west at the Polhem Platform is pinching out close to this area. The faulted Triassic deposits of Loppa High reach the URU surface here (Figure 6C). The flare observed in this area is located above one of the faults which has a high amplitude anomaly in the subsurface, but dipping strata also pinch out directly below this flare. The presence of deep-seated faults, and the high amplitude anomaly deeper than URU close to the fault, suggests a fault related fluid supply to this flare and the shallow dipping permeable beds serving as fluid conduits (Figure 6C).
The western flare on the Polhem Platform also suggests a similar fluid flow mechanism with direct link to faults but intermediate permeable beds facilitating the fluid flow to the URU level (Figure 6D). Here, many flares occur above the large high amplitude anomaly close to the URU surface. The gas sample G4 is collected from the seep in this area. The flares along the eastern boundary of RLFC are located above the base Cretaceous pinchout boundary with faults linking the subsurface to seafloor (Figures 6D–G). The subsurface high amplitude anomalies, even though located along a westward dipping stratigraphic boundary, indicate a clear connection to faults below it. The Gohta and Komse Terraces also show the association with flares (Figures 1, 6E). The fluids seem to be accumulating at the top boundary of the faults creating the high amplitude anomaly which is then moving upwards to the URU level through sloping layers of the fault complex (Figure 6E). The triple junction between RLFC and Asterias fault complex along the southern part of the Gohta-Komse terrace appears to be chaotic with many high amplitude anomaly pockets occurring at different level with no apparent connection shown by faults (Figure 6F). The presence of faults as the major mechanism for gas transport can be inferred at the southernmost location along the RLFC where all the flares occur away from the pinch out zones but on top of faults (Figure 6G). The URU surface and sediments above it may be acting as a partially compromised cap rock regulating the fluid transfer from the URU to the seafloor (Figure 6G).
A series of high amplitude anomalies occur along the top of Triassic close to the pinch out zone. But there is no real connectivity between these anomalies and each of these anomalies can be directly linked to faults in the subsurface (Figures 6H–J). As noticeable in seismic data, the fluid flow is controlled by the glacial sediments which in this case are pinching out towards south. Further south, on top of E-W oriented faults, four flares have been identified (Figures 6H–J). The flares appear to be directly connected to the faults with little quaternary sediments overlying these faults (Figures 6H–J). The gas sample G5 is collected from this flare along the line given in Figure 6I. High amplitude anomalies due to the presence of gas can be seen at different levels of stratigraphy along the flanks of the faults (Figures 6H–J). The anomalies are concentrated on one side of the fault and on foot wall part of the permeable layer which is acting as the reservoir.
The two easternmost flares located above Svanefjell discovery have a similar model of fluid flow where the faults are bringing fluids to the URU surface and the URU surface act as horizontal cap rock layer with large gas accumulation at the URU level (Figure 6J). The seismic data indicates that the chances of finding a gas flare is very high along the southern part of the seismic data since the gas accumulation is having a clear route to the surface from the high amplitude anomaly located at the URU level (Figure 6J).
Geochemical results
Gas composition and isotope data of samples collected from the study area indicate variably mixed thermogenic and bacterial origins of gases (Figure 7). The relationships of methane dD vs. d13C (Figure 7B) are consistent with predominantly thermogenic origin of gases in locations G3, G4 and G5 (δ13C-CH4: 45.2‰ to −50.2‰, dD-CH4: 185‰ to −208‰) whereas microbial source dominates in G1 and G2 (δ13C-CH4: 49.4‰ to −67.8‰, dD-CH4: 175‰ to −215‰). All seep samples plot in or near the bacterial field on the Bernard diagram (Figure 7A) due to very low abundance of higher molecular-weight components (ethane, propane, butane). The reservoir sample from G1 stands out and plots between the thermogenic and bacterial fields in the Bernard diagram showing that there is some mixing happening at the reservoir level too (Figure 7A) which is clear in the methane isotopic ratios indicating a biogenic origin (Figure 7B). Despite indications of bacterial origin of seep gases based on the Bernard plot relationships, the predominantly thermogenic origin as indicated by methane data (Figure 7B) appears fully feasible given that methane migrates more readily from reservoirs compared to higher-molecular weight components that tend to be retained in the rock (Prinzhofer and Huc, 1995; Martini et al., 1996). Such compositional fractionation along the migration pathway from the reservoir to the seep may result in high C1/(C2-C4) and placement outside the thermogenic field in the Bernard plot (Figure 7B) of G3, G4 and G5 gases that have predominantly thermogenic origin. Still, isotope data of methane suggest that there is a minor bacterial component present in G3, G4 and G5, and a bacterial component is dominant in G1 and G2 as suggested earlier (Crémière et al., 2018).
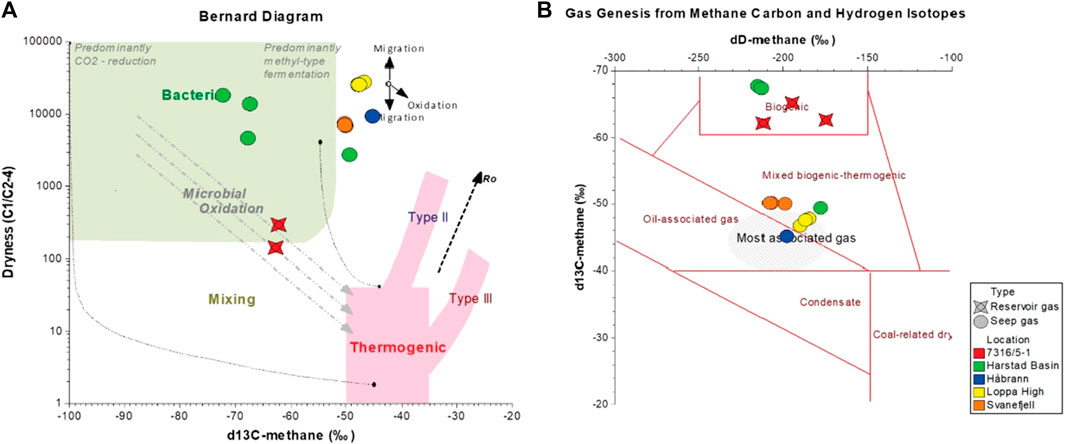
Figure 7. Gas composition and isotope data from samples collected from the study area and nearby locations plotted as (A) Bernard diagram and (B) gas genesis diagram based on methane carbon and hydrogen isotope composition. Locations shown as G1-Well 7316/5-1, G2-Harstad Basin, G3-Håbrann, G4-Loppa High and G5-Svanefjell in Figure 1.
Discussion
The fluid flow processes in the Loppa High and surrounding region are of special interest to investigate given the forcing of the glacial loading and unloading after deglaciation on the faulted shallow source rocks of Jurassic and Triassic age. The Loppa High is bounded by regional fault complexes of various ages (the Asterias, the Ringvassøy-Loppa, the Bjørnøyrenna and the Hoop fault complexes) on all sides and the sedimentary rocks encompassing the high are also heavily faulted making the region prone for fluid flow from deep source levels. The fault orientations might have changed in directions and dips due to the combined effects of sedimentary loading and various glaciations including erosion and glacio-isostatic uplift resulting in frequent opening and closing of various pathways. The glaciers were ∼1,500–2000 m thick during the last glaciation (Siegert et al., 2001; Auriac et al., 2016) reached the maximum extent 25 Ka and started retreating 17 ka ago (Peltier, 2004; Siegert and Dowdeswell, 2004; Svendsen et al., 2004). The loading effect during last glacial maximum spanned over a period of about 8000 years resulting in a thick hydrate stability zone (Chand et al., 2008) and consequent fluids expulsion from the subsurface reservoirs due to the load. Whether the thick and deep gas hydrate stability zone acted as a seal or not is unclear since there are many factors affecting the situation, such as, 1) the rate of grounded ice sheet growth (pressure buildup) vs. intensity of fluid seepage towards the surface, 2) the pore saturation and morphology of the hydrate formed controlling the fluid flow, 3) the temperature of the fluids vs. hydrate stability parameters, 4) proximity of the location to glacial front. In simple terms we can assume that the hydrate layer acted as a barrier, and with the deglaciation, the layer was removed resulting in intense fluid flow to the seafloor immediately followed by long term fluid flow as observed now as flares.
The results from the analysis of seep gas samples from the flare areas indicate that they, except G2, have a deep thermogenic origin, but the reservoir gas in G1 indicates a significant microbial contribution. This can be attributed to microbial degradation of thermogenic gas altering the isotopic composition of the methane gas (Milkov, 2011) most probably resulting from water percolation through open faults. The water percolation can be due to the existence of hydraulic under pressures either due to glacial unloading after hydraulic equilibration during grounded ice loading or due to an inherent under pressure generated due to large scale erosion during various ice ages which got equilibrated with opening of faults (Vinard et al., 2001). Both scenarios exhibit an open system at least for a short duration, consistent with the seepage from the reservoirs. All other samples except those from the Harstad Basin indicates an oil associated existence also implying the possibility of seepage from oil reservoirs. The four study areas are close to hydrocarbon discoveries and therefore such a signature indicates the possibility of past and present seepage from these reservoirs. Results from previous studies (Crémière et al., 2016a) suggest an enhanced seepage scenario after glacier retreat.
Since the fluids are leaking from the shallow sources, the originally deep sourced fluids probably have changed in properties by microbial degradation and hence the original source properties are partly hidden. The acoustic gas flares observed in the study can be related to the location of deep-seated faults in seismic data (Figure 5) and different levels of accumulation can be observed (Figure 6). The glacial deposits cover a major part of the study area, but flares occur wherever a subsurface fault is bringing fluids to the base of these deposits. The Cretaceous and older Mesozoic sediments are shallowing towards the area with the presence of fluid flow anomalies with fluid transfer happening along faults and unconformities. But no apparent single fluid focussing routes can be pointed out indicating a general seepage through heavy faulted sediments bringing the fluids to the URU. On the other hand, the glacial deposits act as a major control in redirecting the upward movement of fluids to the seafloor.
Conclusion
2. Fluid flow in the SW Barents Sea is occurring through faults mediated by glacial sediments.
3. The fluid leaking locations with soft sediments are associated with larger pockmarks (>30 m) than the usual ones and occurrence of carbonate crusts.
4. Geochemical results from the samples indicate that the fluids are mainly deep thermogenic origin and altered by shallow storage during and after glaciation.
5. The thermogenic signature of the seeping fluids indicates the long term and large-scale supply of methane to the global methane budget also from similar areas of potential natural leakage from the subsurface to the water column.
Data availability statement
The datasets presented in this article are not readily available because the raw data is not distributable. Requests to access the datasets should be directed to c2h5YW0uY2hhbmRAbmd1Lm5v.
Author contributions
SC: Conceptualization, Data curation, Formal Analysis, Funding acquisition, Investigation, Methodology, Project administration, Resources, Software, Validation, Visualization, Writing–original draft, Writing–review and editing. HB: Investigation, Project administration, Resources, Supervision, Visualization, Writing–review and editing. AL: Data curation, Investigation, Methodology, Validation, Writing–review and editing. TT: Funding acquisition, Investigation, Project administration, Supervision, Visualization, Writing–review and editing. JP: Formal Analysis, Investigation, Resources, Visualization, Writing–review and editing.
Funding
The author(s) declare that financial support was received for the research, authorship, and/or publication of this article. This study was funded by Lundin Norway AS (now Aker BP) and Geological Survey of Norway (NGU).
Acknowledgments
Geological Survey of Norway (NGU): data collection, processing, analysis, research, support and reporting.
Conflict of interest
Authors HB and JP were employed by Expres Aker BP.
The remaining authors declare that the research was conducted in the absence of any commercial or financial relationships that could be construed as a potential conflict of interest.
The authors declare that this study received funding from Lundin Norway AS. The funder had the following involvement in the study: data collection, processing, analysis and reporting.
Publisher’s note
All claims expressed in this article are solely those of the authors and do not necessarily represent those of their affiliated organizations, or those of the publisher, the editors and the reviewers. Any product that may be evaluated in this article, or claim that may be made by its manufacturer, is not guaranteed or endorsed by the publisher.
References
Aagaard-Sørensen, S., Husum, K., Hald, M., and Knies, J. (2010). Paleoceanographic development in the SW Barents Sea during the Late Weichselian–Early Holocene transition. Quat. Sci. Rev., APEX Arct. Palaeoclim. its Extrem. 29, 3442–3456. doi:10.1016/j.quascirev.2010.08.014
Andreassen, K., Hubbard, A., Winsborrow, M., Patton, H., Vadakkepuliyambatta, S., Plaza-Faverola, A., et al. (2017). Massive blow-out craters formed by hydrate-controlled methane expulsion from the Arctic seafloor. Science 356, 948–953. doi:10.1126/science.aal4500
Auriac, A., Whitehouse, P. L., Bentley, M. J., Patton, H., Lloyd, J. M., and Hubbard, A. (2016). Glacial isostatic adjustment associated with the Barents Sea ice sheet: a modelling inter-comparison. Quat. Sci. Rev., Special Issue PAST Gatew. (Palaeo-Arctic Spatial Temporal Gatew.) 147, 122–135. doi:10.1016/j.quascirev.2016.02.011
Bjorøy, M., Hall, P. B., Ferriday, I. L., and Mørk, A. (2010). Triassic source rocks of the Barents Sea and Svalbard. Search Discov. Artic. 10219, 7–10.
Brunstad, H., and Rønnevik, H. C. (2022). Loppa High composite tectono-sedimentary element, Barents Sea. Geol. Soc. 57. doi:10.1144/M57-2020-3
Capozzi, R., Oppo, D., and Taviani, M. (2017). Cold seepages: an economic tool for hydrocarbon appraisal. AAPG Bull. 101, 617–623. doi:10.1306/011817dig17041
Cavanagh, A. J., Di Primio, R., Scheck-Wenderoth, M., and Horsfield, B. (2006). Severity and timing of Cenozoic exhumation in the southwestern Barents Sea. J. Geol. Soc. 163, 761–774. doi:10.1144/0016-76492005-146
Chand, S., Knies, J., Baranwal, S., Jensen, H., and Klug, M. (2014). Structural and stratigraphic controls on subsurface fluid flow at the Veslemøy High, SW Barents Sea. Mar. Pet. Geol. 57, 494–508. doi:10.1016/j.marpetgeo.2014.06.004
Chand, S., Mienert, J., Andreassen, K., Knies, J., Plassen, L., and Fotland, B. (2008). Gas hydrate stability zone modelling in areas of salt tectonics and pockmarks of the Barents Sea suggests an active hydrocarbon venting system. Mar. Pet. Geol. 25, 625–636. doi:10.1016/j.marpetgeo.2007.10.006
Chand, S., Rise, L., Ottesen, D., Dolan, M., Bellec, V., and Bøe, R. (2009). Pockmark-like depressions near the Goliat hydrocarbon field, Barents Sea: morphology and genesis. Mar. Pet. Geol. 26, 1035–1042. doi:10.1016/j.marpetgeo.2008.09.002
Chand, S., Thorsnes, T., Rise, L., Brunstad, H., Stoddart, D., Bøe, R., et al. (2012). Multiple episodes of fluid flow in the SW Barents Sea (Loppa High) evidenced by gas flares, pockmarks and gas hydrate accumulation. Earth Planet. Sci. Lett. 331, 305–314. doi:10.1016/j.epsl.2012.03.021
Crémière, A., Chand, S., Sahy, D., Thorsnes, T., Martma, T., Noble, S. R., et al. (2018). Structural controls on seepage of thermogenic and microbial methane since the last glacial maximum in the Harstad Basin, southwest Barents Sea. Mar. Pet. Geol. 98, 569–581. doi:10.1016/j.marpetgeo.2018.07.010
Crémière, A., Lepland, A., Chand, S., Sahy, D., Condon, D. J., Noble, S. R., et al. (2016a). Timescales of methane seepage on the Norwegian margin following collapse of the Scandinavian Ice Sheet. Nat. Commun. 7, 11509. doi:10.1038/ncomms11509
Crémière, A., Lepland, A., Chand, S., Sahy, D., Kirsimäe, K., Bau, M., et al. (2016b). Fluid source and methane-related diagenetic processes recorded in cold seep carbonates from the Alvheim channel, central North Sea. Chem. Geol. 432, 16–33. doi:10.1016/j.chemgeo.2016.03.019
Daszinnies, M., Plaza-Faverola, A., Sylta, Ø., Bünz, S., Mattingsdal, R., Tømmerås, A., et al. (2021). The Plio-Pleistocene seepage history off western Svalbard inferred from 3D petroleum systems modelling. Mar. Petroleum Geol. 128, 105023. doi:10.1016/j.marpetgeo.2021.105023
Doré, A. (1995). Barents Sea geology, petroleum resources and commercial potential. Arctic 48, 207–221. doi:10.14430/arctic1243
Dupré, S., Scalabrin, C., Grall, C., Augustin, J.-M., Henry, P., Şengör, A. M. C., et al. (2015). Tectonic and sedimentary controls on widespread gas emissions in the Sea of Marmara: results from systematic, shipborne multibeam echo sounder water column imaging. J. Geophys. Res. Solid Earth 120, 2891–2912. doi:10.1002/2014JB011617
Eidvin, T., and Riis, F. (1989). Nye dateringer av de tre vestligste borehullene i Barentshavet. Resultater og konsekvenser for den Tertiære hevingen. Nor. Pet. Dir. Contr. 27, 1–62.
Einsele, G. (2013). Sedimentary basins: evolution, facies, and sediment budget. Berlin, Germany: Springer Science and Business Media.
Eldholm, O., Sundvor, E., Myhre, A. M., and Faleide, J. I. (1984). “Cenozoic evolution of the continental margin off Norway and western Svalbard,” in Petroleum geology of the north European margin. Editor A. M. Spencer (Netherlands: Springer), 3–18. doi:10.1007/978-94-009-5626-1_2
Faleide, J. I., Solheim, A., Fiedler, A., Hjelstuen, B. O., Andersen, E. S., and Vanneste, K. (1996). Late Cenozoic evolution of the western Barents Sea-Svalbard continental margin. Glob. Planet. Change, Impact Glaciat. Basin Evol. Data Models Nor. Margin Adjacent Areas 12, 53–74. doi:10.1016/0921-8181(95)00012-7
Faleide, J. I., Vågnes, E., and Gudlaugsson, S. T. (1993). Late Mesozoic-Cenozoic evolution of the south-western Barents Sea in a regional rift-shear tectonic setting. Mar. Pet. Geol. 10, 186–214. doi:10.1016/0264-8172(93)90104-z
Fjeldskaar, W., and Amantov, A. (2018). Effects of glaciations on sedimentary basins. J. Geodyn. 118, 66–81. doi:10.1016/j.jog.2017.10.005
Grollimund, B., and Zoback, M. D. (2000). Post glacial lithospheric flexure and induced stresses and pore pressure changes in the northern North Sea. Tectonophysics 327, 61–81. doi:10.1016/s0040-1951(00)00162-1
Hagset, A., Grundvåg, S. A., Badics, B., Davies, R., and Rotevatn, A. (2022). Tracing lower cretaceous organic-rich units across the SW Barents shelf. Mar. Petroleum Geol. 140, 105664. doi:10.1016/j.marpetgeo.2022.105664
Hampel, A., and Hetzel, R. (2006). Response of normal faults to glacial-interglacial fluctuations of ice and water masses on Earth’s surface. J. Geophys. Res. Solid Earth 111. doi:10.1029/2005jb004124
Henriksen, E., Bjørnseth, H., Hals, T., Heide, T., Kiryukhina, T., Kløvjan, O., et al. (2011). Chapter 17 Uplift and erosion of the greater Barents Sea: impact on prospectivity and petroleum systems. Geol. Soc. Lond. Mem. 35, 271–281. doi:10.1144/m35.17
Hustoft, S., Dugan, B., and Mienert, J. (2009). Effects of rapid sedimentation on developing the Nyegga pockmark field: constraints from hydrological modeling and 3-D seismic data, offshore mid-Norway. Geochem. Geophys. Geosystems 10. doi:10.1029/2009gc002409
Johansen, S., Ostisty, B., Fedorovsky, Y., Martirosjan, V., Christensen, O. B., Cheredeev, S., et al. (1993). “Hydrocarbon potential in the Barents Sea region: play distribution and potential,” in Norwegian petroleum society special publications (Amsterdam, Netherlands: Elsevier), 273–320.
Judd, A., and Hovland, M. (2007). Seabed fluid flow: the impact on geology, biology and the marine environment. Cambridge: Cambridge University Press.
Karstens, J., Haflidason, H., Becker, L. W., Berndt, C., Rüpke, L., Planke, S., et al. (2018). Glacigenic sedimentation pulses triggered post-glacial gas hydrate dissociation. Nat. Commun. 9, 635. doi:10.1038/s41467-018-03043-z
Khader, O., and Novakowski, K. (2014). Impacts of Pleistocene glacial loading on abnormal pore-water pressure in the eastern Michigan Basin. Geofluids 14, 200–220. doi:10.1111/gfl.12074
King, L. H., and MacLean, B. (1970). Pockmarks on the Scotian shelf. GSA Bull. 81, 3141–3148. doi:10.1130/0016-7606(1970)81[3141:potss]2.0.co;2
Laberg, J. S., Andreassen, K., Knies, J., Vorren, T. O., and Winsborrow, M. (2010). Late Pliocene–Pleistocene development of the Barents Sea ice sheet. Geology 38, 107–110. doi:10.1130/G30193.1
Laberg, J. S., Andreassen, K., and Vorren, T. O. (2012). Late Cenozoic erosion of the high-latitude southwestern Barents Sea shelf revisited. Geol. Soc. Am. Bull. 124, 77–88. doi:10.1130/b30340.1
Leifer, I., and MacDonald, I. (2003). Dynamics of the gas flux from shallow gas hydrate deposits: interaction between oily hydrate bubbles and the oceanic environment. Earth Planet. Sci. Lett. 210, 411–424. doi:10.1016/S0012-821X(03)00173-0
Martini, A. M., Budai, J. M., Walter, I. M., and Schoell, M. (1996). Microbial generation of economic accumulations of methane within a shallow organic-rich shale. Nature 383, 155–158. doi:10.1038/383155a0
Milkov, A. V. (2011). Worldwide distribution and significance of secondary microbial methane formed during petroleum biodegradation in conventional reservoirs. Org. Geochem. 42, 184–207. doi:10.1016/j.orggeochem.2010.12.003
Nickel, J. C., di Primio, R., Kallmeyer, J., Hammer, Ø., Horsfield, B., Stoddart, D., et al. (2013). Tracing the origin of thermogenic hydrocarbon signals in pockmarks from the southwestern Barents Sea. Org. Geochem. 63, 73–84. doi:10.1016/j.orggeochem.2013.08.008
NPD (2016). Fact pages, Norwegian petroleum directorate. Available at: http://www.npd.no/no/Tema/.
Patton, H., Andreassen, K., Bjarnadóttir, L. R., Dowdeswell, J. A., Winsborrow, M. C. M., Noormets, R., et al. (2015a). Geophysical constraints on the dynamics and retreat of the Barents Sea ice sheet as a palaeo benchmark for models of marine ice sheet deglaciation. Rev. Geophys. 53, 2015RG000495. doi:10.1002/2015RG000495
Patton, H., Andreassen, K., Bjarnadóttir, L. R., Dowdeswell, J. A., Winsborrow, M. C. M., Noormets, R., et al. (2015b). Geophysical constraints on the dynamics and retreat of the Barents Sea Ice Sheet as a palaeo-benchmark for models of marine ice-sheet deglaciation: geophysical constraints on the BSIS. Rev. Geophys. n/a-n/a 53, 1051–1098. doi:10.1002/2015RG000495
Pau, M., Hammer, Ø., and Chand, S. (2014). Constraints on the dynamics of pockmarks in the SW Barents Sea: evidence from gravity coring and high-resolution, shallow seismic profiles. Mar. Geol. 355, 330–345. doi:10.1016/j.margeo.2014.06.009
Peltier, W. (2004). Global glacial isostasy and the surface of the ice-age Earth: the ICE-5G (VM2) model and GRACE. Annu. Rev. Earth Planet Sci. 32, 111–149. doi:10.1146/annurev.earth.32.082503.144359
Portnov, A., Vadakkepuliyambatta, S., Mienert, J., and Hubbard, A. (2016). Ice-sheet-driven methane storage and release in the Arctic. Nat. Commun. 7, 10314. doi:10.1038/ncomms10314
Prinzhofer, A. A., and Huc, A. Y. (1995). Genetic and post genetic molecular and isotopic fractionations in natural gases. Chem. Geol. 126, 281–290. doi:10.1016/0009-2541(95)00123-9
Riis, F., and Fjeldskaar, W. (1992). “On the magnitude of the Late Tertiary and Quaternary erosion and its significance for the uplift of Scandinavia and the Barents Sea,” in Structural and tectonic modeling and its application to the petroleum geology (Amsterdam: NPF Special Publication. Elsevier), 163–185.
Rise, L., Bellec, V., Chand, S., and Bøe, R. (2015). Pockmarks in the southwestern Barents Sea and Finnmark fjords. Nor. J. Geol. 94, 263–282. doi:10.17850/njg94-4-02
Römer, M., Sahling, H., Pape, T., dos Santos Ferreira, C., Wenzhöfer, F., Boetius, A., et al. (2014). Methane fluxes and carbonate deposits at a cold seep area of the central Nile deep sea fan, eastern Mediterranean Sea. Mar. Geol. 347, 27–42. doi:10.1016/j.margeo.2013.10.011
Sættem, J., Rise, L., and Westgaard, D. A. (1991). Composition and properties of glacigenic sediments in the southwestern Barents Sea. Mar. Geotechnol. 10, 229–255. doi:10.1080/10641199109379893
Sen, A., Åström, E. K. L., Hong, W.-L., Portnov, A. D., Waage, M., Serov, P., et al. (2018). Geophysical and geochemical controls on the megafaunal community of a high Arctic cold seep. Biogeosciences 15, 4533–4559. doi:10.5194/bg-15-4533-2018
Sen, A., Ondréas, H., Gaillot, A., Marcon, Y., Augustin, J.-M., and Olu, K. (2016). The use of multibeam backscatter and bathymetry as a means of identifying faunal assemblages in a deep-sea cold seep. Deep Sea Res. Part Oceanogr. Res. Pap. 110, 33–49. doi:10.1016/j.dsr.2016.01.005
Serov, P., Mattingsdal, R., Winsborrow, M., Patton, H., and Andreassen, K. (2023). Widespread natural methane and oil leakage from sub-marine Arctic reservoirs. Nat. Commun. 14, 1782. doi:10.1038/s41467-023-37514-9
Siegert, M. J., and Dowdeswell, J. A. (2004). Numerical reconstructions of the Eurasian ice sheet and climate during the Late Weichselian. Quat. Sci. Rev. 23, 1273–1283. doi:10.1016/j.quascirev.2003.12.010
Siegert, M. J., Dowdeswell, J. A., Hald, M., and Svendsen, J.-I. (2001). Modelling the Eurasian ice sheet through a full (Weichselian) glacial cycle. Glob. Planet. Change, late Quat. Stratigr. Environ. North. Eurasia adjacent Arct. seas - new contributions QUEEN 31, 367–385. doi:10.1016/S0921-8181(01)00130-8
Smelror, M., Petrov, O., Larssen, G. B., and Werner, S. (2009). Geological history of the Barents Sea. Nor. Geol. Unders., 1–135.
Solheim, A., and Kristoffersen, Y. (1984). The physical environment, Western Barents Sea; Sediments above the upper regional unconformity: thickness, seismic stratigraphy and outline of the glacial history. Nor. Polarinst. Skr. 179B, 26.
Spencer, A. M., Home, P. C., and Berglund, L. T. (1984). “Tertiary structural development of the western Barents shelf: Troms to Svalbard,” in Petroleum geology of the north European margin. Editor A. M. Spencer (Netherlands: Springer), 199–209. doi:10.1007/978-94-009-5626-1_14
Svendsen, J. I., Alexanderson, H., Astakhov, V. I., Demidov, I., Dowdeswell, J. A., Funder, S., et al. (2004). Late Quaternary ice sheet history of northern Eurasia. Quat. Sci. Rev. 23, 1229–1271. doi:10.1016/j.quascirev.2003.12.008
Thiagarajan, N., Pedersen, J. H., Brunstad, H., Rinna, J., Lepland, A., and Eiler, J. (2022). Clumped isotope constraints on the origins of reservoir methane from the Barents Sea. Pet. Geosci. 28. doi:10.1144/petgeo2021-037
Thorsnes, T., Chand, S., Bellec, V., Nixon, F. C., Brunstad, H., Lepland, A., et al. (2023). Gas seeps in Norwegian waters – distribution and mechanisms. Nor. J. Geol. 103, 202309. doi:10.17850/njg103-2-4
Vadakkepuliyambatta, S., Bünz, S., Mienert, J., and Chand, S. (2013). Distribution of subsurface fluid-flow systems in the SW Barents Sea. Mar. Pet. Geol. 43, 208–221. doi:10.1016/j.marpetgeo.2013.02.007
Vinard, P., Bobet, A., and Einstein, H. H. (2001). Generation and evolution of hydraulic underpressures at Wellenberg, Switzerland. Jour. Geophys. Res. 106 (B12), 30593–30605. doi:10.1029/2001jb000327
Vorren, T. O., Hald, M., and Lebesbye, E. (1988). Late Cenozoic environments in the Barents Sea. Paleoceanography 3, 601–612. doi:10.1029/PA003i005p00601
Vorren, T. O., Kristoffersen, Y., and Andreassen, K. (1986). Geology of the inner shelf west of North Cape, Norway. Geol. Tidsskr. 66.
Vorren, T. O., Richardsen, G., Knutsen, S.-M., and Henriksen, E. (1991). Cenozoic erosion and sedimentation in the western Barents Sea. Mar. Pet. Geol. 8, 317–340. doi:10.1016/0264-8172(91)90086-g
Winsborrow, M., Andreassen, K., Hubbard, A., Plaza-Faverola, A., Gudlaugsson, E., and Patton, H. (2016). Regulation of ice stream flow through subglacial formation of gas hydrates. Nat. Geosci. 9, 370–374. doi:10.1038/ngeo2696
Winsborrow, M. C., Andreassen, K., Corner, G. D., and Laberg, J. S. (2010). Deglaciation of a marine-based ice sheet: late Weichselian palaeo-ice dynamics and retreat in the southern Barents Sea reconstructed from onshore and offshore glacial geomorphology. Quat. Sci. Rev. 29, 424–442. doi:10.1016/j.quascirev.2009.10.001
Keywords: fluid flow, Barents Sea, Loppa High, pockmark, multibeam, gas flare, gas hydrate, methane
Citation: Chand S, Brunstad H, Lepland A, Thorsnes T and Pedersen JH (2024) Fluid flow at the Loppa High results from the seabed laboratory and test site. Front. Earth Sci. 12:1346645. doi: 10.3389/feart.2024.1346645
Received: 29 November 2023; Accepted: 23 April 2024;
Published: 14 May 2024.
Edited by:
Michael Lehning, Swiss Federal Institute of Technology Lausanne, SwitzerlandReviewed by:
Alexey Portnov, Spanish National Research Council (CSIC), SpainPavel Serov, UiT The Arctic University of Norway, Norway
Copyright © 2024 Chand, Brunstad, Lepland, Thorsnes and Pedersen. This is an open-access article distributed under the terms of the Creative Commons Attribution License (CC BY). The use, distribution or reproduction in other forums is permitted, provided the original author(s) and the copyright owner(s) are credited and that the original publication in this journal is cited, in accordance with accepted academic practice. No use, distribution or reproduction is permitted which does not comply with these terms.
*Correspondence: Shyam Chand, c2h5YW0uY2hhbmRAbmd1Lm5v