 Tine L. Rasmussen
 Tove Nielsen
- 1Department of Geosciences, UiT the Arctic University of Norway, Tromsø, Norway
- 2Geological Survey of Denmark and Greenland (GEUS), Copenhagen, Denmark
Vestnesa Ridge is built-up of thick contourites mainly deposited during the last ∼5 million years. Methane leaks from deep gas reservoirs creating pockmarks on its crest, and which have been the focus of numerous studies. Sedimentation patterns in relation to the pronounced changes in oceanography and climate of the last glacial-interglacial cycles and its possible impact of seepage of gas have rarely been studied. Here, we present a detailed history of contourite development covering the last ∼130,000 years with most details for the last 60,000 years. The study is based on 43 marine sediment cores and 1,430 km of shallow seismic lines covering the ridge including methane seep sites, with the purpose of reconstructing changes in depositional patterns in relation to paleoceanographical changes on glacial, interglacial, and millennial time scale in relation to activity of seepage of gas. The results show that thick Holocene deposits occurred below ∼1,250 m water depth in the western part of the ridge. Both in pockmarks at western and eastern Vestnesa Ridge, seepage decreased at ∼10–9 ka in the early Holocene. The fine Holocene mud likely reduced seepage to a slow diffusion of gas and microbial oxidation probably prevented escape from the seafloor. Results also showed that seepage of gas was highly variable during the glacial, and low to moderate during the cold Heinrich stadial H1 (19–15 ka) and Younger Dryas stadial (13–12 ka). Seepage reached a maximum during the deglaciation in the Bølling and Allerød interstadials 15–13 ka and early Holocene 12–10 ka. The deglaciation was a period of rapid climatic, oceanographic, and environmental changes. Seepage of gas varied closely with these events indicating that slower tectonic/isostatic movements probably played a minor role in these millennial scale rapid fluctuations in gas emission.
1 Introduction
Vestnesa Ridge is located in the Arctic off the northwestern Svalbard margin in eastern Fram Strait just north of the Molloy Transform Fault (Figure 1A). The 100-km long ridge is a southeast-northwest stretching elongated contourite drift at 79°N, 05–07°E, its crest spanning a water depth of ∼1,200 m towards east and >1,300 m towards west. Intensive seepage of methane occurs from a series of pockmarks on the crest of the ridge (Vogt et al., 1994; Hustoft et al., 2009; Plaza-Faverola et al., 2015). The gas migrates upwards from a deep thermogenic reservoir through faulted chimneys penetrating the gas hydrate stability zone (GHSZ). The GHSZ is several hundred of meters thick on the ridge extending from ∼160 m below the seafloor and well into the water column (Bünz et al., 2012; Plaza-Faverola et al., 2017). Patchy deposits of gas hydrates have been found close to the sediment surface (Sztybor and Rasmussen, 2017a; Laier et al., 2017; Hong et al., 2021).
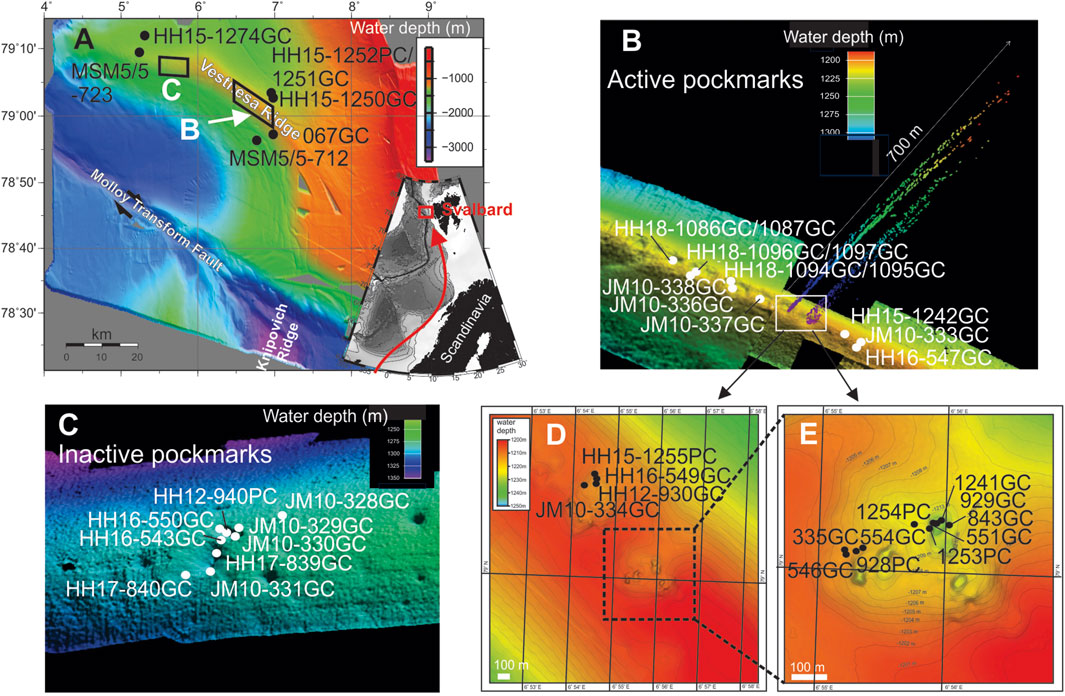
Figure 1. Overview maps and detail maps of study area. (A): Map of Vestnesa Ridge with eastern active (B) and western inactive (C) pockmark areas marked. Core location of published records discussed in the text are also indicated. Insert show the Nordic Seas and location of Svalbard and Vestnesa Ridge with red arrow indicating the West Spitsbergen Current. (B): Detail of eastern active pockmark area showing location of core sites outside of ‘Lunde’ and ‘Lomvi’ pockmarks (the latter two marked by white frame). (C): Detail of western Vestnesa pockmark area showing location of core sites. (D): Detail of ‘Lunde’ pockmark showing core sites. (E) Detail of ‘Lomvi’ pockmark showing core sites (core names abbreviated). See Supplementary Table S1 for details and references to previously published records and Supplementary Figure S1.
The thermohaline ocean circulation in the Nordic Seas intensified about 5 million years ago and deposits from the Pliocene onwards are up to ∼5 km thick on the ridge (Knies et al., 2014). Increased glaciation regimes during the Quaternary led to increased sedimentation rates from 2.7 Ma (Gebhardt et al., 2014) and seepage of methane intensified from that time (Knies et al., 2018). Modeling studies indicated that the strength of seepage is influenced by offshore isostatic adjustments during glacial periods (Daszinnies et al., 2021). Also, tectonic movements of the Molloy Transform Fault and Knipovich spreading zone have been interpreted to cause fracturing and increase in seepage (Plaza-Faverola et al., 2015; 2023).
Pockmarks are seen along the entire ridge crest (e.g., Hustoft et al., 2009). Presently, seepage of methane gas is only active on the eastern part of the ridge at ∼1,200 m water depth where acoustic flares are rising from the seafloor up to 800 m into the water column (Hustoft et al., 2009) (Figure 1B). On the central and western part of the ridge down to >∼1,300 m water depth the pockmarks are inactive and without detectable acoustic flares (Bünz et al., 2012) (Figure 1C). In recent years, most studies from the ridge have focused on release of methane, its history, causes of variability and patterns of release (e.g., Plaza-Faverola et al., 2015; 2023; Sztybor and Rasmussen, 2017a; b; Himmler et al., 2018; Schneider et al., 2018) as well as its present seep related environments and associated faunas (e.g., Åström et al., 2018; Yasuhara et al., 2018; Sen et al., 2020; Melaniuk et al., 2022a; b). Little attention has been given to the depositional patterns on the ridge and its variability and potential impact on seepage of methane. Thus, there is a need to better understand the implication of changes in depocenters of the contourite on the degree of seepage of methane in relation to the large glacial-interglacial and millennial climatic and oceanographic changes through time (e.g., Bailey et al., 2021; Hornbach, 2022).
The contourite on Vestnesa Ridge is deposited by the strong currents of the northward flowing West Spitsbergen Current (WSC) before entering the Arctic Ocean via the eastern Fram Strait (Figures 1A,B, 2A). The WSC is a continuation of the Norwegian Atlantic Current (NAC) comprising warm, saline Atlantic Water (AW) flowing between ∼50 and 600 m water depth (Figures 2A–D). The NAC originates from the North Atlantic Drift (derived from the Gulf Stream system) flowing northeastward across the North Atlantic and into the Nordic Seas. Below the AW cold Intermediate and Deep Waters generated by convection in the Nordic Seas flow northward into the Arctic Ocean (e.g., Aagaard et al., 1987; Hopkins, 1991; Schlichtholz and Houssais, 1999a; b; Fer et al., 2023) (Figures 2A–D). The intermediate water also overflows the Greenland-Scotland Ridge in the southern Nordic Seas and continues into the North Atlantic contributing to the North Atlantic Deep Water (NADW) and forms an important part of the Atlantic Meridional Ocean Circulation (AMOC) (Broecker et al., 1991) (Figure 2A).
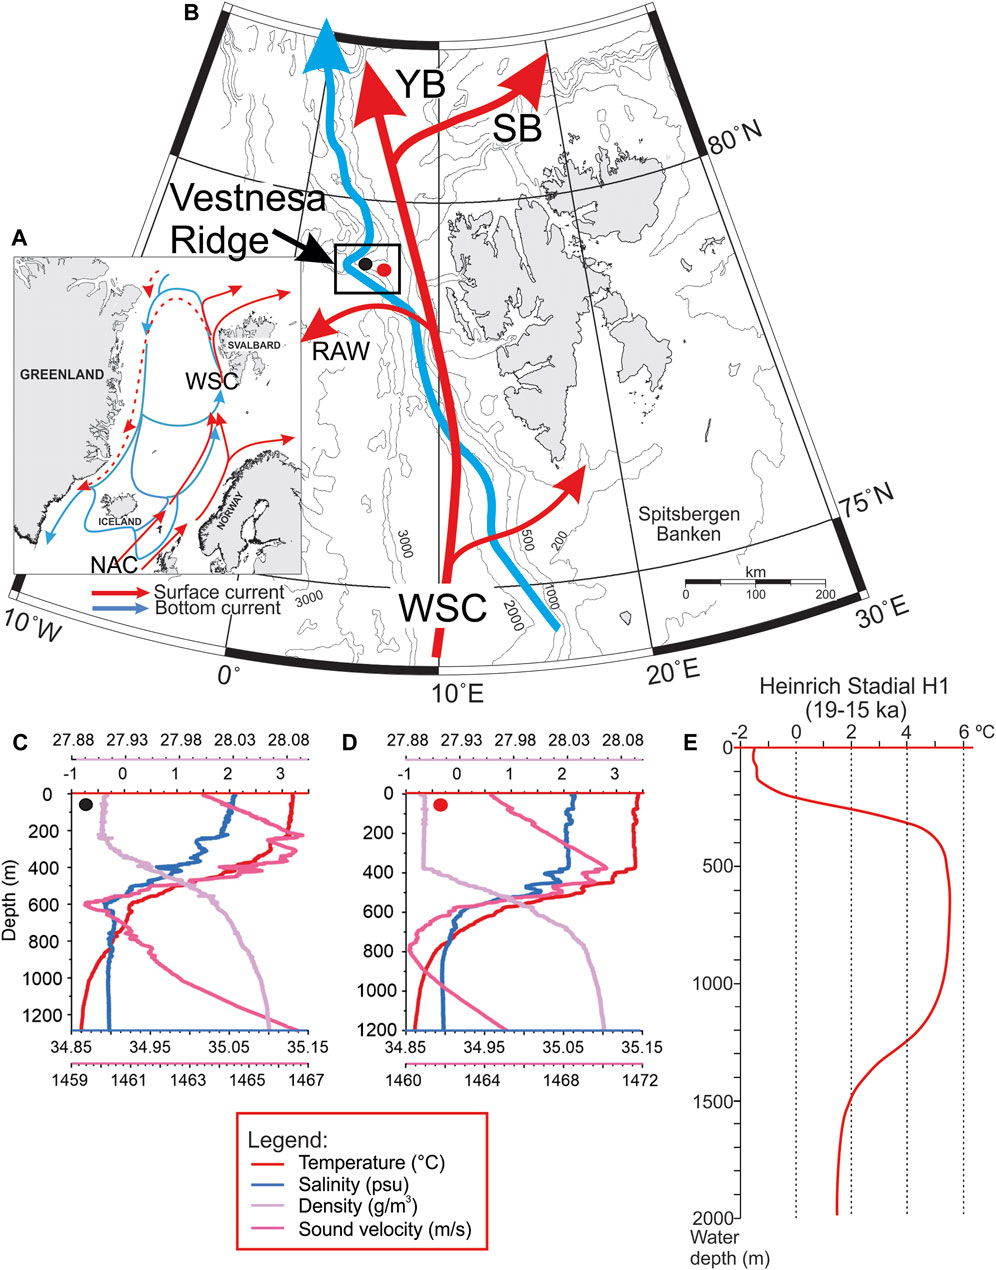
Figure 2. Map of major ocean currents, CTD stations, and paleo-CTD of present and past water mass characteristics. (A) Overview map of Nordic Seas with major surface (red arrows) and bottom water (blue arrows) currents indicated. (B) Detail of same parameters as in (A) for the western Svalbard margin and Vestnesa Ridge (black frame). CTD-sites for western (black dot) and eastern (red dot) pockmark areas are marked. Abbreviations: NAC; North Atlantic Current, WSC; West Spitsbergen Current, RAW; Return Atlantic Current, YB; Yermak Branch, SB; Svalbard Branch. Maps modified from Jessen and Rasmussen (2019). (C) CTD-station HH16-541CTD from western pockmark area showing temperature (°C), conductivity salinity, (psu), density (g/m3) and sound velocity (m/s). (D) Same parameters as in (C) for CTD-station HH16-548CTD from eastern pockmark area. See insert for legend. (E) Paleo-CTD showing temperature in the water column for Heinrich stadial H1. Modified from Rasmussen et al. (2007) and based on Mg/Ca bottom water temperature reconstructions for core HH15-1252PC from north of Vestnesa ridge El bani Altuna et al. (2021a).
During the last glacial period the northern hemisphere experienced profound millennial scale changes (termed Dansgaard-Oeschger (DO) events) of warm interstadials and cold stadials (Dansgaard et al., 1993). Particularly cold and long lasting stadials correlated with release of icebergs from continents and are termed Heinrich stadials (Bond et al., 1993). Abrupt atmospheric warmings of up to 8°C–16°C occurred over Greenland (e.g., Kindler et al., 2014). A total of 25 warming events took place during the Weichselian glaciation within the period ∼115–12 ka. Studies of paleoceanographic changes over the western and northwestern Svalbard margin and in the Nordic Seas have indicated profound changes in convection strength and water mass properties on DO time scales (e.g., Rasmussen and Thomsen, 2004; Rasmussen et al., 2007). During cold stadials convection slowed or stopped because of presence of the melting icebergs at the surface causing stratification of the upper water column (Figure 2E). The Atlantic Water continued its flow below the low-saline surface meltwater as an intermediate water mass and bottom water warmed up >5.5°C during the latest Heinrich Stadial H1 (19–15 ka) (Ezat et al., 2014; El bani Altuna et al., 2021a) (Figure 2E). During interstadials the Atlantic Water flowed again at the surface and strong convection resumed, briefly cooling the bottom water masses similar to today (Figures 2C,D).
The δ13C values in benthic and planktic foraminiferal shells reflect ventilation in the deep sea but also the presence of seepage of methane. Methane has very low δ13C values (<-60‰ for biogenic and ∼-40 to −50‰ for thermogenic gas (Whiticar, 1999)). Thus, low δ13C in foraminifera are taken as a sign of influence of methane (e.g., Wefer et al., 1994; Kenneth et al., 2003; Cook et al., 2011). However, it has been a matter of debate whether benthic foraminifera incorporate the low δ13C from methane, either through precipitation of their shells from porewater and/or metabolic processes (Smith et al., 2001; Torres et al., 2003; Mackensen et al., 2006; Martin et al., 2010; Wollenburg et al., 2015; Melaniuk et al., 2022a). Values as low as −6‰ in live benthic foraminifera have been reported from the Håkon Mosby Mud Volcano (Mackensen et al., 2006) and lately −5 to <-6‰ in live foraminifera from active seeps from eastern Vestnesa Ridge (Melaniuk et al., 2022a). In areas of low to moderate seepage as for example, in Siboglinid worm fields, the benthic foraminifera appear to be able to live and incorporate methane-derived 12C, while in areas of strong seepage with bacterial mats and low oxygen only dead specimens were found (Melaniuk et al., 2022a; b). After death of a foraminifera the shell can be covered by methane-derived authigenic carbonate from anaerobic oxidation of methane (AOM) (e.g., Boetius et al., 2000; Schneider et al., 2018 and references therein), which can lead to even lower measured values of <-20‰ to −10‰ (e.g., Martin et al., 2010). The precipitation of the authigenic carbonate occurs in the sulfate-methane transition zone (SMTZ) i.e., the transition zone of anaerobic oxidation of methane by archaea and sulfate-reducing bacteria, which depending on strength of seepage can be found at various depths in the sediments (e.g., Boetius et al., 2000). Under conditions of strong seepage, the precipitation occurs close to the sediment surface or at the surface and at high rates (e.g., Borowski et al., 1996; Melaniuk et al., 2022a). Under weak seepage, the formation of authigenic carbonates is slow and occurs deep in the sediment and can take thousands of years (e.g., Snyder et al., 2007).
Here we study the contourite sedimentation patterns and impact on seepage of methane on glacial, interglacial, and millennial DO time scales based on a suite of 43 sediment cores and a grid of shallow seismic lines (Figures 1, 3A). The cores are taken both at the crest and northern flank of Vestnesa Ridge, spanning a water depth of ∼1,200–1767 m covering both active pockmarks and sites without seepage of methane (Figure 1). The core study is primarily based on the distribution patterns in magnetic susceptibility, lithology, benthic and planktic δ18O and δ13C values, organic and inorganic carbon, and detailed AMS-14C datings. The shallow seismic lines are passing over or close to the core sites and covering crest and flanks of the ridge (Figure 3). The aim of the study is to correlate core records with a known stratigraphy to the seismic data to obtain a more comprehensive overview of the age of sediments on the ridge for a better understanding of the depositional patterns through time in relation to past climatic and oceanographic fluctuations and the effects on the strength of seepage of methane. The results are also compared and correlated with earlier published marine core records from the western and northern Svalbard margin.
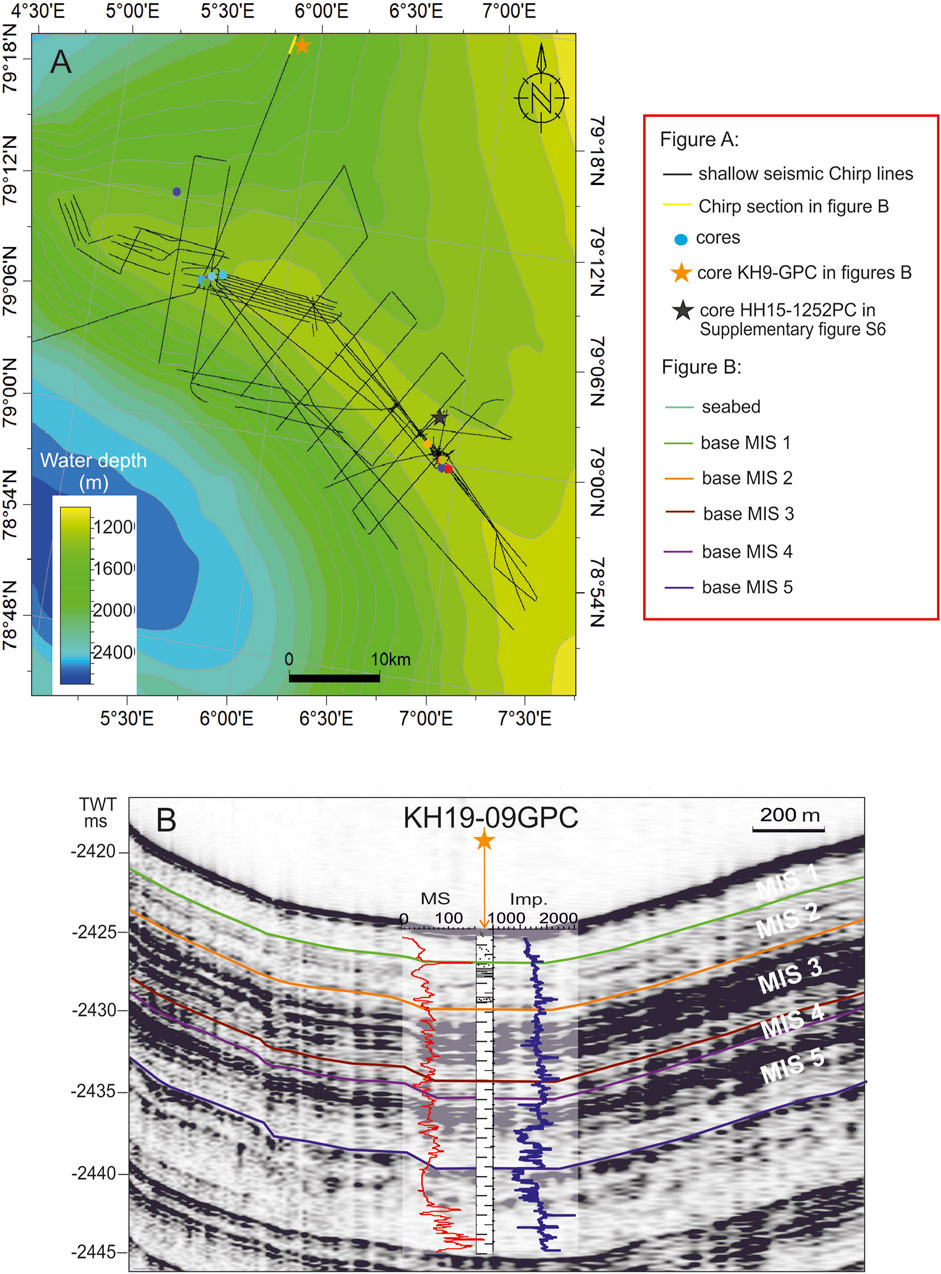
Figure 3. Database for shallow seismic interpretation. (A): Database of shallow seismic Chirp lines together with position of sediment cores used to tie marine isotope stage (MIS) boundaries to the seismic data. Bathymetry illustrating the outline of Vestnesa Ridge from IBCAO (Jakobsson et al., 2020). (B): Core-to-seismic tie of marine isotope stage (MIS) boundaries exemplified by core KH19-09GPC using the lithological log with marked MIS boundaries together with magnetic susceptibility (10−5 SI) and Impedance data from GEOTEK logging (Supplementary Figure S6, column C, D). An average sound velocity of 1,500 m/s is used for converting core data to time domain - see section 2.2 for additional information. See Figure 3A for location of core and Chirp line.
2 Material and methods
The study is built on a large database consisting of published and new data from sediment cores and 1,430 km of shallow seismic profiles, all acquired during six successive cruises to Vestnesa Ridge with R/V Helmer Hanssen (HH) in 2010 (then named R/V Jan Mayen (JM)), in 2012, 2015, 2016, 2017 and 2018 (Figure 1; Supplementary Table S1; see references to cruise reports in Supplementary Material). In addition, core KH19-09GPC is included and tied to the main study area on Vestnesa Ridge by shallow seismic line GAGE-19-3-KH-018 (Knies and Vadakkepuliyambatta, 2023).
2.1 Sediment cores
A total of 8 piston and 35 gravity cores are included in the study (Supplementary Table S1). Both active pockmarks from eastern Vestnesa Ridge and inactive/weakly active pockmarks from western Vestnesa Ridge, sites away from gas seepage fields but near the top of the ridge plus sites from the northern flank of the ridge were targeted (Figure 1). From eastern Vestnesa Ridge the most active and very heterogenous pockmark informally known as ‘Lomvi’ (Eng.: ‘Guillemot’) and the more ‘quiet’ and more homogenous pockmark ‘Lunde’ (Eng.: ‘Puffin’) with irregular seepage of gas (Bünz et al., 2012) were sampled along active pockmarks slightly further to the west (Figures 1B,D,E). The majority of cores were taken from ‘Lomvi’ in two distinct areas with four cores taken from a southern elevated part with hard carbonate pavement in some parts and with fine-grained deposits in other parts (Figure 1E). From the elevated area, core HH12-928PC sampled hard pavement and contained numerous chemosymbiotic bivalves encrusted by authigenic carbonates and little sediment (Sztybor and Rasmussen, 2017a; Thomsen et al., 2019). Several cores were taken in an area to the northeast comprising the deepest depression within the ‘pockmark (Figure 1E). Core HH12-929GC contained gas hydrates in the lower part (Sztybor and Rasmussen, 2017a) while two other cores taken from the same deep depression contained no gas hydrates (cores HH16-551GC and HH15-1241GC; 16 m and 38 m from site HH12-929GC) (Figure 1E). Nearby piston cores HH15-1253PC and HH15-1254PC, distanced 0.11 m and 29 m from site HH12-929GC, respectively had hit large chunks of gas hydrate probably preventing deeper penetration (Figure 1E; Supplementary Figure S1I,J). Core HH17-843GC from the same depression also hit gas hydrates (Figure 1E). Four cores from ‘Lunde’ pockmark were all taken near the edge of the pockmark in a relatively smooth area with no apparent disturbances (Figure 1D). Cores taken in active pockmarks further to the west contained large chunks of gas hydrates (Figure 1B; see references to cruise reports in Supplementary Material). The latter cores were logged onboard for magnetic susceptibility, but not opened (Supplementary Table S1; Supplementary Figure S1A–C,D–G). Three cores were taken away from the active pockmarks (JM10-333GC, HH15-1242GC and HH16-547GC) (Figure 1B; Supplementary Table S1). Cores from the inactive western Vestnesa pockmark field were taken in two different pockmarks (Figure 1C; Supplementary Table S1). In the northern sites three cores were taken from inside the pockmark (JM10-330GC, HH12-940PC, and HH16-550GC) and three taken outside, with two cores taken in the southern elongated pockmark (JM10-331GC and HH17-839GC) and one core HH17-840GC from outside of the pockmark.
The 14.81 m long giant piston (‘Calypso’) core KH19-09GPC was taken with RV Kronprins Haakon (KH) north of Vestnesa Ridge in 2019 (Supplementary Table S1). Several of the core records from Vestnesa Ridge have been previously published and is included, all with detailed stratigraphy from stable isotope-, grain size- (including counts of ice rafted debris (IRD)), foraminiferal faunal records and AMS-14C datings (Supplementary Table S1). Published records from the western Svalbard margin are also included for comparison (Figure 1A; Supplementary Table S1).
Most cores were logged with a GEOTEK 7.9 Multi Sensor Core Logger at UiT the Arctic University of Norway before opening i.e., split in two-halves by cutting along the liners. Magnetic susceptibility (MS) was measured with a mounted loop sensor for 10 s in 1-cm steps along with wet bulk density, impedance, and P-wave velocity. Subsequently the cores were X-rayed on a GEOTEK Standard X-ray CT System. Not all cores were split, in particular cores that hit chunks of gas hydrates and were considered too disturbed, and some cores taken in 2017 and 2018 that were sampled for porewater onboard. Some split cores sampled for porewater were instead logged with GEOTEK for point-sensor magnetic susceptibility and color spectrophotometry. Also, split cores taken in 2016 and later were color imaged with a Jai L-107CC 3 CCD RGB line scan camera installed on an Avaatech XRF core scanner. All split cores were visually described, and color determined with a Munsell chart. Most cores were sampled by cutting the sediment into 1-cm thick slices. These were wet weighed, freeze dried and weighed again for water content. Samples were chosen from various intervals (from every 1 cm, 2.5 cm, or 5 cm intervals) according to lithology. Samples were sieved over sieves with mesh-sizes 0.063, 0.1 and 0.5 mm.
Selected cores taken in 2016, 2017 and 2018 were drilled for porewater sampling with holes of 2.5 cm diameter at either 10 or 20 cm intervals. After porewater extraction (10 mL) the cores were sampled with 20-mL syringes through the drilled holes for measurements of various parameters; here %TOC (total organic carbon) and %CaCO3, grain size distributions and stable isotopes (δ18O and δ13C).
Total carbon (TC) and total organic carbon (TOC) were measured in freeze dried samples in 10 or 20 cm intervals. Powdered bulk samples of 2–3 g each were measured using a Leco CS-200 induction furnace instrument. The weight percentages of TC and TOC were calculated and the %CaCO3 was calculated using the equation of Espitalié et al. (1977).
The δ18O and δ13C values were measured in 10–20 specimens of the planktic foraminiferal species Neogloboquadrina pachyderma and/or benthic foraminiferal species Cibicidoides wuellerstorfi (two to five specimens), and/or Melonis barleeanus, (5–10 specimens) and/or Cassidulina neoteretis (20–30 specimens). The samples were analyzed on a ThermoScientific Gasbench II, MAT253 IRMS at the Department of Geosciences, UiT the Arctic University of Norway, Tromsø, Norway with a precision of the instrument of <0.1‰ on both δ18O and δ13C. The results are reported on the VPDB (Vienna Pee Dee Belemnite) scale relative to NBS-18, NBS-19 and LSVEC.
New Accelerator Mass Spectrometry (AMS) 14C datings for this study were performed at the 14Chrono Centre, Queen’s University, Belfast, Northern Ireland, United Kingdom (Table 1). Samples of the planktic foraminiferal species N. pachyderma and bivalves were dated (Table 1). To be comparable to the previously published dates, the new 14C dates for this study were calibrated using the Calib 7.04, Marine13 program (Reimer et al., 2013) with a reservoir age correction of −405 years and 1-σ error.
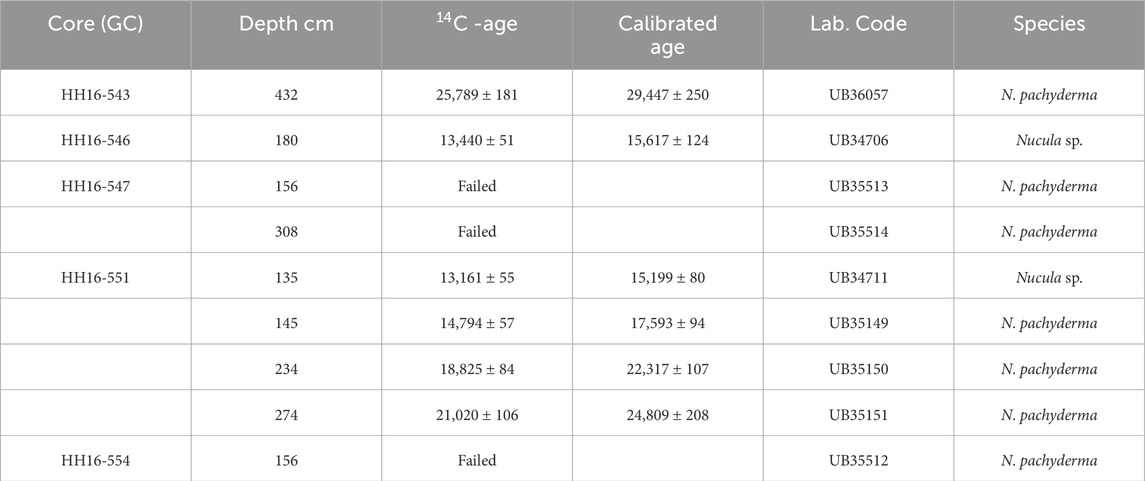
Table 1. AMS-14C dates and calibrated ages for cores from Vestnesa Ridge.
2.2 Shallow seismic data
A hull-mounted EdgeTech 3300-HM chirp sonar (‘Chirp‘) with a frequency range of 2–16 kHz was used to collect high-resolution seismic profiles. Pulse mode and shot rate were varied, depending on the water depth and weather conditions. The maximum penetration of the Chirp data in the study area is ∼60–70 ms two-way-time (TWT). A total of 1,430 km lines was used in the study. The Chirp data were stored in segy format and loaded onto a Petrel@ interpretation workstation in time domain (Figure 3A).
The seismic interpretation and stratigraphic breakdown of the contourite depositional system was based on identification of seismic horizons tying to marine isotope stage (MIS) boundaries defined in the sediment cores (Figures 3B,C). Only cores taken outside of pockmarks were included. The longest core KH19-09PGC was tied to the contourite system using seismic line CAGE-19-3-KH-018 (Knies and Vadakkepuliyambatta, 2023) (Figures 3A,B). To tie the metric core records to the time records of the Chirp data, the core records were converted to time using an average seismic velocity of 1,500 m/s, which was found suitable based on the sediment content and GEOTEK measurements (Magnetic susceptibility, wet bulk density, P-wave velocity and impedance; Supplementary Figure S6). The same average seismic velocity for the upper sediment column at Vestnesa Ridge was observed by other studies (e.g., Plaza-Faverola et al., 2023). CTD measurements have shown that sound velocity in the water column is on average 1,465 m/s in our study area (Figures 2A,C,D).
Isochore maps of the individual MIS units were created by subtracting their corresponding upper and lower bounding reflectors in time domain and subsequently converted to metric scale using an average seismic velocity of 1,500 m/s. This velocity may be a little too high in areas with some free gas content or a little too low for areas with a patchy content of gas hydrate. However, dealing with the shallow sediment column, these minor variations will not significantly change the greater perspective of erosional and depositional areas which the main purpose of the mapping. The maps were produced using the Convergent interpolation algorithm with input data as boundary and grid increment set to 1,200.
3 Results
3.1 Sediment cores
3.1.1 Correlation to the general stratigraphy of the Svalbard margin
The stratigraphy of cores is based primarily on patterns of variability in magnetic susceptibility (MS) values in combination with lithology, sediment color, grain size, δ18O, %TOC, %CaCO3 and AMS 14C dates and by correlation to the magnetic susceptibility stack of Jessen et al. (2010) that are based on 11 cores from the western Svalbard margin. The pattern of variation in MS values is linked to characteristic sediment marker horizons: a dark grey-brown, coarse, unsorted layer of low magnetic susceptibility dating ∼24 ka (marked by a brown bar in Figures 4–6; Supplementary Figure S2–S5), a dark bluish-grey laminated clay deposit also of low magnetic susceptibility dating ∼15 ka (grey bar). A diatom layer deposited in the lower Holocene dates ∼10 ka (Jessen et al., 2010) (yellow bar).
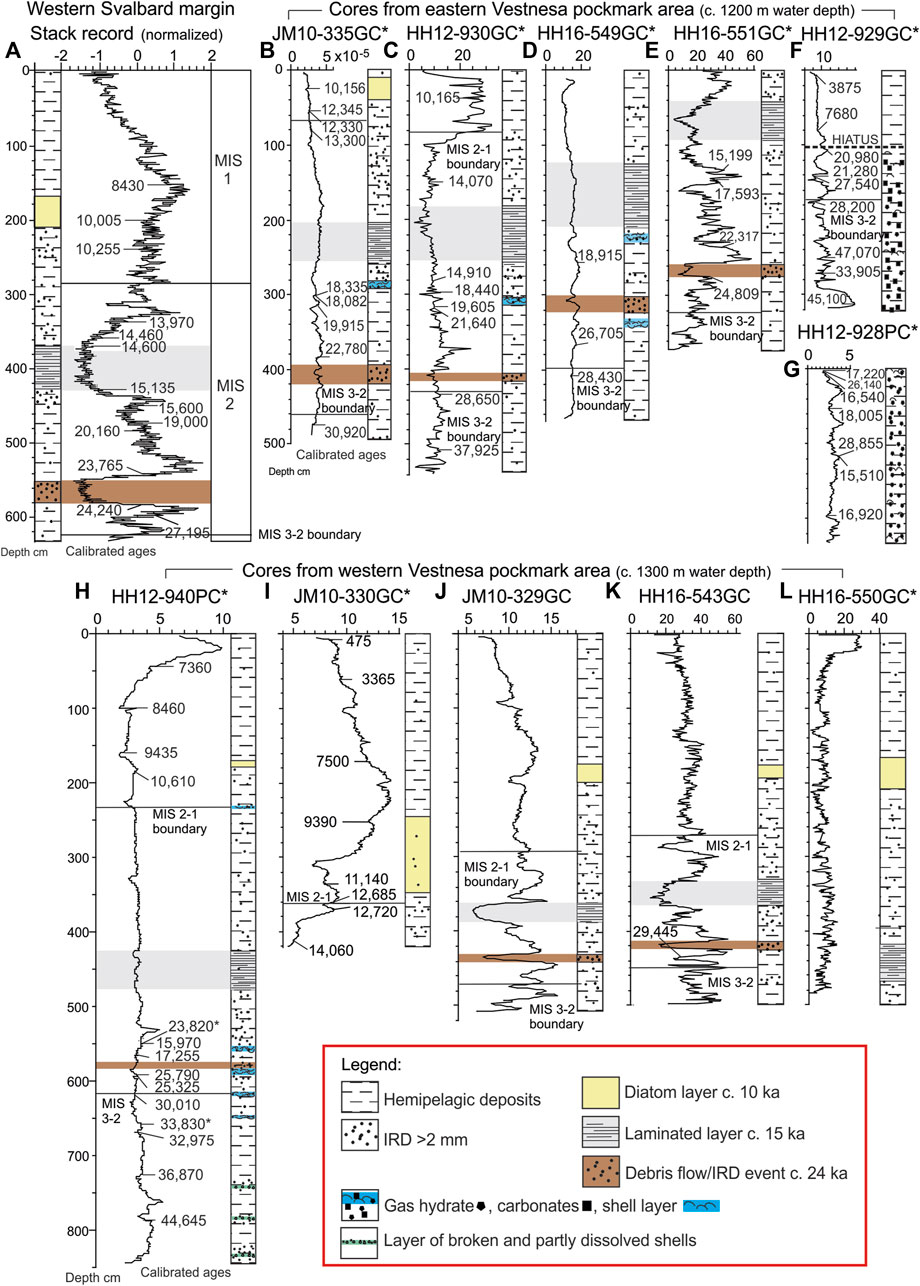
Figure 4. Magnetic susceptibility (10−5 SI) and lithological logs with marine isotope stage (MIS) boundaries marked. (A) Stack records of magnetic susceptibility for the western Svalbard margin from Jessen et al. (2010). (B–G). Cores from the eastern active pockmark area. (H–L): Cores from the western inactive pockmark area. See insert for legend. AMS-14C dates are indicated; see also Table 1 for new dates for this study. Abbreviations: IRD; ice rafted debris. Asterisks mark cores taken from within pockmarks. See also Supplementary Table S1 for details and references to previously published records.
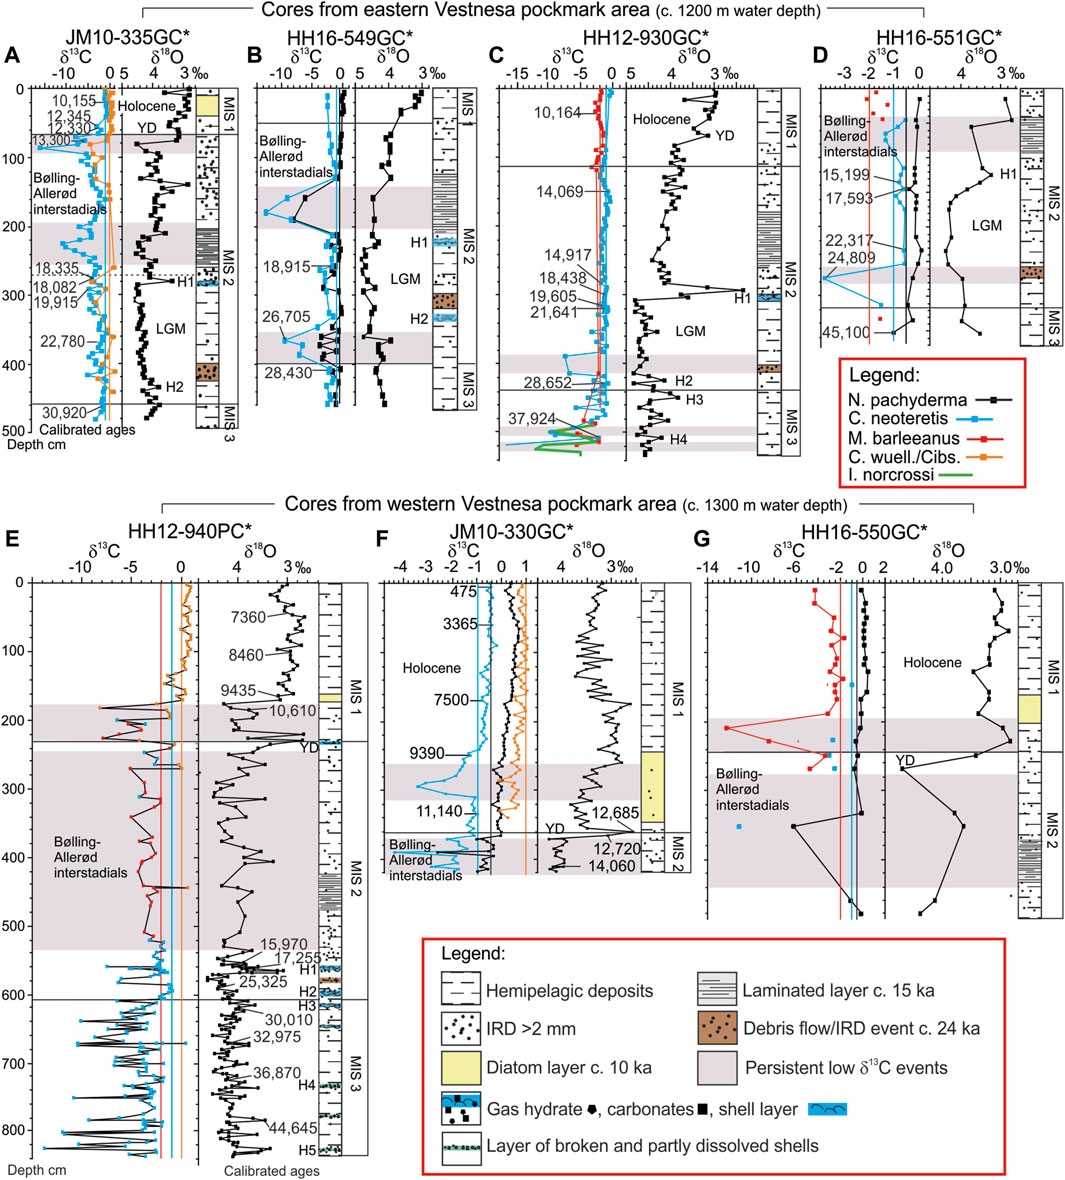
Figure 5. Stable isotope records (‰) (δ13C and δ18O) for cores from the eastern active (A–D) and western inactive (E–G) pockmark areas along lithological logs. Purplish bars mark event of low δ13C mainly focusing on MIS 2 and MIS 1. Vertical colored lines mark average minimum glacial δ13C values of the measured benthic and planktic foraminiferal species. See insert for legend. AMS-14C dates are indicated. Marine isotope stage (MIS) boundaries are marked, and specific stratigraphic horizons indicated (LGM; last glacial maximum, Heinrich stadials; H1–H5, Bølling and Allerød interstadials, YD; Younger Dryas, and Holocene. Abbreviations: IRD; ice rafted debris, C. wuell.; Cibicidoides wuellerstorfi, Cibs.; Cibicides lobatulus. Asterisks mark cores taken from within pockmarks. See also Supplementary Table S1 for details and references to previously published records.
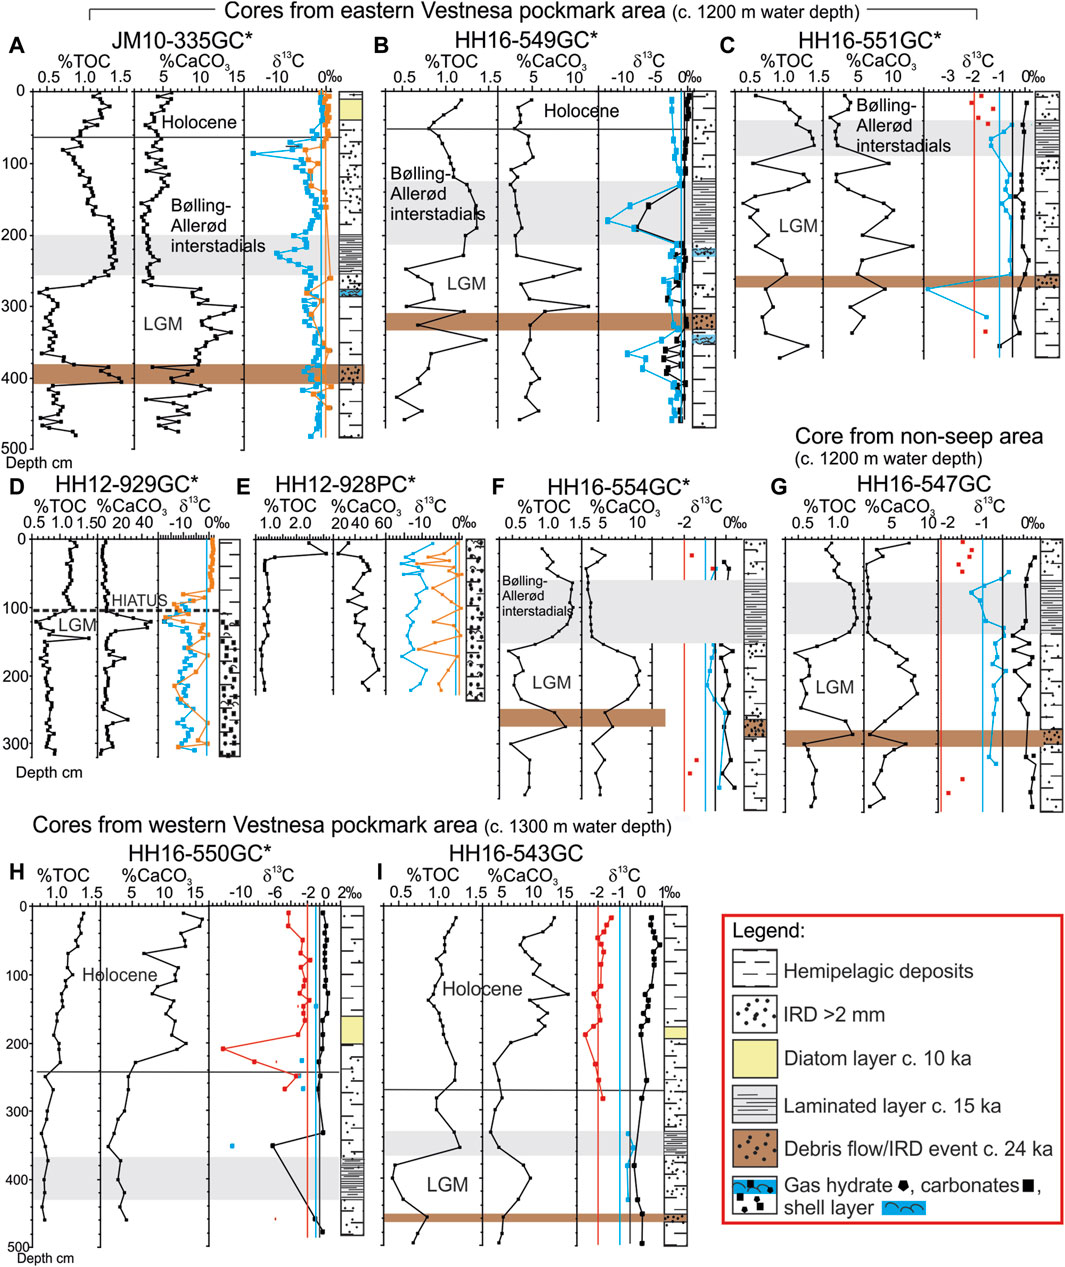
Figure 6. Percent total organic carbon (%TOC), percent calcium carbonate (%CaCO3), and δ13C (‰) for cores from the eastern active (A–G) and western inactive (H, I) pockmark areas along lithological logs. See insert for legend. Holocene, Bølling and Allerød interstadials, and LGM (last glacial maximum) are marked where present. Asterisks mark cores taken from within pockmarks. Abbreviations: IRD; ice rafted debris. See also Supplementary Table S1 for details and references to previously published records.
The MS stratigraphy and age model of Jessen et al. (2010) cover the last 30 ka (Figure 4A). The stratigraphy has since been extended into MIS 4 (Rasmussen et al., 2014; Jessen and Rasmussen, 2015; El bani Altuna et al., 2021a) and through MIS 5 into MIS 6 (Michel et al., 1999; Risebrobakken et al., 2005). Most cores from western Vestnesa Ridge only reach into late MIS 3 (Figures 4I–L) while cores from off the crest and eastern Vestnesa Ridge reach into early or mid-MIS 3 or MIS 4 (Figures 4B–F; Supplementary Figure S2D). Only one record, the giant piston core KH19-09GPC reach into MIS 6 (Supplementary Figure S2E).
Deposits of MIS 6 (>130 ka) are predominantly of dark grey color, while MIS 5, MIS 4 and MIS 3 130–75 ka (75–60 ka, and 60–29 ka, respectively) are composed of layers of light greyish sediment and darker grey layers with a varying content of IRD and highly variable MS and δ18O values reflecting the DO millennial scale events (Michel et al., 1999; Rasmussen et al., 2014; Jessen and Rasmussen, 2015; 2019; Caricchi et al., 2019) (Figures 5A,C,E). The sediments of MIS 2 (28–12 ka) has layers of both light grey, and dark grey color. The last glacial maximum (LGM) is defined as the period of maximum oxygen isotope values dating 24–19 ka (Lisiecki and Raymo, 2005) (Figure 5; Supplementary Figure S4). The start of the LGM is marked by the coarse dark grey-brown layer.
The Heinrich stadial H1 of the early deglaciation on the western and northwestern Svalbard margin is generally marked by a thin light-grey horizon dating ∼19–15 ka and is characterized by very low sedimentation rates and a characteristic spike of low δ18O values (e.g., Birgel and Hass, 2004; Jessen et al., 2010; Jessen and Rasmussen, 2019) (Figure 5; Supplementary Figure S4). The Bølling interstadial of the deglaciation (∼15–14 ka) is marked by the dark-grey, bluish laminated layer of low MS seen in all records (Figures 4–6; Supplementary Figure S2–S5). The sediments of the following Allerød interstadial 14–13 ka contain a high concentration of IRD, while the Younger Dryas stadial (13–12 (11.7) ka) appears as a light grey layer with low δ18O (Figure 5A, C–G).
The Holocene interglacial is characterized by light brownish sediments. The cores show a typical Holocene MS signal of slowly increasing values to a peak dating ∼8.2 ka followed by gradually decreasing values (Jessen et al., 2010) (Figure 4A, H–K). The δ18O values are low characteristic for interglacial conditions (Figures 5A–C, E–G; Supplementary Figure S5C,F,G). The diatomite of whitish or yellowish color deposited at ∼10 ka in the early Holocene is present in most records from western Vestnesa Ridge areas, but has only been observed in a few cores from the eastern part as Holocene deposits are either thin or lacking here (Sztybor and Rasmussen, 2017a; b; Thomsen et al., 2019; El bani Altuna et al., 2021a) (Figures 4, 7; Supplementary Figure S2, S3).
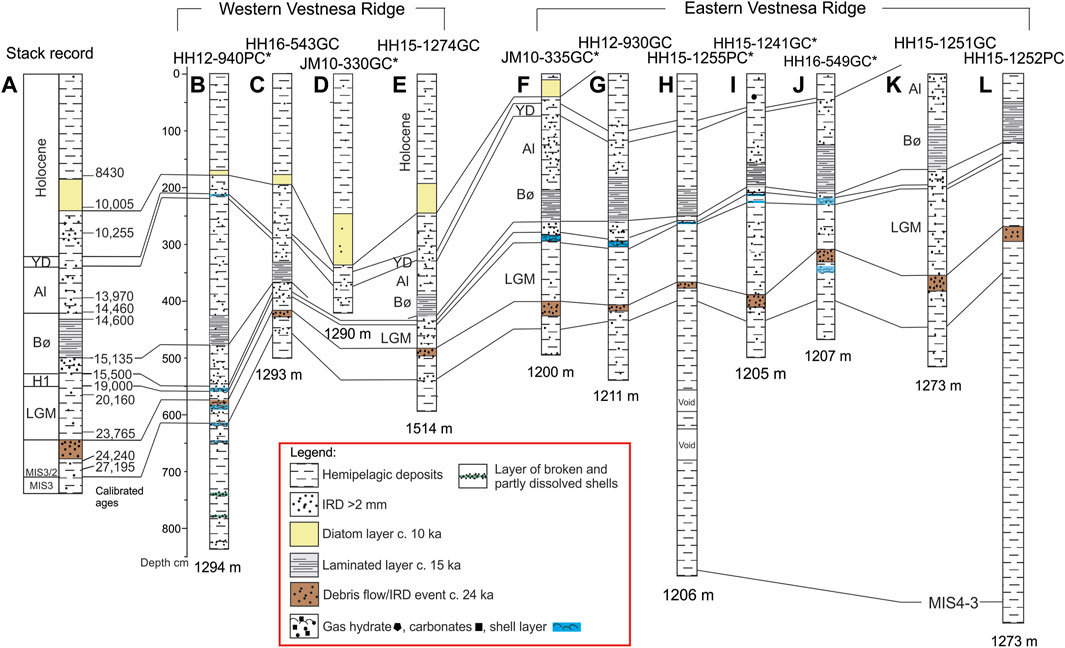
Figure 7. Correlation between the stack lithological record (A) with selected core records from western (B–E) to eastern Vestnesa Ridge (F–J) and to cores north of eastern Vestnesa Ridge (K, L). The stack record from the western Svalbard margin in (A) is modified from Jessen et al. (2010). See insert for legend. The sediments dating from the last glacial maximum (LGM) thickens, while Holocene sediments thins and disappears towards the east. In general (with the exception of (B)), the Bølling and Allerød (abbreviated Bø, Al) thickens towards east. Other abbreviations: H1; Heinrich stadial 1, YD; Younger Dryas stadial, IRD; ice rafted debris. Water depths are marked below each core record.
3.1.2 Magnetic susceptibility patterns in pockmark records
Several cores from within pockmarks on Vestnesa Ridge has low, and sometimes nearly constant MS values (Figure 4; Supplementary Figure S1, S3). This is due to disturbance by strong seepage of methane or presence of gas hydrates (e.g., Novosel et al., 2005). However, in most cases the records display an undisturbed lithology (e.g., Myrvang, 2015; Sztybor and Rasmussen, 2017a; Åsheim, 2017; Matteis, 2018; Hansen et al., 2020) (Figure 4; Supplementary Figure S2, S3). Other cores from pockmarks can show the typical pattern and values of MS as found elsewhere on the western and northern Svalbard margin (e.g., Elverhøi et al., 1995; Knies et al., 1999; Birgel and Hass, 2004; Jessen et al., 2010; Chauhan et al., 2016a) (Figure 4E; Supplementary Figure S3B). Note that some records with low MS values but plotted on an expanded x-axis scale in fact do display the typical MS pattern (Figures 4I,J; Supplementary Figure S3A,C,F–H).
3.1.3 Distribution of %TOC and %CaCO3 and correlation to known stratigraphy
Cores from Vestnesa Ridge and outside of pockmark areas and published cores JM10-335GC, JM10-333GC (Sztybor, 2016), HH16-549GC (Åsheim, 2017), and cores from 2016 with a known stratigraphy from oxygen isotopes and/or AMS-14C dates, all show a clear correlation between %TOC and %CaCO3 data with lithology (Figures 6A–C, F–H; Supplementary Figure S5C). The coarse unsorted dark layer and the laminated horizon show high %TOC and low %CaCO3, while the LGM have low %TOC and high %CaCO3. Some cores show some deviating peaks in % CaCO3 (Figures 6D,E; Supplementary Figure S5D,F).
The same pattern in distribution of %TOC and %CaCO3 is seen in cores from the inactive western pockmark sites (Figures 6G,H; Supplementary Figure S5G, H). Here, the Holocene sediments show high %TOC >1%, and high %CaCO3 >10%. Four cores sampled for pore water, %TOC and %CaCO3 and presumably containing gas hydrates were not logged for magnetic susceptibility or opened for description. Based on the %TOC and %CaCO3 records the stratigraphic marker horizons and Holocene deposits could be identified for three of the cores (Supplementary Figure S5A, B, F).
3.1.4 Variations in benthic δ13C values
The δ13C records show generally high δ13C values in cores taken outside of pockmarks and highly variable values in records from inside of pockmarks. In environments unaffected by methane seepage δ13C values in the species measured in this study range −2 to 0‰ for the infaunal benthic foraminiferal species M. barleeanus and C. neoteretis on glacial and interglacial time scale (McCorkle et al., 1990; El bani Altuna et al., 2021a) and 0 to >+1‰ for the epifaunal species C. wuellerstorfi (e.g., McCorkle et al., 1990; 1997). In cores taken from pockmarks many have intervals of values <-10‰ (Figures 5A–C,E,G; Supplementary Figure S4C–E), a sign that the measured foraminiferal specimens have had coatings with authigenic carbonate, although not visible in the binocular microscope. Other cores have slightly lower δ13C than the typical range of the species (Figures 5D,F; Supplementary Figure S4A,B,E). The low δ13C intervals correlate with the glacial period and the deglaciation with peak low values in the Bølling and Allerød interstadials and lower Holocene until ∼10–9 ka (Figures 5A,B, D–G; Supplementary Figure S4A–C,E).
3.2 Depositional patterns and sedimentation rates
3.2.1 Eastern Vestnesa Ridge, ∼1,200 m water depth, ∼60–14 (10) ka
Cores taken on the crest outside of pockmarks on eastern Vestnesa Ridge contain no Holocene sediments but show a coarse sandy, gravelly lag deposit at the top dating ∼14 ka right below the sediment surface (Sztybor and Rasmussen, 2017a) (Supplementary Figure S2C,D,F–I). The cores taken from inside of pockmarks at the very active pockmark field of seepage of methane at ∼1,200 m water depth (Figures 1B,D,E) cover MIS 4–2, ∼60–14 ka (except for some cores that may contain sediments of lower Holocene age dating <10 ka near the core top) (Figures 4B–G, Figure 5A–C). Sediments dating from the LGM (not including the coarse dark deposit dating ∼24 ka) are around 1–2 m thick, giving an average sedimentation rate for the period 24–19 ka of 23 cm/ka (range 19–34 cm/ka) (Table 2). Sediments from the deglaciation including the laminated horizon are thick with an average sedimentation rate of 91 cm/ka (range 38–140 cm/ka) (ignoring H1 of very low sedimentation rates of average ∼3 cm/ka (range 1.6–4.4 cm/ka)) (Table 2). Thus, in most cores from ∼1,200 m water depth, the laminated layer occurs close to the seafloor at about 20–100 cm down core depending on presence of sediments dating from the Early Holocene (Figures 4B,C,F). The longest record core HH15-1255PC reaches back to ∼60 ka and has an average depositional rate for MIS 3 of ∼10 cm/ka with variable MS values indicating millennial scale oscillations (Matteis, 2018) (Supplementary Figure S3F).
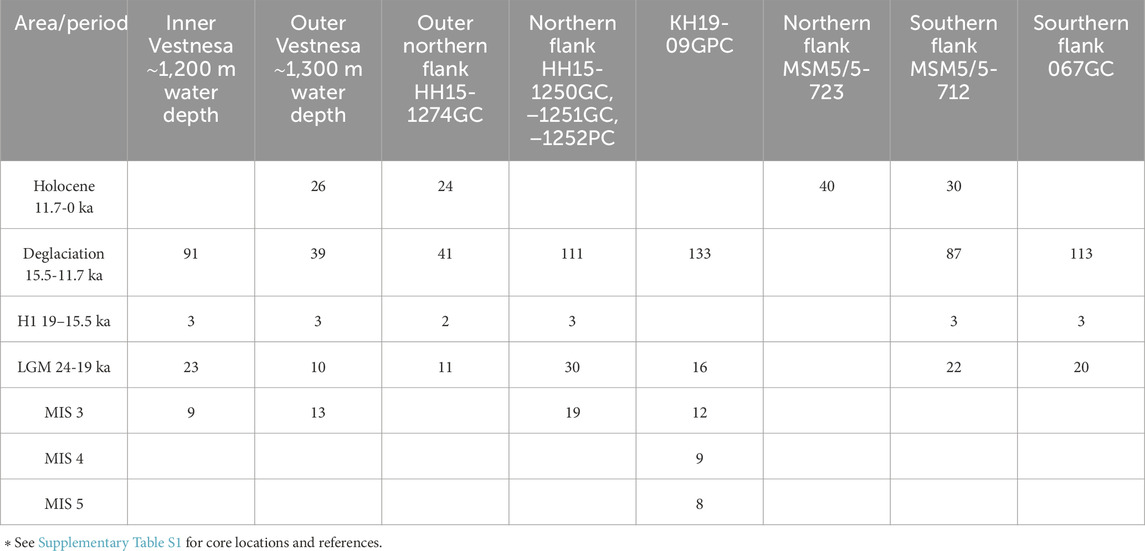
Table 2. Average sedimentation rates for Vestnesa Ridge core records in cm/ka*.
3.2.2 Southern flank of Vestnesa Ridge
The southern ridge flank is relatively steep and affected by faulting and slumping, but not affected by seepage of gas and represented by cores 067GC and MSM5/5-712 (Figure 1A; Supplementary Table S1). These cores show the same characteristic MS signal for the time interval 30–14 ka (Howe et al., 2008; Zamelczyk et al., 2014). The shallow core 067 is very similar to the records from the eastern pockmark area with no Holocene and dating approximately 14 ka at the top. The record has similarly high sedimentation rates of 113 cm/ka for the deglaciation and 20 cm/ka for the LGM interval (Table 2). Core MSM5/5-712 (Müller et al., 2012; Zamelczyk et al., 2014; Falardeau et al., 2018; 2019) has 3.5 m of Holocene sediments (average Holocene sedimentation rates ∼30 cm/ka), deglaciation ∼87 cm/ka and 22 cm/ka for the LGM (Table 2).
3.2.3 Western Vestnesa Ridge pockmark area, ∼1,300 m water depth
We note that both the coarse dark, grey-brown layer and the laminated layer are thinner than in the records from eastern Vestnesa Ridge (Figures 4, 7; Supplementary Figure S3). The deposits dating from the LGM are also much thinner. The average sedimentation rates for the LGM are thus 10 cm/ka (range 2–22 cm/ka) at 1,300 m water depth compared to 23 cm/ka at ∼1,200 m water depth (Table 2). The sedimentation rates for the deglaciation (ignoring H1; see Table 2) are also lower than at eastern Vestnesa Ridge and is of 39 cm/ka (range 22–86 cm/ka) compared to almost 1 m/ka on the inner part at 1,200 m water depth.
In contrast to the records from the eastern part, western records show presence of >2.5 to >3 m thick Holocene deposits (Figures 4H–L, 7; Supplementary Figure S3G–J). The well-dated record of core JM10-330GC (Consolaro et al., 2015) confirms that the entire Holocene probably is preserved in all records except core HH12-940PC. The diatomite is prominent and located ∼2 m to >3 m below the seafloor. The Holocene sediments at western Vestnesa Ridge are generally deposited at high average sedimentation rates of 26 cm/ka (range 19–32 cm/ka) (Table 2).
The longest record HH12-940PC dates ∼50 ka at the bottom (calculated by extrapolation from the two lowermost dates in the core; Figure 4H). Thus, the average sedimentation rate for the mid-late MIS 3 at 28–50 ka is calculated to ∼13 cm/ka (Table 2).
3.2.4 Northern flank of Vestnesa Ridge, 0–>150 ka
Cores HH15-1250GC, HH15-1251GC and HH15-1252PC are all taken on the northern flank of Vestnesa Ridge off the active pockmarks at the eastern part of the ridge (Figure 1A; Supplementary Figure S2C,D,H; Supplementary Table S1). They are taken at similar water depths (1,265 m, 1,273 m, and 1,273 m, respectively). All three cores possess the typical lithological features and patterns of MS and shows a lag deposit at the core top dating ∼14 ka and thus no Holocene deposits as for records on the eastern crest of the ridge. The average sedimentation rate for the LGM in the three records is 30 cm/ka (Table 2). In core HH15-1252PC which reach into MIS 4 (El bani Altuna et al., 2021a) (Figure 7L; Supplementary Figure S2D), the average sedimentation rate for MIS 3 is 19 cm/ka, the highest so far compared to sedimentation rates on the crest of the ridge.
Core HH15-1274GC taken on the northern flank of western Vestnesa Ridge at 1,514 m water depth is very comparable to the cores from the western crest of Vestnesa with ∼3 m of sediments of Holocene age (Figure 7E; Supplementary Figure S2B). For this site the average sedimentation rate is 24 cm/ka for the Holocene, 41 cm/ka for the deglaciation and 11 cm/ka for the LGM (Table 2). Core MSM5/5-723 from 1,350 m water depth shows >4 m of Holocene sediments with an average sedimentation rate exceeding 40 cm/ka (Werner et al., 2015) (Figure 1A).
Giant piston core KH19-09GPC of high resolution from 1767 m water depth north of Vestnesa Ridge and north of site HH15-1274GC shows an MS pattern with the characteristic intervals of low values marking the laminated and coarse grey-brown horizons and indicating that ∼1 m of Holocene sediments is present at this location (Supplementary Figure S2E). From comparison and correlation with the MS records of cores MD99-2303 and MD99-2304 from the western Svalbard margin (Michel et al., 1999) and age models by Risebrobakken et al. (2005), it becomes evident that core KH19-09GPC probably reach well into MIS 6 and possibly MIS 7 at the bottom dating >150 ka. In core KH19-09GPC, MIS 3 has an average sedimentation rate of 12 cm/ka; low rates deeper in the core are probably due to some level of compaction (Table 2).
3.3 Shallow seismic mapping
A gross breakdown of Vestnesa Ridge into three large seismic units (YP-1, YP-2 and YP-3 from below) was first described by Eiken and Hinz (1993). Subsequently, the youngest YP-3 unit has been dated to span the last ∼2.7 Ma (e.g., Mattingsdal et al., 2014). The shallow penetrating Chirp data cover the uppermost and youngest sub-units of the YP-3 unit.
The reflection patterns of the Chirp lines show strong parallel to sub-parallel reflections occurring as stacked, close-lying reflectors separated by sections with no or only faint internal reflectors as illustrated in Supplementary Figure S3B. This reflection pattern is seen throughout most of the study area apart from the lower southern ridge flank where it become dense and tapes out to below the Chirp data resolution, and where also faults and slides displace or destroy the reflections. Passing over pockmarks, the overall reflection patterns is also disturbed and often bended downwards. At some places the bended reflectors can be traced underneath the pockmark, at other places the reflection patterns are strongly disturbed or completely wiped out. The latter phenomenon is most pronounced in the eastern pockmark area. The stratigraphic breakdown of the Chirp data into MIS units are illustrated by the ties to core KH19-09GPC in Figure 3B and creation of isochore maps (Figures 8B–F). The isochore map of MIS 1 (Figure 8B) shows a marked depocenter up to 4 m thick on the northwestern Vestnesa Ridge at 1,300–1,600 m present water depth and displays an overall absence of the MIS 1 unit on the eastern crest and flanks, as well as a thinning of the unit to below seismic resolution approximately halfway down the southwestern ridge flank where also faulting and sliding prevent further downslope interpretation.
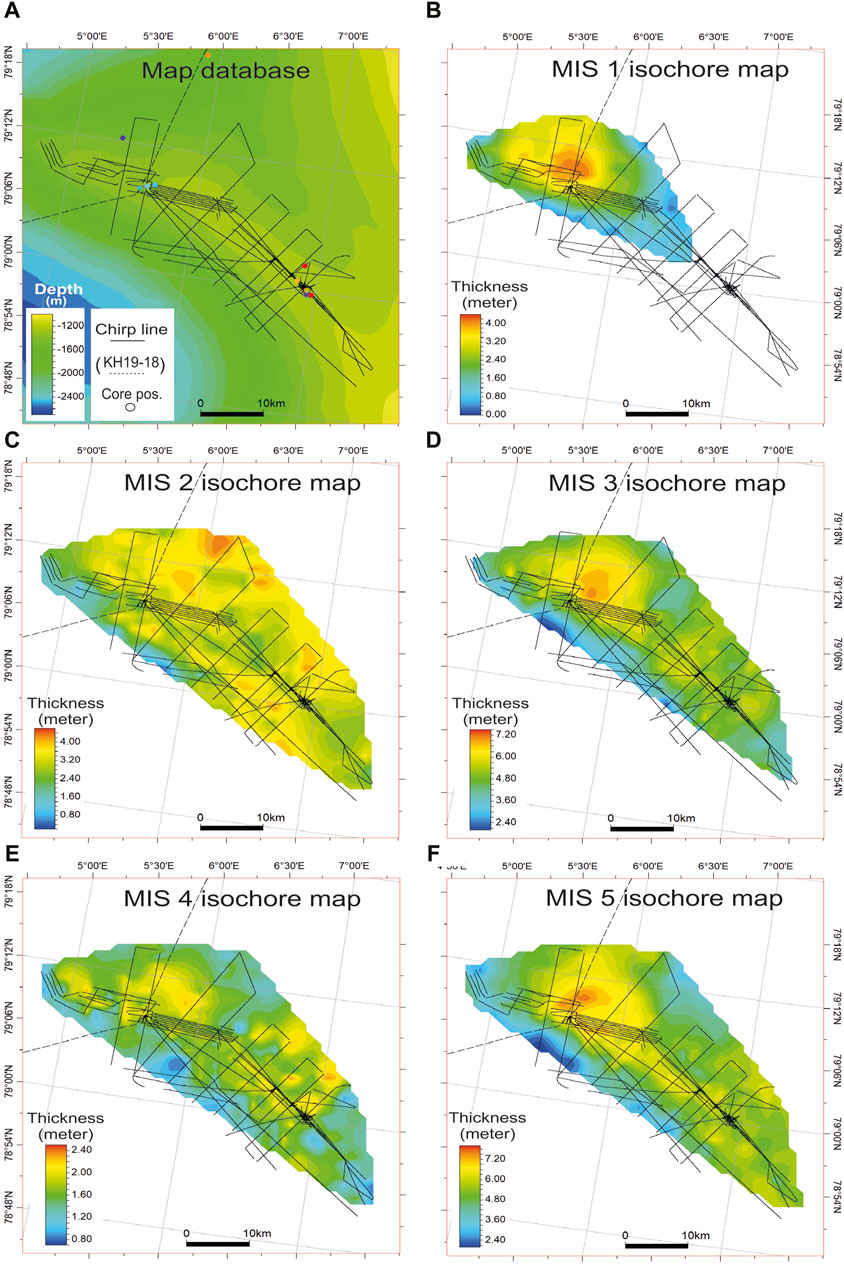
Figure 8. Seismic isochore maps of marine isotope stage (MIS) units 1 to 5. (A): Database of shallow seismic Chip lines (black lines) and location of sediment cores (various colored dots) used for creation of the various marine isotope stage (MIS) isochore maps. (B–F): Isochore maps (in meters) illustrating the thickness of MIS units 1 to 5 (see section 2.2 for details on construction of the maps). Note the color ranges are scaled to sediment thickness for each map.
The MIS 2 unit was mapped throughout the study area (Figure 8C). The isochore map of this unit demonstrates a somewhat chaotic distribution of the up to 3–4 m thick sediment column with no clear depocenter, yet with some thinning of the unit at the lower southwestern ridge flank. Also, some thinning is seen in places along the ridge crest which, however, could be connected to presence of pockmark fields.
More than 6 m of sediments has been deposited during MIS 3 as illustrated in Figure 8D. This unit is also mapped throughout the study area and shows a clear depocenter within the same area, yet a little further east compared to the MIS 1 depocenter. But in contrast to MIS 1, deposition during MIS 3 also took place along the ridge crest and northeastern ridge flank, while the sediment thickness thins to ∼2 m at the lower southwestern ridge flank. This deposition pattern is taken as evidence of the action of a current flowing northward following the depth contours of Vestnesa Ridge, and with a current core lying close to the then ridge crest.
The MIS 4 isochore map (Figure 8E) reveals that sediments deposited during this period are relatively thin and amounts to little more than 2 m. The depositional pattern across the ridge appears chaotic and resembles that of MIS 2 (Figure 8C), though with lesser deposition on the ridge flanks.
MIS 5 is the oldest period mapped and the thickest unit with more than 7 m of sediments as revealed by the MIS 5 isochore map (Figure 8F). The depositional pattern of this unit resembles remarkedly that of MIS 3, suggesting an overall similar sedimentation environment for the two periods.
4 Discussion
4.1 Spatial-temporal distribution of depocenters at Vestnesa Ridge: combining cores and seismic mapping
While the shallow seismic mapping provides an overview of the gross depositional environment on Vestnesa Ridge on isotope stage levels of MIS 5−1 using cores from outside of pockmarks (Figures 8A–E), the core records from both inside and outside of pockmarks offer more details on millennial-scale changes in sedimentation patterns, bottom current speed, and sediment source. Most cores taken in pockmarks have a solid stratigraphy from both AMS-14C dates, lithology, and magnetic susceptibility, stable isotope records, organic and inorganic carbon records that allow for identifying events on suborbital scale (Figures 4–6; Supplementary Figure S2–S5). Most core records from Vestnesa Ridge from both inside and outside of pockmarks contain MIS 3 to MIS 1 (including the LGM, deglaciation, and Holocene), which represent the clearest contrasting changes in sedimentation patterns (Figures 4–7; Table 2).
MIS 1: The gross distribution of Holocene interglacial (MIS 1) sediments, as seen in the seismic isochore map (Figure 8B), indicates that the bottom currents during MIS 1 flowed northwards following the seabed contours around the tip of Vestnesa Ridge, and that the strongest currents were focused around 1,200 m present water depth similar to today (e.g., Fer et al., 2023), causing non-deposition or erosion over the eastern crest and upper flanks of Vestnesa Ridge. The core records show the same pattern of sedimentation (Figures 2, 4 –7, Figure 8B; Table 2). The maximum sedimentation rates are found north of the ridge tip, where core MSM5/5-723-2 at 1,350 m water depth with >4 m of Holocene deposits (Werner et al., 2015) and core HH15-1274GC are located (Figure 1A). On the lower southern flank, a maximum thickness recorded by sediment cores was found at 1,500 m water depth in core MSM5/5-712-2 (Müller et al., 2012), while erosion took place on the upper southern flank at 1,226 m water depth (Howe et al., 2008) (Figure 1A). In general, on the western Svalbard slope, Holocene deposits are found deeper than ∼1,300 m water depth (e.g., Ebbesen et al., 2007; Jessen et al., 2010; Lucchi et al., 2013; Rebesco et al., 2013). Our results are in accordance with modern ocean current patterns where strongest currents over the western Svalbard margin occur around ∼1,200 m water depth (e.g., Hopkins, 1991; Schlichtholz and Houssais, 1999a; Fer et al., 2023). Erosion or non-deposition usually occur at <1,200 m water depth (Howe et al., 2008; Jessen et al., 2010; Rebesco et al., 2013) (Figure 7). The 1,500 m depth contours along the western Svalbard margin form the main depocenters of contourites on the margin (e.g., Jessen et al., 2010; Müller et al., 2012; Rebesco et al., 2013; Caricchi et al., 2019). On Vestnesa Ridge, the depocenters appears to be slightly shallower located at 1,300–1,400 m over the western and northwestern part (Figures 7, 8B), indicating that the tip of the protruding ridge has caused the currents to slack.
MIS 2: The chaotic sediment distribution and lack of a marked depocenter seen in the seismic isochore map (Figure 8C) suggests a slowdown of the current strength during MIS 2 causing a change in the depositional environment to be less current dominated. In the seismic mapping however, MIS 2 comprises both the LGM and the deglaciation. The core records can refine MIS 2 by distinguishing the glacial maximum and the deglaciation. In the core records, we observe the highest sedimentation rates and thus thickest deposits for the LGM on the eastern part at ∼1,200 m water depth and often with >2 m of sediments excluding the dark coarse layer (Figures 4B–G, 7; Table 2; Supplementary Figure S3A–F). Deeper than ∼1,250 m at western Vestnesa Ridge deposits from the LGM thins to <1–∼1 m of thickness (Figures 4H–L, 7; Supplementary Figure S3G–J). The coarse layer is interpreted as part debris flow event and an event of intense deposition of local IRD from the Barents Sea and Svalbard margin consisting of grey, brown, and black shales of very low MS (e.g., Jessen et al., 2010; Jessen and Rasmussen, 2019). The event occurred when the Svalbard-Barents Sea Ice Sheet reached the shelf edge at ∼24 ka (e.g., Elverhøi et al., 1995; 1998; Jessen et al., 2010) (Figures 4–6; Supplementary Figure S2–S5).
During the deglaciation (late MIS 2) sedimentation rates were at a maximum over the entire Vestnesa Ridge (Table 2). The laminated layer dating from the Bølling interstadial is interpreted as a plumite deposited at very high sedimentation rates from sediment-laden meltwater plumes from the Barents Sea when the Barents Sea Ice Sheet melted back at the beginning of the warming of the Bølling interstadial (e.g., Birgel and Hass, 2004; Jessen et al., 2010; Junttila et al., 2010; Lucchi et al., 2013; 2015). The layer is found along the entire western Svalbard margin (e.g., Elverhøi et al., 1998; Jessen et al., 2010; Lucchi et al., 2013; Caricchi et al., 2019) being thickest off Storfjorden Trough and south of the Storfjorden Fan and thins with water depth on the slope and northward (Knies et al., 1999; Jessen et al., 2010; Lucchi et al., 2013; 2015; Chauhan et al., 2016a). In general, on Vestnesa Ridge the laminated layer and deglacial sediments thins from southeast to northwest with depth (Figures 4–7; Table 2; Supplementary Figure S2–S5). This points to that bottom currents must have been relatively weak and that distance to the source (Barents Sea) was the overruling factor (e.g., Elverhøi et al., 1998; Jessen et al., 2010; Jessen and Rasmussen, 2019).
Sortable silt records from 1880 m water depth on the western Svalbard slope show generally strong bottom currents during the Holocene and weaker (but variable) currents during the LGM and minimum strength during the Bølling interstadial (Jessen and Rasmussen, 2015). Also, currents were reduced and sedimentation rates low during Heinrich event H1 and the Younger Dryas, as we also record at Vestnesa Ridge (Table 2). Results from the western Svalbard margin and Nordic Seas show that the H1 event was deposited under very cold conditions with almost permanent sea ice cover (Müller and Stein, 2014; Hoff et al., 2016; El bani Altuna et al., 2024). The cold Younger Dryas event was also characterized by dense sea-ice cover and generally low sedimentation rates (Müller et al., 2009; Jessen et al., 2010; Müller and Stein, 2014; Jessen and Rasmussen, 2019).
The sedimentation pattern of the contourite on Vestnesa Ridge on a glacial-interglacial scale mimic patterns of sedimentation in other contourites from the western Svalbard margin indicating a large change in strength of the deeper water flow (Figures 7, 8C; Table 2). The contourites were building up during glacial times shallower than ∼1,200 m, and deeper than 1,300 m during interglacial times on Vestnesa Ridge and generally deeper than ∼1,500 m on the western slope of Svalbard (e.g., Eiken and Hinz, 1993; Jessen et al., 2010; Rebesco et al., 2013; Caricchi et al., 2019). This points to weaker currents during glacials allowing deposition higher on the slope, while strong currents led to deposition at depth during the Holocene (Figures 7, 8B). Similar changes on glacial-interglacial scale were found on the northern Faroe margin and the Faroe-Shetland Channel. Here, Holocene deposits were found deeper on the slope from ∼1,000 m and deeper while erosion and non-deposition took place shallower than ∼900 m water depth (Nielsen et al., 2007). The similarity in sedimentation patterns and bottom water flow at both the Faroe and Svalbard margin thus indicates pronounced changes in strength of deep convection in the Nordic Seas.
MIS 3: The overall depositional pattern observed in the MIS 3 isochore map (Figure 8D), and its resemblance with that of MIS 1 (Figure 8B), likely evidence a similar depositional environment of the two interglacial periods, i.e., the bottom current flowed northward following the depth contours of Vestnesa Ridge with a current core lying close to the depth of the then ridge crest.
Sediments covering most or all of MIS 3 are represented by four records from Vestnesa Ridge. During MIS 3 deposition over the ridge shows lowest average sedimentation rates at 1,200 m water depth in accordance with sediment thicknesses from the seismic compilation. On the western ridge from ∼1,250 m deposits were thicker and depositional rates higher (Figures 7, 8D; Table 2). Also, north of the eastern part of Vestnesa Ridge average rates for MIS 3 were high (El bani Altuna et al., 2021b) (Figure 7L; Table 2) in accordance with the seismic observations.
Sortable silt measurements on DO millennial scale for MIS 3 have indicated stronger currents during the warm interstadials than during the cold stadials from many locations in the Nordic Seas (Gabrielsen (2016) - East Greenland slope, 1,616 m water depth; Solheim (2018) - northern Faroe Islands margin, 1,179 m water depth; Chauhan et al. (2016b) - northern Svalbard margin, 501 m water depth; Jessen and Rasmussen (2015) - western Svalbard margin, 1880 m water depth. In general, investigated long records from the western Svalbard margin also show higher sedimentation rates for interstadial periods than for stadials (Rasmussen and Thomsen, 2013; Rasmussen et al., 2014; Jessen and Rasmussen, 2019; El bani Altuna et al., 2021a) (here exemplified by the very low rates during Heinrich stadial H1 and the high rates during the Bølling and Allerød interstadials) (Figures 4–7; Table 2; Supplementary Figure S2–S5). Rates on DO time scale thus mimics rates on a glacial-interglacial time scale, most likely of lower magnitude given the thinner deposits (Figure 8D) but indicating convection changes on millennial time scale.
MIS 4: Our seismic isochore mapping revealed that the depositional environment during MIS 4 has several similarities with that of MIS 2 by demonstrating a chaotic distribution pattern (Figures 8C,E). The smaller thickness of the MIS 2 layer may be due to the shorter timeframe for this period compared to MIS 4. As for the MIS 2 period, the MIS 4 depositional pattern likely indicate a slowdown of the current strength leading to less current-dominated sedimentation environment. MIS 4 includes the transition to MIS 3, where a similar sequence of sedimentary horizons occur over the northern and western Svalbard margin with a laminated horizon followed by deposition of IRD at high sedimentation rates (e.g., Vogt et al., 2001; Rasmussen et al., 2014; Jessen and Rasmussen, 2015; 2019; Chauhan et al., 2016a).
MIS 5: Only few core records from the western Svalbard margin covering MIS 5 exists (e.g., Risebrobakken et al., 2005). The depositional pattern seen in the MIS 5 isochore map. resembles that of the MIS 1 and MIS 3 maps (Figures 8B,D,F), indicating a similar depositional environment for these three interglacial periods, i.e., the action of a bottom current flowing northward following the depth contours around the ridge, and with a current core lying close to the then ridge crest. The KH19-09GPC record covering MIS 5 show a lower average depositional rate compared to that of MIS 1 and MIS 3, which could be due to compaction (Figure 8F; Table 2).
4.2 Depositional patterns and seepage of gas
4.2.1 Organic and inorganic carbon records from active and inactive pockmark areas
The distribution of %TOC and %CaCO3 appears very consistent between seep- and non-seep records and between the western and eastern pockmark fields regardless of time resolution (Figure 6; Supplementary Figure S5). Similar distribution patterns of %TOC and %CaCO3 have also been recorded elsewhere from the Svalbard margin (e.g., Vogt et al., 2001). This indicates that these two parameters together form a good correlation tool for both seep- and non-seep sites. However, at the eastern active pockmark field at Vestnesa Ridge some calcium carbonate records show very high values and peaks in CaCO3 that do not correlate with the general pattern (Figures 6D,E; Supplementary Figure S5A,F). This we attribute to precipitation of authigenic carbonate in these apparently most active core sites. For example, the carbonate peak in core HH12-929GC correlates with a layer of high concentrations of calcareous nodules of authigenic carbonate (Thomsen et al., 2019) (Figure 6D).
The high %TOC for the dark coarse layer (part debris flow, part IRD layer) and for the laminated layer (deposited by meltwater plumes) is probably mainly a cause of deposition of terrestrial carbon transported out to sea (e.g., Vogt et al., 2001) (Figure 6; Supplementary Figure S5). The Holocene sediments younger than ∼10 ka differs from the earlier periods by being characterized by both high %TOC and %CaCO3 and deposition of fine muds. The high organic content during the Holocene is mainly of marine origin (e.g., Vogt et al., 2001).
4.2.2 Benthic and planktic δ13C records, chemosymbiotic bivalves and seepage of methane
Events of low δ13C are found in MIS 3, and MIS 2, including parts of the LGM (Figure 5; Supplementary Figure S4; note MIS 3 events are not highlighted). In pockmark cores, the debris flow/IRD event dating ∼24 ka generally show low values (Figures 5A,C–E; note no data points for this event in Figures 5B,G–I). The best resolved δ13C variations occurs during the deglaciation; therefore, we focus the discussion on these millennial scale events.
Records from both the presently apparently inactive pockmarks at western Vestnesa and the eastern active pockmarks tend to show recurrent patterns and timings in low δ13C values, while records unaffected by seepage show comparatively high δ13C throughout and within the typical range of the measured species (Figure 5; Supplementary Figure S4). The records affected by seepage thus show low values in the laminated horizon dating ∼15 ka correlating with the Bølling interstadial, in the Allerød interstadial and early Holocene indicating strong seepage of gas (note that H1 and Younger Dryas intervals generally have comparatively higher δ13C values of −3 to −2‰ just below the typical range of the measured species and indicating low to moderate seepage during these events). In addition, records from the SW Svalbard shelf at 76 °N also show this pattern with the same timing as on Vestnesa Ridge indicating that a large geographical area was affected by seepage at the same time (El bani Altuna et al., 2021b and references therein). Three records with the typical configuration of high MS values all show low δ13C in the laminated horizon, one core being from outside of pockmarks, the other two from inside the ‘Lomvi’ pockmark (Figure 5D; Supplementary Figure S4A,B). This indicates a particularly strong seepage event at that time. Holocene deposits younger than ∼9–10 ka BP in all studied cores affected by seepage have typical δ13C values for the measured benthic foraminiferal species indicating a reduction in gas seepage (Figures 5A–C,E–G).
Even if these low δ13C events (often <-10‰) are due to coating of the foraminiferal shells with authigenic carbonate, it would be difficult to reconcile that these recurrent patterns in low δ13C with similar timing and over a large geographical area, in particular in MIS 2 to lower MIS 1, is a random distribution (Figure 5; Supplementary Figure S4). The four lithological units of low δ13C are sedimentologically very different (the unsorted dark layer deposited from debris flow evens, the laminated horizon from turbid meltwater plumes, the Allerød period from intense ice rafting, and the early Holocene, with decreasing ice rafting). Therefore, similarity in timing indicates that the events must have a forcing in the pace of the DO millennial scale events. Bottom water temperature increased by up to 6 °C during Heinrich stadial H1 as shown by nearby core record HH15-1252PC from the northern flank of Vestnesa Ridge. The BWT reached a maximum of 5.5 °C before the start of the Bølling interstadial (El bani Altuna et al., 2021a) (Figure 1A; Figure 2E). The temperature rise is probably the likely cause of dissociation of gas hydrates (e.g., Buffet and Archer, 2004; Ketzer et al., 2020) as also shown by modeling of the thickness of the GHSZ at the shelf of southwestern Svalbard (El bani Altuna et al., 2021b). The presence of chemosymbiotic bivalves in H1 in many pockmark records from both the western and eastern part of Vestnesa Ridge points to low to moderate seepage during most of the event (Figures 4A–C,H; Supplementary Figure S3A). Seep-associated- or chemosymbiotic macrofaunas tend to avoid areas of very strong seepage that causes toxic levels of H2S (e.g., Sahling et al., 2002; Levin et al., 2003). We note that seepage in older Heinrich stadials also was low to moderate where many also are marked by layers of chemosymbiotic bivalves (Figures 5B,H).
There is an apparent time lag from the peak warm bottom water conditions during H1 until gas seepage intensified during the Bølling and Allerød interstadials. Thus, downward diffusion of heat took time to reach substantial layers of gas hydrates. Several modeling studies have shown that in the deep sea, the time from bottom water warming to increased emission of gas can take a thousand to several thousands of years (e.g., Phrampus and Hornbach, 2012; Karstens et al., 2018). Other studies have invoked active faulting from tectonism due to the proximity of Vestnesa Ridge to active spreading zones, the Molloy Transform Fault, and/or offshore glacial isostatic rebound (e.g., Plaza-Faverola et al., 2015; Dazcinnies et al., 2021; Vachon et al., 2022). However, these slower processes alone cannot explain the rapid millennial DO-scale fluctuations in gas emissions that aligns with climatic and oceanographic changes. Another possible forcing factor is the high sediment loading during the deglaciation (Bølling and Allerød interstadials and lower Holocene) (Figure 7; Table 2). High sedimentation rates at the Vøring Plateau caused an increase in temperature in the sediments eventually destabilizing gas hydrates with a time delay of 1,000 years (e.g., Karstens et al., 2018). However, the high sedimentation rates we record at Vestnesa Ridge is an order of magnitude lower than at the Vøring Plateau (∼1 m/ka versus >10 m/ka) (Table 2) but could have added to the effect from the bottom water warming. Hydrostatic pressure would have counteracted the effect of temperature rise due to the rapidly increasing sea level during the deglaciation (e.g., Fairbanks, 1989). Then again, the effects of sea level changes are small in deep water and much smaller than the effect of a 3 °C temperature increase that would thin the GHSZ by 85% (e.g., Buffett and Archer, 2004).
Core HH12-930GC differs by having only slightly decreased δ13C values in the Bølling-Allerød interstadials and early Holocene compared to nearby core HH16-549GC just 11 m away. In older sediments of mid-late MIS 3 and early MIS 2, HH12-930GC shows a pattern in δ13C similar to the other cores (Myrvang, 2015; Chu et al., 2023) (Figures 5C,E). The reason for this deviation for the deglaciation interval is unknown but taken as a signal of heterogeneity in the ‘Lunde’ pockmark.
Since the δ13C patterns and timing of low values are similar between western and eastern records there is clear evidence of periodical intensification of seepage in the western part of the ridge and that the area was as active as the eastern part during MIS 3, 2 and lower MIS 1 until ∼10–9 ka and with high δ13C from that time onwards (Figures 4, 5; Supplementary Figure S3, S4). The time of decrease in gas emission correlates approximately with the time when ice rafting ceased or decreased over the Svalbard margin and the Svalbard-Barents Sea Ice Sheet had retreated into fjord heads or further inland (e.g., Ślubowska et al., 2005; Ślubowska-Woldengen et al., 2007; Forwick and Vorren, 2009). The rapidly settled fine-grained Holocene mud deposited from the contour currents and with its high content of TOC and CaCO3 (Figures 5H,I; Supplementary Figure S5F,G) probably reduced seepage to a slow diffusion of gas through the sediments. We suggest that this slow diffusion formed a basis for efficient oxidation by the microbial consortia (and that little if any gas would escape because of the ‘microbial filter’ or ‘methanotrophic sink’; e.g., James et al., 2016). The SMTZ at western Vestnesa Ridge is found >2 m in the pockmark of core site HH16-550GC and >10 m outside of the pockmark at site HH16-543GC (Laier et al., 2017) (Figure 1C; Figure 4K,L). Results from studies combining seismic data and pore pressure data from Vestnesa Ridge have indicated that the western part at present mostly experience gas seepage as slow and diffusive, while in the eastern part numerous faults and fractures from sediment deformation also allow gas to escape in the gas phase, i.e., termed advective seepage (Plaza-Faverola et al., 2015; 2023; Cooke et al., 2023). At Vestnesa Ridge the thick Holocene deposits in the western part effectively filled the pockmarks and slowed the seepage of methane. According to our results the change from advective to diffusive seepage probably occurred at ∼10 ka. Nevertheless, active tectonism and onshore and offshore isostatic rebound continued after ∼10 ka and until today (e.g., Forman et al., 2004; Vachon et al., 2022; Domel et al., 2023). Fine-grained drift sediments can often seal fractured or coarse, porous glacial sediments in contourites exampled by studies of the very seismically active Hikurangi Margin, New Zealand (Bailey et al., 2021).
In the eastern part of Vestnesa Ridge, Holocene sediments are generally absent but occurs locally within some pockmarks (Figures 5A–D; Supplementary Figure S4C). Here, even a thin cover of fine Holocene sediments apparently caused reduced seepage at ∼10–9 ka as seen in high δ13C values as in for example, core JM10-335GC. Nearby core HH12-928PC, has no Holocene sediments and low δ13C throughout and contain large amounts of authigenic carbonates indicate strong seepage (Figures 6A,E; Supplementary Figure S4D). The two cores were taken about 40 m apart in the elevated area at the rim of ‘Lomvi’ pockmark (Figure 1E). Likely the upward migrating gas found other escape routes (e.g., Treude et al., 2020), which may have focused seepage to sites with no Holocene sediments younger than ∼10 ka, or strong seepage could have prevented settling at some of these sites. In the deep depression in ‘Lomvi’ pockmark core HH12-929GC and nearby core HH15-1293PC contained gas hydrates from ∼125 cm below the seafloor. Both shows the low and constant MS patterns. Core HH16-551GC taken 16 m away shows the typical MS signal for the western Svalbard margin, and contained no gas hydrate (Figure 1E; Figure 4E,F; Supplementary Figure S1I), The SMTZ was located >4 m in core 551GC (Laier, 2017). We have no porewater data for core HH12-929GC, but likely the SMTZ here was much shallower. A hiatus occurs from the top of the layer of authigenic nodules at 110 cm downcore covering the time interval 20–8 ka in the early Holocene probably indicating strong seepage in combination with bottom current activity and that nodules formed at the sediment surface (Thomsen et al., 2019) (Figure 6D). In core HH16-549GC from ‘Lunde’ pockmark (Figure 1D), the SMTZ was located ∼1.5 m below the seafloor (Laier, 2017; Åsheim, 2017). In the central part of the pockmark in bacterial mats the SMTZ was at the seafloor (Melaniuk et al., 2022a). Thus, the sedimentary and seep environments and the depth of the SMTZ are very variable within both the ‘Lomvi’ and ‘Lunde’ pockmarks and within short distances. At western Vestnesa Ridge in the southern pockmark, core JM10-331GC show low magnetic susceptibility while core HH17-839GC shows typical MS values indicating some heterogeneity here (Figure 1C; Supplementary Figure S3H,I) and likely in other pockmarks as well.
4.2.3 Shallow seismic evidence of free gas and gas seepage
The pockmarks and gas seepage on Vestnesa Ridge have primarily been investigated by 2D reflection seismic data (e.g., Hustoft et al., 2009; Bünz et al., 2012). Using high-resolution Chirp data as in the present study provides means for more detailed observations of gas seepages and free gas in the shallow subsurface.
Several of gas-related acoustic phenomena have been observed on Chirp lines passing along the crest of Vestnesa Ridge, i.e., partly or completely wipeout of the signal (known as acoustic blanking), chaotic reflection patterns and lack of penetration, downwards bending seismic reflectors caused by reduced seismic velocity, and high-amplitude reflections (known as bright spots) caused by high gas and/or hydrate content.
Chirp lines crossing active pockmarks in the eastern active pockmark area mostly shows a completely chaotic seismic signal with no reflections from neither the mapped MIS 5–2 units or any older depositional units (Figure 9A). This seismic pattern confirms that sediment deformation caused by active seepage of gas occurs on the eastern Vestnesa Ridge. Further, regular occurrences of acoustic blanking signify that free gas also exists outside the pockmarks in this area, as also evidenced by sediment cores (Figure 6G; Supplementary Figure S4A, S5C).
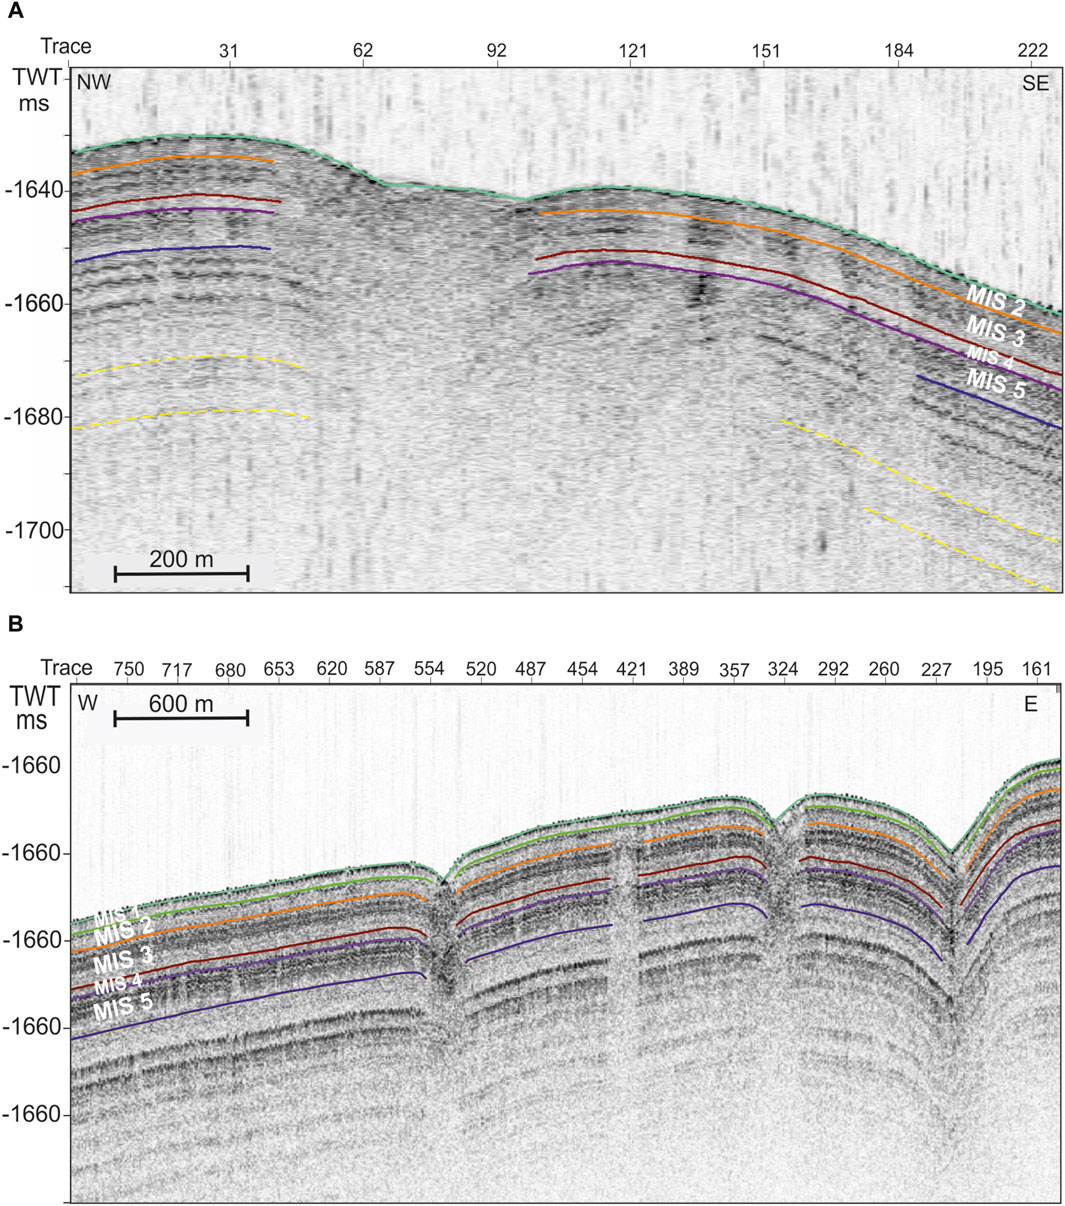
Figure 9. Shallow seismic illustration of gas content and seepage. (A): Shallow seismic Chirp line crossing an active pockmark in the eastern Vestnesa Ridge pockmark area illustrating the complete disturbance of the underlying seismic reflections within the MIS 5–2 units, as well as deeper lying reflectors (some marked with dotted yellow lines) caused by gas seepages. Note the many acoustic blanking areas to the right of the pockmark evidencing presence of free gas in the sediment column. Also note the lack of the MIS 1 unit. (B): Shallow seismic Chirp line along the crest of the western Vestnesa Ridge. Several acoustic phenomena, e.g., acoustic blanking (i.e.,∼ trace 750-620 and 421), bright spots (i.e.,∼ trace 554) and disturbed reflections, evidencing the presence of free gas and gas hydrates in the sediment column despite the lack of acoustic flare observations in the western ridge area. Note the presence of MIS 1 sediments in this area.
Chirp lines from the western Vestnesa Ridge also display existence of pockmarks and several acoustic phenomena evidencing presence of free gas and gas hydrates in the sediment column despite the lack of acoustic flare observations in this part of the ridge area (Figure 9B). This is taken as evidence that gas seepages in the western ridge area have either slowed down or are prevented in reaching to the seafloor.
A notable difference between the eastern and western pockmark areas are the presence of the MIS 1 unit in the latter area, while this unit is missing in the eastern area (Figures 9A,B). This could hint that presence or lack of MIS 1 sediments may play a role in gas seepage activity at Vestnesa Ridge. This is also supported by core data from both eastern and western pockmarks (Figures 1C–E; Figures 5A–C, E–G; Supplementary Figure S3H,I). In addition, Chirp data crossing some of the pockmarks in the western area show that a disturbed and chaotic pattern characterize the MIS 5–3 units and deeper layers, while the overlaying MIS 1 and partly MIS 2 units appear relatively undisturbed. This suggest that similar to that of the present eastern pockmark area, some heterogeneity in the seepage patterns existed in the western pockmark area, as also evidenced by the core study.
5 Conclusion
Based on our study of 43 sediment core records and 1,430 km of shallow seismic lines we can conclude the following:
• The depositional patterns of the Vestnesa Ridge drift changed on a glacial-interglacial time scale. During interglacial times (Holocene; marine isotope stage (MIS) 1, MIS 3 and MIS 5) a strong current flow resulted in build-up of thick, focused depocenters on the northwestern Vestnesa Ridge while decreased deposition or erosion occurred in other parts of the ridge. During glacial times (MIS 2 and MIS 4) a weakened current lead to thinner, more chaotic deposition covering the greater central part of the ridge
• During the last glacial maximum (LGM) 24–19 ka, the depocenter shifted upslope to 1,200 m water depth and shallower due to the weaker current activity
• The sedimentation patterns on millennial scale mimics those of the glacial-interglacial time scale, though likely of lower magnitude, but indicating current changes on millennial time scale with stronger currents during warm interstadials and weaker currents during cold stadials
• The depositional patterns, the magnetic susceptibility records, and ages of typical sediment marker horizons from Vestnesa Ridge entirely match records from elsewhere over the western Svalbard margin for the last 30 ka
• Gas seepage from the western inactive pockmark area was as strong as in the eastern active pockmark area during MIS 3, MIS 2 into early MIS 1. Seepage in both areas was particularly strong during the deglaciation (Bølling-Allerød interstadials 15–13 ka and lower Holocene ∼12–∼10 ka)
• The increase in seepage of gas during the deglaciation was likely primarily driven by temperature rise in the bottom water destabilizing deep reservoirs of gas hydrates. Tectonism/glacial isostatic rebound, and sediment loading probably played a secondary role in these rapid fluctuations in gas seepage
• At Vestnesa Ridge the thick Holocene deposits in the western part effectively filled pockmarks and probably slowed seepage of gas, while in the eastern active part Holocene deposits only occur locally within some pockmarks. Seepage through Holocene muds with high %TOC and %CaCO3 became reduced to a slow diffusion. Efficient oxidation by microbial communities probably prevented gas escape from the seafloor
Data availability statement
The original contributions presented in the study are included in the article/Supplementary Material, further inquiries can be directed to the corresponding author.
Author contributions
TR: Conceptualization, Investigation, Methodology, Writing–original draft, Writing–review and editing. TN: Investigation, Writing–original draft, Writing–review and editing.
Funding
The author(s) declare that financial support was received for the research, authorship, and/or publication of this article. The study before 2013 was part of the Paleo-CIRCUS project, funded by TFS, UiT the Arctic University of Norway. From 2013 the study was funded by the Norwegian Research Council through its Centers of Excellence funding scheme, grant number 223259. The 2012 and 2015 cruises were funded by the Research School in Arctic Marine Geology and Geophysics (AMGG, Department of Geosciences, UiT the Arctic University of Norway, Tromsø).
Acknowledgments
We thank the captain and crew of RV Jan Mayen and RV Helmer Hansen and cruise participants during cruises 2010, 2012, 2015, 2016, 2017 and 2018 and captain, crew, cruise leaders Jochen Knies and Monica Winsborrow and cruise participants on RV Kronprins Haakon in 2019 for their assistance in core retrieval and handling. We also thank cruise participants during CAGE cruises in 2016, 2017 and 2018 for porewater and sediment sampling. We especially thank cruise participants of cruises GEO-8144/3144 in 2012 and 2015 for their assistance in core retrieval and onboard data measurements. Naima El bani Altuna, Kamila Sztybor, and Chiara Consolaro are thanked for GEOTEK-MSCL data (HH15- and JM10-cruises). Andreia Plaza-Faverola (UiT) is thanked for providing the seismic line KH19-018 data (KH19 cruise). The laboratory staff at the Department of Geosciences, UiT is thanked for endless GEOTEK measurements, XRF-image scans, and numerous Leco measurements over the last 10 years. Matteus Lindgren, Department of Geosciences, UiT supervised the stable isotope measurements. We thank Pavel Serov for the maps in Figures 1D,E. We also thank Naima El bani Altuna and Erik Thomsen for help with making Figure 2. The Geological Survey of Denmark and Greenland (GEUS) is thanked for providing TN time for interpretation and paper writing. We also thank Lars J. Kjaergaard and Shahjahan Laghari, GEUS, for loading seismic data and core locations into @Petrel. Finally, we thank the two reviewers for their very helpful and constructive comments and suggestions.
Conflict of interest
The authors declare that the research was conducted in the absence of any commercial or financial relationships that could be construed as a potential conflict of interest.
Publisher’s note
All claims expressed in this article are solely those of the authors and do not necessarily represent those of their affiliated organizations, or those of the publisher, the editors and the reviewers. Any product that may be evaluated in this article, or claim that may be made by its manufacturer, is not guaranteed or endorsed by the publisher.
Supplementary material
The Supplementary Material for this article can be found online at: https://www.frontiersin.org/articles/10.3389/feart.2024.1356341/full#supplementary-material
References
Aagaard, K., Foldvik, A., and Hillman, S. R. (1987). The West spitsbergen current: disposition and water mass transformation. J. Geophys. Res. 92, 3778–3784. doi:10.1029/JC092iC04p03778
Åsheim, J.-E. F. (2017). Changes in paleoceanography and methane release in relation to past climatic variability at Vestnesa Ridge. Available at: http://hdl.handle.net/10037/11621.
Åström, E. K. L., Carroll, M. L., Ambrose, W. G., Sen, A., Silyakova, A., and Carroll, J. (2018). Methane cold seeps as biological oases in the high-Arctic deep sea. Limnol. Oceanogr. 63, S209–S231. doi:10.1002/lno.10732
Bailey, W., McArthur, A., and McCaffrey, W. (2021). Sealing potential of contourite drifts in deep-water fold and thrust belts: examples from the Hikurangi Margin, New Zealand. Mar. Petrol. Geol. 123, 104776. doi:10.1016/j.marpetgeo.2020.104776
Birgel, D., and Hass, H. C. (2004). Oceanic and atmospheric variations during the last deglaciation in the Fram Strait (Arctic Ocean): a coupled high-resolution organic-geochemical and sedimentological study. Quat. Sci. Rev. 23, 29–47. doi:10.1016/j.quascirev.2003.10.001
Boetius, A., Ravenschlag, K., Schubert, C. J., Rickert, D., Widdel, F., Gieseke, A., et al. (2000). A marine microbial consortium apparently mediating anaerobic oxidation of methane. Nature 407, 623–626. doi:10.1038/35036572
Bond, G., Broecker, W., Johnsen, S., McManus, J., Labeyrie, L., Jouzel, J., et al. (1993). Correlations between climate records from North Atlantic and Greenland ice. Nature 365, 343–347. doi:10.1038/365143a0
Borowski, W. S., Paull, C. K., and Ussler, W. (1996). Marine pore-water sulfate profiles indicate in situ methane flux from underlying gas hydrate. Geology 24, 655–658. doi:10.1130/0091-7613(1996)024<0655:mpwspi>2.3.co;2
Buffett, B., and Archer, D. (2004). Global inventory of methane clathrate: sensitivity to changes in the deep ocean. Earth Planet. Sci. Lett. 227, 185–199. doi:10.1016/j.epsl.2004.09.005
Bünz, S., Polyanov, S., Vadakkepuliyambatta, S., Consolaro, C., and Mienert, J. (2012). Active gas venting through hydrate-bearing sediments on the Vestnesa Ridge, offshore W-Svalbard. Mar. Geol. 332−334, 189–197. doi:10.1016/j.margeo.2012.09.012
Caricchi, C., Lucchi, R. G., Sagnotti, L., Macri, P., Di Roberto, A., Del Carlo, P., et al. (2019). A high-resolution geomagnetic relative paleointensity record from the Arctic Ocean deep-water gateway deposits during the last 60 kyr. Geochem., Geophys., Geosys. 20, 2355–2377. doi:10.1029/2018GC007955
Chauhan, T., Noormets, R., and Rasmussen, T. L. (2016b). Glaciomarine sedimentation and bottom current activity on the north-western and northern continental margins of Svalbard during the late Quaternary. Geo-Mar. Lett. 36, 81–99. doi:10.1007/s00367-015-0430-6
Chauhan, T., Rasmussen, T. L., and Noormets, R. (2016a). Palaeoceanography of the Barents Sea continental margin, north of Nordaustlandet, Svalbard, during the last 74 ka. Boreas 45, 76–99. doi:10.1111/bor.12135
Chu, R. W. C., Yasuhara, M., Myrvang Riise, K., Asahi, H., Huang, H.-H. M., Cotton, L. J., et al. (2023). Late Quaternary paleoceanography of Vestnesa Ridge, Fram Strait: ostracode species as a potential indicator of cold seep activity. Geology 51, 758–762. doi:10.1130/G51237.1
Consolaro, C., Rasmussen, T. L., Panieri, G., Mienert, J., Buenz, S., and Sztybor, K. (2015). Carbon isotope (δ<sup&gt;13&lt;/sup&gt;C) excursions suggest times of major methane release during the last 14 kyr in Fram Strait, the deep-water gateway to the Arctic. Clim. Past. 11, 669–685. doi:10.5194/cp-11-669-2015
Cook, M. S., Keigwin, L. D., Birgel, D., and Hinrichs, K.-U. (2011). Repeated pulses of vertical methane flux recorded in glacial sediments from the southeast Bering Sea. Paleoceanography 26, PA2210. doi:10.1029/2010PA001993
Cooke, F., Plaza-Faverola, A., Bünz, S., Sultan, N., Ramachandran, H., Bedle, H., et al. (2023). Sedimentary deformation relating to episodic seepage in the last 1.2 million years: a multi-scale seismic study from the Vestnesa Ridge, eastern Fram Strait. Front. Earth Sci. 11. doi:10.3389/feart.2023.1188737
Dansgaard, W., Johnsen, S., Clausen, H., Dahl-Jensen, D., Gundestrup, N., Hammer, C., et al. (1993). Evidence for general instability of past climate from a 250-kyr ice-core record. Nature 364, 218–220. doi:10.1038/364218a0
Daszinnies, M., Plaza-Faverola, A., Sylta, Ø., Bünz, S., Mattingsdal, R., Tømmerås, A., et al. (2021). The Plio-Pleistocene seepage history off western Svalbard inferred from 3D petroleum systems modelling. Mar. Petrol. Geol. 128, 105023. doi:10.1016/j.marpetgeo.2021.105023
Domel, P., Plaza-Faverola, A., Schlindwein, V., and Bünz, S. (2023). Local seismicity and sediment deformation in the west Svalbard margin: implications of neotectonics for seafloor seepage. Geochem., Geophys., Geosys. 24. doi:10.1029/2023GC011174
Ebbesen, H., Hald, M., and Eplet, T. H. (2007). Lateglacial and early Holocene climatic oscillations on the western Svalbard margin, European Arctic oscillations on the western Svalbard margin, European Arctic. Quat. Sci. Rev. 26, 1999–2011. doi:10.1016/j.quascirev.2006.07.020
Eiken, O., and Hinz, K. (1993). Contourites in the Fram Strait. Sediment. Geol. 82, 15–32. doi:10.1016/0037-0738(93)90110-q
El bani Altuna, N., Ezat, M. M., Greaves, M., and Rasmussen, T. L. (2021a). Millennial-scale changes in bottom water temperature and water mass exchange through the Fram Strait 79°N, 63-13 ka. Paleoceanogr. Paleoclimatol. 36. doi:10.1029/2020PA004061
El bani Altuna, N., Ezat, M. M., Smik, L., Muschitiello, F., Belt, S. T., Knies, J., et al. (2024). Sea ice-ocean coupling during Heinrich stadials in the atlantic-arctic gateway. Sci. Rep. 14, 1065. doi:10.1038/s41598-024-51532-7
El bani Altuna, N., Rasmussen, T. L., Ezat, M. M., Vadakkepuliyambatta, S., Groeneveld, J., and Greaves, M. (2021b). Deglacial bottom water warming intensified Arctic methane seepage in the NW Barents Sea. Comm. Earth. Environ. 2, 188. doi:10.1038/s43247-021-00264-x
Elverhoi, A., Andersen, E. S., Dokken, T., Hebbeln, D., Spielhagen, R., Svendsen, J. I., et al. (1995). The growth and decay of the Late Weichselian Ice Sheet in western Svalbard and adjacent areas based on provenance studies of marine sediments. Quat. Res. 44, 303–316. doi:10.1006/qres.1995.1076
Elverhøi, A., Hooke, R. L. E. B., and Solheim, A. (1998). Late Cenozoic erosion and sediment yield from the Svalbard-Barents Sea region: implications for understanding erosion of glacierized basins. Quat. Sci. Rev. 17, 209–241. doi:10.1016/s0277-3791(97)00070-x
Espitalié, J., Laporte, J. L., Madec, M., Marquis, F., Leplat, P., Paulet, J., et al. (1977). Méthode rapide de caractérisation des roches mètres, de leur potentiel pétrolier et de leur degré d'évolution. Rev. L'inst. Francais Du. Pet. 32, 23–42. doi:10.2516/ogst:1977002
Ezat, M., Rasmussen, T. L., and Groeneveld, J. (2014). Persistent intermediate water warming during cold stadials in the southeastern Nordic seas during the past 65 k.y. Geology 42, 663–666. doi:10.1130/g35579.1
Fairbanks, R. G. (1989). A 17,000-year glacio-eustatic sea level record: influence of glacial melting rates on the Younger Dryas event and deep-ocean circulation. Nature 342, 637–642. doi:10.1038/342637a0
Falardeau, J., de Vernal, A., and Spielhagen, R. F. (2018). Paleoceanography of northeastern Fram Strait since the last glacial maximum: palynological evidence of large amplitude changes. Quat. Sci. Rev. 195, 133–152. doi:10.1016/j.quascirev.2018.06.030
Falardeau, J., de Vernal, A., and Spielhagen, R. F. (2019). Palynological data of cores MSM5/5-712-2 and PS2863/1-2 from northeastern Fram Strait spanning the last glacial maximum to present. Data Brief 24, 103899. doi:10.1016/j.dib.2019.103899
Fer, I., Peterson, A. K., and Nilsen, F. (2023). Atlantic water boundary current along the southern Yermak plateau, Arctic Ocean. JGR Oceans 128. doi:10.1029/2023JC019645
Forman, S. L., Lubinski, D. J., Ingólfsson, Ó., Zeeberg, J. J., Snyder, J. A., Siegert, M. J., et al. (2004). A review of postglacial emergence on svalbard, franz josef land and novaya zemlya, northern eurasia. Quat. Sci. Rev. 23, 1391–1434. doi:10.1016/j.quascirev.2003.12.007
Forwick, M., and Vorren, T. O. (2009). Late weichselian and Holocene sedimentary environments and ice rafting in isfjorden, spitsbergen. Spitsb. Palaeogeogr. Palaeoclimatol. Palaeoecol. 280, 258–274. doi:10.1016/j.palaeo.2009.06.026
Gabrielsen, L. (2016). Study of millennial scale paleoclimatic and paleoceanographic changes in conjunction with variations in the East Greenland Current during the late Quaternary. Available at: https://munin.uit.no/handle/10037/11141.
Gebhardt, A. C., Geissler, W. H., Matthiessen, J., and Jokat, W. (2014). Changes in current patterns in the Fram Strait at the pliocene/pleistocene boundary. Quat. Sci. Rev. 92, 179–189. doi:10.1016/j.quascirev.2013.07.015
Hansen, J., Ezat, M. M., Åström, E. K. L., and Rasmussen, T. L. (2020). New late pleistocene species of acharax from arctic methane seeps off svalbard. J. Syst. Palaeontol. 18, 197–212. doi:10.1080/14772019.2019.1594420
Himmler, T., Sahy, D., Martma, T., Bohrmann, G., Plaza-Faverola, A., Bünz, S., et al. (2019). A 160,000-year-old history of tectonically controlled methane seepage in the Arctic. Sci. Adv. 5, eaaw1450. doi:10.1126/sciadv.aaw1450
Hoff, U., Rasmussen, T. L., Stein, R., Ezat, M., and Fahl, K. (2016). Sea ice and millennial-scale climate variability in the Nordic seas 90 kyr ago to present. Nat. Comm. 7, 12247. doi:10.1038/ncomms12247
Hong, W.-L., Pape, T., Schmidt, C., Yao, H., Wallmann, K., Plaza-Faverola, A., et al. (2021). Interactions between deep formation fluid and gas hydrate dynamics inferred from pore fluid geochemistry at active pockmarks of the Vestnesa Ridge, west Svalbard margin. Mar. Petrol. Geol. 127, 104957. doi:10.1016/j.marpetgeo.2021.104957
Hopkins, T. S. (1991). The GIN Sea - a synthesis of its physical oceanography and literature review 1972–1985. Earth-Sci. Rev. 30, 175–318. doi:10.1016/0012-8252(91)90001-v
Hornbach, M. J. (2022). “Bottom simulating reflectors below the blake ridge, western North Atlantic margin,” in World atlas of submarine gas hydrates in continental margins. Editors J. Mienert, C. Berndt, A. M. Tréhu, A. Camerlenghi, and C.-S. Liu (Cham, Switzerland: Springer Nature), 131–138.
Howe, J. A., Shimmels, T. M., Harland, R., and Eyles, N. (2008). Late quaternary contourites and glaciomarine sedimentation in the Fram Strait. Sedimentology 55, 179–200. doi:10.1111/j.1365-3091.2007.00897.x
Hustoft, S., Bünz, S., Mienert, J., and Chand, S. (2009). Gas hydrate reservoir and active methane-venting province in sediments on <20 Ma young oceanic crust in the Fram Strait, offshore NWSvalbard. Earth Planet. Sci. Lett. 284, 12–24. doi:10.1016/j.epsl.2009.03.038
Jakobsson, M., Mayer, L. A., Bringensparr, C., Castro, C. F., Mohammad, R., Johnson, P., et al. (2020). The international bathymetric chart of the Arctic Ocean version 4.0. Sci. Data 7, 176. doi:10.1038/s41597-020-0520-9
James, R. H., Bousquet, P., Bussmann, I., Haeckel, M., Kipfer, R., Leifer, I., et al. (2016). Effects of climate change on methane emissions from seafloor sediments in the Arctic Ocean: a review. Limnol. Oceanogr. 61, 283–299. doi:10.1002/lno.10307
Jessen, S. P., and Rasmussen, T. L. (2015). Sortable silt cycles in svalbard slope sediments 74–0 ka. J. Quat. Sci. 30, 743–753. doi:10.1002/jqs.2807
Jessen, S. P., and Rasmussen, T. L. (2019). Ice rafting patterns on the western Svalbard slope 74–0 ka: interplay between ice-sheet activity, climate and ocean circulation. Boreas 48, 236–256. doi:10.1111/bor.12358
Jessen, S. P., Rasmussen, T. L., Nielsen, T., and Solheim, A. (2010). A new Late Weichselian and Holocene marine chronology for the western Svalbard slope 30,000 – 0 cal years BP. Quat. Sci. Rev. 29, 1301–1312. doi:10.1016/j.quascirev.2010.02.020
Junttila, J., Aagaard-Sørensen, S., Husum, K., and Hald, M. (2010). Late Glacial-Holocene clay minerals elucidating glacial history in the SW Barents Sea. Mar. Geol. 276, 71–85. doi:10.1016/j.margeo.2010.07.009
Karstens, J., Haflidason, H., Becker, L. W. M., Berndt, C., Rüpke, L., Planke, S., et al. (2018). Glacigenic sedimentation pulses triggered post-glacial gas hydrate dissociation. Nat. Comm. 9, 635. doi:10.1038/s41467-018-03043-z
Kennett, J. P., Cannariato, K. G., Hendy, I. L., and Behl, R. J. (2003). Methane hydrates in quaternary climate change: the clathrate gun hypothesis. Am. Geophys. Union Spec. Publ. Ser. 5. doi:10.1029/054SP
Ketzer, M., Praeg, D., Rodrigues, L. F., Augustin, A., Pivel, M. A. G., Rahmati-Abkenar, M., et al. (2020). Gas hydrate dissociation linked to contemporary ocean warming in the southern hemisphere. Nat. Comm. 11, 3788. doi:10.1038/s41467-020-17289-z
Kindler, P., Guillevic, M., Baumgartner, M., Schwander, J., Landais, A., and Leuenberger, M. (2014). Temperature reconstruction from 10 to 120 kyr b2k from the NGRIP ice core. Clim. Past. 10, 887–902. doi:10.5194/cp-10-887-2014
Knies, J., Daszinnies, M., Plaza-Faverola, A., Chand, S., Sylta, Ø., Bünz, S., et al. (2018). Modelling persistent methane seepage offshore western Svalbard since early Pleistocene. Mar. Petrol. Geol. 91, 800–811. doi:10.1016/j.marpetgeo.2018.01.020
Knies, J., Mattingsdal, R., Fabian, K., Grøsfjeld, K., Baranwal, S., Husum, K., et al. (2014). Effect of early Pliocene uplift on late Pliocene cooling in the Arctic-Atlantic gateway. Earth Planet Sci. Lett. 387, 132–144. doi:10.1016/j.epsl.2013.11.007
Knies, J., and Vadakkepuliyambatta, S. (2023). CAGE19-3 Cruise Report: calypso giant piston coring in the Atlantic-Arctic gateway – Investigation of continental margin development and effect of tectonic stress on methane release. CAGE – Centre Arct. Gas Hydrate, Environ. Clim. Rep. Ser. 7, 1–127. doi:10.7557/cage.6911
Knies, J., Vogt, C., and Stein, R. (1999). Late Quaternary growth and decay of the Svalbard/Barents Sea ice sheet and paleoceanographic evolution in the adjacent Arctic Ocean. Geo-Mar. Lett. 18, 195–202. doi:10.1007/s003670050068
Laier, T., Rasmussen, T. L., Sztybor, K., and Nielsen, T. (2017). “Gas migration through a 150 m hydrate stability zone off Svalbard results in local shallow ‘secondary’ hydrate formation,” in Proceedings of the 9th International Conference on Gas Hydrates, Denver, Colorado, USA.
Levin, L. A., Ziebis, W., Mendoza, G. F., Growney, V. A., Tryons, M. D., Brown, K. M., et al. (2003). Spatial heterogeneity of macrofauna at northern California methane seeps: influence of sulfide concentration and fluid flow. Mar. Ecol. Progr. Ser. 265, 123–139. doi:10.3354/meps265123
Lisiecki, L. E., and Raymo, M. E. (2005). A Pliocene-Pleistocene stack of 57 globally distributed benthic δ18O records. Paleoceanography 20, PA1003. doi:10.1029/2004PA001071
Lucchi, R. G., Camerlenghi, A., Rebesco, M., Colmenero-Hidalgo, E., Sierro, F. J., Sagnotti, L., et al. (2013). Postglacial sedimentary processes on the Storfjorden and Kveithola trough mouth fans: significance of extreme glacimarine sedimentation. Glob. Planet. Change 111, 309–326. doi:10.1016/j.gloplacha.2013.10.008
Lucchi, R. G., Sagnotti, L., Camerlenghi, A., Macri, P., Rebesco, M., Pedrosa, M. T., et al. (2015). Marine sedimentary record of meltwater pulse 1a along the NW Barents Sea continental margin. Arktos 1, 7. doi:10.1007/s41063-015-0008-6
Mackensen, A., Wollenburg, J., and Licari, L. (2006). Low δ13C in tests of live epibenthic and endobenthic foraminifera at a site of active methane seepage. Paleoceanography 15. doi:10.1029/2005pa001196
Martin, R. A., Nesbitt, E. A., and Campbell, K. A. (2010). The effects of anaerobic methane oxidation on benthic foraminiferal assemblages and stable isotopes on the Hikurangi Margin of eastern New Zealand. Mar. Geol. 272, 270–284. doi:10.1016/j.margeo.2009.03.024
Matteis, F. (2018). Climate reconstruction during the Last Glacial Maximum based on a marine sediment core. Available in: https://munin.uit.no/handle/10037/13459.
Mattingsdal, R., Knies, J., Andreassen, K., Fabian, K., Husum, K., Grøsfjeld, K., et al. (2014). A new 6 Myr stratigraphic framework for the Atlantic–Arctic Gateway. Quat.Sci. Rev. 92, 170–178. doi:10.1016/j.quascirev.2013.08.022
McCorkle, D. C., Corliss, B. H., and Farnham, C. A. (1997). Vertical distributions and stable isotopic compositions of live (stained) benthic foraminifera from the North Carolina and California continental margins. Deep-Sea Res. 44, 983–1024. doi:10.1016/s0967-0637(97)00004-6
McCorkle, D. C., Keigwin, L. D., Corliss, B. H., and Emerson, S. R. (1990). The influence of microhabitats on the carbon isotopic composition of deep-sea benthic foraminifera. Paleoceanography 5, 161–185. doi:10.1029/pa005i002p00161
Melaniuk, K., Sztybor, K., Treude, T., Sommer, St., and Rasmussen, T. L. (2022a). Influence of methane seepage on isotopic signatures in living deep-sea benthic foraminifera, 79° N. Sci. Rep. 12, 1169–2022. doi:10.1038/s41598-022-05175-1
Melaniuk, K., Sztybor, K., Treude, T., Sommer, S., Zajaczkowski, M., and Rasmussen, T. L. (2022b). Response of benthic foraminifera to environmental successions of cold seeps from Vestnesa Ridge, Svalbard: implications for interpretations of paleo-seepage environments. Front. Mar. Sci. 9. doi:10.3389/fmars.2022.999902
Michel, E., Turon, J.-C., Labeyrie, L., Thouveny, N., Zahn, R., Hillaire-Marcel, C., et al. (1999). MD 114 Campagne Interpole IMAGES V à bord du Marion-Dufresne du 13 juin 1999 au 20 septembre 1999. Paris, France: L’Institut Français pour la Recherche et la Technologie Polaires.
Müller, J., Massé, G., Stein, R., and Belt, S. T. (2009). Variability of sea-ice conditions in the Fram Strait over the past 30,000 years Fram Strait over the past 30,000 years. Nat. Geosci. 2, 772–776. doi:10.1038/NGEO665
Müller, J., and Stein, R. (2014). High-resolution record of late glacial and deglacial sea ice changes in Fram Strait corroborates ice-ocean interactions during abrupt climate shifts. Earth Planet. Sci. Lett. 403, 446–455. doi:10.1016/j.epsl.2014.07.016
Müller, J., Werner, K., Stein, R., Fahl, K., Moros, M., and Jansen, E. (2012). Holocene cooling culminates in sea ice oscillations in Fram Strait. Quat. Sci. Rev. 47, 1–14. doi:10.1016/j.quascirev.2012.04.024
Myrvang, K. (2015). Correlation between changes in paleoceanography, paleoclimate and methane seepage on Vestnesa Ridge, eastern Fram Strait. Available in: http://hdl.handle.net/10037/8402.
Nielsen, T., Rasmussen, T. L., Ceramicola, S., and Kuijpers, A. (2007). Quaternary sedimentation, margin architecture and ocean circulation variability around the Faroe Islands, North Atlantic. North Atl. Quat. Sci. Rev. 26, 1016–1036. doi:10.1016/j.quascirev.2006.12.005
Novosel, I., Spence, G. D., and Hyndman, R. D. (2005). Reduced magnetization produced by increased methane flux at a gas hydrate vent. Mar. Geol. 216, 265–274. doi:10.1016/j.margeo.2005.02.027
Phrampus, B. J., and Hornbach, M. J. (2012). Recent changes to the Gulf Stream causing widespread gas hydrate destabilization. Nature 490, 527–530. doi:10.1038/nature11528
Plaza-Faverola, A., Bünz, S., Johnson, J. E., Chand, S., Knies, J., Mienert, J., et al. (2015). Role of tectonic stress in seepage evolution along the gas hydrate-charged Vestnesa Ridge, Fram Strait. Geophys. Res. Lett. 42, 733–742. doi:10.1002/2014GL062474
Plaza-Faverola, A., Sultan, N., Lucchi, R. G., El bani Altuna, N., Ramachandran, H., Singhroha, S., et al. (2023). Spatial changes in gas transport and sediment stiffness influenced by regional stress: observations from piezometer data along Vestnesa Ridge, eastern Fram Strait. JGR Solid Earth 128. doi:10.1029/2022JB025868
Plaza-Faverola, A., Vadakkepuliyambatta, S., Hong, W. L., Mienert, J., Bünz, S., Chand, S., et al. (2017). Bottom-simulating reflector dynamics at Arctic thermogenic gas provinces: an example from Vestnesa Ridge, offshore west Svalbard. JGR Solid Earth 122, 4089–4105. doi:10.1002/2016JB013761
Rasmussen, T. L., and Thomsen, E. (2004). The role of the North Atlantic Drift in the millennial timescale glacial climate fluctuations glacial climate fluctuations. Palaeogeogr. Palaeoclim. Palaeoecol. 210, 101–116. doi:10.1016/j.palaeo.2004.04.005
Rasmussen, T. L., and Thomsen, E. (2013). Pink marine sediments reveal rapid ice melt and Arctic meltwater discharge during Dansgaard-Oeschger warmings. Nat. Comm. 4, 2849. doi:10.1038/ncomms3849
Rasmussen, T. L., Thomsen, E., and Nielsen, T. (2014). Water mass exchange between the nordic seas and the Arctic Ocean on millennial timescale during MIS 4–MIS 2. Geochem. Geophys. Geosys. 15, 530–544. doi:10.1002/2013GC005020
Rasmussen, T. L., Thomsen, E., Ślubowska, M. A., Jessen, S., Solheim, A., and Koç, N. (2007). Paleoceanographic evolution of the SW Svalbard margin (76°N) since 20,000 14C yr BP. Quat. Res. 67, 100–114. doi:10.1016/j.yqres.2006.07.002
Rebesco, M., Wählin, A., Laberg, J. S., Schauer, U., Beszczynska-Möller, A., Lucchi, R. G., et al. (2013). Quaternary contourite drifts of the western Spitsbergen margin. Deep-Sea Res. I 79, 156–168. doi:10.1016/j.dsr.2013.05.013
Reimer, P. J., Edouard, B., Bayliss, A., Beck, J. W., Blackwell, P. G., Ramsey, C. B., et al. (2013). IntCal13 and Marine13 radiocarbon age calibration curves, 0–50,000 years cal BP. Radiocarbon 55, 1869–1887. doi:10.2458/azu_js_rc.55.16947
Risebrobakken, B., Dokken, T., and Jansen, E. (2005). Extent and variability of the Meridional Atlantic circulation in the Eastern Nordic Seas during marine isotope stage 5 and its influence on the inception of the last glacial. Geophys. Monogr. Ser. 158, 323–339. doi:10.1029/158GM20
Sahling, H., Rickert, D., Lee, R. W., Linke, P., and Suess, E. (2002). Macrofaunal community structure and sulfide flux at gas hydrate deposits from the Cascadia convergent margin, NE Pacific. Mar. Ecol. Progr. Ser. 231, 121–138. doi:10.3354/meps231121
Schlichtholz, P., and Houssais, M.-N. (1999a). An inverse modeling study in Fram Strait. Part I: dynamics and circulation. Deep-Sea Res. II 46, 1083–1135. doi:10.1016/s0967-0645(99)00018-1
Schlichtholz, P., and Houssais, M.-N. (1999b). An inverse modeling study in Fram Strait. Part II: water mass distribution and transports. Deep-Sea Res. II 46, 1137–1168. doi:10.1016/s0967-0645(99)00017-x
Schneider, A., Panieri, G., Lepland, A., Consolaro, C., Crèmière, A., Forwick, M., et al. (2018). Methane seepage at Vestnesa Ridge (NW svalbard) since the last glacial maximum. Quat. Sci. Rev. 193, 98–117. doi:10.1016/j.quascirev.2018.06.006
Sen, A., Didriksen, A., Hourdez, A., Svenning, M. M., and Rasmussen, T. L. (2020). Frenulate siboglinids at high Arctic methane seeps and insight into high latitude frenulate distribution. Ecol. Evol. 10, 1339–1351. doi:10.1002/ece3.5988
Ślubowska, M., Koç, N., Rasmussen, T. L., and Klitgaard-Kristensen, D. (2005). Changes in the flow of Atlantic water into the Arctic Ocean since the last deglaciation: evidence from the northern Svalbard continental margin, 80°N. Paleoceanography 20, PA4014. doi:10.1029/2005PA001141
Ślubowska-Woldengen, M., Rasmussen, T. L., Koç, N., Klitgaard-Kristensen, D., Nilsen, F., and Solheim, A. (2007). Advection of atlantic water to the western and northern svalbard shelf since 17,500calyr BP. Quat. Sci. Rev. 26, 463–478. doi:10.1016/j.quascirev.2006.09.009
Smith, L. M., Sachs, J. P., Jennings, A. E., Anderson, D. M., and de Vernal, A. (2001). Light δ13C events during deglaciation of the East Greenland continental shelf attributed to methane release from gas hydrates. Geophys. Res. Lett. 28, 2217–2220. doi:10.1029/2000gl012627
Snyder, G. T., Hiruta, A., Matsumoto, R., Dickens, G. R., Tomaru, H., Takeuchi, R., et al. (2007). Pore water profiles and authigenic mineralization in shallow marine sediments above the methane-charged system on Umitaka Spur, Japan Sea. Deep-Sea Res. II 54, 1216–1239. doi:10.1016/j.dsr2.2007.04.001
Solheim, M. (2018). Reconstruction of the bottom current strength of overflow water through the Faroe-Shetland Channel in relation to climate change during the last 135,000 years. Available in: https://hdl.handle.net/10037/12857.
Sztybor, K. (2016). Late glacial and deglacial paleoceanographic and environmental changes at Vestnesa Ridge, Fram Strait: challenges in reading methane-influenced sedimentary records. Available at https://hdl.handle.net/10037/24978.
Sztybor, K., and Rasmussen, T. L. (2017a). Diagenetic disturbances of marine sedimentary records from methane-influenced environments in the Fram Strait as indications of variation in seep intensity during the last 35 000 years. Boreas 46, 212–228. doi:10.1111/bor.12202
Sztybor, K., and Rasmussen, T. L. (2017b). Late glacial and deglacial palaeoceanographic changes at Vestnesa Ridge, Fram Strait: methane seep versus non-seep environments. Palaeogeogr. Palaeoclimatol. Palaeoecol. 476, 77–89. doi:10.1016/j.palaeo.2017.04.001
Thomsen, E., Rasmussen, T. L., Sztybor, K., Hanken, N.-M., Tendal, O. S., and Uchman, A. (2019). Cold-seep fossil macrofaunal assemblages from Vestnesa Ridge, eastern Fram Strait during the past 45 000 years. Polar Res. 38. doi:10.33265/polar.v38.3310
Torres, M. E., Mix, A. C., Kinports, K., Haley, B., Klinkhammer, G. P., McManus, J., et al. (2003). Is methane venting at the seafloor recorded by δ13C of benthonic foraminifera shells? Paleoceanography 18, 1062. doi:10.1029/2002PA000824
Treude, T., Krause, S., Steinle, L., Burwicz, E., Hamdan, L. J., Niemann, H., et al. (2020). Biogeochemical consequences of nonvertical methane transport in sediment offshore northwestern svalbard. JGR Biogeosciences 125, e2019JG005371. doi:10.1029/2019jg005371
Treude, T., Krüger, M., Boetius, A., and Jørgensen, B. B. (2005). Environmental control on anaerobic oxidation of methane in the gassy sediments of Eckernförde Bay (German Baltic). Limnol. Oceanogr. 50, 1771–1786. doi:10.4319/lo.2005.50.6.1771
Vachon, R., Schmidt, P., Lund, B., Plaza-Faverola, A., Patton, H., and Hubbard, A. (2022). Glacially induced stress across the Arctic from the Eemian interglacial to the present – implications for faulting and methane seepage. JGR Solid Earth 127. doi:10.1029/2022jb024272
Vogt, C., Knies, J., Spielhagen, R. F., and Stein, R. (2001). Detailed mineralogical evidence for two nearly identical glacial/deglacial cycles and Atlantic water advection to the Arctic Ocean during the last 90,000 years. Glob. Planet. Change 31, 23–44. doi:10.1016/s0921-8181(01)00111-4
Vogt, P. R., Crane, K., Sundvor, E., Max, M. D., and Pfirman, S. L. (1994). Methane-generated (?) pockmarks on young, thickly sedimented oceanic crust in the Arctic: Vestnesa ridge, Fram strait. Geology 22, 255–258. doi:10.1130/0091-7613(1994)022<0255:mgpoyt>2.3.co;2
Wefer, G., Heinze, P.-M., and Berger, W. H. (1994). Clues to ancient methane release. Nature 369, 282. doi:10.1038/369282a0
Werner, K., Müller, J., Husum, K., Spielhagen, R. F., Kandiano, E. S., and Polyak, L. (2015). Holocene sea subsurface and surface water masses in the Fram Strait – Comparisons of temperature and sea-ice reconstructions. Quat. Sci. Rev. 147, 194–209. doi:10.1016/j.quascirev.2015.09.007
Whiticar, M. J. (1999). Carbon and hydrogen isotope systematics of bacterial formation and oxidation of methane. Chem. Geol. 161, 291–314. doi:10.1016/s0009-2541(99)00092-3
Wollenburg, J. E., Raitzsch, M., and Tiedemann, R. (2015). Novel high-pressure culture experiments on deep-sea benthic foraminifera - evidence for methane seepage-related δ13C of Cibicides wuellerstorfi. Mar. Micropaleontol. 117, 47–64. doi:10.1016/j.marmicro.2015.04.003
Yasuhara, M., Sztybor, K., Rasmussen, T. L., Okahashi, H., Sato, R., and Tanaka, H. (2018). Cold-seep ostracods from the western Svalbard margin: direct palaeo-indicator for methane seepage? J. Micropaleontol. 37, 139–148. doi:10.5194/jm-37-139-2018
Keywords: gas hydrates, contourite deposition, deep-sea cores, shallow seismic mapping, carbon isotopes, deglaciation, Fram Strait
Citation: Rasmussen TL and Nielsen T (2024) Glacial-interglacial sedimentation control on gas seepage exemplified by Vestnesa Ridge off NW Svalbard margin. Front. Earth Sci. 12:1356341. doi: 10.3389/feart.2024.1356341
Received: 15 December 2023; Accepted: 21 March 2024;
Published: 08 April 2024.
Edited by:
Jacek Raddatz, Helmholtz Association of German Research Centres (HZ), GermanyReviewed by:
André Bahr, Heidelberg University, GermanyWolfram Geissler, Alfred Wegener Institute Helmholtz Centre for Polar and Marine Research (AWI), Germany
Copyright © 2024 Rasmussen and Nielsen. This is an open-access article distributed under the terms of the Creative Commons Attribution License (CC BY). The use, distribution or reproduction in other forums is permitted, provided the original author(s) and the copyright owner(s) are credited and that the original publication in this journal is cited, in accordance with accepted academic practice. No use, distribution or reproduction is permitted which does not comply with these terms.
*Correspondence: Tine L. Rasmussen, dGluZS5yYXNtdXNzZW5AdWl0Lm5v