 Dejun Bao1
 Zhilong Zhang
- 1Gansu Zhonghai Security Technology Co., Ltd., Lanzhou, China
- 2College of Civil Engineering and Architecture, Xinjiang University, Urumqi, China
Salt expansion and frost heave are the main diseases of salted frozen soil roadbeds. Salt swelling and frost heave disease are closely related to the salted soil water–salt migration, temperature variation, and salt crystallization amount change. This article establishes a coupled model of water, heat, and salt fields based on the capillary model and the unfrozen water characteristic curve. The study shows that the different initial moisture contents have minimal effects on the location of soil salt migration and aggregation. The different initial salt concentrations have a substantial effect on the soil water–salt migration aggregation position; when the concentration of sodium sulfate increases, different from chloride saline soils, the position of the freezing front fluctuates up and down over time. The water–salt migration and aggregation are smaller in the closed condition, where they are reduced by 38% and 20%, respectively.
1 Introduction
Salinized frozen soil has the dual nature of ordinary salinized soil and frozen soil (Xiao et al., 2018; Davidson et al., 1969). Under the action of external temperature, the pore water repeatedly freezes and melts to cause soil freezing and thawing as well as sinking, and the salts in the pore water repeatedly crystallize and dissolve to cause soil salinization and dissolution sinking, resulting in the double disease of salinization as well as freezing and thawing of engineering facilities constructed on salinized frozen soil (Xiao and Lai, 2018; Niu and Gao, 2015).
The pore water in the soil migrates from the warm to the cold section under unidirectional freezing conditions and aggregates in the freezing fronts, which produces a significant freezing expansion (Gardner, 1958; Zhang et al., 2016). Therefore, frost heave damage in soils is due to water migration. Salt swelling occurs in saline soils due to the crystallization of soluble salts in the soil mass (Huang et al., 2008; Bing and Ma, 2011). In an area of sulfate-salted soil, the solubility of sulfate decreases with temperature, and the sulfate in the soil crystallizes and precipitates, demonstrating a 3.18× volume increase.
Water–salt migration is the leading factor in salt swelling (dissolution subsidence) and frost swelling (thawing and sinking) (Bing et al., 2015; Spaans and Baker, 1996). The current water-blocking measures for saline soil roadbeds in Xinjiang, which are based on coarse-grained filler layers or an additional insulating layer, have already achieved a certain effect in the management of saline frozen soil roadbed diseases (Peng et al., 2023; Peng et al., 2021). However, after the seasonal freezing and thawing, monitoring results indicated that in the upper layer of the constructed roadbed, the water content doubled in winter compared to summer, and the accumulation of salts increased by more than 10 times (Wang et al., 2019; Watanabe and Flury, 2008). This finding indicates that the water barrier measures taken only hindered the upward migration rate of water but did not insulate it. In the winter process of moisture migration to the freezing front, the formation of sub-condensation ice, frost expansion, salt with moisture migration aggregation, insulation layer corrosion, and the occurrence of salt expansion contributed to the failure of the related disease prevention measures (Lai et al., 2021; Zhang et al., 2021a).
The capillary model is an important method of studying water migration in soil. The study introduces a hydraulic conductivity model for frozen soils, accounting for water films. It partitions water in capillary tubes into free water and water films with varying dynamic viscosities (Ming et al., 2022). Based on the discontinuous noncircular capillary bundle model, it predicts the hydraulic conductivity of warm, saturated frozen soil, primarily determined by the unfrozen water content, regulated by temperature and soil particle size distribution (Chai et al., 2018). The study concludes that before freezing, NaCl does not crystallize and has minimal impact on the permeability coefficient. However, Na2SO4 crystallizes, blocking pores and reducing the permeability coefficient as temperature decreases. The freezing temperature significantly impacts the permeability coefficient (Liu et al., 2023; Zhang and Guan, 2022).
Researchers developed various models to understand the mechanisms and control of salt expansion. One model, validated by uniaxial freezing tests, focuses on the hydro-thermal-salt-mechanical coupling in saturated and unsaturated salinized soil under unidirectional freezing (Wang et al., 2016). The model introduced the concept of an uncrystallized zone, positively related to the cold-end temperature. Considering sodium sulfate crystallization, it predicts the coupled transfer of water, heat, and solute in saline loess (Xu et al., 2021). The study corrected the hydrothermal salt force coupled equations for coarse-grained sulfate saline soil roadbeds, providing insights into the water and salt migration mechanism in the roadbed (Zhang et al., 2020).
In conclusion, the driving force and permeability coefficient are key parameters in the water–salt migration model of salinized frozen soil. Therefore, this paper uses the capillary model and the unfrozen water characteristic curve to study the water–salt migration law of salinized positive frozen soil.
2 Materials and methods
2.1 Temperature field control equations
Conduction, radiation, and convection are the three main modes of heat transfer. Heat conduction is the main mode of heat transfer in salinized frozen soil in nature, and the effects of convection and radiation can be neglected (Luo et al., 2023; He et al., 2021). Assuming that the salinized frozen soil is an isotropic continuous medium, unfrozen water, crystalline salt, soil particles, and ice crystals are incompressible. Ignoring convective heat due to moisture seepage, according to Fourier’s law of heat conduction and the law of energy conservation, the crystallization of moisture salts will release heat (Wang et al., 2016; Zhang et al., 2020). Treating the phase changes of water and salt crystallization as heat sources, the differential equation of heat conduction in salinized frozen soil is Equation 1 (Deng et al., 2021):
where
where
where
2.2 Equation of control for the moisture field
Unfrozen water always exists in the frozen soil. The migration of water follows Darcy’s law (Ming et al., 2022; Andersland et al., 1996). According to Richard’s Equation 4 (Chai et al., 2018; Burt and Williams, 1976), the total water content of saline soil comprises three components: ice, unfrozen water, and mannite crystalline water:
where
The ratio of ice to unfrozen water volume content as a function of temperature with temperature reduction is as follows (Bai et al., 2015; Watanabe and Osada, 2016) (Equation 5):
where
The differential equation for water infiltration in salted frozen soil is Equation 6
where
where
where
The permeability coefficient of salinized frozen soil
As the temperature decreases, the solubility of salt in solution decreases, leading to the crystallization and precipitation of salt. The relationship between the volume fraction of crystallized salt and the volume fraction of unfrozen water, as well as the solution concentration, is established (Huang et al., 2008) as follows (Equation 10):
where n(T) is the solubility curve of easily soluble salts in the pores of the soil, which is a function of temperature.
If it is assumed that the salt solution is contained in a capillary tube with a radius of Ri (i = 1 − n), the solution is always saturated after the salt precipitation. If the supersaturation of the solution is not taken into account, the following Equation 11 is obtained:
where C is the initial mass concentration of solution, C′ is the subsequent mass concentration of solution after cooling, Ri is the initial pore radius, and Ri′ is the subsequent pore radius after the salt precipitation due to cooling. Assuming that the salt crystals are evenly deposited on the pore walls after salt precipitation, the quantity of salt crystallization equals the amount of variation in the pore (Equation 12):
where
The following equation can be used to determine the connection between temperature T and pore radius
where Lf is the latent heat of ice melting, Lf = 3.34 × 10⁵ J/Kg; Ti is the freezing temperature of saline soil; T is the temperature of saline soil;
Using the unfrozen water characteristic curve, assuming the temperature range (T0, Tn) is divided into n equal parts, for every decrease of △θu in the unfrozen water content, the corresponding k increases by 1. When k = 0, ks represents the permeability coefficient of saturated thawed soil under the same conditions as Equation 15.
where μ∞ is the viscosity of volumetric water, which is a function of temperature (Thomas and Sansom, 1995) and can be represented as
Therefore, the permeability coefficient of saturated salinized frozen soil is expressed as (Zhang and Guan, 2022) Equation 16
where
The number of pores with diameter
where
Therefore, the permeability coefficient of unsaturated salinized frozen soil is expressed as Equation 19
2.3 Control equations for the salinity field
Convection, molecular diffusion, and mechanical dispersion are the main modes of salt transport in solutes. Amongst these modes, molecular diffusion and mechanical dispersion are collectively known as hydrodynamic dispersion (Jian et al., 2021; Ma et al., 2016).
Convection, which is the migration of salts along with water in the soil, has a significant effect on soil solute fluxes. The solute flux due to convection is related to the soil water flux and the concentration of the solution and can be described by the following Equation 20 (Ishizaki et al., 1996):
where
Molecular diffusion is the process of solute transport by ions or molecules due to Brownian motion (Wu et al., 2017; Xiao et al., 2015). This process is irreversible. It makes a solution in the presence of a concentration gradient, and the solution tends to be homogeneous. Molecular diffusion in soil pore solutions can also be described by Fick’s first law as Equation 21:
where
Mechanical dispersion is due to the non-homogeneity of the soil. Therefore, the water flow in the soil pores has different magnitudes and directions, and the solute spreads to other ranges. The solute flux due to mechanical dispersion can be approximated by Fick’s law as Equation 22 (Deng, 2006):
where
The solute hydrodynamic dispersion effect can be described by the following Equation 23:
where the total salt content comprises the readily soluble salt content in unfrozen water, the crystalline salt precipitated by ice crystallization, and the crystalline salt after solubility reduction as Equation 24:
Therefore, the salt field control (Equation 25) is (Liu et al., 2021; Zhao and Luo, 2019)
3 Model validation
3.1 Coupled hydrothermal salt numerical model
The results of the model calculations of sulfate and chloride saline soils under open conditions were compared with the experimental results to verify the validity and feasibility of the above numerical coupled hydrothermal salt model. During the temperature drop process of the soil sample, the unfrozen water content is determined by Formula 17, the freezing temperature Ti of the salinized soil, and the crystallization of salt is obtained from the water–salt (Na2SO4, NaCl) binary phase diagram. As shown in Figure 1, the freezing temperature Ti curves of saline soil are AB(Na2SO4) and AB′(NaCl), and the solubility curves of salt n(T) are BC(Na2SO4) and BC′(NaCl). These two curves intersect at the eutectic point B (Niu and Cheng, 2002). When the soil temperature drops to TX, the corresponding amount of unfrozen water content, the freezing temperature, and salt crystallization are calculated from the relationship.
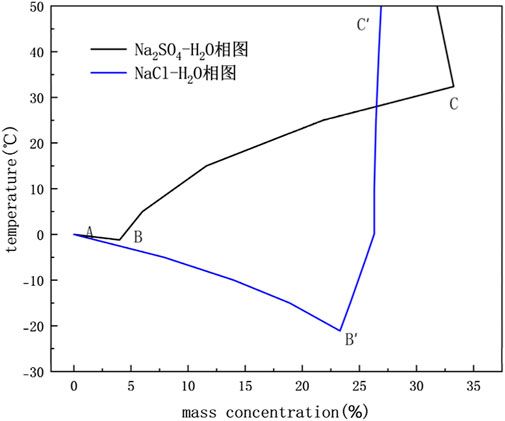
Figure 1. Phase diagram of the aqueous–salt binary system (Niu and Cheng, 2002).
A numerical simulation of water–salt (Na2SO4,
Both salt crystallization and ice occur during the cooling process of Na2SO4 saline soil. However, in the calculation of
These soil parameters (Xu et al., 2021; Zhang et al., 2021b; Tang et al., 2023; Wan et al., 2015) are used for the model calculations (Table 1).
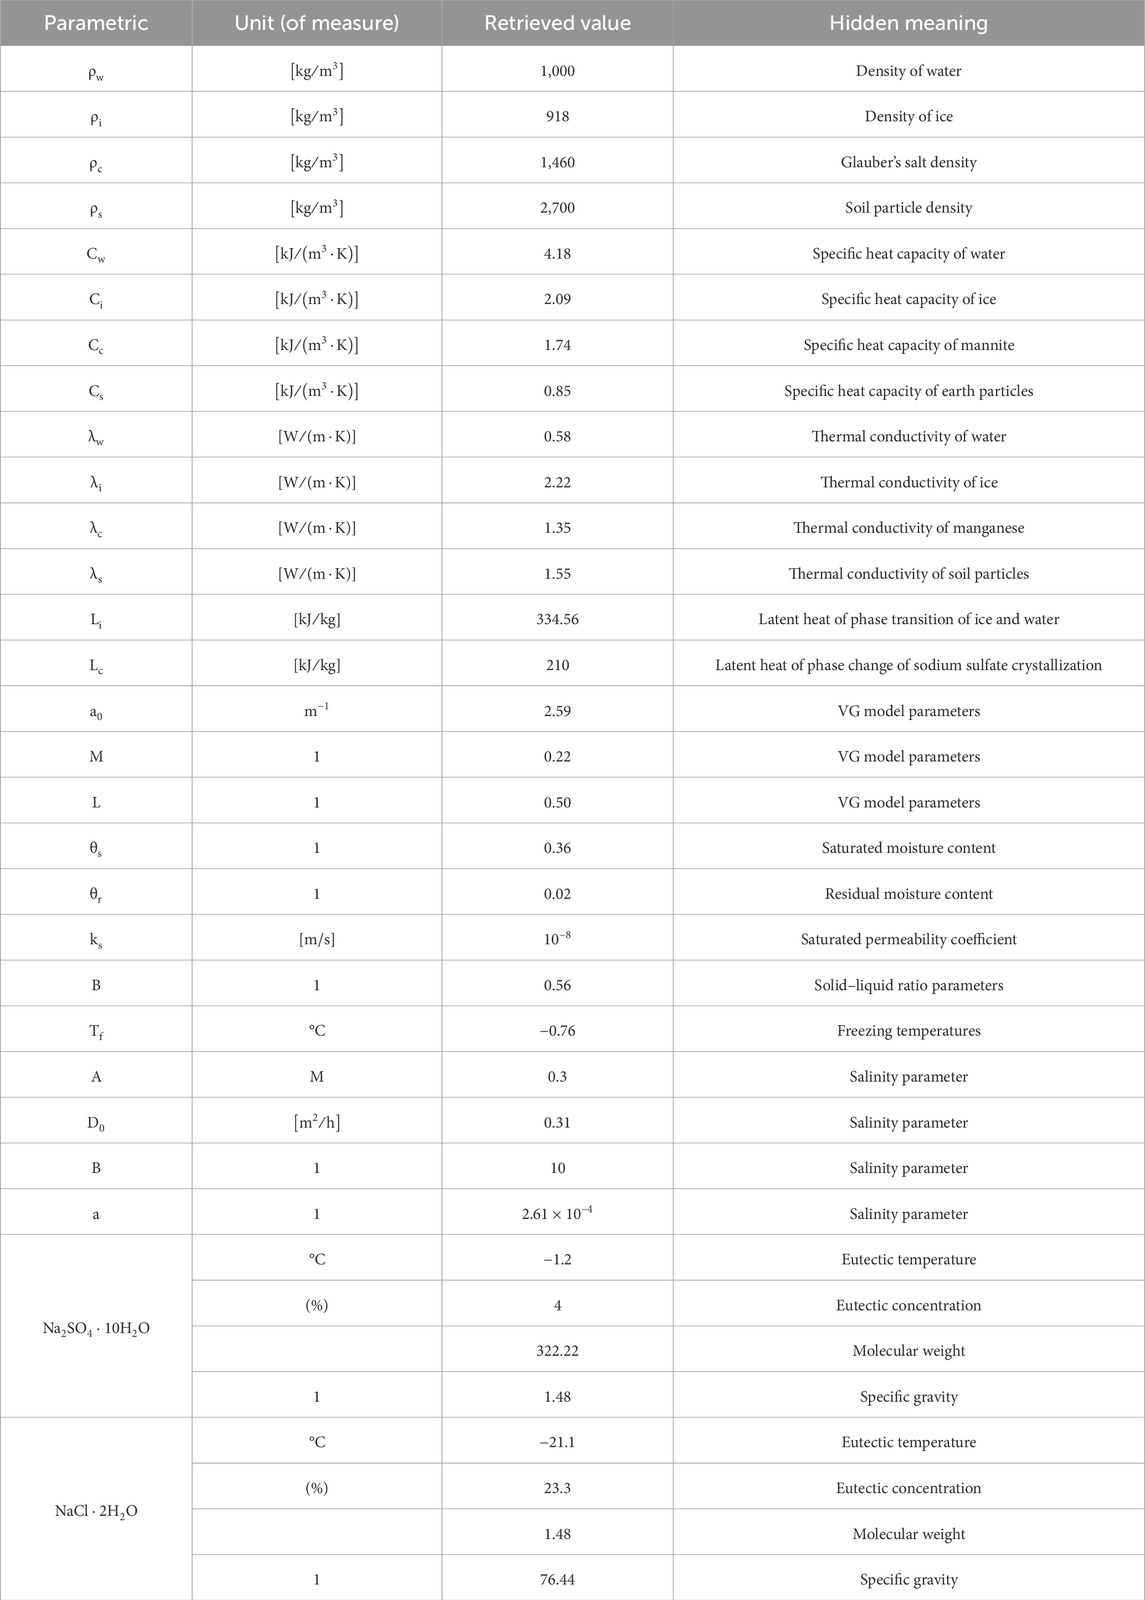
Table 1. Basic soil parameters.
The model assumes the following:
1. The pores are not deformed, and the porosity remains constant;
2. The soil is not frozen at the initial moment;
3. The temperature, water content, and solute concentration of the specimen are uniformly distributed.
COMSOL was used to simulate the 2D frozen soil columns using a map illustration of a sub-grid with 1,200 cells, 148 boundary cells, and four vertex cells (Figures 2, 3). The model calculation time is 96 h, the calculation result output step is 1, and the solver step is set to intermediate.
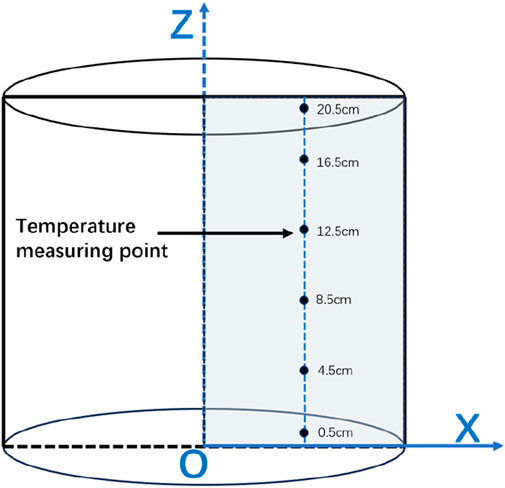
Figure 2. Geometric model for numerical computation.
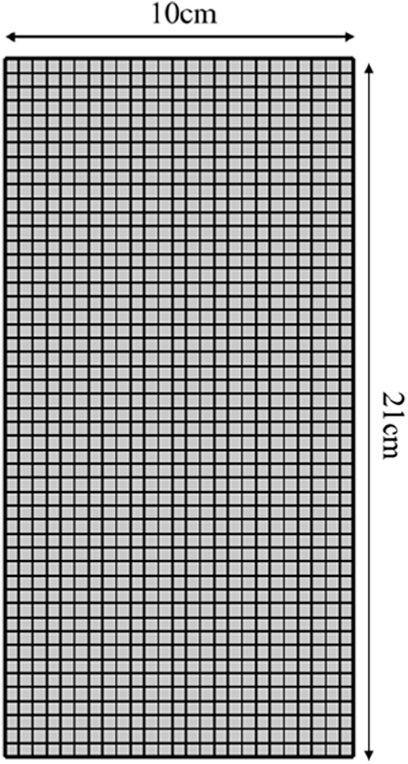
Figure 3. Finite element model meshing.
3.2 Numerical simulation validation
To verify the accuracy of the model, it was configured with the same initial conditions and boundary conditions as the test (Zhang, 2020). Under water replenishment conditions, numerical simulations of unidirectional freezing of Na2SO4 saline soil were conducted, and the computed results were compared with test data. The variables of the equation, the boundary conditions, and the initial conditions set are shown in Table 2.
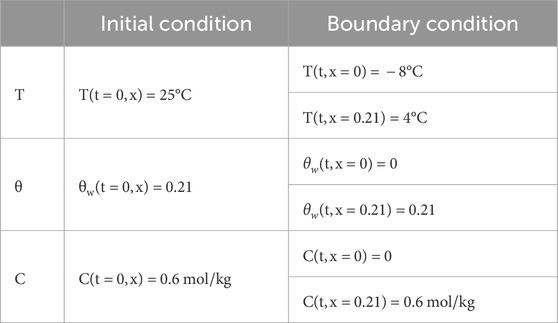
Table 2. Initial and boundary conditions in model calculation.
3.2.1 Temperature field result analysis
The numerical simulation temperature field distribution results in the freezing test are consistent with the measured results (MR) of the test (Figure 4). The trends of the temperature curves at different locations are more or less the same, and the temperature change displays stage characteristics: rapid cooling, slow cooling, and stabilization stages. In the rapid cooling stage, the temperature at each location of the soil column rapidly decreases; the temperature rapidly decreases when it is close to the boundary of the cold end. In the slow cooling phase, the required time for slow cooling at various locations is different, whilst the time required for the slow cooling phase is short when it is close to the cold-end temperature boundary. After 20 h of cooling, the internal temperature reaches the stabilization stage, and the temperature generally displays some fluctuations. Meanwhile, the difference between the calculated and test results for the freezing time of 10–20 h is substantial because the calculated results are all based on ideal conditions. The porosity may change in the freezing process, the water and salt contents of the specimen may not be uniformly distributed along the height direction, and the external temperature has a certain effect on the sidewall of the soil column.
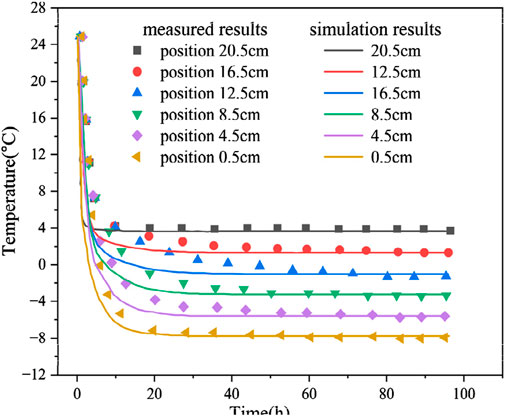
Figure 4. Temperature field distribution in the freezing test.
Temperature distribution of soil regarding and disregarding the latent heat of moisture phase change is shown in Figure 5, the initial salt concentration of the soil is 0.6 mol/kg and the water content is 20%, respectively. The maximum temperature difference in the middle of the soil column, considering and disregarding the latent heat of moisture phase change, is 1.22°C. The migration of moisture from the unfrozen to the frozen zone will release heat due to the liquid-to-solid transition and the existence of a temperature gradient, which has a delaying effect on the soil temperature reduction.
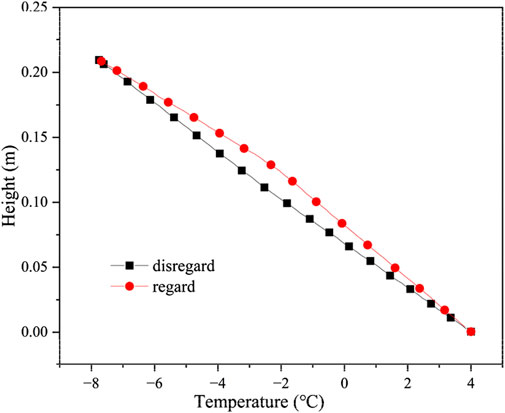
Figure 5. Temperature distribution of soil regarding and disregarding the latent heat of moisture phase change.
The effect of salt phase transition on temperature for a saline soil with an initial solution concentration of 0.6 mol/kg and a soil salt content of 1.5% sulfuric acid is shown in Figure 6. When the boundary conditions, soil condition, and initial water content are the same, the maximum temperature difference in the soil is only 0.253°C when considering and disregarding the latent heat of crystallization of sodium sulfate. Which is a relatively smaller effect on the temperature gradient compared with the moisture phase change. This phenomenon is mainly due to the lesser amount of latent heat released by the crystalline salt with the same volume content as ice crystals and the smaller salt content of the soil compared to the water content.
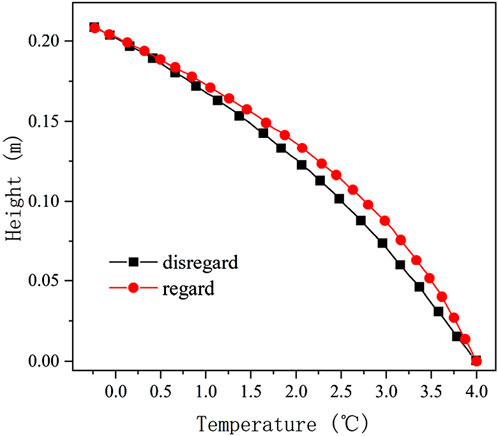
Figure 6. Temperature distribution of soil regarding and disregarding the latent heat of salt crystallization.
3.2.2 Moisture field analysis of results
The numerical simulation results of the freezing test are consistent with the measured test results (Figure 7). These results are further compared to determine the consistency of the total volumetric water content test results and the calculation results in the lower part of the soil column. Meanwhile, the total volumetric water content calculation results oscillate in the upper part of the specimen, which is only partially in agreement with the test results. This finding is mainly due to the total volume water content measurement method, which aims to cut the specimen in layers and then use the drying method to measure the distribution of the total volume of water content along the height of the specimen, resulting in insufficiently precise test results.
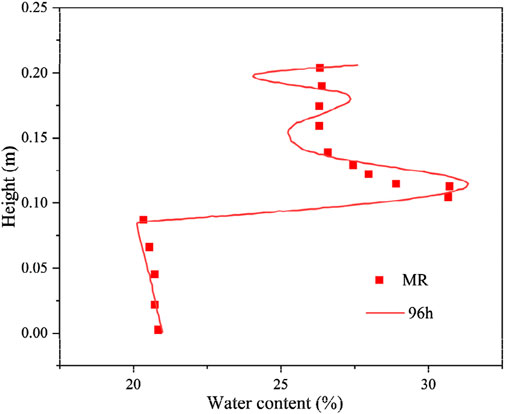
Figure 7. Distribution of water content in freezing tests.
The calculated results of the distribution of the total volumetric water content of the soil column along the specimen height at different moments are shown in Figure 8. The total volumetric water content in the unfrozen zone is always maintained at a constant value because of the recharge water at the bottom. After soil freezing, the water migrated upward, and a significant redistribution of the internal water occurred. This redistribution is attributed to moisture crystallization in the process of temperature reduction, forming a negative pressure head that draws moisture upwards. Simultaneously, as multiple freezing fronts are formed during the freezing process of the soil column, moisture aggregation occurs at several different locations, and the total volumetric water content is distributed along the specimen height oscillations. The maximum total volumetric water content distribution is also observed at the last formed freezing fronts with time, and the total volumetric water content is increased by approximately 52%.
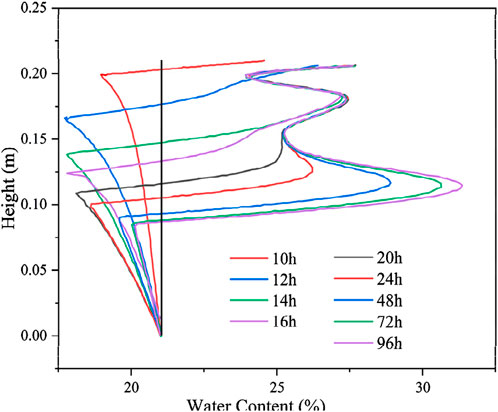
Figure 8. Distribution of water content at different moments in the freezing test.
3.2.3 Salt field analysis of results
The distribution results of solution concentration in the numerical simulation in the freezing test are consistent with the test results (Figure 9A). The upper soil has a low temperature and solution concentration after reaching stability, and the lower soil has a high temperature and solution concentration after reaching stability. At the freezing of the soil, the calculated results are in good agreement with the test results; at the freezing front, a certain difference is observed between the calculated and test results, which may be due to the intense water–salt migration at the freezing front as well as the salt–ice crystallization. The numerical simulation results of the salt content distribution after 96 h of freezing are consistent with the experimental results (Figure 9B). In the lower part of the soil, only the salts undergo a phase change, and the moisture does not undergo a phase change. Therefore, the calculation model is more in line with the actual situation, and the calculation results are in good agreement with the test results. In the upper part of the soil, a certain difference exists between the calculation and test results because the moisture and salt will undergo phase changes, thereby influencing and restraining each other, and the change in moisture and salt is remarkably complicated. The salt phase change process generally includes four stages: subcooling, jumping, constant, and decreasing stages. Meanwhile, the calculation model simplifies the process of salt precipitation after freezing of the soil. At high temperatures, the salt will be precipitated as long as the solution concentration is greater than the solution degree; at low temperatures, the salt is precipitated in a substantially short time under the action of ice self-purification and precipitate crystals. Simultaneously, the model disregards the supersaturation of the solution; the salt will precipitate as long as the solution concentration is less than the solution degree, which is relatively different from the actual situation.
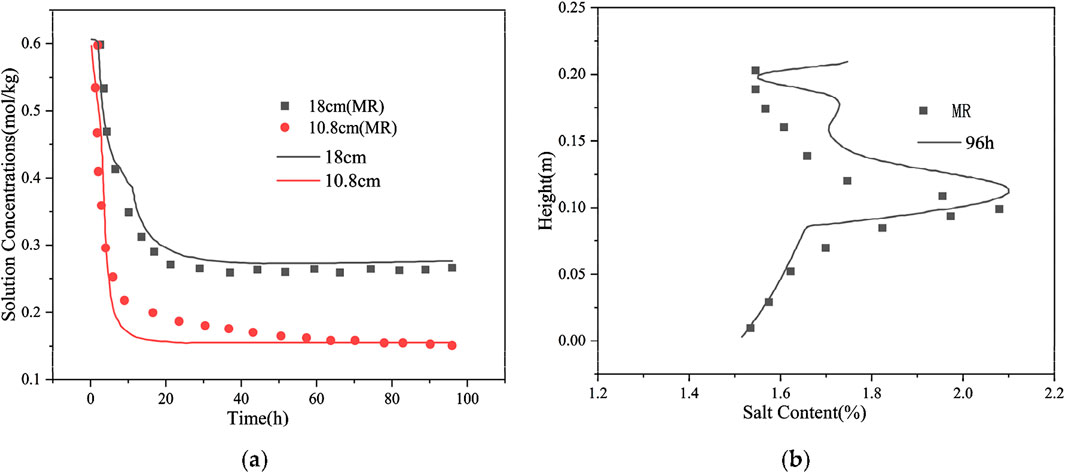
Figure 9. Distribution of solution concentrations and salt content in the freezing test. (A) Distribution of solution concentrations in the freezing test; (B) Salt content along depth distribution in the freezing tests.
4 Results and discussion
The model was used to calculate the freezing behavior of Na2SO4 and NaCl saline soils with water replenishment on the bottom surface under different conditions. In the Na2SO4 saline soil, the initial salt concentration is 0.4 mol/kg, 0.6 mol/kg, 0.8 mol/kg, and 1.0 mol/kg; the salt content of the soil is 1%, 1.5%, 2%, and 2.5%, respectively.
In the NaCl saline soil, the initial salt concentrations were all 0.6 mol/kg, the initial volumetric water contents were 0.1, 0.21, and 0.3, and the salt content of the soil was divided into 0.294%, 0.618%, and 0.883%, respectively.
4.1 Water–salt migration patterns in sulfate-salted soils
The distribution of salt crystallization amount with different initial Na2SO4 concentrations is shown in Figure 10. According to the theoretical calculation model of freezing temperature, the freezing temperature of Na2SO4 soil comprises two parts: moisture activity and pore water freezing temperature. When the pore water freezing temperature of the sample is −0.76°C, the freezing temperature of the soil is −2.35°C, −2.5°C, −2.01°C and −2.22°C; at this time, the maximum crystalline amount of the salts is 0.263, 0.428 and 0.483. The maximum crystallization amount of salt is 0.263, 0.428, 0.483, and 0.6, and the salt crystallization amount is large under high initial salt content.
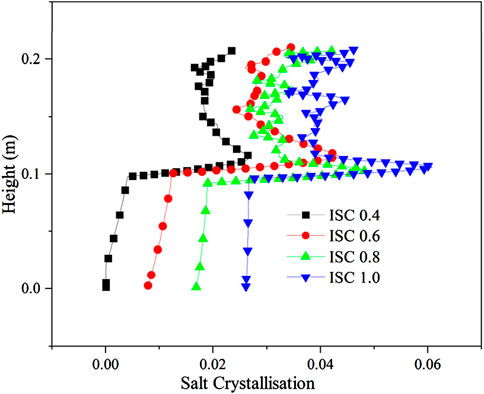
Figure 10. Distribution of salt crystallization volume for different initial solution concentrations.
Due to the high initial temperature and large initial salt concentration, the salt crystallized in the upper and lower parts of the soil, and the upper part crystallized more than the lower part of the soil due to the low temperature. As the freezing temperature shows a decreasing, increasing, and then decreasing trend, the location of salt crystallization aggregation displays an increasing, decreasing, and then increasing trend, and the impact on the upper part of the sample is substantial when the location of salt crystallization is high.
The distribution of aqueous salt with different initial water contents (IWC) is shown in Figure 11. When the initial salt concentrations were all 0.6 mol/kg, the initial volumetric water contents were 0.1, 0.21, and 0.3, and the soil salt contents were 0.714%, 1.500%, and 2.143%, respectively. Thus, the freezing temperatures were all approximately −2.5°C. Due to similar initial salt concentrations, the soil freezing temperature is the same under different initial water contents, the location of the soil freezing front is consistent, and the locations of moisture salt migration and aggregation are also the same. The latent heat of moisture phase change has a certain delaying effect on cooling. Thus, the migration time of moisture and salt upward becomes longer when the water content is large, and the location of moisture and salt aggregation is slightly higher.
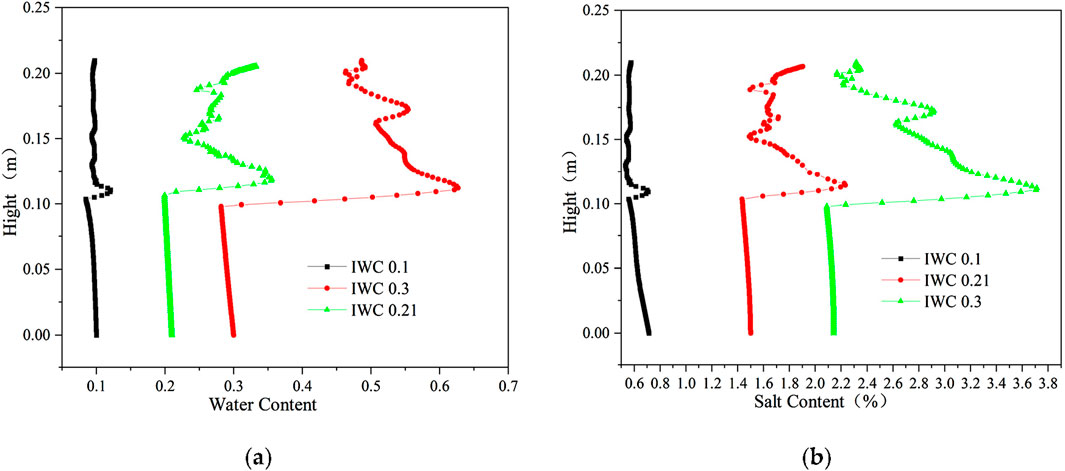
Figure 11. Distribution of aqueous salt along the specimen height after freezing for 96 h with different initial water contents. (A) Water content. (B) Salt content (Na2SO4).
The distribution of aqueous salt with different initial salt concentrations is shown in Figure 12. When the salt concentration is 0.4 mol/kg, 0.6 mol/kg, 0.8 mol/kg, and 1.0 mol/kg, the initial volumetric water content is 0.21, the salt content of the soil is 1%, 1.5%, 2%, and 2.5%, respectively, and the freezing temperatures of soil are −2.35°C, −2.5°C, −2.01°C, and −2.22°C, respectively. As the salt concentration increases, the soil freezing temperature initially decreases, increases, and then decreases again, and the soil freezing front initially rises, falls, and then rises (2.01°C, −2.22°C). Moreover, the figures indicate that as the soil freezing temperature decreases, increases, and then decreases again with the rise in salt concentration, the soil freezing front rises, decreases, and then rises again, and there is a tendency for the location of the water–salt migration and aggregation to rise, fall, and then rise again. However, the location of water–salt aggregation is the same due to the small difference in freezing temperature.
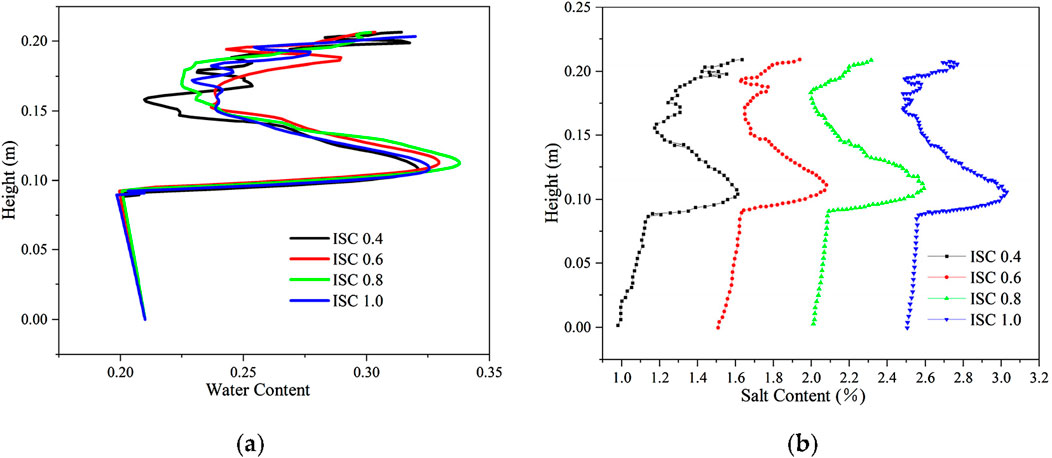
Figure 12. Distribution of aqueous salt along the specimen height after freezing for 96 h with different initial salt concentrations. (A) Water content. (B) Salt content.
4.2 Water–salt migration patterns in chlorine saline soils
The distribution of aqueous salt with different initial water contents is shown in Figure 13. When the initial NaCl concentrations were all 0.6 mol/kg, and the initial volumetric water contents were 0.1, 0.21, and 0.3, the NaCl content of the soil was divided into 0.294%, 0.618%, and 0.883%, respectively, and the freezing temperatures were all approximately −2.99°C. Due to the same initial salt concentration, the soil freezing temperature remains consistent under different initial water contents, the location of the soil freezing front is the same, and the location of moisture salt migration and aggregation also remains the same. The latent heat of moisture phase change has a certain delaying effect on the cooling. When the water content is large, the migration time of moisture and salt upward lengthens, and the location of moisture and salt aggregation is slightly elevated.
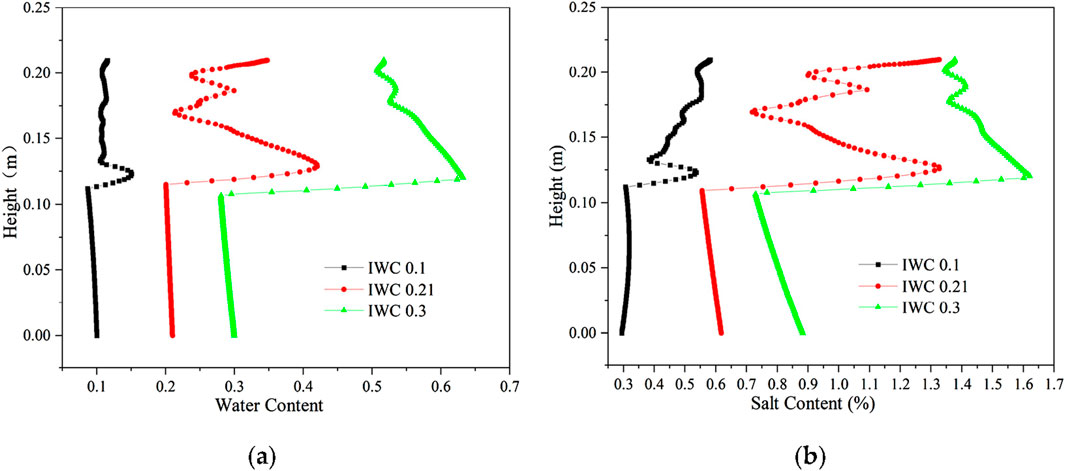
Figure 13. Distribution of aqueous salt along the specimen height after freezing for 96 h with different initial water contents. (A) Water content. (B) Salt content (NaCl).
The distribution of aqueous salt with different initial NaCl concentrations is shown in Figure 14. The initial volumetric water content is 0.21; the NaCl concentrations are 0.4 mol/kg, 0.6 mol/kg, 0.8 mol/kg, and 1.0 mol/kg; the soil salt contents are 0.412%, 0.618%, 0.824%, and 1.030%, respectively; the solution freezing temperatures are taken as −1.46°C, −2.23°C, −2.98°C, and −3.74°C, respectively, and the soil freezing temperatures are −2.22°C, −2.99°C, −3.74°C, and −4.74°C, respectively. With the increase in salt concentration, the soil freezing temperature gradually decreases, the soil freezing front gradually moves upward, and the location of water–salt aggregation steadily rises. Compared with sulfate-salted soil, the permeability coefficient is relatively larger due to the absence of salts blocking the pores, and the upward water–salt migration is high. When the freezing temperature is high, the aggregation of the water–salt position in the upper soil is high, and the water–salt displays an oscillatory distribution; when the freezing temperature is low, the aggregation position of water in the upper soil decreases.
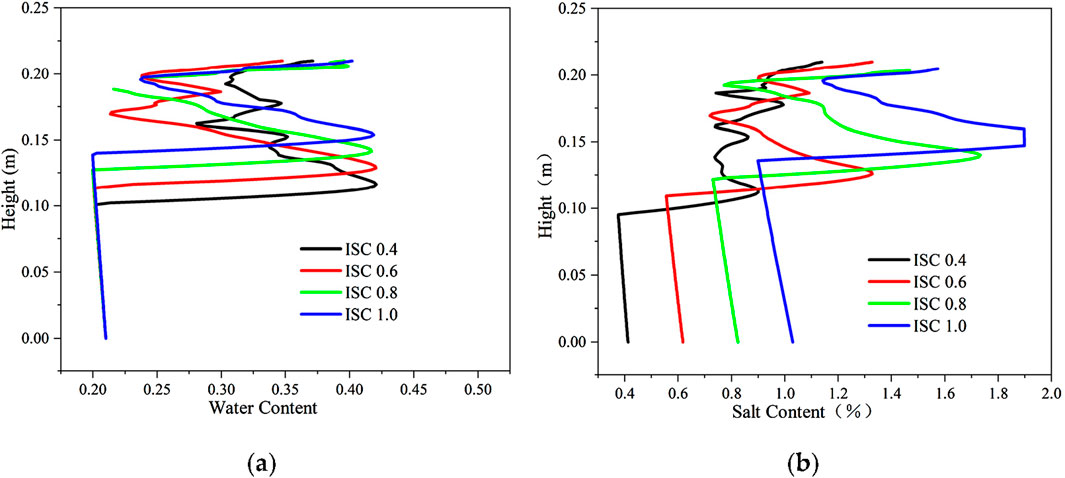
Figure 14. Distribution of aqueous salt along the specimen height after freezing for 96 h with different initial salt concentrations. (A) Water content. (B) Salt content (NaCl).
5 Conclusion
This article establishes a coupled model of water, heat, and salt fields based on the capillary model and the unfrozen water characteristic curve. The calculation and experimental results were compared and analyzed, which verified the reliability of the hydrothermal–salt coupling model in analyzing the salinization frozen soil problem. The conclusions are:
1. Different initial moisture contents have minimal effects on the location of soil salt migration and aggregation. When the moisture content is high, the water–salt migrates upward for a long time due to the gradual temperature reduction, and the location of water–salt migration and aggregation is slightly elevated upward.
2. Different initial salt concentrations have a substantial effect on the soil water–salt migration aggregation position. When the concentration of sodium chloride increases, the location of the water–salt migration and aggregation gradually move upward. When the concentration of sodium sulfate increases, unlike chloride saline soils, the position of the freezing front fluctuates up and down over time.
3. Compared with the open system with lower recharge, the water–salt migration and aggregation are smaller in the closed condition and are reduced by 38% and 20%, respectively, and the water–salt content in the lower part gradually decreases with increased freezing time.
Data availability statement
The original contributions presented in the study are included in the article/supplementary material; further inquiries can be directed to the corresponding author.
Author contributions
DB: Methodology, Conceptualization, Writing–review and editing. ZZ: Funding acquisition, Project administration, Supervision, Writing–original draft. ZY: Data curation, Methodology, Investigation, Writing–review and editing. AZ: Writing–original draft. GL: Data curation, Investigation, Writing–original draft.
Funding
The author(s) declare that financial support was received for the research, authorship, and/or publication of this article. This research was funded by the Tianshan Talent Training Program (2023TSYCLJ0055) and the National Natural Science Foundation of China (52068066 and 52368052).
Conflict of interest
Author DB was employed by Gansu Zhonghai Security Technology Co., Ltd.
The remaining authors declare that the research was conducted in the absence of any commercial or financial relationships that could be construed as a potential conflict of interest.
Publisher’s note
All claims expressed in this article are solely those of the authors and do not necessarily represent those of their affiliated organizations, or those of the publisher, the editors, and the reviewers. Any product that may be evaluated in this article, or claim that may be made by its manufacturer, is not guaranteed or endorsed by the publisher.
References
Andersland, O. B., Wiggert, D. C., and Davies, S. H. (1996). Hydraulic conductivity of frozen granular soils. J. Environ. Eng. 122, 212–216. doi:10.1061/(asce)0733-9372(1996)122:3(212)
Bai, Q., Li, X., and Tian, Y. (2015). Equations and numerical simulation for coupled water and heat transfer in frozen soil. Chin. J. Geotech. Eng. 37, 131–136.
Bing, H., He, P., and Zhang, Y. (2015). Cyclic freeze–thaw as a mechanism for water and salt migration in soil. Environ. Earth Sci. 74, 675–681. doi:10.1007/s12665-015-4072-9
Bing, H., and Ma, W. (2011). Experimental study on freezing point of saline soil. J. Glaciol. Geocryol. 33, 1106–1113.
Burt, T. P., and Williams, P. J. (1976). Hydraulic conductivity in frozen soils. Earth Surf. Process. 1, 349–360. doi:10.1002/esp.3290010404
Chai, M., Zhang, J., Zhang, H., Mu, Y., Sun, G., and Yin, Z. (2018). A method for calculating unfrozen water content of silty clay with consideration of freezing point. Appl. Clay Sci. 161, 474–481. doi:10.1016/j.clay.2018.05.015
Chen, L., and Zhang, X. (2020). A model for predicting the hydraulic conductivity of warm saturated frozen soil. Build. Environ. 179, 106939. doi:10.1016/j.buildenv.2020.106939
Davidson, J. M., Stone, L. R., Nielsen, D. R., and Larue, M. E. (1969). Field measurement and use of soil-water properties. Water Resour. Res. 5, 1312–1321. doi:10.1029/wr005i006p01312
Deng, Q., Liu, X., Zeng, C., He, X., Chen, F., and Zhang, S. (2021). A freezing-thawing damage characterization method for highway subgrade in seasonally frozen regions based on thermal-hydraulic-mechanical coupling model. Sensors 21, 6251. doi:10.3390/s21186251
Deng, Y. (2006). Experimental study of permeability coefficient of saline soils. J. Glaciol. Geocryol. 28, 772–775.
Gardner, W. R. (1958). Some steady-state solutions of the unsaturated moisture flow equation with application to evaporation from a water table. Soil Sci. 85, 228–232. doi:10.1097/00010694-195804000-00006
He, P., Xiong, M., Mu, Y., Dong, J., and Na, X. (2021). Experimental study on frost-heaving force development of Tibetan clay subjected to one-directional freezing in an open system. Adv. Civ. Eng. 2021, 1–13. doi:10.1155/2021/6626149
Huang, D.-M., Sendner, C., Horinek, D., Netz, R. R., and Bocquet, L. (2008). Water slippage versus contact angle: a quasiuniversal relationship. Phys. Rev. Lett. 101, 226101. doi:10.1103/physrevlett.101.226101
Ishizaki, T., Maruyama, M., Furukawa, Y., and Dash, J. (1996). Premelting of ice in porous silica glass. J. Cryst. Growth. 163, 455–460. doi:10.1016/0022-0248(95)00990-6
Jian, X., Lan, W., Ren, C., Zhou, X., Wang, S., and Yuan, J. (2021). Modeling of coupled transfer of water, heat and solute in saline loess considering sodium sulfate crystallization. Cold Reg. Sci. Technol. 189, 103335. doi:10.1016/j.coldregions.2021.103335
Lai, Y.-M., You, Z.-M., and Zhang, J. (2021). Constitutive models and salt migration mechanisms of saline frozen soil and the-state-of-the-practice countermeasures in cold regions. Sci. Cold Air Reg. 13, 1–17.
Liu, G., Zhang, Z., Cheng, Z., Hao, G., Hao, Y., and Fu, T. (2023). Study on the permeability coefficient model of salinized frozen soil based on unfrozen water content curve. Front. Earth Sci. 10, 1102748. doi:10.3389/feart.2022.1102748
Liu, J., Yang, P., and Yang, Z.-J. (2021). Water and salt migration mechanisms of saturated chloride clay during freeze-thaw in an open system. Cold Reg. Sci. Tech. 186, 103277. doi:10.1016/j.coldregions.2021.103277
Luo, C., Yu, Y., Zhang, J., Tao, J. y., Ou, Q. j., and Cui, W. h. (2023). Thermal-water-salt coupling process of unsaturated saline soil under unidirectional freezing. J. Mt. Sci. 20, 557–569. doi:10.1007/s11629-022-7652-7
Ma, M., Bing, H., and Li, G.-Y. (2016). Experimental research on unfrozen water content of sodium sulphate saline soil. J. Glaciol. Geocryol. 38, 963–969.
Ming, F., Pei, W., Zhang, M., and Chen, L. (2022). A hydraulic conductivity model of frozen soils with the consideration of water films. Eur. J. Soil Sci. 73, e13210. doi:10.1111/ejss.13210
Niu, D., and Cheng, F. (2002) Phase diagrams of aqueous salt systems and their applications. M. Phase diagrams of aqueous salt systems and their applications.
Niu, X., and Gao, J. (2015). Expression for volume change of sulphate saline soil considering salt expansion and frost heave. Chin. J. Geotech. Eng. 37, 755–760.
Peng, E. X., Hu, X. Y., Sheng, Y., Wu, J. C., Cao, W., Yang, Q., et al. (2023). Thermal effect of the accumulated water with different depths on permafrost subgrade in cold regions. Adv. Clim. Change Res. 14, 179–189. doi:10.1016/j.accre.2022.08.003
Peng, E. X., Sheng, Y., Hu, X. Y., Wu, J. C., and Cao, W. (2021). Thermal effect of thermokarst lake on the permafrost under embankment. Adv. Clim. Change Res. 12, 76–82. doi:10.1016/j.accre.2020.10.002
Spaans, E. J. A., and Baker, J. M. (1996). The soil freezing characteristic: its measurement and similarity to the soil moisture characteristic. Soil Sci. Soc. Am. J. 60, 13–19. doi:10.2136/sssaj1996.03615995006000010005x
Tang, Q., Chen, Y., Jia, R., Guo, W., Chen, W., Li, X., et al. (2023). Effect of clay type and content on the mechanical properties of clayey silt hydrate sediments. J. Pet. Sci. Eng. 220, 111203. doi:10.1016/j.petrol.2022.111203
Thomas, H. R., and Sansom, M. R. (1995). Fully coupled analysis of heat, moisture, and air transfer in unsaturated soil. J. Eng. Mech. 121(3), 392–405.
Wan, X., Lai, Y., and Wang, C. (2015). Experimental study on the freezing temperatures of saline silty soils. Permafr. Periglac. Process. 26, 175–187. doi:10.1002/ppp.1837
Wang, D., Liu, J., and Li, X. (2016). Numerical simulation of coupled water and salt transfer in soil and a case study of the expansion of subgrade composed by saline soil. Procedia Eng. 143, 315–322. doi:10.1016/j.proeng.2016.06.040
Wang, X., Chen, R., Liu, G., Yang, Y., Song, Y., Liu, J., et al. (2019). Spatial distributions and temporal variations of the near-surface soil freeze state across China under climate change. Glob. Planet. Change. 172, 150–158. doi:10.1016/j.gloplacha.2018.09.016
Watanabe, K., and Flury, M. (2008). Capillary bundle model of hydraulic conductivity for frozen soil. Water Resour. Res. 44, 1–9. doi:10.1029/2008wr007012
Watanabe, K., and Osada, Y. (2016). Comparison of hydraulic conductivity in frozen saturated and unfrozen unsaturated soils. Vadose Zone J. 15, 1–7. doi:10.2136/vzj2015.11.0154
Wu, K., Chen, Z., Li, J., Li, X., Xu, J., and Dong, X. (2017). Wettability effect on nanoconfined water flow. Proc. Natl. Acad. Sci. U.S.A. 114, 3358–3363. doi:10.1073/pnas.1612608114
Xiao, B., Tu, X., Ren, W., and Wang, Z. (2015). Modeling for hydraulic permeability and Kozeny–Carman constant of porous nanofibers using a fractal approach. Fractals 23, 1550029. doi:10.1142/s0218348x15500292
Xiao, Z., and Lai, Y. (2018). Study on water and salt transfer mechanism in saline soil under freezing-thawing and dry-wet conditions. Chin. J. Rock Mech. Eng. 37, 3738–3746.
Xiao, Z., Lai, Y., and Zhang, M. (2018). Study on the freezing temperature of saline soil. Acta Geotech. 13, 195–205. doi:10.1007/s11440-017-0537-1
Xu, J., Lan, W., Ren, C., Zhou, X., Wang, S., and Yuan, J. (2021). Modeling of coupled transfer of water, heat and solute in saline loess considering sodium sulfate crystallization. Cold Reg. Sci. Technol. 189, 103335. doi:10.1016/j.coldregions.2021.103335
Zhang, H., Zhang, J.-M., Zhang, Z.-L., Andersland, O. B., Wiggert, D. C., and Davies, S. H. (2016). Measurement of hydraulic conductivity of Qinghai-Tibet Plateau silty clay under subfreezing temperatures. Chin. J. Geotech. Eng. 38, 1030–1035.
Zhang, J. (2020). Study on the mechanism of water salt migration and crystallization deformation in sulfate saline soil in cold region. Beijing, China: D. University of Chinese Academy of Science.
Zhang, S., Ye, S., and Zhang, L. (2020). Correction of hydrothermal salt force coupled equations for coarse-grained sulphate saline soil roadbed and its experimental verification. J. Highw. Transp. Res. Dev. 37, 31–40.
Zhang, X., Wu, Y., Zhai, E., and Ye, P. (2021a). Coupling analysis of the heat-water dynamics and frozen depth in a seasonally frozen zone. J. Hydrol. 593, 125603. doi:10.1016/j.jhydrol.2020.125603
Zhang, X., Zhai, E., Wu, Y., Sun, D., and Lu, Y. (2021b). Theoretical and numerical analyses on hydro–thermal–salt–mechanical interaction of unsaturated salinized soil subjected to typical unidirectional freezing process. Int. J. Geomech. 21, 04021104. doi:10.1061/(asce)gm.1943-5622.0002036
Zhang, Z., and Guan, C. (2022). A model of hydraulic conductivity for frozen soil using unfrozen water content curve. J. Journal of Xinjiang University, 039–004.
Keywords: salinized frozen soil, hydrothermal salt coupling, water–salt migration, crystallization, temperature variation
Citation: Bao D, Zhang Z, Yue Z, Zhang A and Liu G (2024) Study on the water–salt migration law of salinized frozen soil based on the capillary model. Front. Earth Sci. 12:1367771. doi: 10.3389/feart.2024.1367771
Received: 09 January 2024; Accepted: 07 October 2024;
Published: 07 November 2024.
Edited by:
Petra Heil, Australian Antarctic Division, AustraliaReviewed by:
Hongbo Li, Ningxia University, ChinaJiaxing Jiaxing, Chengdu University of Technology, China
Copyright © 2024 Bao, Zhang, Yue, Zhang and Liu. This is an open-access article distributed under the terms of the Creative Commons Attribution License (CC BY). The use, distribution or reproduction in other forums is permitted, provided the original author(s) and the copyright owner(s) are credited and that the original publication in this journal is cited, in accordance with accepted academic practice. No use, distribution or reproduction is permitted which does not comply with these terms.
*Correspondence: Zhilong Zhang, emhhbmd6bEB4anUuZWR1LmNu