 Ani D. Chinedu
 Nkiruka M. Ezebube
 Smart Uchegbu1,2
- 1UNN/Shell Centre for Environmental Management and Control, University of Nigeria, Nsukka, Nigeria
- 2Department of Urban and Regional Planning, Faculty of Environmental Studies, University of Nigeria, Nsukka, Nigeria
Background: Various methods have been utilized to investigate and mitigate flood occurrences, yet there is a paucity of literature on factors, such as soil compositions, that contribute to persistent flooding in river basins like the Lower Niger catchment, specifically at Onitsha. Furthermore, the study seeks to furnish essential geospatial data concerning flood vulnerability, flood risks, and exposure rates in the Lower Niger Catchment area, situated in Onitsha, southeastern Nigeria.
Materials and methods: Soil samples were collected from 10 specific locations identified through GPS and ground-truthing techniques. Additionally, satellite imagery from the Landsat Enhanced Thematic Mapper (ETM +) was utilized, with supervised classification employed to extract feature classes. Analysis operations were conducted using IDRISI software, resulting in the creation of digital elevation models (DEMs), susceptibility maps, and flood-risk zones.
Results: Analysis revealed that the predominant soil composition in the study area comprises sandy (84.8%), silt (8.1%), and clayey (7.1%) soils. Utilizing these soil characteristics alongside relevant aerial data, exposure rates were determined at various scales to delineate the most flood-vulnerable zones in the basin. It was found that certain areas, accommodating a population exceeding 79,426 across 2,926.2 ha, were particularly susceptible to flooding. Notably, major markets such as Bridgehead, Textile, and Biafra were identified as highly susceptible, with varying degrees of risk. The prevalence of sandy soil, which facilitates increased rainwater infiltration but is also prone to rapid saturation and runoff, likely contributes to the heightened susceptibility to flooding in these areas.
Conclusion: Geospatial analysis employing remote sensing data indicates the high susceptibility and exposure to flooding in the lower Niger River Basin around Onitsha. Urgent mitigation efforts are imperative, necessitating the establishment of zoned areas equipped with effective drainage systems to safeguard vulnerable populations.
1 Introduction
Climate change, with altered precipitation patterns and intensified extreme weather events, poses a global threat, transcending borders and impacting communities worldwide. Onitsha, Nigeria’s second-largest city and the 47th-largest built-up urban area globally, contends with flooding as a pervasive consequence of climate change (Efobi and Anierobi, 2013). Despite its prominence, Onitsha faces a pressing challenge of flooding, disrupting economies, displacing populations, and triggering humanitarian crises (Egboka et al., 2019; Egboka and Okoyeh, 2019; Umar and Gray, 2022; Nkiruka et al., 2023). This commercial hub, extending its reach into neighboring districts, must come to terms with the imperative of understanding and addressing the multifaceted dimensions of flooding to forge resilient and sustainable societies in the 21st century (UNHSP, 2012). There is need for analysis of the extensive and intensive risks in Onitsha as regards to flooding (Olanrewaju et al., 2019). Similarly, Quesada-Román and Campos-Duran (2023), emphasized the importance of disaster databases for risk assessment, land use planning, and management, while underscoring the necessity for comprehensive risk assessment at various scales in the region. This would go a long way to ensure an effective disaster risk reduction and management (Quesada-Román, 2023) in the study area and Nigeria in general.
On the other hand, Climate change further alters precipitation patterns, escalating the frequency and severity of extreme weather events, amplifying the specter of flooding. Coastal areas contend with rising sea levels, while inland regions face torrential rains and overflowing rivers, leading to repercussions extending beyond infrastructural damage. Pino and Quesada-Román (2022) discussed a bibliometric analysis of flood risk-related research in Latin America and the Caribbean (LAC), highlighting the productivity of countries like Mexico, Brazil, Chile, Peru, and Argentina in this field over the past 20 years. They emphasized the need for future research to focus on diversifying keywords, aligning titles, abstracts, and keywords better, and addressing future climatic scenarios for developing realistic solutions to disaster risks in the region.
Onitsha, situated at the mouth of the Niger River in Anambra state, Nigeria, is particularly vulnerable to flooding, primarily during the rainy seasons (Oloruntade et al., 2018; Bello et al., 2022). Over the millennia, the Niger River Basin has been altered, especially the local landscape and heightening flood dangers. In both 2012 and 2022, National Emergency Management Agency (NEMA) reported disastrous flood events in Nigeria, with Anambra state, especially Onitsha, identified as the most affected (NEMA and OCHA, 2012; PDNA, 2012; UNHSP, 2012; Agada and Nirupama, 2015; Ehiorobo and Uso, 2015; Nwachukwu et al., 2018; Mfon et al., 2022; Nkiruka et al., 2023). Severe rainfall, a critical topic among scientists and the public (Agada and Nirupama, 2015), underscores the need for integrated floodplain management methods, emphasizing water-retaining capacity (Ladislav et al., 2014). Hence, accurately mapping flood extents is vital for delineating vulnerable zones and enacting preventive measures. Besides, this study attempts to offer precise insights into the roles of soil composition in flood propagation, aiding in high-risk area identification.
Flood events, considered major destructive natural hazards globally, leave devastating consequences on lives and properties (NEMA and OCHA, 2012; PDNA, 2012; Nemine, 2015; Nkwunonwo et al., 2015; Nwachukwu et al., 2018; Komolafe et al., 2020a; Echendu, 2020). While floods may not be entirely avoidable (Koutný, 2003; Ogbodo, 2011; Komolafe et al., 2020a), their destructive effects on lives and infrastructure can be minimized (Patera and Votruba, 2004), leading to various mitigation methods, including structural measures in floodplains.
Human activities, essential for development but contributing to soil exposure and deforestation, exacerbate flood risks when it is unregulated. The alteration of the Earth through urbanization, farming, and mining impacts soil, water, and plant ecosystems, especially in regions like Onitsha (PDNA, 2012). This anthropogenic influence leads to the direct exposure of soil to precipitation, deforestation, and soil erosion, with eroded soil entering rivers, causing aggradation and sedimentation (Osakwe et al., 2014; Nemine, 2015; Komolafe et al., 2020b). More so, climate change further aggravates flood risks (Aja and Olaore, 2014; Ejenma et al., 2014; Nemine, 2015).
Soil, water, and plant ecosystem balance are crucial for human survival, but urbanization, essential for development, leads to soil exposure and deforestation, poses challenges to regions like Onitsha (PDNA, 2012). Precipitation and runoff, a consequence of anthropogenic activities, result in soil removal, waterlogging, soil compaction, and decomposition of organic matter, rendering large areas infertile. Soil erosion contributes to aggradation and sedimentation in rivers, raising floodplain levels (Mahabaleshwara and Nagabhushan, 2014). Soil porosity, vital for mitigating flooding, influences water permeation. It facilitates quicker water percolation, averting flooding (Kalantari et al., 2014). Flood hazard mapping considers elevation, soil type, and land use, hydrology data, climatic data, and disaster risk reduction approaches, among others (Ejenma et al., 2014). Soil properties, including porosity, impact flooding propensity, intensity, and water recession rate (Reynolds et al., 1985). Impacts of excessive water saturation include waterlogging, affecting the water table and soil physical properties (Sharma and Swarup, 1988). Soil type, texture, and waterlogging variations affect soil reactions (Cosentino et al., 2006). Additionally, in times of severe flooding, it is crucial to rapidly assess the scale of inundation and its impact (Quesada-Román and Villalobos-Chacón, 2020) on land use (Wang, 2002; Thalakkottukara et al., 2023). Flood mapping serves as a valuable tool for promptly organizing comprehensive relief efforts following flooding events (Quesada-Román and Villalobos-Chacón, 2020; Quesada-Román and Campos-Duran, 2022). Despite the numerous challenges associated with flood mapping, remotely sensed data offers an efficient and effective solution for its development (Nkiruka et al., 2023; Campos-Durán, 2017). This paper explores the utilization of different remote sensing techniques for flood mapping, incorporating various indices for studying flood risk, along with their specific applications.
According to the concept displayed in Figure 1, several factors such as deforestation, changes in land use and land cover, particularly urbanization, triggers urban flooding, while extreme precipitation is a natural contributor (Nkiruka et al., 2023; Agbonkhese et al., 2014). Human-induced factors, including inadequate drainage and waste disposal, also play a role. Umar and Gray (2022) identified key causes such as canal blockages, inadequate drainage, heavy rainfall, and encroachment of the natural environment, excessive precipitation being influenced by climate change and human activities. Natural causes involve intense downpours and river storms, while anthropogenic factors include broken pipes, inadequate drainage, and dam overflow.
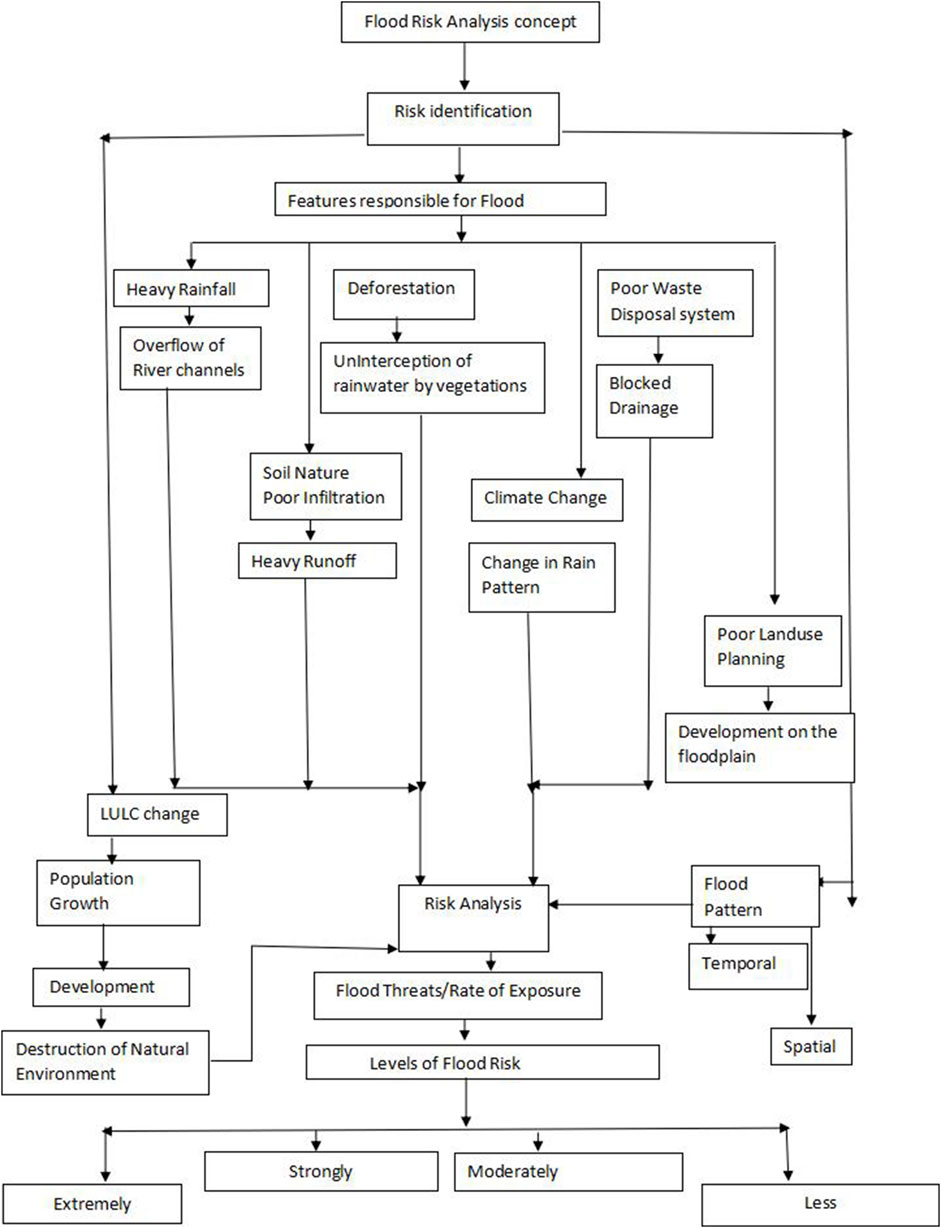
Figure 1. Concept of flood risk Assessment.
Researchers employ various correlated variables to measure exposure to urban flooding at different scales, including physical, environmental, and socio-economic factors (Osakwe et al., 2014; Nura and Alison, 2022). Factors increasing urban flood exposure in developing countries include poverty, poor housing, inadequate flood defense management, population growth, squatter settlements in hazard-prone areas, poor drainage maintenance, inadequate awareness and limitations in early warning systems (Daffi et al., 2014; Djimesah et al., 2018). To address these challenges, proactive and holistic urban flood control approaches are crucial, advocating for the revival and enforcement of monthly environmental sanitation exercises to clear drainage channels and ensure proper waste disposal (Nkwunonwo et al., 2015; Nkiruka et al., 2023). Several studies have focused on different approaches to map flood-prone areas, manage and mitigate the menace in catchment areas.
The recurrent motif across the various approaches used, involves the application of sophisticated methodologies and models to evaluate and forecast the repercussions of climate change and extreme weather occurrences on hydrological systems and flood susceptibility across diverse geographical areas (Quesada-Román and Villalobos-Chacón, 2020; Quesada-Román, 2022; Quesada-Roman, 2023; Hidalgo et al., 2024). Each investigation utilizes intricate approaches, including the utilization of downscaled General Circulation Models (GCMs), multi-criteria decision support frameworks, and flood hazard indices, to scrutinize the plausible ramifications of climate change, accentuating the imperative for precise evaluations and effective mitigation tactics to confront the escalating adversities presented by extreme weather phenomena and flooding (Quesada-Román and Villalobos-Chacón, 2020; Ikirri et al., 2022; Aichi et al., 2024).
Kherimi et al. (2024) utilized sentinel-1 radar data to study and map vulnerable areas of the Lower Merjerda valley and identified the possible indicators of high flood risk. Geographic information analysis in Fagge, Kano State, revealed flood vulnerability factors such as elevation, drainage, geology, land use, rainfall, soil, and slope (Azua et al., 2019). Similar studies in Muscat, Oman; the Czech Republic; Gaza; England; Bellary, India; Kano and Bayelsa States in Nigeria underscore the role of soil properties in flooding (Ladislav et al., 2014; Mahabaleshwara and Nagabhushan, 2014; Timothy et al., 2017; Azua et al., 2019; Hanan and Rifaat, 2020; Achimota et al., 2021; Eshtawi et al., 2021; Temi et al., 2021).
Emmanuel, et al. (2015), used Geographic information system and remote sensing to analyze flood hazards and damages of past events in Anambra state. The result of the work revealed that 1,078 km2 area were inundated and 43.40%, 19.68%, 17.20%, 11.44% and 8.29% of the area are settled in very high, high, moderately, low, and no risk areas. Odunuga et al. (2015) studied variations in flood risk in Lower Niger–Benue using historical and extreme flow rate, activities of landuse and Floodplain Vulnerability Index. The result revealed that extreme flood susceptibility of the flood prone zones of Makurdi and Lokoja indicated that strong and extreme vulnerability levels should have been the reason for the strong effects on the people along the basin. Ugoyibo and Ogbonna (2017), applied GIS and Remote Sensing methods in carrying out spatial study of flood susceptibility in Anambra East and its neighborhoods and they arrived at the results that 71% of the areas under study are sitting on the floodplain.
However, limited reports exist on flood susceptibility mapping and exposure rate aided by the impact of soil composition on flooding in the lower Niger catchments, particularly in Onitsha. This highlights the need to provide insights into soil-flooding relationships and map the susceptible zones to flooding in the Niger River Basin. Moreover, this study tends to address the following research questions: What primary elements contribute to flooding in the study area, and to what extent is the area exposed and susceptible to flooding. The corresponding hypotheses include; there is no relationship between the identified key susceptibility factors and flooding incidents in the study area and, the study area exhibits uniform levels of flood risk, susceptibility, and exposure rates across the area.
2 Methodology
2.1 Location of the study area
This research focuses on Onitsha North and Onitsha South axis of the Niger River Catchment in Anambra State, Nigeria, serving as a crucial link between southeast and southwest Nigeria due to the presence of several international markets (Figure 2A). It spans coordinates 6°10′00″N–6˚16′7′00″N and 6˚47′00″E− 6˚78′30″E, bordered by the River Niger, Idemili North and South LGA, Anambra East and Oyi LGA, and Ogbaru and Ekwusigo LGA. Onitsha is a metropolitan city, an economic hub hosting the largest market in Africa (Figure 2), occupying about 36.12 km2 of land.
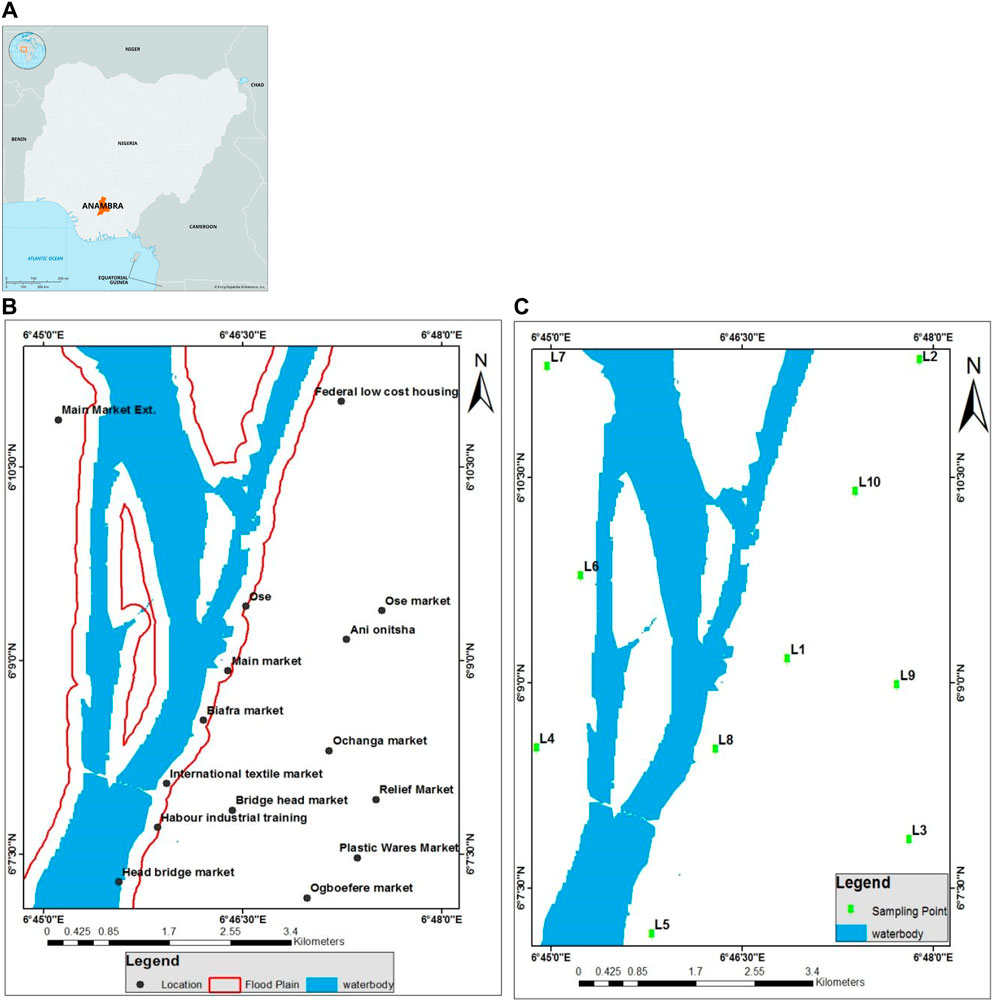
Figure 2. The Study area showing: (A) Nigeria showing Anambra state, insert: map of Africa. (B) Major business areas in Onitsha, and (C). Sampled locations.
The city is situated along the sedimentary channel of Niger Benue, with alluvial deposits from the rivers existing for two million years. Its strategic location, acting as a link between various regions, contributes to its status as a significant commercial center (UNHSP, 2012).
Onitsha North and South experience hot and humid climates, characterized by steady heavy rainfall in the tropical wet/dry climate. The average temperature is 27.0°C, with an annual rainfall of 1828 mm. Scanty forests with scattered tall grasses dominate the vegetation, while urbanization has led to deforestation. Population growth and urban activities have resulted in extensive vegetation clearing, leading to environmental issues such as flooding. Development projects in the area often neglect environmental considerations, posing potential hazards (Izueke and Eme, 2013).
Poor enforcement of land use regulations contributes to environmental problems (Onibokun, 1989). Onitsha hosts major markets and industrial layouts, and flooding poses a threat to properties and businesses, emphasizing the need for policy interventions and scholarly research.
The study encompasses all land uses, including government and private facilities, settlements, markets, companies, schools, and hospitals within the 10 identified sub-locations. The human population of Onitsha, projected at an annual growth rate of 2.56%, was 350,672 in the 2006 Census (Census, 2006).
2.2 Materials and methods
The study identified 10 different sub-locations as shown in Figure 2B, at which Global Positioning System (GPS) readings were obtained from ground-truthing. This helped to determine the sub-locations of these neighborhoods. In addition, the satellite imageries were acquired via Landsat Enhanced Thematic Mapper (ETM+) (Medium Resolution Image). More so, the administrative map of Anambra state was used as a guide to delineate the political boundaries of the study area. These identified locations were also based on the prior knowledge of the study area obtained through a preliminary survey. Anderson et al. (1976) classification scheme was adopted and modified for the study. The developed classification scheme gave a rather broad classification where the types were identified according to Nkiruka et al. (2023).
IDRISI software was employed to bring out the different classes of soil existing in the study area. Soil classes such as sandy, silt, and clay were noted on the satellite imagery. This operation was carried out by locating the training sites for types of soil that were later digitized and assigned soil type identifiers. The Landsat Thematic Mapped bands were distributed to cover the visible, near-infrared, and middle infrared and far infrared spectral regions of the electromagnetic spectrum (EMS). Moreover, each of the bands has its unique applications, therefore for spatial pattern distribution studies; the bands selected were used to create the image composites. Additionally, soil samples were collected below 6 inches above the ground surface using a trowel at different locations of the study area with their GPS values. Physical analysis of the collated samples was carried out to establish the soil texture.
2.3 Mapping flood-prone zones and exposure rate
Digital elevation models (DEMs), crucial for understanding flood risk, are created using remote sensing techniques like satellite imagery or photogrammetry. These methods capture elevation data points, building a representation of the Earth’s surface (Teng et al., 2015). Mathematical interpolation and modeling techniques then transform these points into a continuous surface, depicting elevations across the landscape (Sanders, 2007; Chen et al., 2019; Chen et al., 2022). Flood-extent maps rely heavily on rainfall data, land use, soil types, and terrain data (including DEMs) simulating rainfall-runoff processes (Egbuchua, 2014; Innocent and Steve, 2015; Teng et al., 2015). These processes subsequently utilize the runoff data to simulate river or coastal flooding, incorporating river channel and floodplain geometry (Bates and De Roo, 2000; Komolafe et al., 2020a; Komolafe et al., 2020b). The result is a map showcasing areas likely to be affected during various flood scenarios.
A flood extent map was produced through the integration of remote sensing techniques and geographic information systems (GIS) technology (Lawal et al., 2014; Frank et al., 2020; Mccormack et al., 2022; Puno et al., 2022; Vashist and Sing, 2023). Initially, remote sensing data, like satellite imagery or aerial photographs, was collected before and after a flood event, capturing the Earth’s surface at various wavelengths and resolutions (Bentivoglio et al., 2022; Mccormack et al., 2022; Vashist and Sing, 2023). Subsequently, acquired images underwent preprocessing to rectify distortions, eliminate noise, and enhance data quality, ensuring readiness for further analysis (Lawal et al., 2014). Image registration follows, aligning or registering images taken at different times to guarantee spatial accuracy by matching common features (Nkiruka et al., 2023) and adjusting them accordingly.
Once images were registered, a change detection algorithm was employed to identify areas where changes have transpired between pre-flood and post-flood images, typically manifested by the appearance of water bodies (Nkiruka et al., 2023). Subsequent thresholding and classification distinguish flooded areas from other changes, such as urban development or alterations in vegetation. Classification algorithms further refine identification based on spectral characteristics and spatial patterns. The generated flood extent map is then validated using ground truth data, such as field surveys or high-resolution imagery, to assess accuracy and refine the analysis if needed. Finally, the validated flood extent map visualizes flooding across the affected area, serving crucial purposes in disaster response, risk assessment, and planning, with variations in the process influenced by data availability, analysis scale, and specific application requirements. Ongoing advancements in remote sensing technology and data processing techniques continually enhance the accuracy and efficiency of flood mapping processes.
Flood-risk zones are determined by integrating diverse factors such as flood extent, vulnerability of assets, and flood probability (Wang, 2022). Flood hazard maps, land-use planning, infrastructure vulnerability assessments, and historical flood data contribute to the analysis (Jha et al., 2012). Risk assessments may involve quantitative methods like probabilistic modeling to estimate the likelihood and consequences of different flood scenarios (Jha et al., 2012). Combining hazard and vulnerability information helps delineate flood-risk zones, guiding mitigation and adaptation strategies (Wang, 2022). Susceptibility maps assess a region’s susceptibility to flood impacts. This involves analyzing physical, social, economic, and environmental factors that influence susceptibility. Data on building structures, population density, infrastructure, and socioeconomic indicators are considered. GIS (Geographic Information System) plays a key role in integrating and analyzing these data layers (Kefas et al., 2016; Komolafe et al., 2020b; Bulti and Abebe, 2020). Susceptibility indices or scoring systems may be developed to quantify and map the overall susceptibility of different areas. Effectively managing flood risks requires a comprehensive approach that combines remote sensing, modeling, and GIS techniques. By generating accurate and informative maps, a deeper understanding of the physical landscape’s susceptibility to floods is gained, and the potential impacts on human infrastructure. This knowledge empowers us to make informed decisions for flood mitigation, preparedness, and response.
For this study, the different colors representing the levels of risks were classified as extremely risky, strongly risky, moderately risky, and less risky, while the levels of susceptibility include extremely susceptible, strongly susceptible, moderately susceptible, and less susceptible. Meanwhile, the flood extent map was classified into flooded and unflooded zones.
2.4 Soil classification
The values of the supervised soil classifications shown in Table 1, were adopted by using ground truthing. It involves the visual identification of defined surface features in the imageries identified as training sites. They were the areas meant for extracting the feature classes in the image. The data processing was carried out with IDRISI, while, the individual pixels were analyzed in the training sites for each of the soil types. This was encouraged following the need to display the features in polygons. Finally, the areas were calculated in hectares for each class using an integrated geographic information system and remote sensing software.
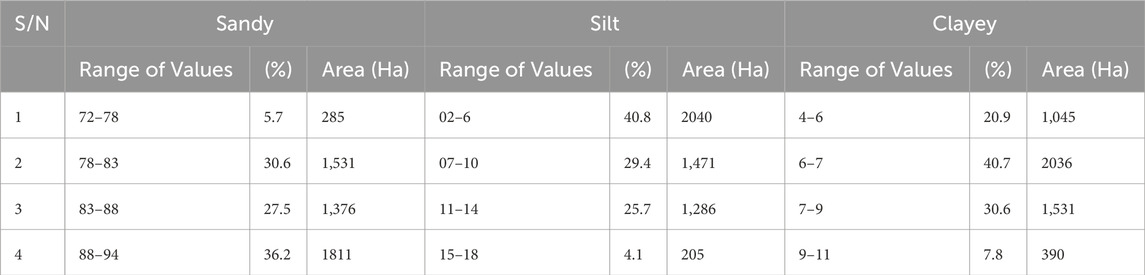
Table 1. Analysis of the tested soil samples.
More so, the Supervised Classification technique was adopted because it has been adjudged accurate (Anderson et al., 1976) and does not intermingle features with similar spectral signatures unlike the unsupervised. The method was also used because of the prior knowledge of the areas captured from the satellite imageries. It was also considered due to its ability to identify features on the images relative to the known locations. The classification and interpretation were carried out visually.
The elements of visual image interpretation discussed in Jenson (2007) and adopted in this study for visual analysis, were tone and color. This was possible as the imageries gave the true color reflection of images on the ground. Tone has been described as shades of gray, ranging from black to white. The degree of darkness or brightness is a function of the amount of light reflected from the scene within the specific wavelength interval or band (Jenson, 2007). The colors were used to identify the spectral signatures and delineate each feature assigned to the soil classes with different spectral signatures (Figures 3–5). Furthermore, the supervised classification made it possible to determine each soil class in the study area.
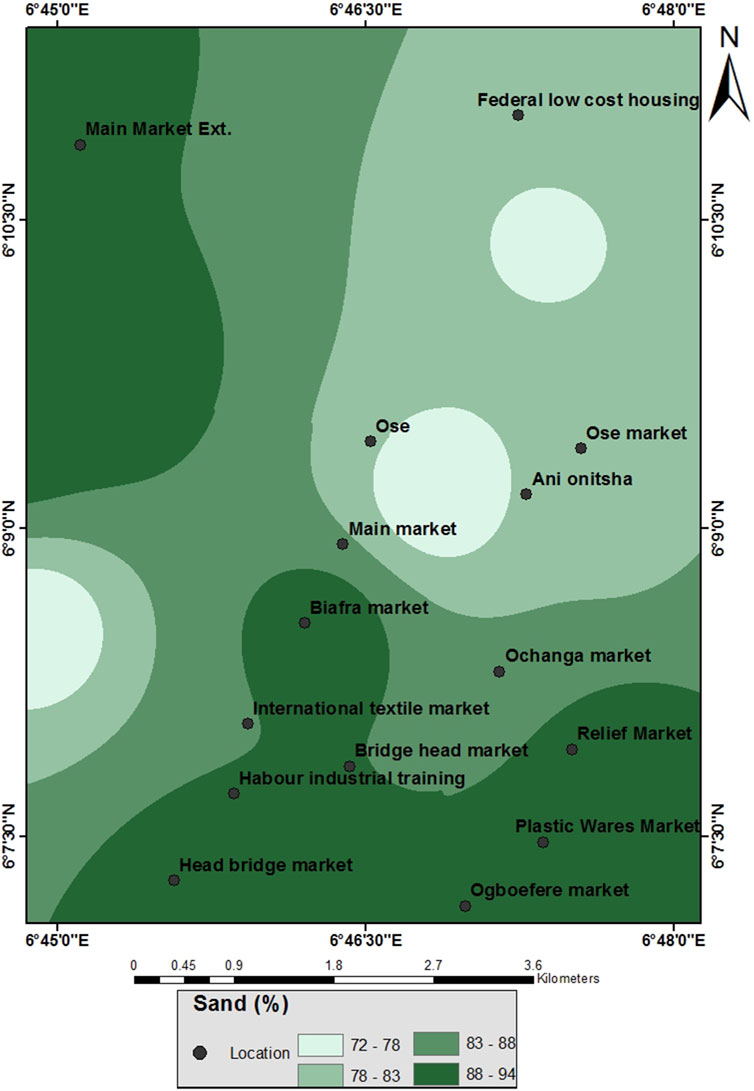
Figure 3. Supervised classification map for sandy soil.
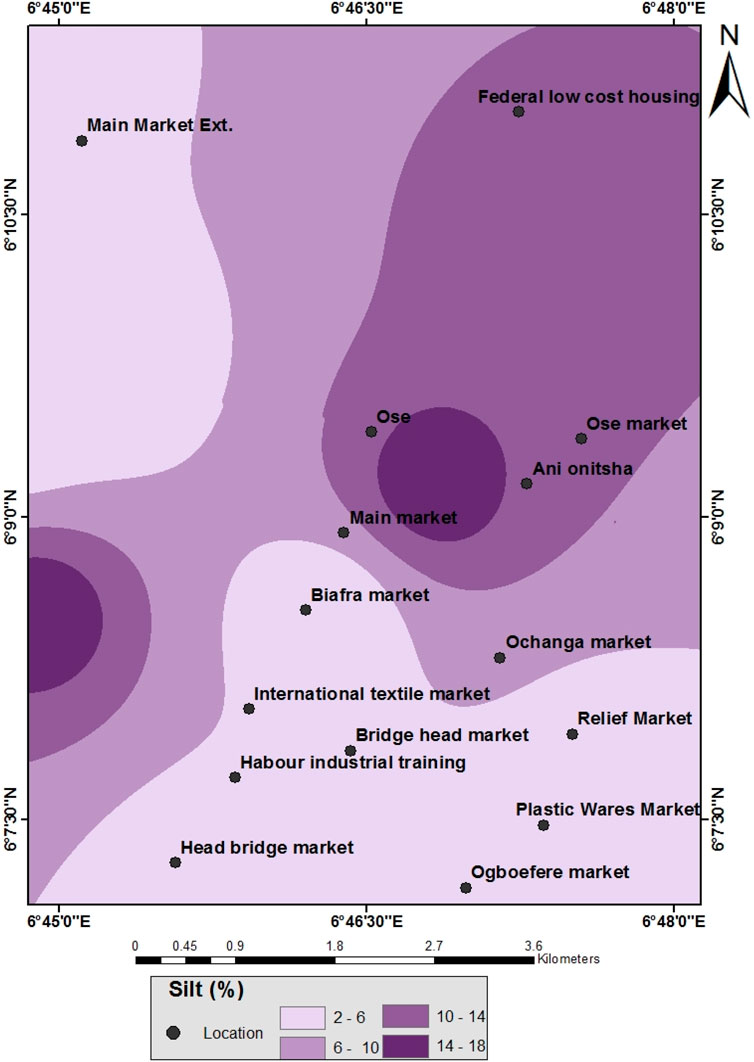
Figure 4. Supervised classification map for silt soil.
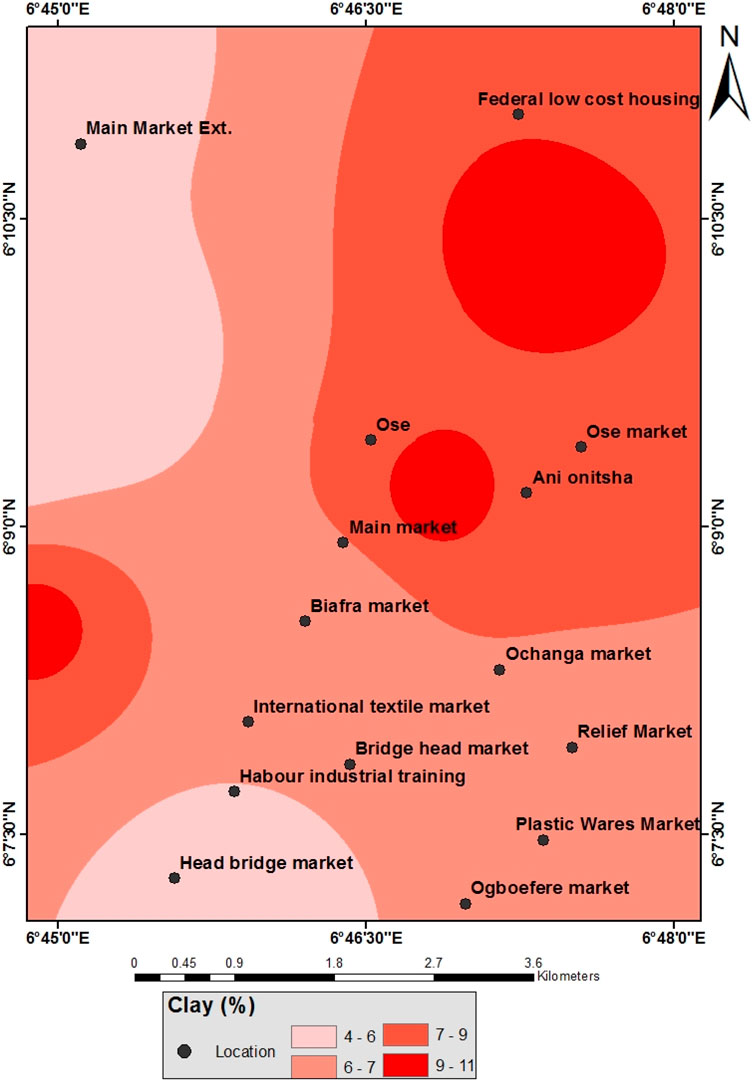
Figure 5. Supervised classification map for clay soil.
3 Results
The study from the soil texture analysis shown in Table 2 displayed the analysis of proportions of the soil compositions and the area coverages in Hectares. The sampled 10 sub-locations showed that the dominant soil structures in the study area are mainly sandy with average percentage of (84.8%), silt (8.1%) and clayey (7.1%), respectively. Moreover, a table of analyses of the sampled soil types (Table 1) were plotted in bar charts in Figures 6A–C. Table 2 presents the proportions of the compositions and textures of the soils in the study area displayed according to the sampled locations. While Figure 6D presented the susceptibilities of the study area to flooding as a result of the dominant sandy soils.
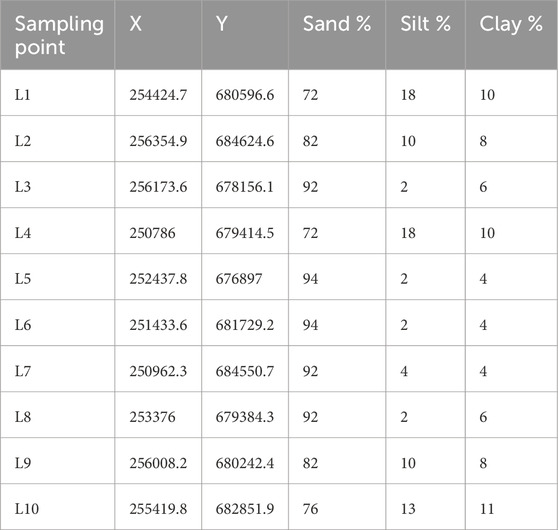
Table 2. Soil texture analysis in the study area.
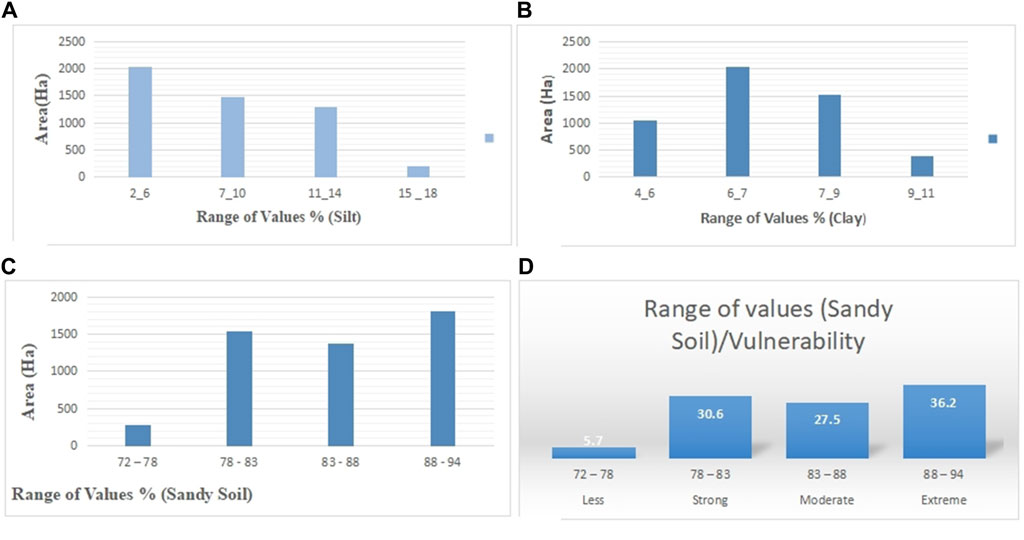
Figure 6. Bar Chart showing range of values for: (A) Silt, (B) Clayey soil, (C) Sandy soil, and (D) composition of sandy soil and the rate of susceptibility in the area.
Table 2 is the general soil texture analysis while, Figures 3–5 showcase the map of the supervised classification for sandy soil, silt, and clay, respectively. From Table 3, the Southern and North-western part of the study area appears to be highly prone to flooding than other regions due to the high composition of sandy soil in the area, followed by moderately high percentage of sandy soil in those regions. These regions are also known to have very low proportions of clayey soil (Figures 3, 6D) which suggests a minimal water retention capacity in the area, but very porous.
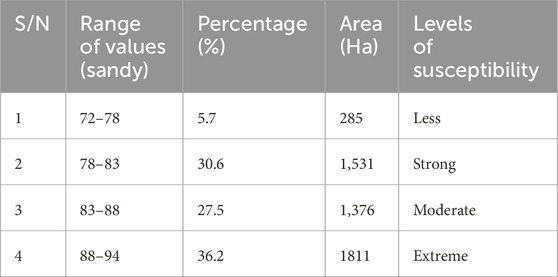
Table 3. The range of values in sandy terrain areas and levels of susceptibility.
Using the significant flood event of 2018, the flood extent map of the study area (Figure 7), depicts the submerged regions during that period. Notably, a considerable proportion of the commercial zones experienced severe flooding during this event, indicating their susceptibility to floods and the high risk of recurrent inundation. The flood extent map for 2018, as revealed in Figure 7, underscores the imperative to highlight the levels of susceptibility and exposure of these areas to flooding, quantified by their sizes in hectares. Table 4 presents the risk levels and exposure rates (%) of these regions to flooding, emphasizing the urgent need for proactive measures in disaster management and mitigation, particularly in the Onitsha catchment area. Table 5 indicates that a significant portion of the catchment area and population are under threat, with an alarming 2,926.2 ha (58.5%) categorized as extremely or strongly susceptible to future flooding, a trend further corroborated by Figure 10.
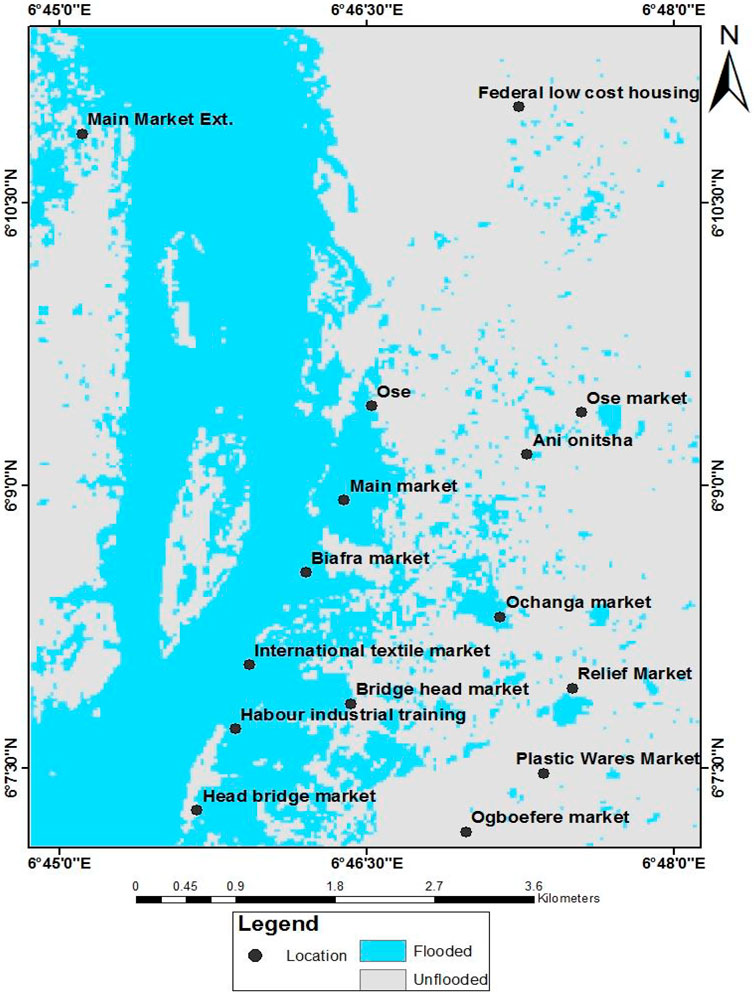
Figure 7. Flood extent map of a major flood event in 2018, indicating flooded and unflooded areas.

Table 4. Flood risk and susceptibility levels according to sizes of areas (Ha).
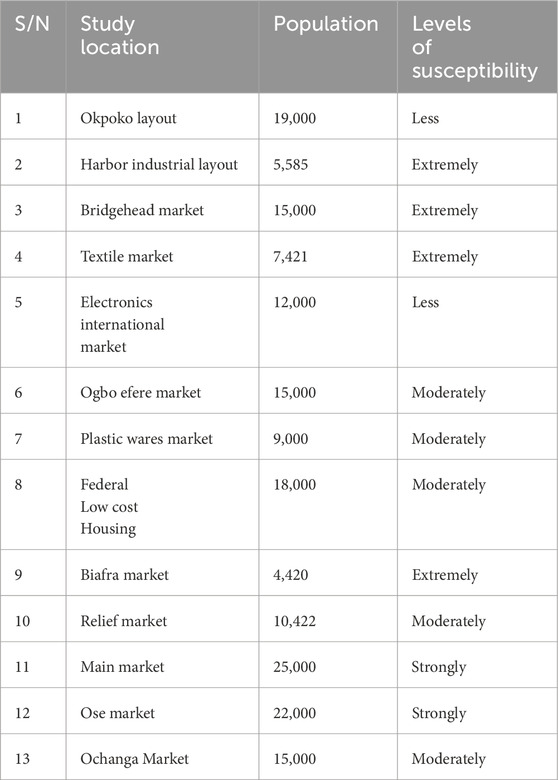
Table 5. Population of businesses and the analysis of community susceptibility levels.
Figure 8 is the graphical representation of the levels of risks and susceptibility of the population to flooding. This indicates that majority of the zones are strongly at risk followed by extremely risk. However, the moderately and less at risk are also threatened but not to the degree of the majority at risk.
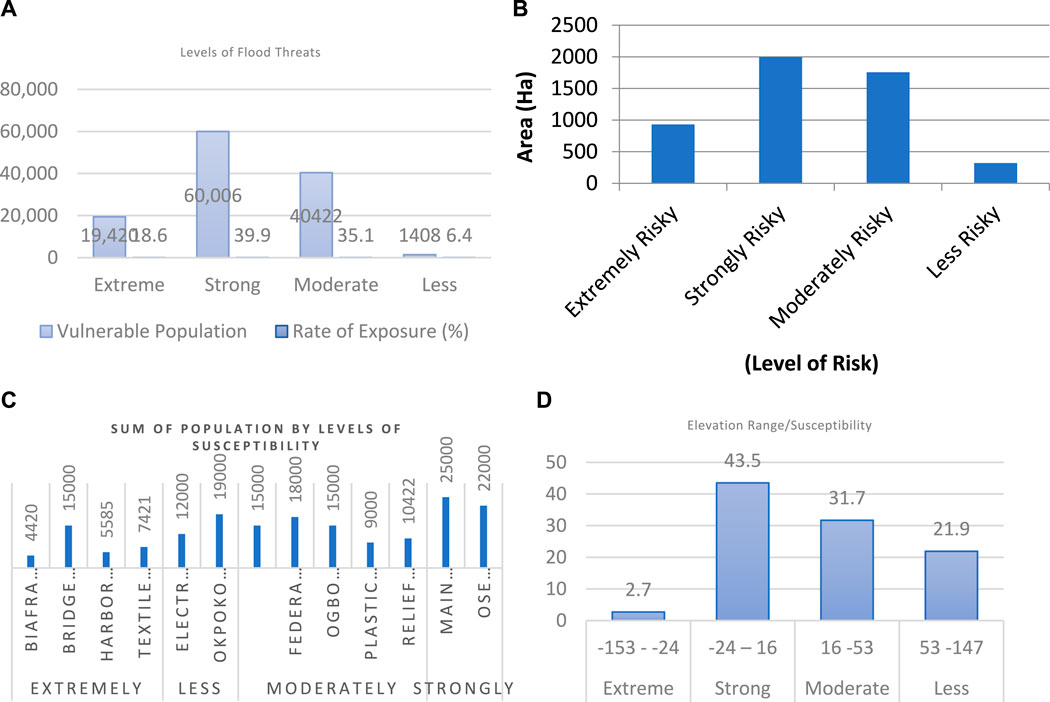
Figure 8. Population vulnerability chart and their exposure rates in the study area. (A) The levels of flood threats and exposure rates, (B) The levels of risks in terms of area (Ha), (C) The exposed population by their levels of vulnerability, and (D) The elevations (m) and their corresponding levels of vulnerability.
Meanwhile, the importance of this information depends on the interest of the administrative authorities in the area. More so, it will serve as a guide to the policymakers and implementers in the creation of zoned areas for flood disaster risk reduction and management.
This study has identified the areas that lie within sandy soils terrain (Figure 3) to be the most vulnerable due to its high pososity and poor water retention properties. However, for the purpose of relating the sizes and proportions of areas underlaid by the soil to their levels of susceptibilities, Table 4 displays the analysis of these areas and their sizes (Ha) in terms of their levels of susceptibilities. On the other hand, Table 5 displays the levels of susceptibilities in relation to the population of the Thirteen (13) major business locations in the study area.
Figure 9 shows the mapped flood risk/vulnerable zones of the study area in color codes. The analysis was further shown in Table 5 relating the degree of their susceptibilities according to the locations and their respective populations. Table 5 further linked the business locations along with their respective population to their levels of vulnerabilities to flooding.
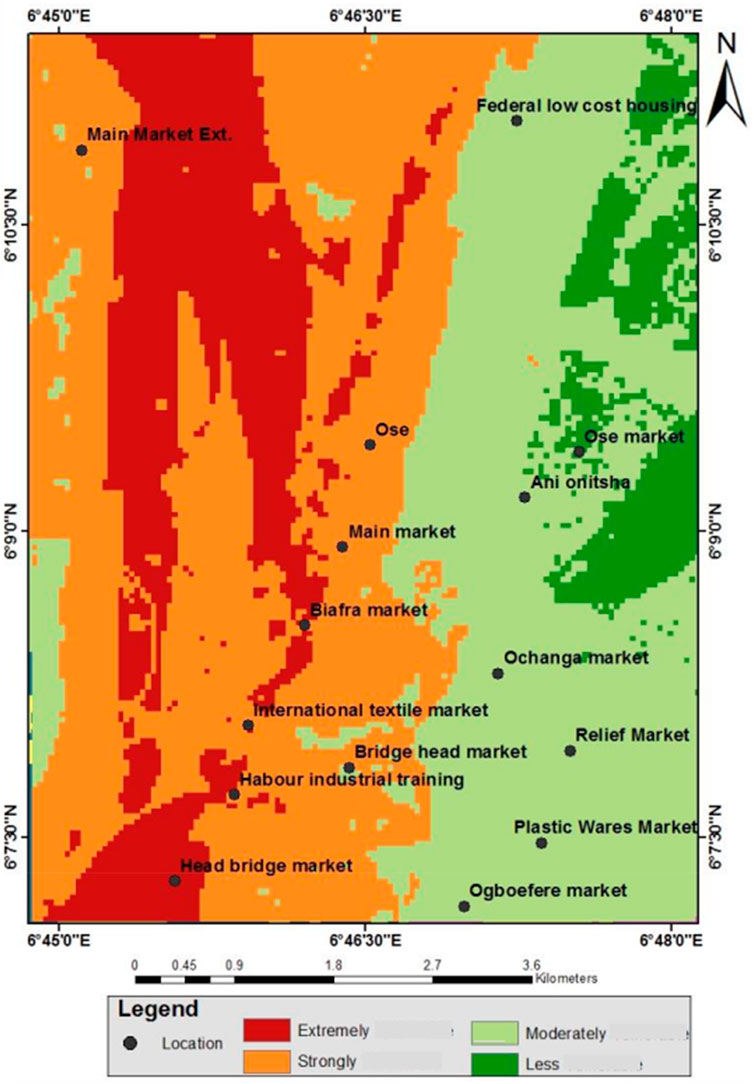
Figure 9. Susceptibility map/flood-risk zones of the study area, indicating the levels with different colors.
Relating the analysis to the business location, Figure 8A displayed the population vulnerability chart and their rates of exposure. From Table 5, it is observed that Biafran Market, Bridge Head Market, Harbor Market and Textile Market are extremely threatened by flooding in the study area. Figure 8C is the graphical representation showcasing the vulnerable business populations and their respective rates of exposure. This indicates that at 18.6% and 39.9% exposure rate, the population are extremely and strongly susceptible to flooding in the catchment posing a threat to an area of 2,926.2 Ha and a population of 79, 426 (Table 6). Table 6 also shows the levels of vulnerability according elevations mapped in Figure 10, while Figure 9 display the mapped areas according the flood risk zones and their susceptibilities to flooding, respectively.
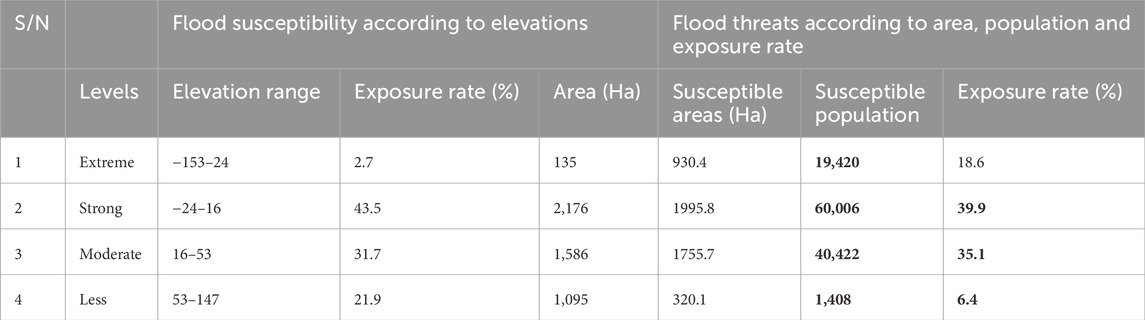
Table 6. Analysis of flood threats and susceptibility according to elevations, areas, population and exposure rate.
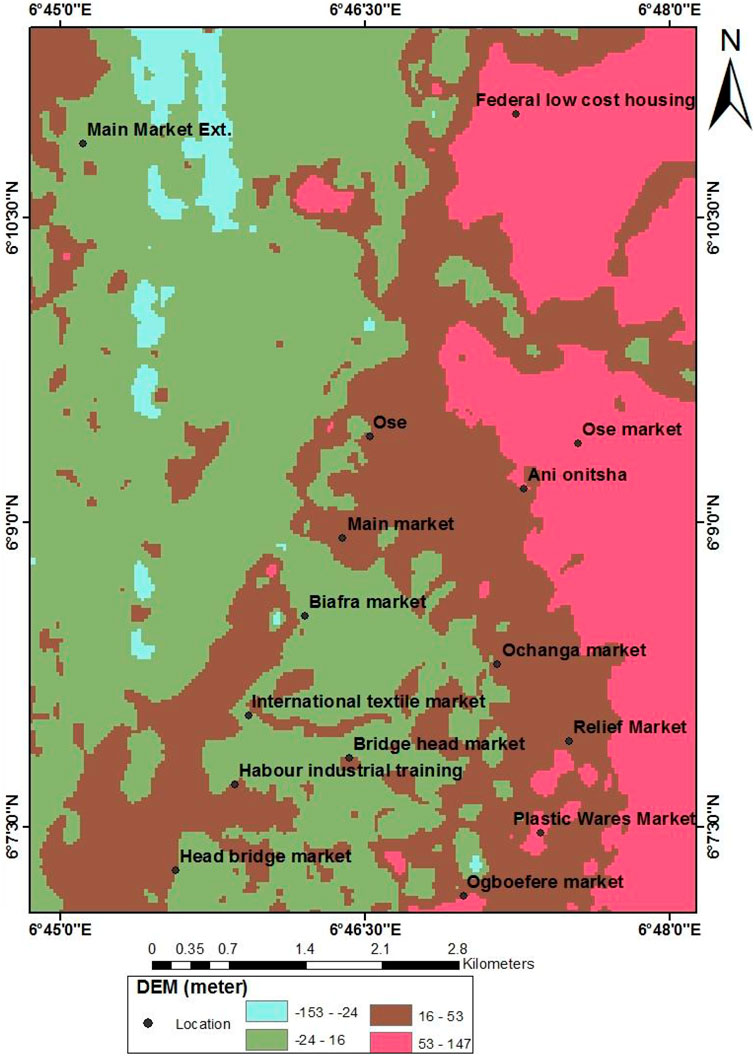
Figure 10. Digital elevation model (DEM) of the study area, indicating the levels of heights.
On the other hand, Ochanja, Federal Low Cost Housing, OgboEfele, Plastic Wares, and Relief Markets are captured as being moderately at risk, while Electronic International Market and Okpoko Market are at less risk of flooding. Figures 6C, D are charts linking the range of soil compositions in the catchment to their levels of vulnerability to flooding.
Nevertheless, the digital elevation models (Figure 10) delineates the undulating patterns of the topography or landscape, defining the slopes and elevations in the study area.
The maps displayed in Figures 7–10 serve as valuable tools in tackling a range of issues pertaining to both natural and man-made environments. They facilitate the simulation of water movement, forecast erosion, and predict flood patterns. Additionally, they furnish data regarding water bodies, elevation, slope, and contours of the terrain. The flood extent map (Figure 7), flood risk zones (Figure 9), susceptibility map (Figure 8) and elevation map in Figure 10 were employed to gauge the susceptibility of the study area to flooding by identifying the slopes or flow patterns of the terrain. Furthermore, Figure 6D illustrates the correlation between elevations and their corresponding levels of susceptibility in a descriptive analysis.
4 Discussion
In sub-Saharan West Africa, Nigeria confronts recurrent devastating floods due to heavy rains, causing extensive damage and loss of life, notably in Onitsha. Nkiruka et al. (2023) underscore the critical role of flood risk and susceptibility mapping for disaster mitigation. Their study underscores the effectiveness of remote sensing and photogrammetry in pinpointing flood-prone areas. Understanding and addressing flood risk requires a multifaceted strategy, incorporating a range of tools and evaluations. Flood-risk zones, digital elevation models (DEMs), flood extent maps, threat analyses, and exposure assessments each provide valuable and unique insights into the intricate issue of flood vulnerability. To comprehensively assess the persistent flooding in the lower Niger Catchment, it is imperative to have a deeper understanding of the existing phenomenon.
4.1 Soil composition insights
Mohamed and Ali (2013), posited that sandy soil allows greater infiltration of rain, and runoff can increase when the soil layer is rapidly saturated with low water-retention capacity. This will result in frequent heavy runoffs, coarseness and porosity which would rather enhance excessive sediment transportation through water erosion and persistent flooding. In addition, the area would also have a low water-holding capacity rate due to the minimal percentage of clay soil in the soil compositions within the area. When the texture, structure and composition of soil in an area are dominantly fine and coarse with very negligible presence of clay or clayey loam, then the area becomes susceptible to flooding and erosion.
Soil physical characteristics, particularly aeration and water-holding capacity, are strongly influenced by soil structure and texture. During a downpour, the soil becomes easily saturated with water in the study area, pushing out the air in the pore spaces until they are entirely filled. When the soil is filled with water and could not be retained, the rapid horizontal movement of water is facilitated, thus, inducing flooding or erosion. Despite the importance of soil water retention capacity, flooding in a region is significantly affected by the proportion and aggregation of soil particles. Thus, the prevalence of sandy soil (exceeding 80%) and low levels of clayey soil (8.4%) in the Lower Niger Catchment area of Onitsha suggests a likelihood of frequent floods. This indicates high soil porosity and low water retention capacity, leading to sediment saturation and rainwater transportation, which could exacerbate flooding and erosion.
Interpreting the results in Tables 3 reveals the susceptibility levels and exposure rates of certain locations within the catchment due to the predominance of sandy soil composition, particularly in northwestern and southern parts, where major business locations are situated. These findings suggest poor water retention and infiltration, highlighting the susceptibility of businesses and populations in these areas.
4.2 Flood risk/susceptibility and rate of exposure
Moreover, Figures 8, 9, along with the flood extent map in Figure 7, unveiled susceptible areas and flood risk zones within the study area, emphasizing the significant threat to businesses and populations. This is further illustrated by Figures 3, 6, 9, which provide additional insights into susceptibility levels and exposure rates. Additionally, Figure 8 portrays population susceptibility and their rates of exposures.
While this study has addressed the research questions by providing extensive insights into flood risks and exposure rates within the Onitsha River catchment using natural geographic features, it did not develop hydraulic or hydrologic models to depict flood patterns. Nonetheless, it utilized DEM maps to illustrate the topography and undulating patterns of the study area and relate them to the rates of exposure according to the runoffs and slopes.
This research underscores the importance of understanding soil composition, topography and other geographic features in assessing flood susceptibility. The findings highlight the urgent need for proactive measures to mitigate flood risks in the Lower Niger Catchment area, particularly in susceptible zones identified within Onitsha. On the other hand, future studies could explore the integration of hydraulic models for a more comprehensive understanding of flood dynamics in the region.
5 Conclusion
This study comprised comprehensive analysis of soil classification and flood susceptibility analysis in Onitsha, encompassing Onitsha South and Onitsha North Local Government Areas. The primary objective was to provide valuable insights and add to the extant volume of flood data on the Onitsha Niger River Catchment. Utilizing ground-truthing techniques, soil samples were collected from ten locations with precise Global Positioning System (GPS) coordinates. Administrative maps of Anambra state and satellite images from Landsat’s enhanced thematic mapper (ETM+) were employed to delineate the political boundaries and extract feature classes for the analysis. Supervised classification techniques facilitated the extraction of meaningful information from the imagery, with IDRISI software utilized for data analysis.
The analysis revealed that the predominant soil composition in the research region consists predominantly of sand (84.8%), followed by silt (8.1%) and clay (7.1%). This composition aligns with reports of recurrent flooding in the area and the higher proportions of sandy soil observed during in-situ surveys. The susceptibility of sandy soil to flooding was further underscored, attributed to its ability to facilitate rapid infiltration of rainwater coupled with its low water-holding capacity, leading to swift saturation and substantial inundation.
The research further demonstrates elevated levels of susceptibility and exposure in specific areas within the catchment, a fact reinforced by the flood extent map. Additionally, various tools such as DEM, flood extent maps, vulnerability maps, and flood-risk maps were employed to highlight and visualize vulnerable regions and flood-prone zones within the studied area, showcasing the considerable jeopardy faced by businesses and communities within the Niger River catchment, Onitsha.
The integration of these findings into flood risk assessments offers critical insights into the dynamics of flood susceptibility within the Onitsha Niger River catchment. By elucidating the relationship between soil composition and flood susceptibility, this study contributes essential to the existing knowledge for devising effective flood mitigation strategies. More so, future research endeavors could explore the incorporation of hydraulic models to enhance understanding of flood patterns and inform proactive measures for flood risk management in the region.
Data availability statement
The original contributions presented in the study are included in the article/supplementary material, further inquiries can be directed to the corresponding author.
Author contributions
AC: Conceptualization, Methodology, Supervision, Validation, Writing–original draft, Writing–review and editing. NE: Data curation, Formal Analysis, Investigation, Software, Writing–original draft. SU: Conceptualization, Project administration, Supervision, Writing–review and editing. VO: Data curation, Investigation, Software, Writing–original draft.
Funding
The author(s) declare that no financial support was received for the research, authorship, and/or publication of this article.
Conflict of interest
The authors declare that the research was conducted in the absence of any commercial or financial relationships that could be construed as a potential conflict of interest.
Publisher’s note
All claims expressed in this article are solely those of the authors and do not necessarily represent those of their affiliated organizations, or those of the publisher, the editors and the reviewers. Any product that may be evaluated in this article, or claim that may be made by its manufacturer, is not guaranteed or endorsed by the publisher.
References
Achimota, A. D., Joseph, O. T., Payou, T. O., and Cameroon, O. P. (2021). Spatial variability of selected soil properties of the lower Niger river floodplains in Bayelsa state, Nigeria. Afr. J. Agric. Food Sci. 14. doi:10.52589/AJAFS-6RMAXNLV
Agada, S., and Nirupama, N. (2015). A serious flooding event in Nigeria in 2012 with specific focus on Benue state: a brief review. Nat. Hazards 77, 1405–1414. doi:10.1007/s11069-015-1639-4
Agbonkhese, O. E., Agbonkhese, E., Aka, J., Joe-Abaya, M., and Adekunle, A. (2014). Flood menace in Nigeria: impacts, remedial and management strategies. Civ. Environ. Res., 32–40.
Aichi, A., Ikirri, M., Haddou, M. A., Quesada-Román, A., Sahoo, S., Singha, S., et al. (2024). Integrated GIS and analytic hierarchy process for flood risk assessment in the dades wadi watershed (central high atlas, Morocco). Results Earth Sci. 2, 100019. doi:10.1016/j.rines.2024.100019
Aja, G. N., and Olaore, A. Y. (2014). The impact of flooding on the social determinants of health in Nigeria: a case for north-south institutional collaboration to address climate issues. Dev. Ctry. Stud. 4, 6–12.
Anderson, J., Hardy, E., Roach, J., and Witmer, R. (1976). A land use and land cover classification system dor use with remote sensor data. Geol. Surv. J. 34. doi:10.3133/pp964
Azua, S., Youngu, T. T., Aliyu, Y. A., Shebe, M. W., and Sule, J. O. (2019). Spatial multi-criteria analysis for mapping of flood vulnerable areas in Fagge local government area of Kano state, Nigeria. J. Environ. 14.
Bates, P. D., and De Roo, A. D. (2000). A simple raster-based model for flood inundation simulation. J. Hydrology 236 (1-2), 54–77. doi:10.1016/S0022-1694(00)00278-X
Bello, A. A., Abua, M. A., Yelwa, S. A., Undiyaundeye, F. A., Iwara, A. I., Abutunghe, M. A., et al. (2022). Geospatial mapping of areas at risk to flood along sokoto-rima River Basin, sokoto Nigeria environment and. Ecol. Res. 10 (6), 806–823. doi:10.13189/eer.2022.100615
Bentivoglio, R., Isufi, E., Jonkman, N. S., and Taormina, R. (2022). Deep learning methods for flood mapping: a review of existing applications and future research directions. Hydrology Earth Sci. doi:10.5194/hess-2022-83
Bulti, D. T., and Abebe, B. G. (2020). A review of flood modeling methods for urban pluvial flood application. Model. earth Syst. Environ. 6, 1293–1302. doi:10.1007/s40808-020-00803-z
Campos-Durán, D., and Quesada-Román, D. (2017). Riesgos Intensivos y Extensivos en América Central entre 1990 y 2015. Anuário Do Instituto de Geociências—UFRJ 40 (2), 234–249. doi:10.11137/2017_2_234_249
Census (2006). National population distribution by sex, state, LGAs and senatorial zones. Abuja, Nigeria: Census.
Chen, S., Tang, Z., Zhou, H., and Cheng, J. (2019). Extracting topographic data from online sources to generate a digital elevation model for highway preliminary geometric design. J. Transp. Eng. Part A Syst. 145 (4). doi:10.1061/JTEPBS.0000212
Chen, W., Yao, T., Zhang, G., Li, F., Zheng, G., Zhou, Y., et al. (2022). Towards ice-thickness inversion: an evaluation of global digital elevation models (DEMs) in the glacierized Tibetan Plateau. Cryosphere 16, 197–218. doi:10.5194/tc-16-197-2022
Cosentino, D., Chenu, C., and Le-Bissonnais, Y. (2006). Aggregate stability and microbial community dynamics under drying-wetting cycles in a silt loam soil. J. Soil Biol. Biochem. 38, 2053–2062. doi:10.1016/j.soilbio.2005.12.022
Daffi, R. E., Otun, J. A., and Ismail, A. (2014). Flood hazard assessment of river dep floodplains in North-Central Nigeria. Int. J. Water Resour. Environ. Eng. 6 (2), 67–72. doi:10.5897/ijwree2013.0457
Djimesah, I. E., Okine, A. N. D., and Mireku, K. K. (2018). Influential factors in creating warning systems towards flood disaster management in Ghana: an analysis of 2007 northern flood. Int. J. Disaster Risk Reduct. 28, 318–326. doi:10.1016/j.ijdrr.2018.03.012
Echendu, A. J. (2020). The impact of flooding on Nigeria’s sustainable development goals (SDGs). Ecosyst. Health Sustain. 6. doi:10.1080/20964129.2020.1791735
Efobi, K., and Anirobe, C. (2013). Urban flooding and vulnerabilit of Nigerian cities; A case study of awka and Onitsha, in Anambra state,Nigeria. J. Law, Policy Glob. 7.
Egboka, B. C. E., and Okoyeh, E. I. (2019). Review and assessment of environmental impacts of ecological disasters on biodiversity in Anambra state, Nigeria. Biodivers. Int. J. 3 (2), 53–58. doi:10.15406/bij.2019.03.00127
Egboka, B. C. E., Orji, A. E., and Nwankwoala, H. O. (2019). Gully erosion and landslides in southeastern Nigeria: causes, consequences and control measures. Glob. J. Eng. Sci. 2 (4), 2019. doi:10.33552/GJES.2019.02.000541
Egbuchua, C. (2014). Variability in soil properties as influenced by different land use types in an ultisols of the tropical region, delta state, Nigeria. Delta State,Niger. 47, 43–48. doi:10.2478/ats-2014-0006
Ehiorobo, J., and Uso, N. (2015). Flood frequency analysis in the lower River Niger basin at Onitsha Bridge head. J. Eng. Res. 19, 33–44.
Ejenma, E., Sunday, V. N., Okeke, O., Eluwah, A. N., and Onwuchekwa, I. S. (2014). Mapping flood vulnerability arising from land use/land covers change along River Kaduna, Kaduna State, Nigeria. IOSR J. Humanit. Soc. Sci. 19 (7), 155–160. doi:10.9790/0837-1974155160
Emmanuel, I., Andrieu, H., Leblois, E., Janey, N., and Payrastre, O. (2015). Influence of rainfall spatial variability on rainfall–runoff modelling: benefit of a simulation approach? J. Hydrology 531, 337–348. doi:10.1016/j.jhydrol.2015.04.058
Eshtawi, T., Abdellatif, M., and Matar, D. (2021). Geo-spatial assessment of flood vulnerability areas of the Gaza strip towards preparedness and humanitarian response planning. Int. J. Geoinformatics 17 (6), 35–44. doi:10.52939/ijg.v17i6.2063
Franks, S., Storey, J., and Rengarajan, R. (2020). The new Landsat collection-2 digital elevation model. Remote Sens. 12 (23), 3909. doi:10.3390/rs12233909
Hanan, Y. A.-h., and Rifaat, A. (2020). Spatial prediction of coastal flood-susceptible areas in Muscat governorate using an entropy weighted method. Sultanate of Oman: WIT Press.
Hidalgo, H. G., Alfaro, E. J., and Quesada-Román, A. (2024). Flood projections for selected Costa Rican main basins using CMIP6 climate models downscaled output in the HBV hydrological model for scenario SSP5-8.5. Hydrological Res. Lett. 18 (1), 35–42. doi:10.3178/hrl.18.35
Ikirri, M., Faik, F., Echogdali, F. Z., Antunes, I. M. H. R., Abioui, M., Abdelrahman, K., et al. (2022). Flood hazard index application in arid catchments: case of the taguenit wadi watershed, lakhssas, Morocco. Land 11 (8), 1178. doi:10.3390/land11081178
Innocent, E. B., and Steve, O. O. (2015). Geospatial analysis of flood problems in jimeta riverine community of adamawa state, Nigeria. J. Environ. Earth Sci. 15.
Izueke, E. M., and Eme, O. I. (2013). Urban planning problems in Nigeria: a case of Onitsha metopolis of Anambra state. J. Bus. Econ. Manag. Stud. 19. doi:10.12816/0003828
Jenson, J. R. (2007). Remote sensing of the environment. Second edition. Upper Saddle River: Pearson Prentice Hall. (Chapter 11).
Jha, A. K., Bloch, R., and Lamond, J. (2012). Cities and flooding: a guide to integrated urban flood risk management for the 21st century. Chicago: World Bank Publications.
Kalantari, Z., Alireza, N., Steve, W., Lyon, B.-O., and Lennart, F. (2014). A method for mapping flood hazard along roads. J. Environ. Manag. 133, 69–77. doi:10.1016/j.jenvman.2013.11.032
Kefas, P. K., Zata, A., Philip, H. J., Ukabiala, M. E., and Ezekiel, T. N. (2016). Soil assessment of selected floodplain soil in Nigeria to support agriculture advancement. Int. J. Plant Soil Sci. 13.
Khemiri, L., Katlane, R., Khelil, M., Gaidi, S., Ghanmi, M., and Zargouni, F. (2024). Flood mapping of the lower Mejerda Valley (Tunisia) using Sentinel-1 SAR: geological and geomorphological controls on flood hazard. Front. Earth Sci. 11, 1332589. doi:10.3389/feart.2023.1332589
Komolafe, A. A., Awe, B. S., Olorunfemi, I. E., and Oguntunde, P. G. (2020a). Modelling Flood-prone areaand vulnerability using integration of multi-criteria analysis and hand model in the Ogun River Basin,Nigeria. Hydrological Sci. J. 65 (10), 1766–1783. doi:10.1080/02626667.2020.1764960
Komolafe, A. A., Olorunfemi, I. E., Akinluyi, F. O., Adeyemi, M. A., and Ajayi, J. A. (2020b). Enhanced flood hazard modelling using hydraulic, analytical hierarchical process and height above nearest drainage models in Ogunpa river basin, Ibadan, Southwestern Nigeria. Model. Earth Syst. Environ. 7 (2), 967–981. doi:10.1007/s40808-020-01037-9
Ladislav, K., Jaromír, S., and Vesely, D. (2014). Physical characteristics affecting the infiltration of high intensity rainfall into a soil profile. J. Soil & Water Res. 7. doi:10.17221/93/2013-SWR
Lawal, D. U., Matori, A. N., Yusuf, K. W., Hashim, A. M., and Balogun, A. L. (2014). Analysis of the flood extent extraction model and the natural flood influencing factors: a GIS-based and remote sensing analysis. 8th Int. Symposium Digital Earth (ISDE8) IOP Publ. IOP Conf. Ser. Earth Environ. Sci. 18 (2014), 012059. doi:10.1088/1755-1315/18/1/012059
Mahabaleshwara, H., and Nagabhushan, H. (2014). A study on soil erosion and its impacts on floods and sedimentation. Int. J. Res. Eng. Technol. 9.
Mccormack, T., Liovet, J. C., and Naughton, O. (2022). A methodology for mapping annual flood extent using multi-temporal Sentinel-1 imagery. Remote Sens. Environ. 282, 113273. doi:10.1016/j.rse.2022.113273
Mfon, I. E., Oguike, M. C., Eteng, S. U., and Etim, N. M. (2022). Causes and effects of flooding in Nigeria: a review. East Asian J. Multidiscip. Res. (EAJMR) 1 (9), 1777–1792. doi:10.55927/eajmr.v1i9.1261
Mohamed, A., and Ali, A. S. (2013). Irrigation of sandy soil, basics and scheduling. Abu Dhabi Open Access Publ. doi:10.5772/55117
NEMA and OCHA (2012). NEMA and OCHA launch the Nigerian humanitarian forum on flood response in Nigeria | OCHA. Available at: https://www.unocha.org/publications/report/nigeria/nema-and-ocha-launch-nigerian-humanitarian-forum-flood-response-nigeria (Accessed November 12, 2012).
Nemine, E. L. (2015). Flood disasters in Nigeria: farmers and governments’ mitigation efforts. J. Biol. Agric. Healthc. 5, 150–154.
Nkiruka, E. M., Chinedu, A. D., and Smart, U. N. (2023). Landuse, landcover change dynamics and flooding in the lower Niger basin Onitsha, South Eastern Nigeria. Land Use Policy J. 131, 106748. doi:10.1016/j.landusepol.2023.106748
Nkwunowo, U., Whitworth, M., and Baily, B. (2015). A review and critical analysis of the efforts towards urban flood risk management in the lagos region of Nigeria. J. Nat. Hazards Earth Syst. Sci., 21. doi:10.5194/nhessd-3-3897-2015
Nura, U., and Alison, G. (2022). Flooding in Nigeria: a review of its occurrence and impacts and approaches to modelling flood data. Int. J. Environ. Stud. 80, 540–561. doi:10.1080/00207233.2022.2081471
Nwachukwu, M. A., Alozie, C. P., and Alozie, G. A. (2018). Environmental and rainfall intensity analysis to solve the problem of flooding in Owerri urban. J. Environ. Hazards 1, 107.
Odunuga, S., Adegun, O., and Raji, a. S. U. (2015). Changes in flood risk in Lower Niger– Benue catchments. J. Int. Hydrological Sci., 6.
Ogbodo, E. (2011). Assessment of some soil fertility characteristics of abakaliki urban flood plains of south-east Nigeria, for sustainable crop production. World J. Agric. Sci. 7.
Olanrewaju, C. C., Chitakira, M., Olanrewaju, O. A., and Louw, E. (2019). Impacts of flood disasters in Nigeria: a critical evaluation of health implications and management. Jamba 11 (1), 557. PMID: 31061689; PMCID: PMC6494919. doi:10.4102/jamba.v11i1.557
Oloruntade, A. J., Mogaji, K. O., and Imoukhuede, O. B. (2018). Rainfall trends and variation over Onitsha, Nigeria. Ruhuna J. Sci. 12. doi:10.4038/rjs.v9i2.40
Onibokun, A. G. (1989). Urban growth and urban management in Nigeria in african cities in crises. Boulder Colorado: Westview Press.
Osakwe, S., Akpoveta, O., and Osakwe, J. (2014). The impact of Nigerian flood disaster on the soil quality of farmlands in oshimili South local government area of delta state, Nigeria. Chem. Mater. Res. 11.
Patera, A., and Votruba, L. (2004). Floods in the Czech republic čvtvhs, prague. in Czech: Prague. Czech: ČVTVHS.
PDNA (NIGERIA Post-Disaster Needs Assessment) (2012). Floods the federal government of Nigeria with technical support from the world bank, EU, UN, and other partners. Available at: https://www.gfdrr.org/sites/default/files/publication/pda-2012-nigeria.pdf.
Pinos, J., and Quesada-Román, A. (2022). Flood risk-related research trends in Latin America and the caribbean. Water 14, 10. doi:10.3390/w14010010
Puno, G. R., Puno, R. C. C., and Maghuyop, I. V. (2022). Flood hazard simulation and mapping using digital elevation models with different resolutions. Glob. J. Environ. Sci. Manage. 8 (3), 339–352. doi:10.22034/gjesm.2022.03.04
Quesada-Román, A. (2022). Flood risk index development at the municipal level in Costa Rica: a methodological framework. Environ. Sci. Policy 133, 98–106. doi:10.1016/j.envsci.2022.03.012
Quesada-Roman, A. (2023). Priorities for natural disaster risk reduction in Central America. PLOS Clim. 2 (3), e0000168. doi:10.1371/journal.pclm.0000168
Quesada-Román, A., and Villalobos-Chacón, A. (2020). Flash flood impacts of Hurricane Otto and hydrometeorological risk mapping in Costa Rica. Geografisk Tidsskrift-Danish J. Geogr. 120 (2), 142–155. doi:10.1080/00167223.2020.1822195
Quesada-Román, A., and Villalobos-Chacón, A. (2020). Flash flood impacts of Hurricane Otto and hydrometeorological risk mapping in Costa Rica. Geografisk Tidsskrift-Danish J. Geogr. 120, 142–155. doi:10.1080/00167223.2020.1822195
Quesada-Romána, A., and Campos-Durán, D. (2023). Natural disaster risk inequalities in Central America. Pap. Appl. Geogr. 9 (1), 36–48. doi:10.1080/23754931.2022.2081814
Reynolds, W., Elrick, D. E., and Clothier, B. E. (1985). The constant head well permeameter: effect of unsaturated flow. Soil Sci. 39 (1985), 172–180. doi:10.1097/00010694-198502000-00011
Sanders, B. F. (2007). Evaluation of on-line DEMs for flood inundation modeling. Adv. Water Resour. 30 (8), 1831–1843doi. doi:10.1016/j.advwatres.2007.02.005
Sharma, D., and Swarup, A. (1988). Effects of short-term flooding on growth, yield and mineral composition of wheat on sodic soil under field conditions. Plant Soil 107, 137–143. doi:10.1007/bf02371555
Temi, O., Obioma, O., and Adebayo, O. E. (2021). Urban flood event and associated damage in the Benue valley, Nigeria. J. Nat. Hazards 37. doi:10.21203/rs.3.rs-272269/v1
Teng, J., Vaze, J., Dutta, D., and DuttaMarvanek, D. S. (2015). Rapid inundation modelling in large floodplains using LiDAR DEM. Water Resour. Manage 29, 2619–2636. doi:10.1007/s11269-015-0960-8
Thalakkottukara, N. T., Thomas, J., WatkinsHolland, M. K. B. C., Oommen, T., and Grover, H. (2024). Suitability of the height above nearest drainage (HAND) model for flood inundation mapping in data-scarce regions: a comparative analysis with hydrodynamic models. Earth Sci. Inf. 2024. doi:10.1007/s12145-023-01218-x
Timothy, S., Farewell, S. J., and Oliver, P. (2017). The influence of soil on the impacts of burst water mains on infrastructure and society: a mixed methods investigation. J. Nat. Hazards Earth Syst. Sci. 30. doi:10.5194/nhess-2017-433
Ugoyibo, O. D. V., and Ogbonna, C. E. (2017). Spatial assessment of flood vulnerability in Anambra East local government area, Nigeria using GIS and remote sensing. Br. J. Appl. Sci. Technol., 11. doi:10.9734/BJAST/2017/29378
Umar, N., and Gray, A. (2022). Flooding in Nigeria: a review of its occurrence and impacts and approaches to modelling flood data. Int. J. Environ. Stud. 80, 540–561. doi:10.1080/00207233.2022.2081471
Vashist, K., and Sing, K. K. (2023). HEC-RAS 2D modeling for flood inundation mapping: a case study of the Krishna River Basin. Water Pract. Technol. 18 (4), 831–844. doi:10.2166/wpt.2023.048
Wang, L., Cui, S., Huang, H., Manandhar, B., and Nitivattananon, V. (2022). A review of the flood management: from flood control to flood resilience. Heliyon 8 (11), e11763. doi:10.1016/j.heliyon.2022.e11763
Keywords: exposure rate, flood risk, flood susceptibility, landsat imagery, soil classification, soil composition, lower Niger catchment, southeastern Nigeria
Citation: Chinedu AD, Ezebube NM, Uchegbu S and Ozorme VA (2024) Integrated assessment of flood susceptibility and exposure rate in the lower Niger Basin, Onitsha, Southeastern Nigeria. Front. Earth Sci. 12:1394256. doi: 10.3389/feart.2024.1394256
Received: 01 March 2024; Accepted: 14 May 2024;
Published: 17 June 2024.
Edited by:
Veysel Turan, Bingöl University, TürkiyeReviewed by:
Guy Jean-Pierre Schumann, University of Bristol, United KingdomAdolfo Quesada-Román, University of Costa Rica, Costa Rica
Copyright © 2024 Chinedu, Ezebube, Uchegbu and Ozorme. This is an open-access article distributed under the terms of the Creative Commons Attribution License (CC BY). The use, distribution or reproduction in other forums is permitted, provided the original author(s) and the copyright owner(s) are credited and that the original publication in this journal is cited, in accordance with accepted academic practice. No use, distribution or reproduction is permitted which does not comply with these terms.
*Correspondence: Ani D. Chinedu, Q2hpbmVkdS5hbmlAdW5uLmVkdS5uZw==, YmVkcm9jazk2OUB5YWhvby5jb20=