 Hui Li
 Kun Song
 Xing Zhai1
- 1Hebei Key Laboratory of Geological Resources and Environment Monitoring and Protection, Shijiazhuang, China
- 2Hubei Key Laboratory of Disaster Prevention and Mitigation, Yichang, China
The landslide susceptibility map estimates the quantitative relationship between known landslides and control factors, and it has been used for site selection of infrastructures and geo-disaster management. As landslides and rockfalls occur frequently in mountainous areas in Hebei Province, China, due to road construction, the managing government needs to evaluate the vulnerability of geo-disasters in the road slopes to avoid unfavorable site selection for subsequent road constructions. Some typical collector road slopes were used as the study area in Pingshan County, Hebei Province. By analyzing the landslide triggering factors, we determined classification criteria and proposed a comprehensive method for determining the weighting. The respective weighting was calculated by the AHP and CRITIC method, and the combination weighting was determined by the game theory method. The landslide susceptibility of collector roads was evaluated and mapped using the ArcGIS platform. The susceptibility map was validated using landslide field investigation. The validation results show the effectiveness of the susceptibility methods, given the good number of correctly classified landslides. The landslide susceptibility map could have a significant impact on reducing the vulnerability of infrastructure to landslides in Hebei Province, China.
1 Introduction
In mountainous areas, many slopes are excavated during road construction. Cut slopes are implemented to prevent failure disasters due to the high investments involved in construction of expressways and highways. Various measures including flexible safety protection nets, masonry, and reinforcement protection are employed. However, collector roads connecting towns and villages are often rough and simply excavated, with little to no protection due to budget constraints, especially in China and other developing countries.
Most of the collector roads in the mountainous areas of Hebei Province were constructed in the 1980s and 1990s, and the road surface was made of macadam without concrete or bituminous pavement. Although the road surface has been improved to concrete pavement since the 2000s, the cut slopes were not protected in order to save costs. The slopes are steep, and the rocks and soils are exposed to the air. They are often impacted by slope failure during heavy rain. The safety and stability of the slopes are major concerns for the government (Zhang et al., 2024). Therefore, it is crucial to systematically conduct landslide risk assessments of cut slopes along collector roads in Hebei Province, China.
For risk assessment, landslide susceptibility is used to predict “where” landslides are likely to occur (Guzzetti et al., 2005; Razavi-Termeh et al., 2021; Zhang J. et al., 2023). After considerable effort for more than 50 years, abundant research achievements have been made on landslide susceptibility mapping. Brabb et al. (1972) conducted a landslide susceptibility study in San Mateo city and obtained a landslide susceptibility map. Reichenbach et al. (2018) conducted a review of statistical methods for landslide susceptibility modeling and associated terrain zonations. Most of the research studies focus on landslide susceptibility methodologies and models. The majority of the models are divided into two categories: knowledge-based empirical models and data-driven statistical models. The practical model relies on the accumulation of knowledge and understanding of geological environmental conditions, and the accuracy of predictions is directly determined by expert experience (Pourghasemi et al., 2012; Zhu et al., 2014; Kaur et al., 2017; Huang et al., 2020; Das et al., 2021). Data-driven statistical modeling uses historical landslide data to establish the mapping relationship between landslides and related factors. Many researchers have utilized the logistic regression model (Wang et al., 2023; Zeng et al., 2023), artificial neural networks (ANNs), support vector machine (SVM) (Goetz et al., 2015; Dou et al., 2020; Cao et al., 2023), random forest (RF) (Goetz et al., 2015; Merghadi et al., 2018; Hong, 2023), decision trees (Tsangaratos and Ilia, 2016; Park et al., 2018), extreme gradient boosting (XGBoost) (Zhang X. et al., 2023; Cao et al., 2023), FR-TabNet (Chang et al., 2023), and other machine learning methods (Chen and Wang, 2007; Merghadi et al., 2020; Du et al., 2021). The quality of the models has improved over the years, but high-quality assessments are rare (Reichenbach et al., 2018). Huang et al. (2024) reviewed the landslide susceptibility prediction modeling and proposed a semi-supervised imbalanced theory to overcome the uncertain issues found in the previous study. In addition, various factors affect the susceptibility to landslides in specific regions, and the maps generated from the models also need to be validated through field investigations before being submitted for landslide reduction purposes.
In the mountainous areas of Hebei Province in China, landslides and rockfalls frequently occur in Pingshan County, particularly on cut slopes along collector roads, where protection measures are relatively simple. The risk evaluation lacks detailed classification criteria, and the methods for weighting detection are incomplete. Based on this, we will take the collector roads in Pingshan County as an example. By analyzing the factors that influence landslides, we established classification criteria and by using the ArcGIS platform evaluated the landslide risks along the collector roads that connect towns and villages. This work is significant for preventing and reducing landslide occurrences in the mountainous areas of Hebei Province.
2 Study area
Pingshan County (Figure 1) is situated in the western part of Hebei Province, China, at the eastern foothills of the Taihang Mountain. It is located at longitude 113°31′–114°15′E and latitude 38°09′–38°45′N. The county covers an area of 2,648 sq km. The topography of Pingshan county gradually increases from east to northwest, with elevations ranging from 112 m to 2,266 m. The area features three main types of landforms, namely plains, hills, and mountains, with approximately 17 mountains 1,000 m above sea level.
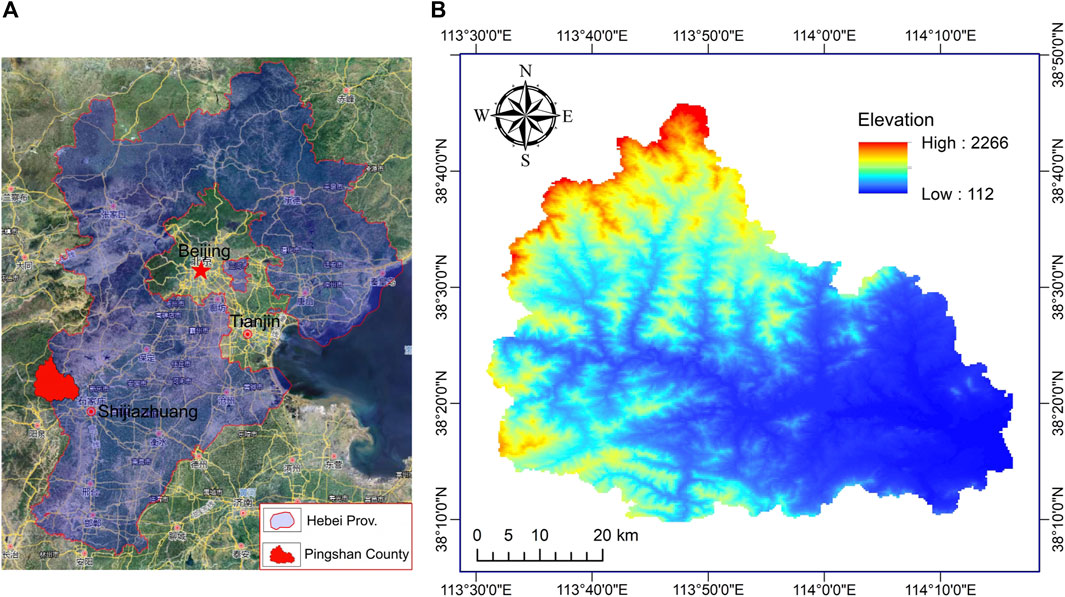
Figure 1. Study area map: (A) location; (B) elevation.
The surface water in Pingshan county is part of the Haihe River system, and the total length of rivers in the county is 1315.6 kilometers. The Hutuo River is the longest river in the county, stretching 110 km from west to east. Pingshan County has a typical warm temperate continental semi-humid monsoon climate, characterized by hot, rainy summers and cold, dry winters.
According to statistics, the eastern parts of Pingshan county, which are characterized by a plain landform, showed low susceptibility to geological hazards. Geological hazards, including landslides and rockfalls, frequently occur in the western parts of the county, particularly on the slopes along the collector roads that connect towns and villages. Therefore, a 1,000-m region on both sides of the collector roads in the western mountainous area of Pingshan county was selected as the study area.
The annual average precipitation of the study area is 525.8 mm, and the maximum precipitation is 1,209 mm in 1996. Rainfall mainly occurs in June to September, accounting for more than 80% of the annual precipitation. The annual average precipitation of Pingshan County is shown in Figure 2.
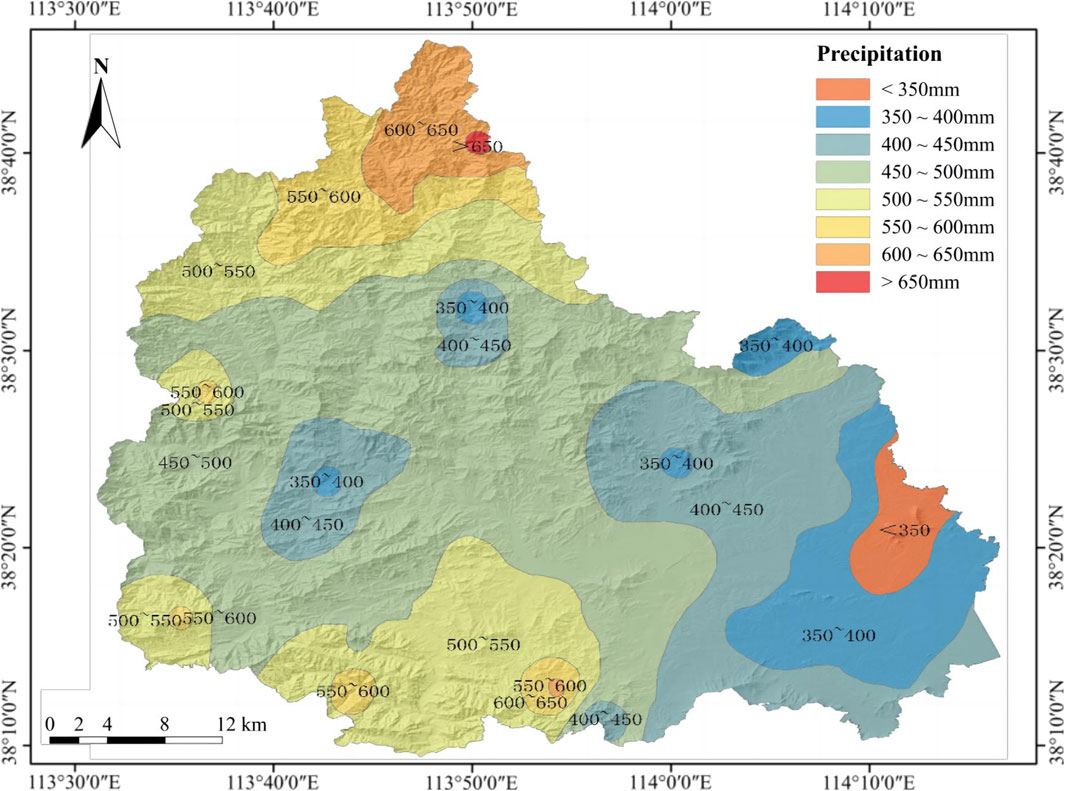
Figure 2. Annual average precipitation of the study area.
The stratigraphy of Pingshan county is Neoarchean, Paleoproterozoic, Mesoproterozoic, Ordovician, and Quaternary. The distribution is shown in Figure 3. Most parts of the study area are Neoarchean leptynite and gneiss. There is some limestone with Ordovician dolomite in the southern part of the area. The Quaternary stratum is distributed in the eastern part, which includes plains, and the stratum consists of fluvial deposits and Malan loess.
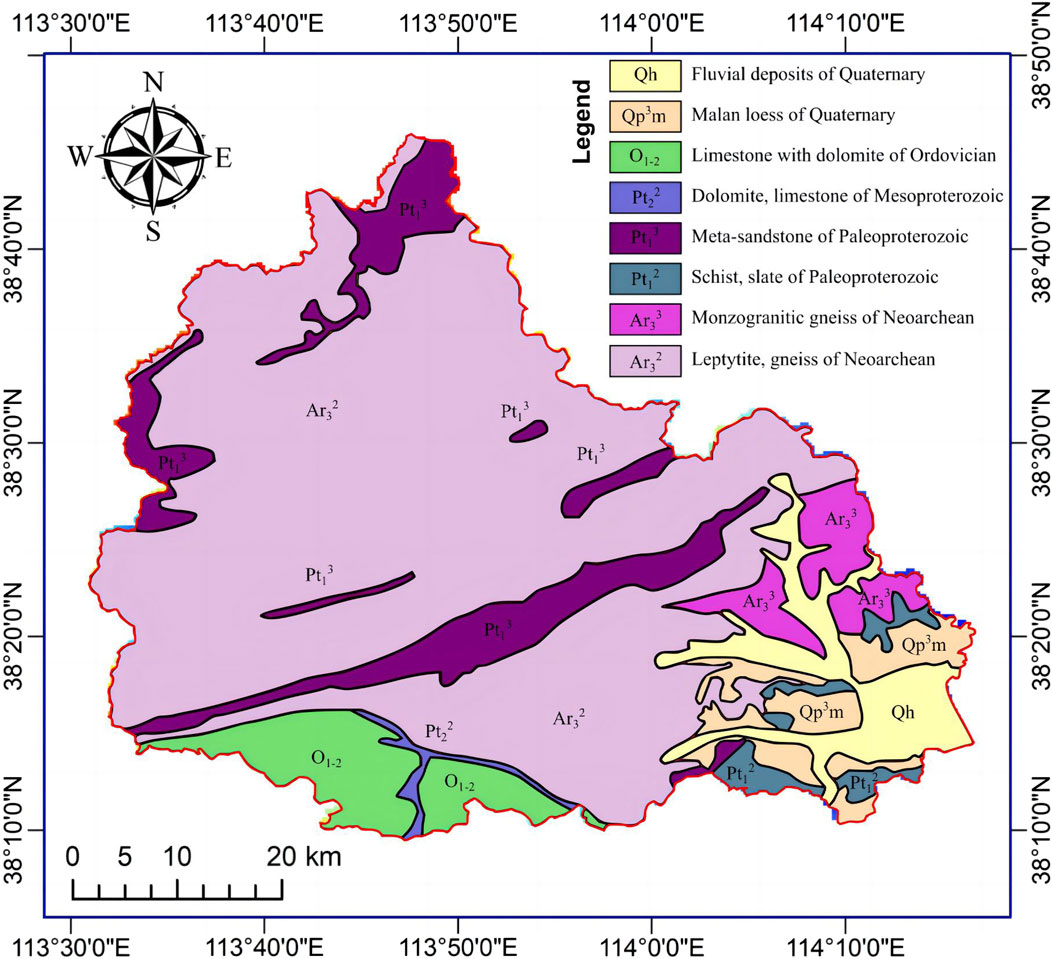
Figure 3. Geological map of the study area.
3 Methodology
The methodology followed in this research mainly comprised the following steps: 1) the mapping units were prepared according to the environmental and geological data of the study area; 2) the matter element was used to quantify each landslide-influencing factor based on the Extenics theory; 3) the factor weights were determined by the analytic hierarchy process (AHP) and the CRITIC method; and 4) the results were then compared using expert field investigation.
3.1 Extenics theory
Extenics theory is a newly developing interdisciplinary subject that combines mathematics, philosophy, and engineering. It was introduced by Prof. Cai, (1999) of Guangdong University of Technology (China) in 1983. It offers a valuable formalized model for analyzing the extensibility of concepts. Additionally, it is an effective approach for generating originality and innovation to quantitatively resolve conflicting issues.
The Extenics Theory describes matter in three elements: matter, character, and corresponding character value. The matter element denotes a logical cell of Extenics theory. It is assumed that three elements together can qualitatively and quantitatively solve contradictory and incompatible problems. Matter is represented as N, character as c, and character value as v. Therefore, the matter element is defined as R = [N, c, v].
3.1.1 Define classical domain
In the matter element R = [N, c, v], N denotes the assembling item with its character c and value v. For the susceptibility evaluation of the study area, the evaluated level N0j has m characters, and the matter element is expressed by the following matrix (Eq. 1):
where N0j denotes the evaluated level, j (j = 1, 2, 3, m) is partition levels, ci (i = 1, 2, 3, n) is the characters of the rank, and N0j is the susceptibility degree.
3.1.2 Define segment domain
The define segment domain is calculated as Eq. 2.
where P refers to the set of every rank about the evaluation of matter;
3.1.3 Define evaluation of a matter element
For the evaluation of an object P, the collected data or analysis results of a matter element thus obtained is assigned the expected evaluation of the matter element R (Eq. 3).
where P is an evaluated object, ci is the factor of effect degree, and vi is P's value about the factor ci.
3.1.4 Define the correlation of each rank about the evaluation index
The correlation of each index vi about rank j is as follows Eq. 4:
where K0j (vi) is the dependent degree of No. i index value vi; v0ji refers to the value field of No. i index subjected to No. j rank; and
3.2 Weighting determined method
The importance of each indicator varies in the evaluation results, and it is necessary to determine the weight of each indicator. To determine the weight, two types of methods are employed: subjective and objective methods. The widely used subjective methods include the analytic hierarchy process (AHP) and decision-making trial and evaluation laboratory (DEMATEL), while the objective methods include the CRITIC method, entropy weight method (EWM), and principal component analysis (PCA) (Goetz et al., 2015; Tsangaratos and Ilia, 2016; Park et al., 2018; Cao et al., 2023; Hong, 2023). In this paper, the AHP and the CRITIC method were used to determine the subjective and objective weights, respectively. The game theory method was used to calculate the subjective and objective combination weights.
3.2.1 Analytic Hierarchy Process (AHP)
The analytic hierarchy process (AHP) is a subjective method for assigning weights to indicators, which assesses the importance of each indicator and determines its weight based on the experts’ experience.
The importance of each criterion Bi for objective A and the importance of each index Cij for criterion Bi were compared in pairs. The importance rating criteria were used in the 1–9 scale method (see Table 1) to create the comparison matrix.
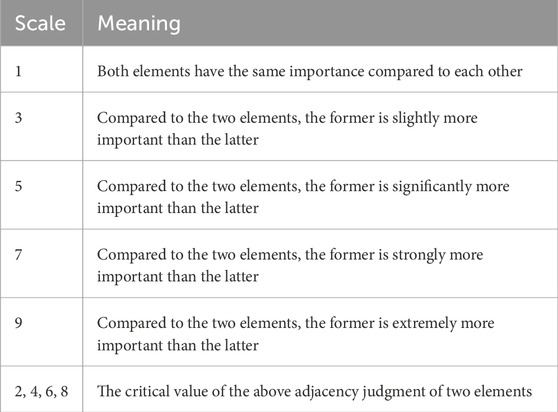
Table 1. The 1–9 scale method and its meaning.
To check if the weights are reasonably assigned, a consistency check is necessary for the comparison matrix (Eq. 5).
where CR is the random consistency ratio of the comparison matrix and RI is the average stochastic consistency index of the comparison matrix; the value is shown in Table 2. CI is the general consistency index of the comparison matrix, which is calculated as Eq. 6.
where λmax is the largest eigenvalue of the comparison matrix and n is the order of the evaluation indicators.

Table 2. Average random consistency index RI of judgment Matrix.
When the CR is less than 0.1, the comparison matrix is considered to have satisfactory consistency, indicating that the weight coefficients are reasonably assigned. Otherwise, the comparison matrix needs to be adjusted until a satisfactory level of consistency is achieved.
3.2.2 CRITIC
The CRiteria Importance Through Intercriteria Correlation (CRITIC) method proposed by Diakoulaki et al. (1995) is mainly used to determine the weights of objectives. The distinction in information among evaluation indicators is established by assigning lower weights to indicators with significant horizontal similarity and higher weights to indicators with substantial vertical disparity. The weight of the indicators is determined by comparing the strength and conflicting nature of each indicator. It not only considers the disparity in values among indicators but also analyzes their correlation. The CRITIC method is effective for determining the objective weights of relative importance in multicriteria decision problems. It can eliminate the adverse effects caused by highly correlated evaluated indicators and reduce overlapping information among them, promoting more credible evaluation results.
Due to the varying dimensions of each attribute, the CRITIC method primarily assigns weights based on the disparity and information content of the data. However, the difference in dimensions and magnitude makes them incomparable. The dimension can eliminate the negative impact and accurately reflect the true extent of objective empowerment. This paper utilizes the extreme value method for dimension estimation.
Assuming that there are m alternatives to be evaluated and n evaluation criteria for slope risk assessment evaluation, the data matrix is as follows (Eq. 7):
where aij is the corresponding value of the jth (j = 1, 2, …, n) index of the ith (i = 1, 2, …, m) evaluation object.
Due to the differences in the nature and dimension of each evaluation index, the weight of the evaluation index will shift. It is necessary to normalize the data matrix to map the evaluation index values to the interval [0,1], eliminate the influence of different dimensions, and obtain the normalized matrix X. The formulations are as follows (Eqs 8, 9):
where x is the normalized treatment value and max (aij) and min (aij) are the maximum and minimum values of a certain evaluation index, respectively.
The dispersion degree is expressed in the form of standard deviation, which is calculated as follows (Eq. 10):
The conflict degree is calculated by (Eq. 11)
where rij represents the Pearson correlation coefficient of criteria i and j and is calculated as follows (Eq. 12):
The amount of information is calculated as follows (Eq. 13):
The weight of the criterion is (Eq. 14).
3.3 Combination weight of game theory
To prevent information loss resulting from a single weighting method and enhance the accuracy of the weights, the combined weighting method of game theory is utilized to optimize the weights obtained from the two methods.
The set of weight vectors
Game theory is used to bring different weight vectors into agreement and compromise. The goal of minimizing the deviation of c and ck is achieved by optimizing the linear combination coefficient αk (Eq. 16).
According to the differential properties of the matrix, the first-order derivative condition of the above formula optimization is shown as follows (Eq. 17).
The linear equations corresponding to the above formula are as follows (Eq. 18):
Normalize the linear combination coefficient (Eq. 19).
Calculate the combined weight (Eq. 20).
4 Selection of susceptibility evaluation indexes and classification standards
4.1 The selection of evaluation indexes
The evaluation indexes were chosen based on the investigation of landslides on collector roads in Pingshan County, in conjunction with geological surveys conducted in previous years. In Pingshan County, the primary evaluation indexes for landslides include the slope angle, aspect, elevation, profile curvature, angle between the slope aspect and stratum dip direction, Normalized Difference Vegetation Index (NDVI), distance to faults, and rainfall (total average annual precipitation). As the rock lithology in the study area consists of similar hard metamorphic rock groups, it is not considered in risk evaluation.
4.2 Standards for classification of evaluation indexes
For the factors (e.g., slope angle, aspect, elevation, profile curvature, angle between slope aspect and stratum dip direction, NDVI, distance to faults, and rainfall), the values are calculated using the Statistics tool in ArcGIS software. These indexes need to be classified. Based on field investigations, experts’ experiences, and several examples in the literature, the threshold value for each category was initially determined using the natural breakpoint method. Subsequently, it was slightly adjusted by calculating the number of historical landslides within each category to better align with the actual situation (Figure 4). All eight evaluation indexes were categorized into four groups corresponding to the four risk levels of low, medium, high, and very high in landslide susceptibility (Table 3).
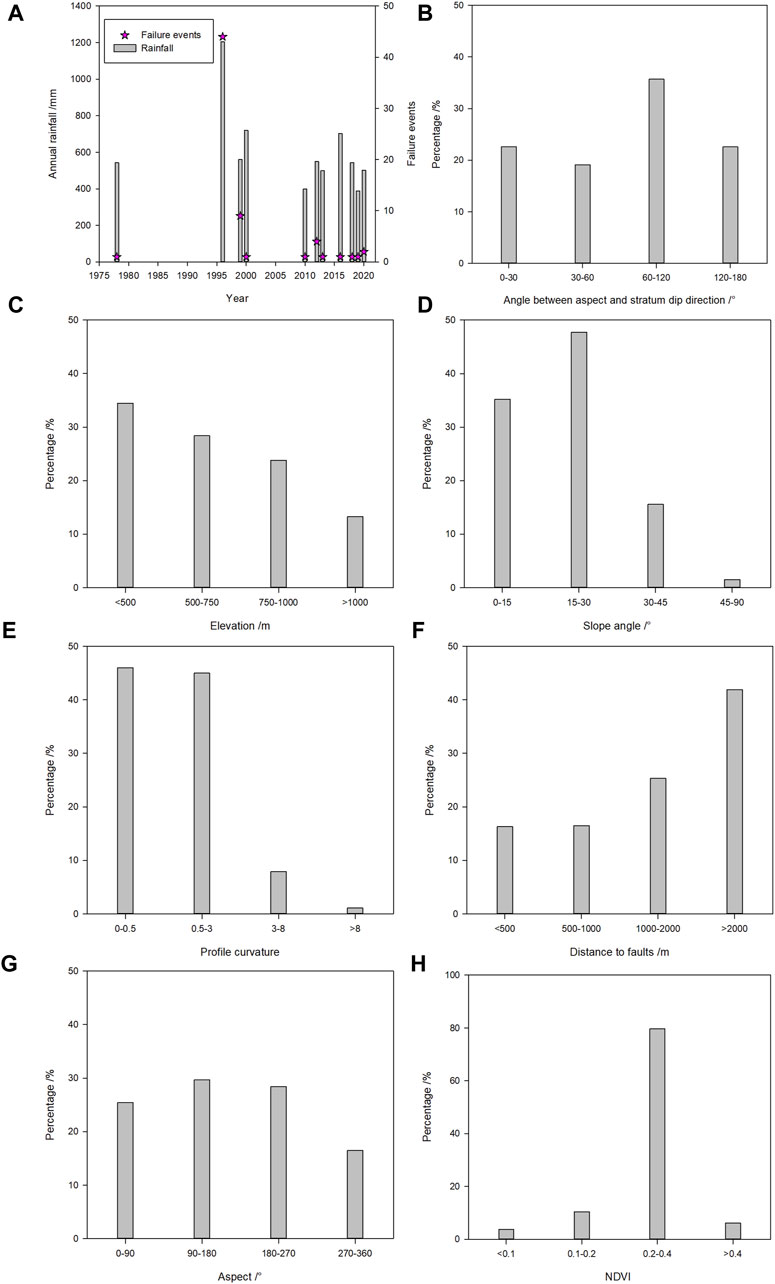
Figure 4. Relationship between evaluation indexes and geological disasters: (A) annual rainfall and landslide failure events; (B) angle between slope aspect and stratum dip direction; (C) elevation; (D) slope angle; (E) profile curvature; (F) distance to faults; (G) aspect; (H) NDVI.

Table 3. Classification standard of evaluation indexes for landslide risk.
Rainfall is one of the primary factors that trigger geological disasters in Pingshan County. The higher the intensity of rainfall, the greater the likelihood of occurrence of geological disasters (Figure 4A). Therefore, the average annual rainfall data were classified into four categories: <500 mm, 500–600 mm, 600–700 mm, and >700 mm.
The angle between the slope aspect and the direction of stratum dip influences slope stability and potential failure modes, such as planar, wedge, and toppling failures. After conducting kinematic analysis using stereographic projection (Wyllie and Mah, 2017), the angle between the slope aspect and stratum dip direction was classified into four categories: 0°–30°, 30°–60°, 60°–120°, and 120°–180° (Figure 4B). The slope angle of 0°–30° is considered a transitional slide and has a very high risk of landslide susceptibility. Otherwise, a reverse slope with an angle of 120°–180° may result in a failure of the toppling mode and pose a low risk.
The elevation affects the landform and slope stability. In the study area, the occurrence of landslide geological hazards follows a normal distribution in relation to the elevation (Figure 4C). It was mainly distributed in the range of 500 to 750 m, which included areas of human farming activities, level terraced fields, and roads. Based on the current situation in Pingshan County, elevation is classified into four categories: <500 m, 500–750 m, 750–1,000 m, and >1,000 m.
Slope is one of the most critical factors influencing landslides. The slope data in this study were calculated using the ArcGIS surface analysis tool based on the digital elevation model (DEM) data. The classification is divided into four categories: 0°–15°, 15°–30°, 30°–45°, and 45°–90° (Figure 4D). The landslide at 15°–30° has the most advanced development among them.
The profile curvature indicates the rate of local topographic changes in slope. A steeper curvature results in increased localized stress on the slope, which can be harmful to slope stability. We calculated the profile curvature of the study area (Figure 4E) and classified it into four categories: <0.5, 0.5–3.0, 3.0–8.0, and >8.0.
The distance to faults significantly affects the integrity of rock and soil. Generally, the rock mass is more fractured near faults, leading to the development of more geological disasters. The landslide percentage is calculated in four categories and is shown in Figure 4F. The distances were categorized into four groups: < 500 m, 500–1,000 m, 1,000–2,000 m, and >2,000 m.
The aspect of the slope of the study area was calculated using ArcGIS. The statistical results were then classified into four categories with intervals of 90° within the range of 0° to 360°, as illustrated in Figure 4G: 0°–90°, 90°–180°, 180°–270°, and 270°–360°.
The Normalized Difference Vegetation Index (NDVI) is commonly used to estimate the amount of vegetation present at any given location. We classified the NDVI map into four categories with the following values: <0.1, 0.1–0.2, 0.2–0.4, and >0.4. Most of the geological disasters occurred in areas in Pingshan County with an NDVI of 0.2 to 0.4 (Figure 4H).
To reduce data discreteness, eight factors were normalized after reclassifying the data. The classification index values of these factors were then linearly transformed to fit within the [0, 1] interval (Table 4).
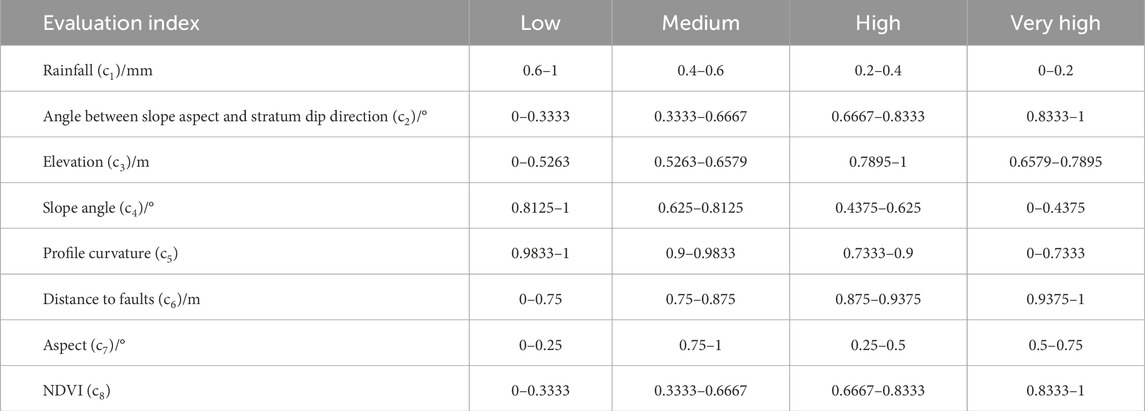
Table 4. Transformed classification standard (normalized).
5 Results
5.1 Matter elements according to Extenics theory
According to the classification standards of landslide susceptibility evaluation indexes, we calculated the classical domain (R01–R04) and segment domain (Rp) of landslide hazards of collector roads in the Pingshan County. These are shown in Eq. 21 and Eq. 22 (only some of the results for simplicity).
The study area was gridded by using ArcGIS software, and the total number of grids was 9,987,000, with the size of 10 m × 10 m. Then, the grid cells were introduced to be the basements to calculate the matter elements. Taking the ith cell as an example, the matter element to be evaluated is Eq. 23.
5.2 Combination weighting determination
Based on the AHP, the judgment matrix A (Eq. 24) was constructed, and the weighting of each evaluation index was obtained.
Where the consistency check ratio CR = 0.0041, the weightings were reasonably assigned. Therefore, the weightings of each evaluation index could be calculated and are listed in Table 5.

Table 5. Weighting of evaluation indexes by AHP.
Another weighting determination method for each evaluation index was based on the CRITIC. The results such as dispersion degree, conflict degree, amount of information, and weighting are listed in Table 6 according to Eqs 7–14.
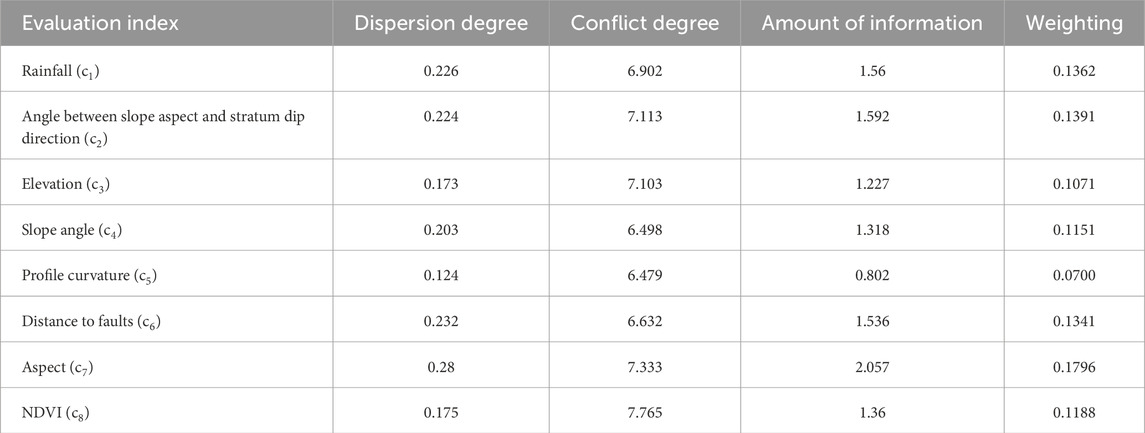
Table 6. Weighting of evaluation indexes by the CRITIC method.
After the weightings of each evaluation index were determined by the AHP and CRITIC method, the combination ones were calculated based on game theory. According to Eqs 15–20, the results were calculated and are listed in Table 7.
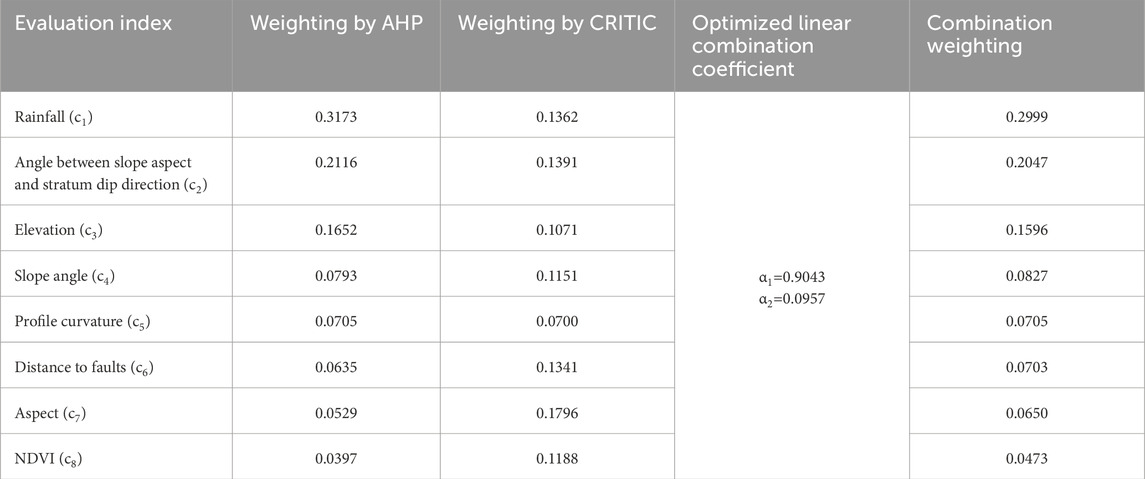
Table 7. Combination weights determined by the game theory.
5.3 Landslide susceptibility map
The landslide susceptibility map of collector roads in Pingshan County was created following the methods described in this paper (Figure 5). ArcGIS software and the natural breakpoint method were used to reclassify susceptibility into four categories: low, medium, high, and very high. It can be observed that the study areas are primarily distributed in regions of medium and low levels of susceptibility to landslides. The regions with very high and high levels of susceptibility are distributed in the northern part of the county. This area has the highest elevation with steep slopes in Pingshan County (see Figure 1). It also experiences heavy rainfall during the summer season and has the largest annual average precipitation. The landslide susceptibility map has been verified through field investigation by engineers and submitted to the transport authority and local government to mitigate geological disasters.
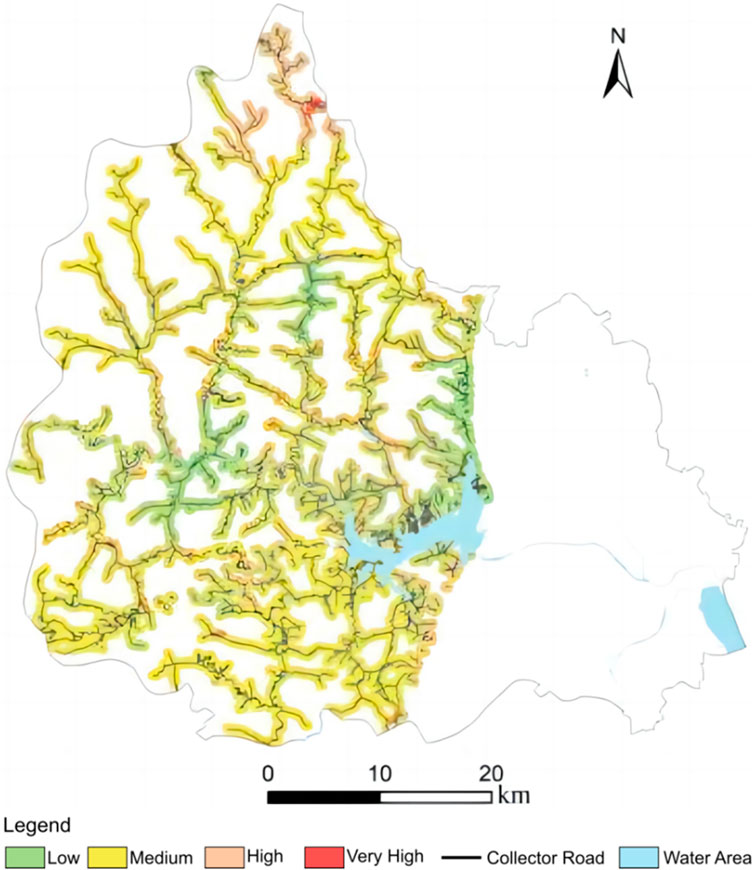
Figure 5. Landslide susceptibility map of the collector roads.
6 Conclusion
Landslide susceptibility assessment is essential for effective landslide disaster management. The evaluation indexes were determined to include eight influencing factors, namely slope angle, aspect, elevation, profile curvature, angle between slope aspect and stratum dip direction, Normalized Difference Vegetation Index (NDVI), distance to faults, and rainfall (total average annual precipitation), after analyzing the relationship between factors and landslide failure events in Pingshan County, Hebei, China.
After statistical analysis of the eight influencing factors, the criteria for classifying evaluation indexes were established. The study area was gridded by ArcGIS, and we calculated the classical domain, segment domain, and the matter element of landslide hazards of collector roads in Pingshan County using the Extenics theory.
A comprehensive method for determining the weight was proposed, which involved combined weighting using game theory based on the respective weights calculated by the AHP and CRITIC methods. This method synthesizes the experts’ knowledge and the objective benefits of the evaluation indexes. The proposed method was used to map the landslide susceptibility of the cut slopes along the collector roads. The results have been verified through field investigation and submitted to mitigate geological disasters.
Data availability statement
The raw data supporting the conclusions of this article will be made available by the author, without undue reservation.
Author contributions
HL: conceptualization, data curation, formal analysis, methodology, software, and writing–original draft. KS: conceptualization, funding acquisition, methodology, project administration, supervision, and writing–review and editing. XZ: investigation, project administration, resources, and writing–review and editing. ML: data curation, validation, visualization, and writing–review and editing.
Funding
The author(s) declare that financial support was received for the research, authorship, and/or publication of this article. This research was funded by the Open Fund of Hebei Key Laboratory of Geological Resources and Environment Monitoring and Protection, grant number JCYKT202004; and the National Natural Science Foundation of China, grant number 42077239.
Conflict of interest
The authors declare that the research was conducted in the absence of any commercial or financial relationships that could be construed as a potential conflict of interest.
Publisher’s note
All claims expressed in this article are solely those of the authors and do not necessarily represent those of their affiliated organizations, or those of the publisher, the editors, and the reviewers. Any product that may be evaluated in this article, or claim that may be made by its manufacturer, is not guaranteed or endorsed by the publisher.
References
Brabb, E. E., Pampeyan, E. H., and Bonilla, M. G. (1972). Landslide susceptibility in san Mateo county, California. Reston, VA: US Geological Survey. doi:10.3133/mf360
Cai, W. (1999). Extension theory and its application. Chin. Sci. Bull. 44, 1538–1548. doi:10.1007/BF02886090
Cao, W., Fu, Y., Dong, Q., Wang, H., Ren, Y., Li, Z., et al. (2023). Landslide susceptibility assessment in Western Henan Province based on a comparison of conventional and ensemble machine learning. China Geol. 6, 409–419. doi:10.31035/cg2023013
Chang, L., Xing, G., Yin, H., Fan, L., Zhang, R., Zhao, N., et al. (2023). Landslide susceptibility evaluation and interpretability analysis of typical loess areas based on deep learning. Nat. Hazards Res. 3, 155–169. doi:10.1016/j.nhres.2023.02.005
Chen, Z., and Wang, J. (2007). Landslide hazard mapping using logistic regression model in Mackenzie Valley, Canada. Nat. Hazards 42, 75–89. doi:10.1007/s11069-006-9061-6
Das, R., Nandi, A., Joyner, A., and Luffman, I. (2021). Application of GIS-based knowledge-driven and data-driven methods for debris-slide susceptibility mapping. Int. J. Appl. Geospat. R. 12, 1–17. doi:10.4018/IJAGR.2021010101
Diakoulaki, D., Mavrotas, G., and Papayannakis, L. (1995). Determining objective weights in multiple criteria problems: the critic method. Comput. Oper. Res. 22, 763–770. doi:10.1016/0305-0548(94)00059-H
Dou, J., Yunus, A. P., Bui, D. T., Merghadi, A., Sahana, M., Zhu, Z., et al. (2020). Improved landslide assessment using support vector machine with bagging, boosting, and stacking ensemble machine learning framework in a mountainous watershed, Japan. Landslides 17, 641–658. doi:10.1007/s10346-019-01286-5
Du, B., Zhao, Z., Hu, X., Wu, G., Han, L., Sun, L., et al. (2021). Landslide susceptibility prediction based on image semantic segmentation. Comput. Geosci. 155, 104860. doi:10.1016/j.cageo.2021.104860
Goetz, J. N., Brenning, A., Petschko, H., and Leopold, P. (2015). Evaluating machine learning and statistical prediction techniques for landslide susceptibility modeling. Comput. Geosci. 81, 1–11. doi:10.1016/j.cageo.2015.04.007
Guzzetti, F., Reichenbach, P., Cardinali, M., Galli, M., and Ardizzone, F. (2005). Probabilistic landslide hazard assessment at the basin scale. Geomorphology 72, 272–299. doi:10.1016/j.geomorph.2005.06.002
Hong, H. (2023). Assessing landslide susceptibility based on hybrid multilayer perceptron with ensemble learning. Bull. Eng. Geol. Environ. 82, 382. doi:10.1007/s10064-023-03409-8
Huang, F., Cao, Z., Guo, J., Jiang, S.-H., Li, S., and Guo, Z. (2020). Comparisons of heuristic, general statistical and machine learning models for landslide susceptibility prediction and mapping. Catena 191, 104580. doi:10.1016/j.catena.2020.104580
Huang, F., Xiong, H., Jiang, S.-H., Yao, C., Fan, X., Catani, F., et al. (2024). Modelling landslide susceptibility prediction: a review and construction of semi-supervised imbalanced theory. Earth-Sci. Rev. 250, 104700. doi:10.1016/j.earscirev.2024.104700
Kaur, H., Gupta, S., and Parkash, S. (2017). Comparative evaluation of various approaches for landslide hazard zoning: a critical review in Indian perspectives. Spat. Inf. Res. 25, 389–398. doi:10.1007/s41324-017-0105-7
Merghadi, A., Abderrahmane, B., and Tien Bui, D. (2018). Landslide susceptibility assessment at mila basin (Algeria): a comparative assessment of prediction capability of advanced machine learning methods. ISPRS Int. J. Geo-Inf. 7, 268. doi:10.3390/ijgi7070268
Merghadi, A., Yunus, A. P., Dou, J., Whiteley, J., ThaiPham, B., Bui, D. T., et al. (2020). Machine learning methods for landslide susceptibility studies: a comparative overview of algorithm performance. Earth-Sci. Rev. 207, 103225. doi:10.1016/j.earscirev.2020.103225
Park, S.-J., Lee, C.-W., Lee, S., and Lee, M.-J. (2018). Landslide susceptibility mapping and comparison using decision tree models: a case study of jumunjin area, korea. Remote Sens. 10, 1545. doi:10.3390/rs10101545
Pourghasemi, H. R., Pradhan, B., and Gokceoglu, C. (2012). Application of fuzzy logic and analytical hierarchy process (AHP) to landslide susceptibility mapping at Haraz watershed, Iran. Nat. Hazards 63, 965–996. doi:10.1007/s11069-012-0217-2
Razavi-Termeh, S. V., Shirani, K., and Pasandi, M. (2021). Mapping of landslide susceptibility using the combination of neuro-fuzzy inference system (ANFIS), ant colony (ANFIS-ACOR), and differential evolution (ANFIS-DE) models. Bull. Eng. Geol. Environ. 80, 2045–2067. doi:10.1007/s10064-020-02048-7
Reichenbach, P., Rossi, M., Malamud, B. D., Mihir, M., and Guzzetti, F. (2018). A review of statistically-based landslide susceptibility models. Earth-Sci. Rev. 180, 60–91. doi:10.1016/j.earscirev.2018.03.001
Tsangaratos, P., and Ilia, I. (2016). Landslide susceptibility mapping using a modified decision tree classifier in the Xanthi Perfection, Greece. Landslides 13, 305–320. doi:10.1007/s10346-015-0565-6
Wang, H., Xu, J., Tan, S., and Zhou, J. (2023). Landslide susceptibility evaluation based on a coupled informative–logistic regression model—shuangbai county as an example. Sustainability 15, 12449. doi:10.3390/su151612449
Wyllie, D. C., and Mah, C. W. (2017). Rock slope engineering: civil and mining. 4th Edn. London: CRC Press. doi:10.1201/9781315274980
Zeng, B., Lv, Q., Kou, L., Ai, D., Xu, H., and Yuan, J. (2023). Susceptibility assessment of colluvium landslides along the changyang section of qingjiang river using logistic regression and random forest methods. Chin. J. Geol. Hazard Control. 34, 105–113. doi:10.16031/j.cnki.issn.1003-8035.202205044
Zhang, J., Ma, X., Zhang, J., Sun, D., Zhou, X., Mi, C., et al. (2023). Insights into geospatial heterogeneity of landslide susceptibility based on the SHAP-XGBoost model. J. Environ. Manage. 332, 117357. doi:10.1016/j.jenvman.2023.117357
Zhang, J., Tang, H., Li, C., Gong, W., Zhou, B., and Zhang, Y. (2024). Deformation stage division and early warning of landslides based on the statistical characteristics of landslide kinematic features. Landslides 21, 717–735. doi:10.1007/s10346-023-02192-7
Zhang, X., Su, Q., Zhao, C., Zhu, Y., Li, K., Fan, J., et al. (2023). A landslide susceptibility evaluation method using bayesian algorithm to optimize XGBoost. Sci. Surv. Mapp. 48, 140–150. doi:10.16251/j.cnki.1009-2307.2023.06.016
Keywords: landslide susceptibility, collector roads, weighting determination, Extenics theory, game theory
Citation: Li H, Song K, Zhai X and Liang M (2024) Landslide susceptibility mapping using multiple combination weighting determination: a case study of collector roads in Pingshan County, Hebei Province, China. Front. Earth Sci. 12:1403830. doi: 10.3389/feart.2024.1403830
Received: 20 March 2024; Accepted: 17 June 2024;
Published: 10 July 2024.
Edited by:
Junrong Zhang, China University of Geosciences Wuhan, ChinaReviewed by:
Merghadi Abdelaziz, University of Tébessa, AlgeriaXu Gao, China University of Geosciences Wuhan, China
Copyright © 2024 Li, Song, Zhai and Liang. This is an open-access article distributed under the terms of the Creative Commons Attribution License (CC BY). The use, distribution or reproduction in other forums is permitted, provided the original author(s) and the copyright owner(s) are credited and that the original publication in this journal is cited, in accordance with accepted academic practice. No use, distribution or reproduction is permitted which does not comply with these terms.
*Correspondence: Kun Song, c29uZ2t1bkBjdGd1LmVkdS5jbg==