 J. A. Martinez1*†
 C. Junquas2,3†
 D. Bozkurt4,5,6
 M. Viale7
 L. Fita8,9,10
 K. Trachte11
 L. Campozano12
 P. A. Arias13
 J. P. Boisier5,14
 T. Condom2
 K. Goubanova15
 J. D. Pabón-Caicedo16
 G. Poveda17
 S. A. Solman9,10,18
 A. A. Sörensson8,9,10
 J. C. Espinoza2
- 1Escuela Ambiental, Universidad de Antioquia, Medellín, Colombia
- 2University Grenoble Alpes, IRD, CNRS, Grenoble INP, IGE, Grenoble, France
- 3Servicio Nacional de Meteorología e Hidrología (SENAMHI), Lima, Peru
- 4Departamento de Meteorología, Universidad de Valparaíso, Valparaíso, Chile
- 5Center for Climate and Resilience Research (CR2), Santiago, Chile
- 6Center for Oceanographic Research COPAS COASTAL, Universidad de Concepción, Concepción, Chile
- 7Instituto Argentino de Nivología, Glaciología y Ciencias Ambientales (IANIGLA) – CONICET, Mendoza, Argentina
- 8Facultad de Ciencias Exactas y Naturales, Universidad de Buenos Aires, Buenos Aires, Argentina
- 9CONICET ‒ Universidad de Buenos Aires, Centro de Investigaciones del Mar y la Atmósfera (CIMA), Buenos Aires, Argentina
- 10Instituto Franco-Argentino de Estudios sobre el Clima y sus Impactos (IFAECI) – IRL 3351 – CNRS-CONICET-IRD-UBA, Buenos Aires, Argentina
- 11Department of Atmospheric Processes, Brandenburg University of Technology Cottbus-Senftenberg, Cottbus, Germany
- 12Departamento de Ingeniería Civil y Ambiental, Facultad de Ingeniería Civil y Ambiental, Escuela Politécnica Nacional, Quito, Ecuador
- 13Grupo de Ingeniería y Gestión Ambiental (GIGA), Escuela Ambiental, Facultad de Ingeniería, Universidad de Antioquia, Medellín, Colombia
- 14Department of Geophysics, Universidad de Chile, Santiago, Chile
- 15Centro de Estudios Avanzados en Zonas Áridas, CEAZA, La Serena, Chile
- 16Departamento de Geografía, Universidad Nacional de Colombia, Sede Bogotá, Colombia
- 17Departamento de Geociencias y Medio Ambiente, Universidad Nacional de Colombia, Sede Medellín, Colombia
- 18Departamento de Ciencias de la Atmósfera y los Océanos (DCAO), Facultad de Ciencias Exactas y Naturales, Universidad de Buenos Aires, Buenos Aires, Argentina
The Andes is the longest mountain range in the world, stretching from tropical South America to austral Patagonia (12°N-55°S). Along with the climate differences associated with latitude, the Andean region also features contrasting slopes and elevations, reaching altitudes of more than 4,000 m. a.s.l., in a relatively narrow crosswise section, and hosts diverse ecosystems and human settlements. This complex landscape poses a great challenge to weather and climate simulations. The interaction of the topography with the large-scale atmospheric motions controls meteorological phenomena at scales of a few kilometers, often inadequately represented in global (grid spacing ∼200–50 km) and regional (∼50–25 km) climate simulations previously studied for the Andes. These simulations typically exhibit large biases in precipitation, wind and near-surface temperature over the Andes, and they are not suited to represent strong gradients associated with the regional processes. In recent years (∼2010–2024), a number of modeling studies, including convection permitting simulations, have contributed to our understanding of the characteristics and distribution of a variety of systems and processes along the Andes, including orographic precipitation, precipitation hotspots, mountain circulations, gravity waves, among others. This is Part I of a two-part review about atmospheric modeling over the Andes. In Part I we review the current strengths and limitations of numerical modeling in simulating key atmospheric-orographic processes for the weather and climate of the Andean region, including low-level jets, downslope winds, gravity waves, and orographic precipitation, among others. In Part II, we review how climate models simulate surface-atmosphere interactions and hydroclimate processes in the Andes Cordillera to offer information on projections for land-cover/land-use change or climate change. With a focus on the hydroclimate, we also address some of the main challenges in numerical modeling for the region.
1 Introduction
The Andes mountain chain extends for more than 7,000 km and spans over 7 countries in South America. The so-called Andean region is home to over 50 million inhabitants, and to a rich biodiversity. The hydrological regimes under the influence of the Andes, as well as major water storages such as mountain lakes, glaciers, paramos, and aquifers affect most of the continent. Hence, understanding the mountain hydroclimate along the Andes is important for human safety and development, as well as for the preservation of water resources and ecosystems in South America. Today, in the context of climate and other global changes, specific interests for this region include the current characterization, understanding, and assessment of future scenarios for water security and the risks associated with hydrometeorological extremes (e.g., Poveda et al., 2020; Pabón-Caicedo et al., 2020; Junquas et al., 2024). Regarding these goals, the Andes region presents particular challenges owing to its complex topography, leading to large gradients in hydroclimatic variables that are difficult to extrapolate and simulate (see e.g., Espinoza et al., 2020; Arias et al., 2021). Additionally, in comparison to other regions, there is a limited network of in situ measurement stations and a scarcity of homogeneous long-term records of essential climate variables, hindering a detailed picture of Andean atmospheric and hydroclimate systems (e.g., Condom et al., 2020; Cavazos et al., 2024). Despite the progress in measuring hydrological variables derived from remote sensing (e.g., Fassoni-Andrade et al. 2021), there are still large limitations in measuring key variables at different levels in the atmosphere. In this context, numerical modeling (grounded in principles of conservation (e.g., energy) and other basic laws) is an essential tool to examine the complex–regional scale–climate phenomena and provide much-needed information in the Andes (Cavazos et al., 2024).
Regional Climate Models (RCMs) are a type of Limited Area Models (LAMs) used over continental or subcontinental domains. The focus on a smaller domain allows the use of RCMs for simulating atmospheric phenomena with more spatial detail than General Circulation Models (GCMs). Compared to previous generations of GCM simulations (grid spacings 100–200 km), the higher resolution of RCMs (25–50 km) has improved the simulation of some particular features of weather and climate of South America (e.g., Garreaud, 1999; Garreaud et al., 2010; Insel et al., 2010; Saurral et al., 2015; Junquas et al., 2016; Martinez et al., 2019). In particular, some of these RCM simulations provided important insights on the role of the Andes on regional circulation patterns and weather processes such as moisture transport, low-level jets and topographic blocking (Garreaud, 1999; Insel et al., 2010; Trachte, 2018; Martinez et al., 2019; Sauter, 2020; Böhm et al., 2021). In addition, international collaborative efforts on RCM applications over South America (e.g., CORDEX and CLARIS-LPB) have contributed to our understanding of regional and local scale climate features of South America as well as the sources of RCM uncertainties (Solman, 2013; Solman et al., 2013; Ambrizzi et al., 2019).
However, previous simulations with both GCMs and RCMs generally show large biases in precipitation over the Andes (see e.g., Rojas, 2006; Solman, 2013; Ambrizzi et al., 2019; Llopart et al. 2020; Almazroui et al., 2021; Arias et al., 2021; Ortega et al. 2021; Bozkurt et al., 2019; Martinez et al., 2019; Falco et al., 2020; Arias et al., 2021; Junquas et al., 2022). These biases relate, primarily, to the model resolution and the resulting coarse representation of mountain ranges, which lead to a poor representation of the response of the atmospheric circulation and stability to the topography. This is in agreement with various studies over mountain ranges and complex terrains in other regions that highlight the challenges faced by coarse resolution GCMs (e.g., Su et al., 2013; Torma et al., 2015; Roussel et al., 2020).
For the Andes, the differences in complex topographic features (e.g., summits and valleys) are evident even between finer grids (in the order of tens km) and grid spacings of a few km (in the range 1–4 km; Figures 1A–D). The differences in the resolution of the simulated topography can have large impacts on the simulation of airflow over and in the vicinity of the Andes, with important consequences for the simulated distribution, cycles and variability of precipitation, temperature, cloudiness, strong wind events, among other relevant hydrometeorological systems and hydroclimate features. For example, in simulations with coarser grid spacing some sections of the Andes would be substantially lower than in reality, simulating stronger winds at some altitudes compared to the real system, in which higher peaks act as a barrier to the flow, and misrepresenting the stronger winds and circulations within the real inter-Andean valleys (see e.g., Posada-Marín et al., 2019). As a consequence of the poorly resolved terrain, the spatial distribution of precipitation is directly affected, with higher resolution models representing with more detail and accuracy the slope gradients of precipitation, including for example, more localized “hotspots” of precipitation in the Andes-Amazon transition region (e.g., Ortega et al., 2021; Junquas et al., 2022, Gutierrez et al., 2024; Martinez et al., 2024a; Figures 1E, F).
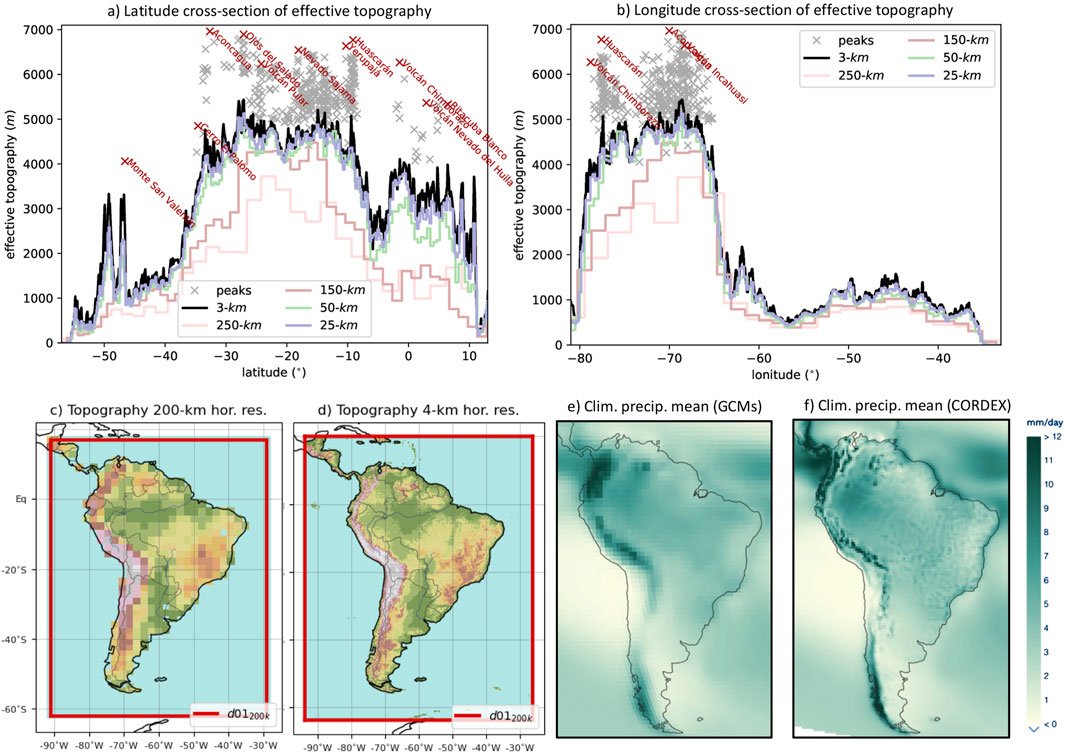
Figure 1. (A) Latitude and (B) longitude cross-sections effective topography (as in Orlanski et al. 1991): maximum height at each latitude, longitude for different standard resolutions, 3 km (black), 250 km (standard CMIP5 resolution, pale pink), 150 km (standard CMIP6 resolution, pale red), 50 km (CMIP6 Highres, green), 25 km (new low res. CORDEX, 25 km, blue) and peaks ‘x’, whereas highest peaks on 5° bands are labeled (data from https://en.wikipedia.org/wiki/List_of_mountains_in_the_Andes). South American topography at (C) 200 km horizontal resolution and (D) 4 km horizontal resolution. Climatological precipitation mean (1995–2014; mm/day) from (E) 34 CMIP6 models at 1°x1° of horizontal resolution and (F) 18 CORDEX South America models at 0.5°x0.5° (https://interactive-atlas.ipcc.ch/).
Studies that use grid spacing in the kilometer scale (e.g., in the range 1–4 km) not only better resolve more details of mesoscale and local circulations induced by the complex terrain, but can also partially resolve deep cumulus convection (Prein et al., 2015, Lucas-Picher et al., 2021). This type of kilometer-scale simulations are also known as Convection-Permitting (CP) simulations, when no deep-cumulus convection parameterization is employed. Due to computational constraints, such modeling efforts over the Andes typically focus on short periods, ranging from days to months, and relatively small domains (Viale et al., 2013; Garreaud et al., 2016; Comin et al., 2018; Heredia et al., 2018; Eghdami and Barros, 2019; Sierra et al., 2021b; Rosales et al., 2022). However, these modeling efforts have contributed valuable information regarding our understanding of precipitation regimes over the Andes, their forecasting potential and their relationship with local circulation (e.g., Yáñez-Morroni et al., 2018; Schumacher et al., 2020; Somos-Valenzuela and Manquehual-Cheuque, 2020; Junquas et al., 2022; Rosales et al., 2022; Martinez et al., 2024b). The proper characterization of circulation patterns shaped by the Andes are important not only due to their impact on the distribution of precipitation, but also in their connection with ecosystems (Sierra et al., 2021b), extreme events such as windstorms (Poveda et al., 2020), and natural resources for renewable energy production (e.g., Muñoz et al., 2018; Urrego-Ortiz et al., 2019).
The main goal of this two-part paper is to provide a review of recent weather and climate modeling efforts in the Andes region. There are several reasons for presenting this review about the Andes. Firstly, significant research with models at higher resolution than typical GCMs (∼200 km) and RCMs (∼25 km) has taken place during the last decade or so, with novel findings and lessons. Secondly, most of the initial modeling studies with GCMs and RCMs, and their corresponding literature reviews (e.g., Solman, 2013; Ambrizzi et al., 2019), have been mostly devoted to the Amazon and La Plata basins. This pattern is probably associated with both, a lack of the high resolution needed for representing mountain atmospheric processes typical of the Andes and with a small community of researchers devoted specifically to modeling studies about the Andes. Thirdly, current and near-future efforts on dynamical atmospheric/climate modeling make use of kilometer-scale simulations, both for weather prediction and climate change studies (e.g., Halladay et al., 2022; 2023; SAAG, 2022; Dominguez et al., 2024). These new efforts could greatly benefit from the lessons learned from previous modeling studies about the Andes, including some of the results summarized in this review. This review serves as a complement to the in-depth review papers about the hydroclimate of the Andes from the ANDEX program, a regional hydroclimate initiative for the Andes under the GEWEX/WCRP program (Espinoza et al., 2020; Pabón-Caicedo et al., 2020; Poveda et al., 2020; Arias et al., 2021).
We review modeling studies using a wide variety of grid spacings, from hundreds down to a few kilometers (see Table 1 for a summary of typical ranges). It has long been known that a “simple” increase in spatio-temporal detail (i.e., reducing grid spacings and time increments) is not enough to improve the simulation of some patterns of the hydroclimate variables, with traditional measures of skill often being equal or even better with coarser resolutions compared to kilometer scale resolutions (e.g., Mass et al., 2002). In this sense, dynamical modeling also requires a devoted analysis of atmospheric systems and processes over the region of interest to better understand the simulated phenomena specific to the region, and the potential benefits, progress and discoveries derived from the promising kilometer-scale simulations (Palmer and Stevens, 2019; Emanuel, 2020; Shaw et al., 2023). Here we review a variety of studies devoted to the understanding of physical mechanisms underlying patterns and changes in atmospheric variables over the Andes.
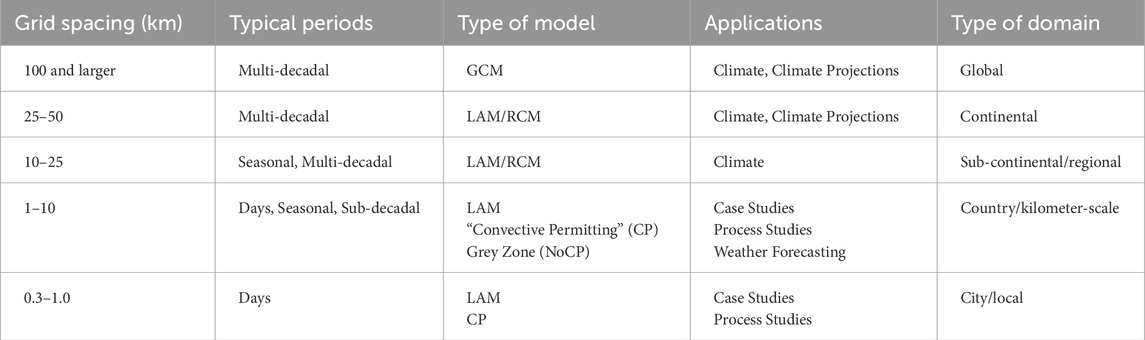
Table 1. Examples of grid spacings used in the studies cited in this review. The categories in this table are not formal nor comprehensive, but they are intended to provide an overview of the typical grid spacings and simulations reviewed in the following sections.
This paper (Part I) is organized as follows: Section 2 describes results about different mountain-related wind systems along the Andes; Section 3 includes studies about the effects of the Andes orography on the distribution and cycles of precipitation; and Section 4 includes comments related with model evaluation in the case of the Andes, with a focus on numerical weather prediction applications. Part II (Junquas et al., 2024) includes: i) a summary of the research on climate change, including potential changes in temperature and precipitation over the Andes; ii) a review about different atmospheric model configurations and their potential influence in high-resolution modeling results (including model performance) in the Andes; and iii) a discussion about the challenges and perspectives of atmospheric and climate modeling of the Andes. While this two-part review is by no means comprehensive, its aim is to provide an overview of the current state of science related with weather and climate modeling for the Andean region, with interest on both, the general model behavior over the Andes and on the simulation of specific mountain meteorology processes.
2 Winds around and within the Andes
At the planetary and regional scale, the Andes can modify wind patterns, for example, by modifying wave trains and the location of major structures like the South Pacific Anticyclone. At the meso-scale, the complex and elevated terrain of the Andes can mechanically alter the airflow (e.g., by blocking) and can also induce thermal effects, such as elevated heat sources during the day which foster diabatic heating. Some of the mountain winds related with topographic structures include wind patterns and disturbances like mountain-valley winds, thermally forced circulations, drainage flows, downslope winds (e.g., zonda winds), gravity waves, barrier winds, low-level jets, among others. In addition, differences in land cover, such as snow cover and glaciers over parts of the Andes, affect the surface albedo, with feedback effects on the near surface turbulence and the surface energy balance. This in turn can modify and induce local circulation patterns with impacts on the temperature and precipitation distribution over the complex terrain.
Figure 2 illustrates some examples of atmospheric processes and systems that are relevant for the hydroclimate of mountain regions, including orographic precipitation (Figure 2A; Section 3), some of the wind systems reviewed in this section (e.g., Figures 2B–E), and elevation dependent warming (Figure 2F; Section 2.2 in Part II). In the case of the Andes there is a relatively recent body of literature of modeling studies about particular mountain related processes and systems (Figure 3). Some of these studies are reviewed in the following sections. In particular, the role of the Andes can be inferred in modeling studies via simulations that compare the atmospheric response to different representations of the mountain chain, typically varying its height (Kalnay et al., 1986; Broccoli and Manabe, 1992; Walsh, 1994; Lenters and Cook, 1995; Garreaud and Fuenzalida, 2007; Garreaud et al., 2010; Insel et al., 2010; Saurral et al., 2015; Junquas et al., 2016; Rasmussen and Houze Jr, 2016; Marín et al., 2021; Rocque and Rasmussen, 2022; Gómez-Rios et al., 2023).
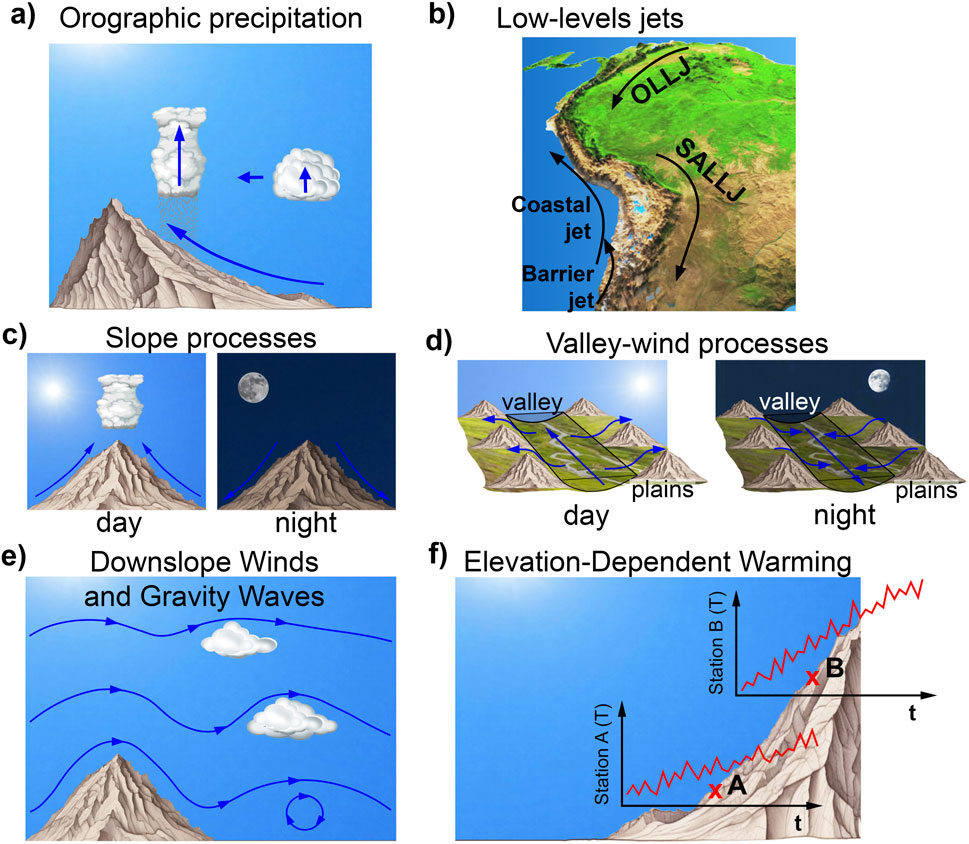
Figure 2. Some examples of systems/processes associated with the hydroclimate of mountain regions. Forced ascent by orographic barriers can enhance or help with the initiation of precipitation, (A). Around the Andes different low-level and barrier jets can form, depending on the season, synoptic conditions, etc., (B). Differential heating can induce circulations with a marked diurnal cycle, including slope (C) and valley (D) winds. Mechanical forcing can induce downslope winds on the lee-side of mountains (including Zonda and Puelche winds), and/or gravity waves which can propagate downwind and/or upwards, (E). Elevation dependent warming (F) refers to differences in the trend (e.g., over several decades) in temperature for different altitudes. Along the Andes all of these processes take place (see Figure 3), several of them occurring within the same region, which contributes with the detail and complexity of the distribution and variations of atmospheric variables over the region. See text for details about phenomena in panels (A–E). Studies about elevation dependent warming are reviewed in Part II.
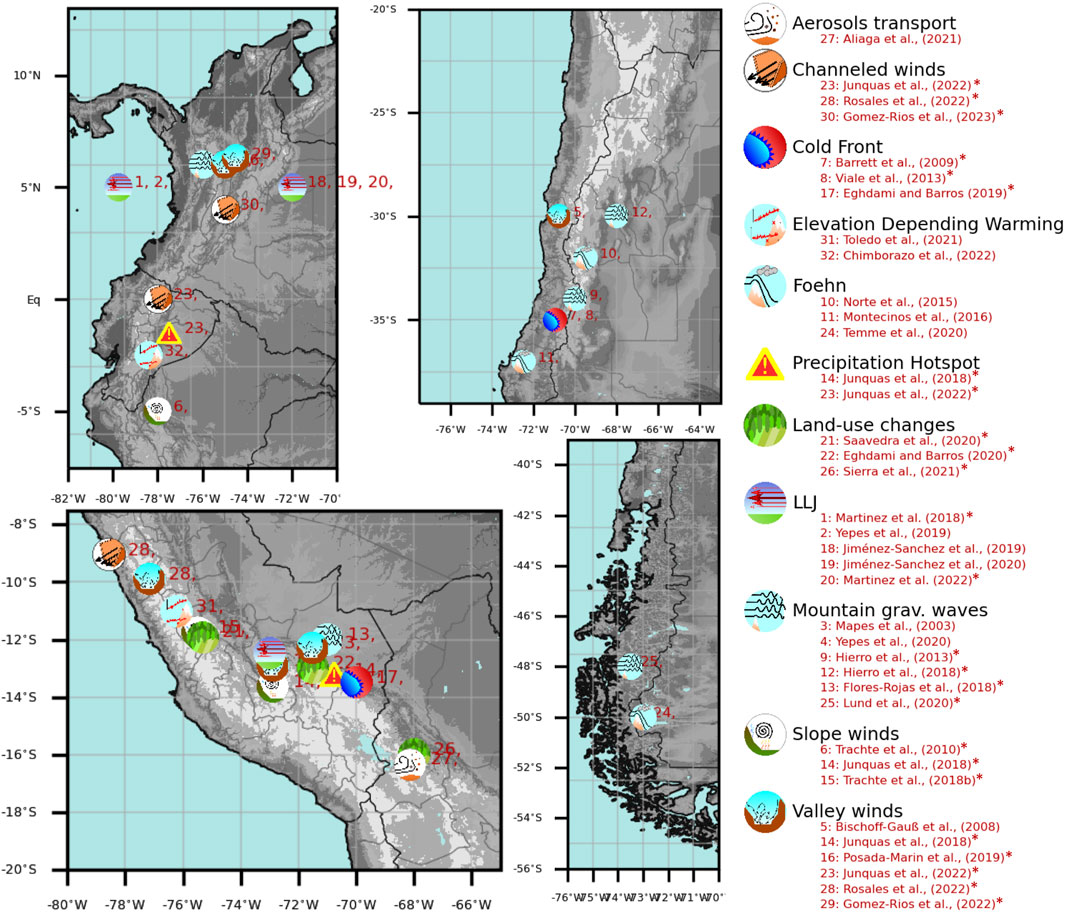
Figure 3. Schematic representation of the main local morphological-physical features identified in modeling studies as relevant when simulating the climate over the Andes mountain range. Encircled symbols indicate the presence of a climate process/feature as analyzed by the given reference (see associated numbers by the symbol). The red asterisk next to the references on the right indicate studies including orographic precipitation processes.
2.1 Role of the Andes on continental scale mechanical forcing
To investigate the role of the Andes, some numerical studies compare simulations with modified versions of the Andes (mostly by height). Other studies analyze the atmospheric structures over and around the Andes, inferring the role of the Andes by comparing with the flow farther from the mountain range. These approaches have applications for understanding some phenomena mostly between the planetary scale and the mesoscale, from Rossby waves to low-level jets. In parallel with the historical development and availability of computational resources, the first numerical studies about the Andes (e.g., during the 1990s) were carried out with low-resolution models, but they were instrumental for understanding the most fundamental role of the Andes. More recent studies (e.g., from 2010 up to the present) include higher resolution simulations for longer periods of time, which has facilitated a more detailed characterization of the atmospheric variability associated with the role of Andes, at several spatial and temporal scales.
One of the expected effects of large topographic barriers is producing planetary scale waves, which in turn could explain regional scale patterns of dryness (Broccoli and Manabe, 1992). Early modeling studies did not find major effects related to the Andes in terms of production of stationary Rossby waves or other planetary scale patterns in 200 hPa or 500 hPa winds (Kalnay et al., 1986; Walsh, 1994). However, more recent studies, with higher resolution modeling tools and longer simulations, found a variety of larger-scale effects related to the Andes (Takahashi and Battisti, 2007; Junquas et al., 2016; Xu et al., 2022). One of the effects is related with the position of the South Pacific Anticyclone, which in turn can modify the patterns and trajectories of wave trains associated with Rossby waves, most notably across the southern Pacific. In turn, these waves can affect the position and strength of the midlatitude jetstream, which would be located more to the north without the Andes. In addition, the Andes affect the location of intense convection in the nearby tropics (including the Inter Tropical Convergence Zone), which in turn has effects on the distribution of divergence and convergence centers aloft over the tropics. Furthermore, by modifying the westerly flow over the eastern Pacific, the Andes have effects on the Walker circulation by weakening the subsidence aloft (Junquas et al., 2016). In general, the effects of the Andes on the mean state over the Pacific (Takahashi and Battisti, 2007), produce effects on the dynamics of ENSO, with the height of the Andes being related with the asymmetry between El Niño and La Niña phases (Xu et al., 2022).
At the continental scale, the Andes shape important patterns of the low-level winds, temperature and precipitation over South America (e.g., Kalnay et al., 1986; Broccoli and Manabe, 1992; Walsh, 1994; Lenters and Cook, 1995; Garreaud et al., 2010; Insel et al., 2010). More recent studies confirm the local and regional effects, finding that the Andes are critical for the existence of the South American low-level Jet and the current patterns of the meridional transport of moisture across the continent (e.g., Saurral et al., 2015; Junquas et al., 2016; Rasmussen and Houze Jr, 2016; Roque and Rasmussen, 2022). In general, these studies suggest that without the Andes, the meridional low-level winds would be weaker in the region of the Central Andes, with a weaker transport of moisture from the Amazon towards La Plata basin, reducing precipitation over southeastern South America. Precipitation over parts of the eastern and western flanks of the Andes (including the Central Andes and some precipitation hotspots) would be reduced if no orographic lifting was provided by the Andes. Precipitation over tropical South America would increase, given the absent mechanically forced transport of moisture towards the south of the continent, while precipitation in some subtropical regions would increase due to the unimpeded westerly moisture transport from the Pacific in the absence of the blocking to westerly flow provided by the Andes. Without the Andes, we would see more precipitation over Patagonia (which would be no longer located in the rain shadow of the Andes), less precipitation over the Andes and their westside around 40°S (reduced or absent orographic effects), and increased precipitation over parts of Peru between 0° and 10°S (more moisture transport from the Amazon). We would also see higher temperatures in the Andes region (from lower elevation), and lower temperatures over southeastern South America (from the lack of downslope winds from the Andes).
It is worth noting that some important structures of the regional circulation over South America do not depend crucially on the Andes. For example, modeling studies suggest that the Andes do not play a dominant role on the development of Bolivian High (BH), which is an upper-level anticyclonic circulation centered around (15°S, 65°W), which is linked to the distribution and variability of precipitation over parts tropical and subtropical South America (see e.g., Espinoza et al., 2020). Instead, the BH is mostly a response to the deep convection over the Amazon, with the Andes playing a role on its intensity (Lenters and Cook, 1997; Sierra et al., 2021b). However, the BH contributes to precipitation over the Altiplano in the tropical-subtropical Andes due to the associated easterly flow that brings in moisture from the Amazon. Similarly, the occurrence of westerly low-level winds and low-level convergence over the eastern Pacific (off the coast of tropical South America) is more linked to the presence of the South American land mass and sea-surface temperature patterns than to the existence of the Andes (Lenters and Cook, 1995). However, in both cases (the BH and low-level convergence off the west coast of tropical South America), the complex terrain of the Andes adds to the smaller scale details (e.g., at the mesoscale) in the wind and precipitation fields.
2.2 Mechanically induced mountain winds: low-level jets, low-level blocking, barrier flow and downslope winds
2.2.1 Low-level jets (LLJs)
Several Low-level Jets (LLJs) can form in the vicinity of the Andes, including the South American LLJ (SALLJ, e.g., Berbery and Barros, 2002; Vera et. al., 2006), the Orinoco LLJ (OLLJ; e.g., LaBar et al. 2005; Torrealba and Amado,r 2010) and the Choco LLJ (CJ; e.g., Poveda and Mesa, 2000; Sierra et al., 2021a). Observations about these low-level jets are available from a few field campaigns, including data about the SALLJ from the SALLJ Experiment (SALLJEX, Vera et al., 2006) and The Remote sensing of Electrification, Lightning, And Mesoscale/microscale Processes with Adaptative Ground Observations (RELAMPAGO, Sasaki et al., 2022); about the OLLJ (Torrealba and Amador, 2010) and about the CJ from the Choco-jet experiment (ChocoJEX, Yepes et al., 2019, 2020) and the Organization of Tropical East Pacific Convection field campaign (OTREC, Mejía et al., 2021). However, many studies have employed reanalysis datasets to describe and understand these LLJs at different scales, from interannual to sub-daily (e.g., Berbery and Barros, 2002; Salio et al., 2007; Silva et al., 2009; Monaghan et al., 2010; Rife et al., 2010; Arraut et al. 2012; Jones, 2019; Montini et al., 2019; LaBar et al., 2005; Torrealba and Amador, 2010; Builes-Jaramillo et al., 2022a; Builes-Jaramillo et al., 2022b; Martínez et al., 2024b).
The SALLJ is a regional-scale feature east of the Andes that transports moisture from the tropics towards the extratropics (Berbery and Barros, 2002; Vera et al., 2006). Prior to detailed atmospheric observations of the SALLJ, modeling studies suggested the importance of the SALLJ for feeding moisture and providing convergence patterns favorable for precipitation over La Plata basin (Berbery and Collini, 2000). Numerical simulations have allowed the description of the SALLJ around the Andean bend (Bolivian Andes at ∼ 17–19°S), where the air flow can produce gravity waves and wave breaking, in addition to intra-daily variations of the low-level winds, temperature and humidity associated with the diurnal cycle of the SALLJ (Mejía and Douglas, 2006; Nogués-Paegle et al., 2006). The main characteristics of the SALLJ (e.g., geographical location, altitude, strength, extent, seasonal behavior) have been identified in RCMs, in simulations with grid spacings in the range 25–50 km (see e.g., Insel et al., 2010; Lange et al., 2015; Junquas et al., 2016; Torres-Alavez et al., 2021), which has allowed for the exploration of additional details of the SALLJ via modeling studies. For example, several studies suggest that the SALLJ is stronger in simulations with a higher elevation of the Andes, mostly due to mechanical forcing and topographic blocking. This affects the simulation of the southward transport of moisture, which in turn provides moisture and latent energy for convection and precipitation over the Andes and other regions downwind (e.g., Insel et al., 2010; Saurral et al., 2015; Junquas et al., 2016; Rasmussen and Houze Jr, 2016; Rocque and Rasmussen, 2022). Salio et al. (2007) used the operational fields of the NCEP Global Data Assimilation System (GDAS, ∼1°) and showed the importance of the SALLJ for providing moisture transport, convergence, and unstable conditions for Mesoscale Convective Systems over southeastern South America. Similar conclusions were later obtained by Rasmussen and Houze Jr (2016); Rocque and Rasmussen (2022) based on CP simulations (grid spacing 3 km).
On the other hand, problems in adequately simulating the SALLJ could also be linked to biases in near-surface temperature over southern South America. For example, Lange et al. (2015) found a warm bias over northern Argentina during the austral summer, which in part seemed to be linked to a weaker SALLJ. Lange et al. (2015) suggested that this bias in the wind field could be related with biases in simulating atmospheric processes upwind, in the tropics (specially over the Amazon), based on their comparison of simulations with different cloud schemes. However, a robust diagnosis of these biases requires a more in depth analysis (Lange et al. 2015). Looking forward, future climate scenarios suggest changes in the behavior of these jets. From the CORDEX-CORE simulations (grid spacing of 25 km), Torres-Alavez et al. (2021) found that the SALLJ could have changes under future Representative Concentration Pathway (RCP) scenarios. In particular, the SALLJ could become stronger and exhibit a westward expansion under the RCP8.5 scenario, due to stronger warming over continental areas (located mostly over tropical and subtropical South America) and an intensification of the geopotential gradient. These results seem to be more pronounced in RCMs than in GCMs for the SALLJ, which is not always the case for other LLJs (Torres-Alavez et al., 2021).
The OLLJ is a nocturnal jet that forms over the Orinoco basin in northern South America, which transitions from a zonal to a northeasterly flow due to the blocking effects of the tropical Andes, and with a seasonal maximum during the austral summer season. Based on WRF simulations (grid spacing of 9 km), Jiménez-Sánchez et al. (2019) described the mesoscale structure of the OLLJ, finding that this jet has several cores of wind maxima across the Orinoco basin, some of them associated with topographic effects by the eastern cordillera of the tropical Andes. In a follow-up modeling study, Jiménez-Sánchez et al. (2020) conducted a momentum balance analysis and identified the key factors that accelerate the OLLJ, such as sea-breeze penetration, katabatic flows from a coastal mountain range, expansion fans associated with topography (including the Andes) and the diurnal variation of turbulent diffusivity in the PBL. In addition, the simulated flow in the vicinity of the Andes may depend on the planetary boundary layer (PBL) scheme used. For example, Martinez et al. (2022) found that the winds and cross-equatorial transport of moisture near the eastern flank of the Andes associated with the OLLJ, can be noticeable stronger (∼10% larger) with some PBL schemes within the WRF model, enhancing the simulated precipitation (∼30% more during the afternoon) over the Andes-Amazon transition region. Furthermore, details associated with the atmospheric stability in the OLLJ region can affect the simulation of low-level disturbances contributing to mesoscale convergence and the formation of precipitating systems downwind (e.g., Martinez et al. 2024a).
Another important structure in the vicinity of the tropical Andes is the Choco low-level jet (CJ; see e.g., Poveda and Mesa 2000; Sierra et al. 2021a). The CJ is related to a westerly flow over the eastern Pacific off the coast of Colombia, which has a seasonal maximum during September-November. The CJ impinges on the western cordillera of the tropical Andes, and this interaction has been linked to the occurrence of a precipitation hotspot over the region (e.g., Poveda and Mesa 2000) and an appropriate environment for the formation of mesoscale convective systems (Mejía et al. 2021). Despite their coarse resolution relative to the typical scale of LLJs, previous generations of global simulations (e.g., CMIP5) were able to reproduce important characteristics of the CJ, including its location, intensity, seasonal cycle and relationship with the ITCZ. The CJ seems to have a substantial relation with regional-scale gradients in Sea Surface Temperature (SST) and Sea Level Pressure (SLP), (Sierra et al., 2015; Sierra et al., 2018; Sierra et al., 2021a), which might explain the skill of global models in simulating different characteristics of the CJ. In addition, the sole presence of the South American land mass may contribute to the origin of the CJ, as this land mass favors the formation of westerly winds over the eastern Pacific (associated with a continental-scale thermal low and cyclonic flow), off the coast of South America near the tropics. In this setting, the Andes may contribute to the location of wind maxima and channeling of part of this westerly flow through lower terrain near the equator (Lenters and Cook, 1995). Interestingly, based on atmospheric simulations with prescribed SSTs, Martinez et al. (2019) found that during the early dry season, the model has a lower correlation between CJ winds and SSTs than the one suggested by observation-based datasets. This in turn might be related to the spurious lack of correlation between SSTs in the eastern Pacific and the simulated precipitation over the tropical Andes. Together, these examples suggest that the CJ is important for precipitation over the tropical Andes, and that models need to appropriately simulate the coupling between SSTs and the CJ (as in Atmosphere-Ocean GCMs (AOGCMs) of CMIP5) in order to correctly represent the inter-annual variability of precipitation over the northern Andes.
2.2.2 Low-level blocking and barrier flow near the sub-tropical Andes
The studies cited above regarding the SALLJ and the OLLJ refer mostly to northerly flow east of the Andes, associated with along-barrier transport of moisture and areas of low-level convergence. In the case of the tropical Andes, interesting cross-barrier flow situations can emerge from the westerly flow impinging on the western tropical Andes, associated with the CJ (e.g., Yepes et al., 2020). Other interesting low-level flows that have been investigated via modeling are found in the vicinity of the Central Andes, including equatorward flow over the eastern flank, poleward flow over the western flank, and cross-barrier flow (both from the west or the east).
Incursions of cold midlatitude air towards the tropics can induce intense equatorward flow along the eastern flank of the central Andes. These cold outbreaks can also trigger bands of convection moving equatorward (Garreaud and Wallace, 1998). The equatorward flow is forced by a synoptic-scale meridional pressure gradient, which combined with the Coriolis acceleration and the blocking of zonal winds by the Andes yields ageostrophic winds in the form of a barrier or channeled flow (Seluchi et al., 2006; Smith, 2019). On the western side of the Central Andes, over the Pacific, northerly barrier jets can develop, in situations associated with advection of tropical/sub-tropical air masses towards the vicinity of the Central Andes, and/or with enhanced westerly zonal flow from the Pacific, in both cases favoring the occurrence of precipitation over the chilean Andes (e.g., Scaff et al., 2017).
The role of the Andes for these cases has been investigated using sensitivity experiments reducing the height of the mountain range. Mesoscale simulations suggest that convergence can be enhanced in the leading edge of a cold front when a northerly barrier jet forms over the Pacific, due to the blocking effects of low-tropospheric westerly flow by the Andes; the barrier jet can transport moist air parcels to the chilean coast during the precipitation event associated with the cold front (Barrett et al., 2009). Based on WRF CP simulations, Viale et al. (2013) found that the high elevation of the subtropical Andes not only enhances precipitation over the complex terrain itself (direct orographic effect), but also enhances precipitation upwind of it, on the Chilean lowlands, by mid-level ascending upstream of the Andes over the low-level blocked flow (Viale et al., 2013, see Figure 4). Furthermore, the height of the sub-tropical Andes is critical for the northerly barrier flow on the western side due to the mechanical blocking, and for the generation of conditions with high updraft helicity, favorable for tornado-genesis in the region (Marín et al., 2021).
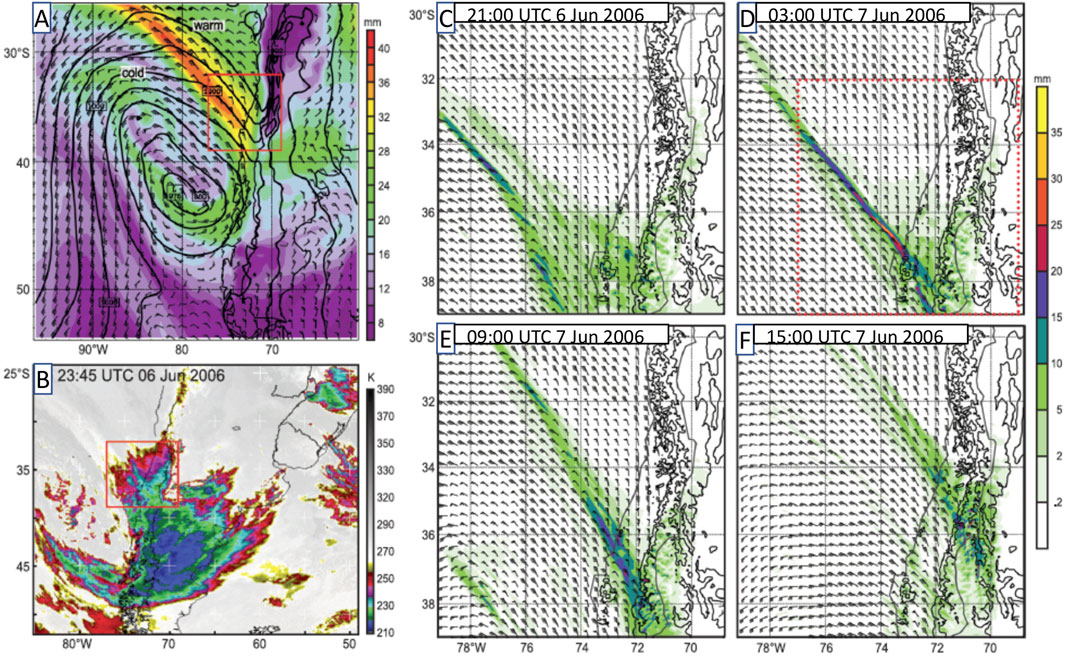
Figure 4. Blocking and other orographic processes associated with a cold-frontal rainband in the subtropical Andes, from (A) 36-km WRF run at 00:00 UTC 7 June 2006, (B) Infrared satellite data, (C–F) 3-km WRF run. (A) Surface pressure (black contours, every 5 hPa), 925 hPa windbarbs and precipitable water (shaded). (C–F) Wind barbs at 0.5 km and 1-h accumulated precipitation (shaded; mm). Full barb = 5 m s-1. Solid black lines are 500 m and 1,000 m terrain altitudes. Source: Viale et al. (2013).© American Meteorological Society. Used with permission.
Modeling studies have also been used to understand the relationship between cross-barrier zonal flow and precipitation over the central Andes. Based on MM5 simulations (grid spacing of 24 km), Garreaud (1999) studied cases of both rainy and dry days over the central Andes related with low-level easterly flow of moist air reaching the eastern flank of the Andes. Interestingly, despite low-level convergence on the windward-side, the entrainment of dry air aloft inhibits convection over the Andean plateau during the dry episodes. In addition, Garreaud (1999) found that westerly flow brings air parcels with smaller values of equivalent potential temperature, compared to both parcels from the easterly flow and from aloft over the Andean plateau (15°S-20°S). This explains why situations when the westerly flow is stronger are associated with more stable conditions (less bouyant parcels). Rasmussen and Houze Jr (2016) also found more stable conditions over the eastern flank of the subtropical Andes (∼25°S-30°S) associated with westerly cross-barrier flow in their numerical experiments with the height of the Andes reduced in 50%. In their CP simulations (grid spacing 3 km), Rasmussen and Houze Jr (2016) found conditions with both less convective available potential energy (CAPE) and less convective inhibition. Despite the differences in the experimental design, the reduced CAPE found by Rasmussen and Houze Jr (2016) is consistent with the previous findings by Garreaud (1999). In both studies orographic effects still contribute (under dry conditions or reduced Andes height) with the formation of cloudiness and convective initiation on the eastern flank of the Andes.
However, westerly cross-barrier flow over the Andes can also be associated with intense precipitation over the central Andes, as shown in the work by Viale and Norte (2009). In this case, simulations with the Eta-PRM system (grid spacing of 15 km) showed a deeply blocked (by the Andes) westerly flow (from the Pacific), with poleward barrier flow at low-levels, and strong cross-barrier flow above crest-level which was associated with strong transport of moisture, upslope motion near mountain tops and orographic precipitation, despite the stable atmospheric conditions. The studies of Garreaud (1999) and Viale & Norte (2009) show how orographic precipitation over the Andes can behave differently, depending on the conditions (e.g., humidity content) of the cross-barrier flow.
2.2.3 Downslope winds and windstorms
Strong downslope winds/windstorms over parts of the eastern slopes of the Andes in western-central Argentina are known as zonda winds (Figure 5). Atmospheric modeling for zonda winds has contributed to the understanding and forecast of these events (Seluchi et al., 2003; Viale and Norte, 2009; Puliafito et al., 2015; Norte, 2015; Antico et al., 2017). With a relatively coarse grid spacing (e.g., 40–50 km), atmospheric models can simulate events with the general characteristics of actual zonda wind events, i.e., the strong cross-barrier pressure gradients, and vertical motions and associated downward tilting of potential temperature surfaces on the lee side. However, a relatively large grid-spacing limits the ability of models for simulating part of the variations in surface variables associated with local characteristics of the topography during zonda events (e.g., wind and/or temperature maxima over small settlements).
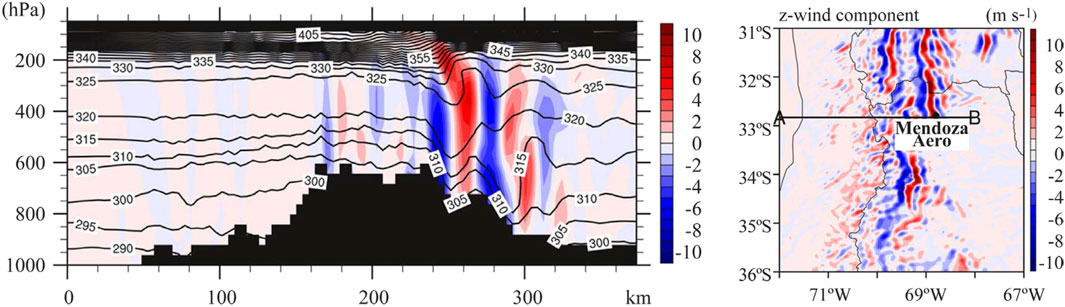
Figure 5. WRF simulation (grid spacing 4 km) of an event with strong zonda winds and gravity waves during 11 July 2006 over the sub-tropical Andes. Left: Vertical cross-section of potential temperature (contours, in K) and vertical velocity (shades, in m s-1) in section close to 33°S. Right: Near surface winds. Negative values of vertical velocity (blue shades) indicate strong descending flow, with strong zonda winds over the eastern slopes of the Andes. Gravity waves are evident to the east of the Andes. Source: Norte (2015).© Scientific Research. CC-BY License.
The height of the Andes seems to be critical for simulating the intensity and frequency of zonda events (Seluchi et al., 2003), which points to a specific role of grid spacing in modeling these events. In addition, at CP resolution, simulation of zonda events are associated with gravity waves downstream and hydraulic jumps over the eastern slopes of the Argentinean Andes (Norte, 2015). In general, weather forecasts using atmospheric models in the meso-gamma-scale not only can provide good forecast guidance for zonda winds, but they also are able to predict this type of events even 3 days ahead, although the exact location, onset, intensity and duration still are a modeling challenge (Seluchi et al., 2003; Viale and Norte, 2009; Puliafito et al., 2015).
Further south, other downslope wind systems have been studied, like the Puelche winds in Chile (dry downslope winds on the western flank of the Andes, Montecinos et al., 2017) and the foehn winds of southern Patagonia (Temme et al., 2020). Montecinos et al. (2017) used data from the Climate Forecast System Reanalysis (CFSR; whose atmospheric model has a nominal equivalent grid size of 38 km, Saha et al., 2010). Their results show that Puelche winds are associated with the passage of cold anticyclonic systems over Patagonia and easterly flow crossing the Andes from east to west. These events contribute to a reduction in cloud cover over the western flank of the Andes. Based on CP simulations with WRF (2 km grid spacing), Carrasco-Escaff et al. (2024) show that topographically-induced subsidence and easterly downslope winds from the Andes triggered fire conditions for two extreme wildfire events over southern Chile (34–39°S). For the foehn-like winds of Southern Patagonia, Temme et al. (2020) found that the downslope flow can induce local warming, a reduction in the cloud cover and an increase in sensible heat flux, which combined can contribute to glacier ablation. However, regions with gap winds do not necessarily experience warming, since the foehn jet can transport moister and cooler air.
2.3 Thermally-induced mountain winds
Complex terrain can induce circulations not only by direct blocking or channeling, but also because of the differential radiative heating/cooling associated with the gradients in surface altitude and slope (e.g., elevated heating during the day over mountain tops), shading of incoming solar radiation, etc. Some of these mesoscale circulations include slope flows (e.g., local scale katabatic, drainage, or anabatic flows), mountain-valley and mountain-plain flows, and their potential interactions with regional- or synoptic-scale flows. Modeling of these atmospheric systems usually requires a much higher resolution, with grid spacings from a few kilometers, down to hundreds of meters.
Katabatic flows can contribute to the existence of local rain shadows (where the down-slope winds are strongest) and convection farther downwind, near to valleys or lowlands. This kind of katabatic flow could also be associated with forest fires and enhanced evaporation in the vicinity of the low passes, where winds are stronger and precipitation is reduced. Specific patterns and effects of katabatic flows over parts of the equatorial Andes have been inferred from surface observations over a few sites (e.g., López and Howell, 1967), and then found in kilometer scale simulations (e.g., Warner et al. 2003). The similarities between the numerical model simulations by Warner et al. (2003) and the physically guided depiction of katabatic winds by López and Howell (1967) are astonishing.
By utilizing idealized topography configurations, Trachte et al. (2010a) simulated at very high resolution (grid size 250 m) the katabatic flow in the Andes-Amazon transition region between Ecuador and Peru. They found that drainage flows from concave-lined terrain (i.e., terrain with a base following a concave curvature) can in fact provide conditions for a jet-like wind profile and low-level horizontal convergence over a region representative of the Amazon near the Andes foothills, despite the existence of a complex distribution of valleys in the mountain region. Trachte et al. (2010b) used high resolution simulations (grid size 1 km) to study an event of nocturnal cloud formation over the same region. They found that in fact, under realistic conditions, cloud formation is associated with low-level convergence that takes place over this Andes-Amazon transition region at night, caused by the katabatic flow induced from thermal effects. However moist convection over the region also depends on the stability of the atmospheric profile, as revealed by the very high resolution simulations (500 m grid size) by Trachte and Bendix (2012).
Kilometer-scale simulations have been employed to study valley-mountain circulations over the Peruvian Andes, and their interactions with synoptic conditions and regional-scale flow from the Amazon (Junquas et al., 2018; Junquas et al., 2022; Rosales et al., 2022; see Figures 6, 7). The thermally-driven circulation was identified as determinant for the precipitation distribution and diurnal cycle, as well as the associated latent heat release as a key factor for its amplification. In addition, the inter-Andean valleys and canyons favor channeling flow, which contributes with the transport of moisture and the distribution of precipitation over particular spots in the region. The valley and slope circulations within the Andes have also been studied in the Colombian Andes (Posada-Marín et al., 2019; Gómez-Rios et al., 2023; Martínez et al., 2024b). These studies confirm that the representation of these diurnal thermal circulations by the models (associated with the high resolution needed to represent the intra-Andean valleys) is critical for the proper simulation of the diurnal cycle and spatial distribution of precipitation over this part of the Andes.
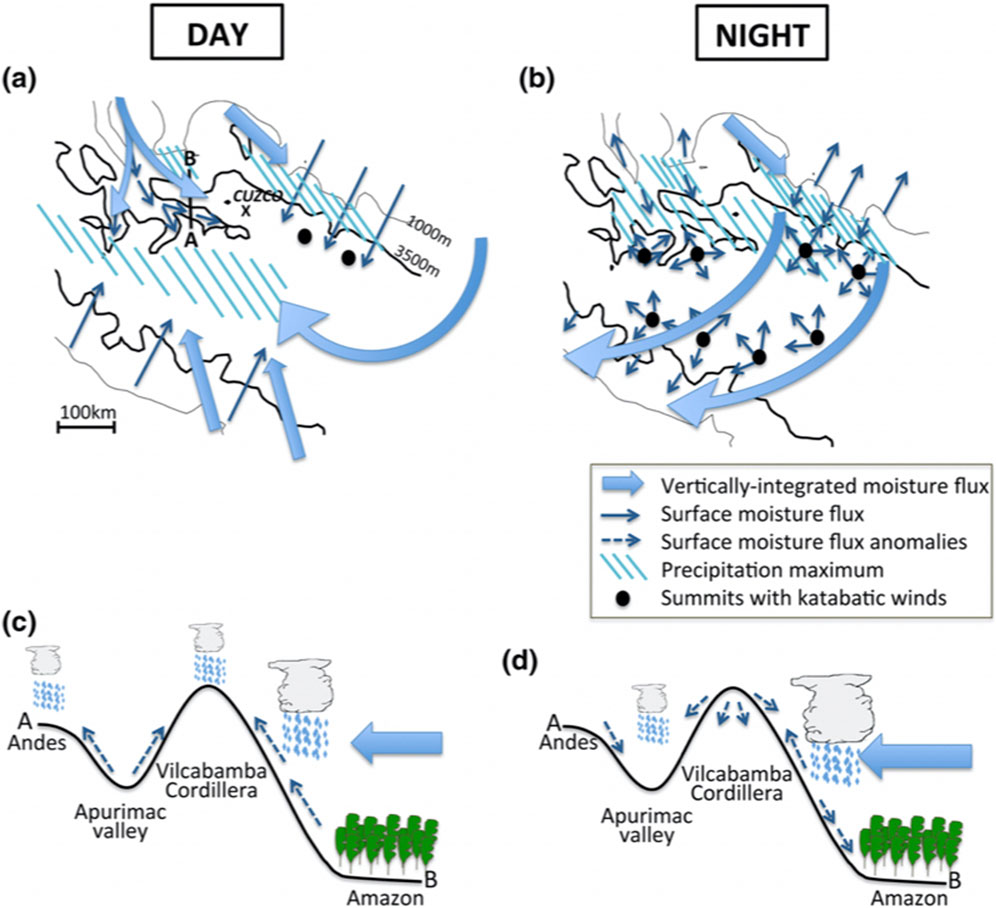
Figure 6. Schematic diagrams of the main local and regional atmospheric circulations identified in Junquas et al. (2018) associated with the diurnal cycle of precipitation in the region of Cuzco and the Apurimac valleys (Peru) from 2000–2014 DJF mean of 9-km WRF simulations for (A, C) local time daytime conditions and (B, D) local time nighttime conditions. To the west of the peak of the Vilcabamba Cordillera more local processes take place, including up-hill winds and precipitation at the summits during the day and katabatic winds, convergence and precipitation over the Apurimac valley during the night (see Figure 2). In contrast, the eastern slopes of the Vilcabamba Cordillera are also affected by regional winds from the Amazon. Source: Junquas et al. (2018).© Climate Dynamics. Reprinted by permission from Springer Nature.
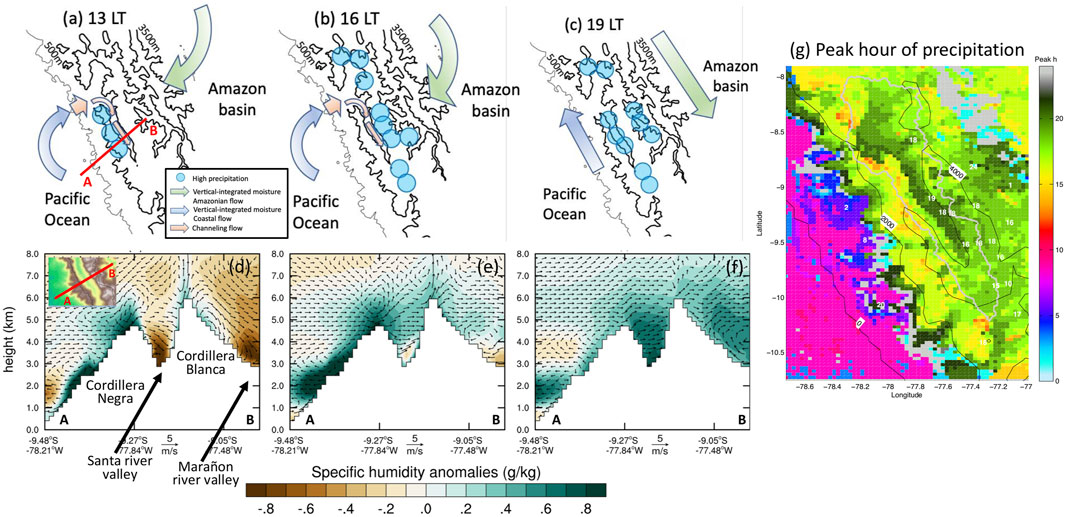
Figure 7. Schematic diagrams of the main afternoon atmospheric circulations and the associated local maximum precipitation patterns at (A) 13hLT, (B) 16hLT and (C) 19hLT in the river Santa basin, including the Cordillera Blanca and Cordillera Negra regions, according to DJFM 2012–2013 2 km-resolution WRF simulations. The resulting diurnal cycle of precipitation is associated with an interplay between (i) two regional flows from the Pacific and from the Amazon, and (ii) local slope and valley winds within the Santa river valley, situated between the Cordillera Blanca and the Cordillera Negra. The thin and bold black contours in (A–C) are topography limits at 500 m. a.s.l. and 3,500 m. a.s.l., respectively. Arrow and colors in (D–F) are the meridional-vertical moisture flux (qv; qw; m/s) and specific humidity (g/kg) respectively, in a vertical cross-section perpendicular to the Santa valley. Geographical details of the cross-section are indicated in the inset panel (A, D). Source: Rosales et al. (2022).© MDPI. CC license. (G) Peak hour of precipitation from 3-km WRF simulations (color) and in situ stations (white numbers) for the hydrological year 2012–2013. Source: Mourre et al. (2016).© Copernicus Publications. CC license. As a result from the regional scale flow and mountain circulations, the maximum precipitation occurs mostly during the late afternoon and early night (G).
Complex terrain can also strongly shape the structure and dynamics of the Convective Boundary Layer (CBL). For example, Bischoff-Gauß et al., (2008) found that the daytime deepening of the CBL of the Elqui valley (northern Chile) is substantially constrained by up-valley and upslope wind systems. In this case the advection terms induced by the complex terrain have negative contributions to the tendencies in temperature, which are of the same order as the positive contribution from the convergence of the turbulent sensible heat flux.
2.4 Gravity waves
At the global scale, tall and/or long mountain chains can induce a substantial drag on the large-scale flow, and affect specific atmospheric patterns like Rossby waves (Sandu et al., 2019). At the mesoscale, gravity waves can interact with and/or contribute to thunderstorms, and mountain waves (MWs) are associated with severe downslope winds (see previous sections, Figure 5) and clear air turbulence (CAT). The explicit simulation of mesoscale gravity waves requires grid spacings in the kilometer and sub-kilometer scale.
The Andes can induce the formation of gravity waves of different scales. For example, the subtropical and extratropical Andes can be the main source of gravity waves (compared to convection), which can then propagate up to the mesosphere (Hierro et al., 2018; Lund et al., 2020; Fritts et al., 2021). The associated momentum fluxes have very local characteristics, related to the fine structure of the Andes, which suggests that part of the corresponding effects would not be adequately represented in previous simulations with global models. A grid spacing of ∼2 km would be necessary to represent part of the complex and detailed dynamics achieved at 0.5 km, including the generation of secondary gravity waves, and some of the extended responses in the mesosphere. However a grid spacing of 4 km still allows a representation of important wave-mean flow interactions, despite exhibiting suppressed instabilities (Fritts et al., 2022).
In the tropical Colombian Andes, Mapes et al. (2003) suggested that nocturnal convective activity and precipitation off the Pacific coast of Colombia could be activated by gravity waves, which in turn would be induced by the diurnal changes in the heat source over the Andes. However, this type of gravity waves are not be the only source of convective activity, and their simulation is challenging due to biases in upper-level winds (Yepes et al., 2020). Mapes et al. (2003) suggested that similar gravity waves, although somewhat weaker, emanate from the tropical Andes towards the Amazon to the east, although their structure and effects are complicated, in part by the presence of westward propagating perturbations, similar to Amazonian squall lines. Furthermore, gravity waves induced by geostrophic adjustment and/or convection over the Amazon can move westward, contributing with the transport of moisture and momentum towards regions inside the Andes (Flores-Rojas et al., 2019; Martinez et al., 2024a).
2.5 Pathways and transport of moisture and aerosols
Utilizing reanalysis fields as inputs, water vapor tracking models have been designed to diagnose the transport and exchange of water vapor between different surface sources (e.g., Gimeno et al., 2012). This kind of tools have been used extensively in studies about South America, including first order estimates of the sources of water vapor along the Andes (e.g., Nieto et al. 2008; Van der Ent et al., 2010; Sakamoto et al., 2011; Martinez and Dominguez, 2014; Zemp et al., 2014; Arias et al., 2015; Hoyos et al., 2018; Morales et al., 2021; Escobar et al., 2022). In this sense, much of what we understand about the patterns of water vapor transport across South America and in the vicinity of the Andes is based on the modeling associated with reanalyses. However, the atmospheric reanalyses with the highest resolution nowadays (e.g., ERA5, ∼0.25°) are still relatively coarse for providing mesoscale details of the wind field in the vicinity of the Andes. Atmospheric simulations with higher resolution can provide a more detailed picture of the effects of the complex topography of the Andes on the transport of moisture over the region (e.g., Viale and Norte, 2009; Trachte, 2018). Both types of approaches (i.e., diagnostics based on reanalyses, and simulations at higher resolution) suggest that most of the atmospheric moisture reaching the tropical Andes comes from eastern sources (including parts of the Amazon, the Atlantic, among others), while the Pacific ocean is a more important source for the central (∼20–40°S) and southern Andes. In addition, numerical simulations at higher resolution highlight the important role of mesoscale structures like sea-breezes, and slope/anabatic winds in the transport of moist air (Viale and Norte, 2009; Trachte, 2018; Martinez et al., 2022; Martinez et al., 2024a).
Numerical tracers or parcel tracking models have been employed for studying the transport aerosols, trace gasses, and other constituents, affecting atmospheric composition and air quality downwind from the sources at different spatial and temporal scales. In particular, kilometer-scale modeling for various regions within the Andes has allowed the identification of recurrent pathways and important sources/sinks for different constituents, including natural constituents like water vapor and biomass particles, and anthropogenic constituents from traffic emissions (Aliaga et al., 2018; González et al., 2018; Henao et al., 2020; Lapere et al., 2021; Ballesteros-González et al., 2022). Natural constituents can travel long distances, for example, starting from the Amazon and reaching high elevations in the Bolivian Andes (Aliaga et al., 2018), or traveling from mega-fires in central Chile and reaching urban areas to the west (Lapere et al., 2021).
On the other hand, the concentration and dispersion of constituents associated with urban areas are highly dependent on specific anthropogenic sources (González et al., 2018), as well as on the valley and slope flows associated with Andean cities (Henao et al., 2020). In the case of air quality, not only very high resolution (ideally sub-kilometer) would be necessary for representing the details of the flow over the Andes affecting urban areas, but also there is a need for improved coupling with microphysics and chemistry schemes. In addition, in order to achieve better statistics, simulations of long periods of time (e.g., several years) would also be needed, which implies a high computational cost.
It is clear that progress in the study of wind systems like those reviewed in this section has been possible because of the use of relatively high resolution simulations. However it is also clear that the identification and analysis of specific phenomena, over specific regions (e.g., zonda winds in Argentina) is instrumental for progress. In other words, it is the focus on different regions along the mountain range by different researchers which provides in depth descriptions and understanding of atmospheric phenemona in the Andes. Furthermore, the details of the atmospheric flow over and around the Andes are intrinsically connected with the distribution of precipitation, e.g., via orographic enhancement of precipitating systems; we review some results about orographic precipitation in the following section.
3 Orographic precipitation
3.1 Tropical and subtropical orographic precipitation
3.1.1 Spatial variability and altitudinal gradients
At regional scale, the tropical Andes cordillera is the location of a strong zonal climatic gradient from the Pacific coast on the west toward the tropical rainforests to the east. In the southern tropical Andes in particular, both sides of the Andes present opposite rainfall regimes with dry conditions in the Western slopes (arid to semi-arid regime) and wet tropical conditions on the eastern slopes. It is a big challenge for atmospheric models, from low-resolution GCMs to high-resolution RCMs to correctly reproduce these climatic gradients, especially in the tropics where convective precipitation and meso-to local-scale circulations within the Andes modulate climate there. In addition, at local scale a large diversity of altitudinal gradients of precipitation are found in valleys, slopes and summits, depending on various factors (e.g., Arias et al., 2021).
In the tropical Andes, regional-scale RCMs simulations (more than 10 km of grid spacing) generally show overestimation of precipitation at high altitudes (e.g., Urrutia and Vuille, 2009; Junquas et al., 2016; 2018; Ochoa et al., 2016; Trachte et al., 2018; Chimborazo and Vuille, 2021; Hodnebrog et al., 2021). By performing climatological (30-years) dynamical downscaling simulations in tropical Andes with grid spacing of 50 km, Urrutia and Vuille (2009) found mainly positive precipitation biases at high altitude, particularly pronounced during December-January-February (DJF) and over the eastern slopes. They attributed much of this bias to the differences in the underlying topography between the model and the validating observation products. Similar biases were found with 10-km resolution simulations in Ecuador (Chimborazo and Vuille 2021) and Peru (Hodnebrog et al., 2021). In the Andes of Colombia, from a dynamical downscaling simulation using the WRF model at 25 km, Martinez et al. (2019) found a mainly positive precipitation bias when compared to satellite products, explained by an excess of atmospheric moisture convergence. Otherwise, negative biases were found in the lower parts of the Andes-Amazon slopes (e.g., Urrutia and Vuille, 2009; Junquas et al., 2016; Chimborazo and Vuille, 2021) and of the Ecuadorian Pacific slope (Ochoa et al., 2014; Chimborazo and Vuille, 2021).
Kilometer-scale RCMs simulations (less than 10 km of grid spacing) are able to reproduce more details in terms of spatial variability of precipitation, but at the same time they exhibit more diversity in terms of spatial biases. In the Mantaro basin (Peru), by testing different daily forecasting configurations of the WRF model with grid spacing of 3 km, both positive and negative precipitation biases were found, depending mainly on the choice of the microphysics and cumulus schemes (see also Part II, Section 3.2), when compared to in situ stations (Moya-Álvarez et al., 2018a; Moya-Álvarez et al., 2018b, Martínez-Castro et al., 2019). For an inter-Andean valley of Colombia (Cauca river valley), kilometer scale simulations also produced smaller precipitation biases, compared to previous reanalysis data (Posada-Marín et al., 2019). For this region, Posada-Marín et al. (2019) found that with a grid spacing of 3.3 km, local precipitation biases still persisted in the simulations when compared to satellite and ground stations, but because of a better representation of the local orography and associated valley-wind processes, smaller biases than in ERA-Interim reanalyses was found, particularly on the western cordillera next to the valley.
In Bolivia, Sierra et al. (2021b) explored two opposite altitudinal gradients of precipitation in two neighboring valleys within the Andes-Amazon transition region, based on 1 km resolution for multi-DFJ simulations. The altitudinal gradient was simulated relatively well in both valleys when compared to in situ stations, including a decrease of precipitation between the bottom (1,000 m. a.s.l to 2000 m. a.s.l.) and the highest altitudes (∼4,900 m. a.s.l.) in along-valley direction of the Zongo valley, as well as an increase of precipitation in the Huarinilla valley from the bottom (∼1800 m. a.s.l.) to the summit (∼3,000 m. a.s.l.). Even though, in both valleys negative biases still persisted in the models, particularly in the Zongo valley at mid-slope and in the lower parts. In the region of the Antizana glacier in Ecuador, two localized maxima of precipitation were simulated: one over the mid-slope of the valleys surrounding the glacier and other over the summit (Junquas et al., 2022). The maximum on the summit could be partly validated by glacier surface mass balance calibration results (Basantes-Serrano et al., 2016). However, the maximum on the mid-slope could not be validated because of a lack of in situ stations. On the western slope of central Andes (Peru), rainfall decreases with increasing elevation, according to observations. Simulations with the WRF model suggested the underlying mechanisms are an interplay between the large-scale circulation, thermally driven upslope winds and sea breeze flow (Trachte et al., 2018).
The well-known “hotspots” of localized high precipitation in the Andes-Amazon slope (e.g., Romatschke and Houze, 2010; Espinoza et al., 2015) are generally well depicted by the high-resolution simulations, although with some biases. Considering a DJF climatology from WRF model simulations (grid spacing <9 km), the “Quincemil” hotspot (Eastern Andes of Peru) was correctly reproduced in terms of altitude ranges with a maximum precipitation amount localized between 500 and 3,500 m. a.s.l. (Junquas et al., 2018; Sierra et al., 2021b; Figure 6). However an overestimation was still found in simulations when compared to observations and satellite data.
Another common error found in the simulations, particularly at lower resolutions (grid spacing larger than 15 km), consists of depicting the hotspot region as a continuous band of maximum precipitation along the Andes-Amazon region from Bolivia to northern Peru, instead of independently localized centers of precipitation maxima (Gutierrez et al., 2024). The same error was identified in the Andes-Amazon transition region of Ecuador and southern Colombia with the WRF model (Junquas et al., 2022). In particular, the hotspot precipitation system in this region was shifted westward by the model, toward higher altitudes when compared to satellite data, a bias related to a misrepresentation of the westerly moisture transport and convergence in the model (Figures 8A–D). As a result, an overestimation of precipitation at high altitudes by the model is observed, including the summit of the Antizana glacier.
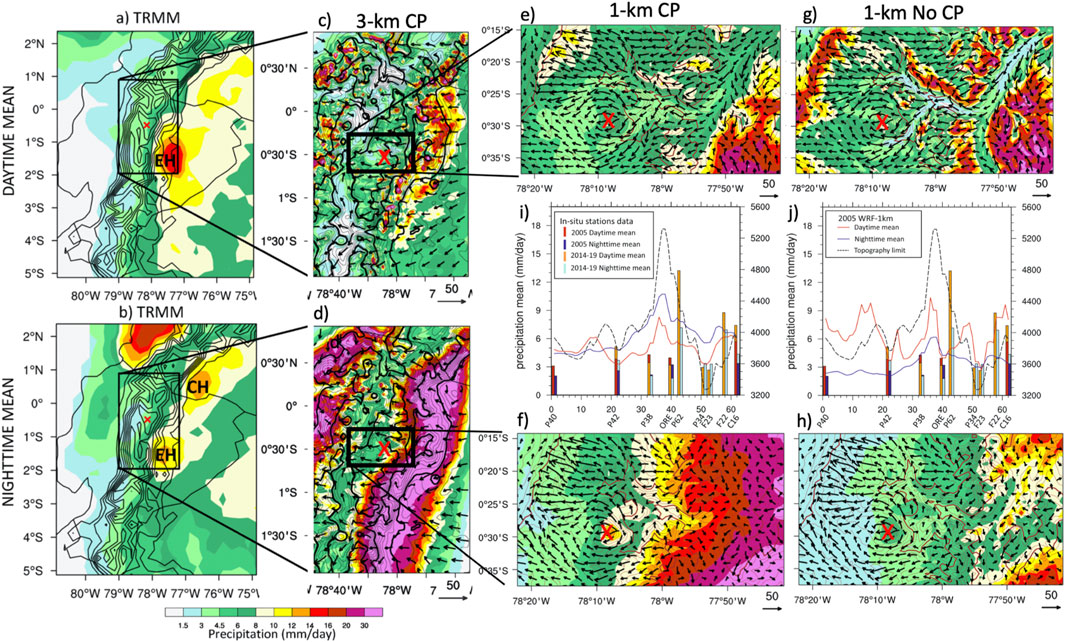
Figure 8. Local Daytime and nighttime means of precipitation (colors; mm/day) from (A, B) the precipitation radar of the Tropical Rainfall Measuring Mission (TRMM-2A25) and from 3-km (C, D) and 1-km (E–H) WRF simulations (2005 years mean) in the region of the Antisana glacier (Ecuador; indicated with a red cross). Associated low-level vertically-integrated (C, D) and surface (E–H) moisture fluxes are displayed in arrows (reference vector in g kg −1 m s−1 indicated in the lower right corner of each panel). Black contours are topography level. (I, J) South-North transect of daytime (red and orange lines) and nighttime (blue lines) means of precipitation (mm/day) for two 1-km experiments, from the in situ station P40 (0°45S; 78°21’W) to the station C16 (0°17S; 78°07’W). The topography along the cross-section is displayed by a dashed black line (m). The 3-km and 1-km CP (No CP) experiments indicate experiments with the Cumulus scheme deactivated (activated). Source: Junquas et al. (2022).© Climate Dynamics. Reprinted by permission from Springer Nature.
In terms of precipitation spatial variability, the tropical Andes hotspots are some of the regions most poorly represented in South America by GCMs (Ortega et al., 2021). Oglesby et al. (2016) showed that with grid spacings of 36 km and larger, the tropical Andes topography is not elevated enough to correctly block the easterly winds. Therefore the wind blows from the Atlantic Ocean toward the Pacific Ocean without correctly considering the Andes like the natural barrier it actually is. This problem could be addressed utilizing simulations with a grid spacing of at least 10–12 km in dynamical downscaling from GCM outputs (Oglesby et al., 2016; Hodnebrog et al., 2021; see also Section 3.1 in Part II).
3.1.2 Diurnal cycle
At local scale, one of the main interests in using high-resolution modeling is to be able to describe the valley and slope mountain winds that could directly impact the diurnal cycle of precipitation, especially when the synoptic forcing is weak as in the tropics (also see Section 2.3). In various parts of the tropical Andes, previous studies have associated a diurnal cycle of precipitation with thermally-driven mountain winds (e.g., Garreaud, 1999; Poveda et al., 2005; Egger et al., 2005; Zängl and Egger, 2005; Reuder and Egger, 2006; Giovannettone and Barros, 2009; Trachte et al., 2010a; Trachte et al., 2010b; Trachte et al., 2018; Junquas et al., 2018; Junquas et al., 2022; Rosales et al., 2022; Martínez et al., 2024b). These mountain winds typically consist of upslope winds contributing to a maximum of precipitation on mid-slopes or summits during the day. Downslope winds can contribute to a maximum of precipitation over lower parts of valleys and slopes during the night.
Some studies have performed experiments with a numerically modified valley orography in order to identifying the effect of the channeling or blocking processes over the valley-wind circulation and their impacts over the local diurnal cycle of precipitation (e.g., Junquas et al., 2018; Gómez-Rios et al., 2023; Figure 6). In the Pacific coast of the southern tropical Andes, high-resolution experiments showed that in addition to regional circulations and SST variability, the local diurnal cycle of the sea-breeze process contributed to the daytime upslope moisture flow and associated precipitation in the western slope of the peruvian Andes (Trachte et al., 2018; Rosales et al., 2022). In addition, a channeling of this flow in the Santa valley (Cordillera Blanca, Peru) contributed to explaining the diurnal cycle of precipitation in the valley, with mountain-to-valley and South-North shifts of the precipitation events during mid to late afternoon (Rosales et al., 2022; Figure 7).
In some regions of the tropical Andes, the diurnal cycle of precipitation is strongly modulated by the seasonality, as shown for example, in the valley of the Magdalena river in Colombia (Poveda et al., 2005) and in Ecuador (Laraque et al. 2007). Generally the RCMs show good representation of the seasonal precipitation variability at daily or monthly scale (e.g., Ochoa et al., Ochoa et al., 2014; Ochoa et al., 2016; González-Rojí et al., 2022). However, some difficulties persist associated with the complex representation of the multi-scale processes involved in the diurnal scale, e.g., the interaction of local mountain circulations with the regional scale trade winds, (e.g., Poveda et al., 2020; Junquas et al., 2022). Due to the high computing cost of performing multi-year simulations at high spatio-temporal resolutions and a lack of observational data available at such local scales, few studies exist for now about the modulation of the precipitation diurnal cycle by seasonal processes and more understanding is needed. Modeling studies are needed to explore such spatio-temporal dynamics.
3.1.3 Extreme tropical precipitation events
Regional model forecast (e.g., Hoyos et al., 2019; Flores-Rojas et al., 2021; Martínez et al., 2024b) and sensitivity experiments (e.g., Zamuriano-Carbajal, 2019; Martinez et al., 2024a) have been performed for different case studies of extreme precipitation events in the tropical Andes. In particular, the WRF model is frequently used as an operational tool to produce short-term forecasts in national weather services in the Andean countries. Although the model generally underestimated the total rainfall amount during the extreme events, it is able to correctly capture the complexity of the associated processes, including the patterns of precipitation over the complex terrain (e.g., Hoyos et al., 2019; Flores-Rojas et al., 2021). During the 2015 Salgar flash flood in the Colombian Andes, high-resolution (2 km) simulations in forecast mode were performed to understand a local orographic intensification of a series of intense storms associated with regional easterly winds (Hoyos et al., 2019). The results showed that moist air was advected upward along the slope, generating a mechanical triggering of precipitation in the upper part of the basin (∼3,600 m. a.s.l.), similar to the observations. The precipitation was correctly forecasted during the three consecutive days of the event during nighttime, but with a persistent underestimation of the total rainfall amounts. These results show that an operational model used at high-resolution is a powerful tool to provide useful information for risk management and impact studies.
In the region of La Paz valley connecting the Bolivian Amazon and the southern Altiplano, the WRF model was used (grid spacing of 2 km) to investigate the hailstorm and flash flood event of February 2002 through diverse sensitivity experiments modifying the land surface characteristics including the Titicaca lake feature (Zamuriano-Carbajal, 2019). The model was able to reproduce the main atmospheric processes associated with the event. During the early afternoon the Titicaca lake breeze generated cold pools over the plateau that propagated toward the upper part of the La Paz valley, and converged with the upslope valley breeze triggering a strong convective cell near La Paz city that ultimately produced the flash flood event. In the Mantaro basin (Peru), the WRF model (grid size 0.5 km) coupled with the ARPS model (Advance Regional Prediction System; Xue et al. (2000) was able to reproduce two extreme precipitation events at two different seasons (austral autumn and winter), occurring under distinctive synoptic conditions (easterlies vs. westerlies at mid and upper levels of the atmosphere; Flores-Rojas et al., 2021). The ARPS model was also used with 1 km grid spacing in the Andes-Amazon transition region of northern Peru/Southern Ecuador to identify the local atmospheric processes associated with a nocturnal extreme convective cell during October 2019 (Trachte et al., 2010b; see also Part II - Section 3.1).
3.2 Extra-tropical orographic precipitation
Frontal precipitation systems embedded in the southern westerlies, including atmospheric rivers reach the subtropical sector of the Andes mostly in austral winter, while over the extratropical sector of the Andes they occur all year round (e.g., Garreaud et al., 2013; Viale and Nuñez, 2011; Viale and Garreaud, 2015; Viale et al., 2019). Given the absence of a comprehensive network of local and remote sensing observations recording storms moving over the Andes in Argentina and Chile, research on orographic precipitation have relied on specific short-term observational campaigns and numerical modeling. Long-term climate simulations in Patagonia reproduced well the marked contrast between the hyper humid conditions prevailing in western Patagonia and the dry/cold climate characterizing the steppe on the east side of the Andes (Garreaud et al., 2013; Lenaerts et al., 2014). Within this region, specific research with RCMs have focused on the northern and southern ice fields (Lenaerts et al., 2014; Schaefer et al., 2013; Villarroel et al., 2013; Carrasco-Escaff et al., 2023), showing a prominent orographic precipitation enhancement. The overall wet conditions in western Patagonia, further boosted by the topography uplift, lead to modeled mean annual accumulations of up to 10 m (or even 30 m in some regions) on the windward side of these huge ice bodies, in contrast to the dry (<500 mm) conditions on its lee-side foot. Some estimates from in situ records are available for the southern icefield, which allows comparison with the studies with RCMs mentioned above. For example, estimations through ice cores in the Pio XII glacier indicate that the annual accumulation of precipitation ranges from 3 to 7 m, with an average of 6 m over a seven-year period (2000–2006; Schwikowski et al., 2013). Although the precipitation regime in western Patagonia likely makes it the wettest place outside the tropics, ice core proxies indicate that high-resolution simulations may be overestimating the orographic precipitation enhancement over the austral Andes.
Farther north in central Chile, based on local observations and a very high-resolution (1 km) simulations with WRF, Garreaud et al. (2016) described the contribution of orographic precipitation over the coastal range of Nahuelbuta around 37ºS for the winter of 2011. Although WRF tends to overestimate precipitation by a factor of 1.5 in this region, it shows a good agreement with observational data regarding the orographic rainfall enhancement, with a ratio of mountain top to foothill values of about 2. Other modeling case studies have shed light on orographic precipitation processes upstream of the subtropical Andes, where the high elevation of the subtropical Andes not only enhances precipitation directly over the upslope terrain, but also enhances precipitation upstream of it, on the Chilean lowlands (Barrett et al., 2009; Viale et al., 2013). The resulting overestimation of precipitation from models [e.g., as in Garreaud et al. (2016)] could be smaller than initially estimated, when accounting for wind-induced rainfall undercatch (up to 10%) at windward slope stations. Studies like those by Barrett et al. (2009), Viale et al. (2013) and Garreaud et al. (2016), found that the models were able to reproduce brief periods (1–3 h) of high precipitation rates over the mountains as well as over the upstream lowlands.
Using high-resolution (10 km) simulations with WRF, Barrett el al. (2009) showed that precipitation was enhanced upstream of the Andes as a result of increased low-level convergence just ahead of a moving equatorward cold front due to the low-level blocking and barrier jet formation. Viale et al. (2013) suggested that the increased low-level convergence operated in tandem with a seeder-feeder mechanism, activated by mid-level flow ascending upstream of the Andes over low-level blocked flow (Figure 4), enhancing hydrometeor growth processes just ahead of a cold front moving equatorward. Bozkurt et al. (2019) describe results from ensembles of long-term simulations (longer than 30 years) performed with RegCM4 in a domain covering continental Chile with a grid spacing of nearly 10 km (see Part II). Forced at the domain boundaries by both reanalysis (ERA-Interim) and GCM (MPI-ESM-MR) data, these simulations also allow assessing the dynamic downscaling performance over the complex landscape of the southern Andes. The model output reasonably represents the orographic uplift and precipitation enhancement on the windward side of the extratropical Andes. However, with coarser resolution (reanalysis and GCM), a strong underestimation was found.
Torrez-Rodriguez et al. (2023) showed that the CORDEX-CORE and Eta model simulations (grid spacing ∼20–25 km) reproduce reasonably well the main spatio-temporal characteristics of precipitation over North-Central Chile, such as latitudinal gradients, airflow uplift by orographic barriers, phase of the seasonal cycle, and realistic inter-annual variability. However, they systematically overestimate the total precipitation, especially between 25ºS and 35ºS with the most prominent bias over higher elevations (more than 200%–300%), the latter being associated with a strong overestimation of mean orographic enhancement of precipitation when compared with observation-based studies (Viale and Garreaud, 2015). In general, numerical simulations have been instrumental to understand and/or diagnose the effects of extratropical dynamics on major precipitation events in the vicinity of the central and southern Andes, including the dynamics of cut-off lows, atmospheric rivers and the distribution of precipitation over the complex terrain during severe precipitation events and flooding (see e.g., Garreaud and Fuenzalida, 2007, Bozkurt et al. 2016; Garreaud et al. 2024).
High-resolution modeling studies provide crucial insights into the orographic precipitation and rain shadow effects from midlatitudes precipitation systems moving over the Subtropical Andes (30ºS-40°S), mostly in winter, and over the extratropical Andes (∼40ºS-55ºS) all year round. Such high-resolution simulations capture the sharp precipitation gradients caused by moist westerlies rising over the Andes, resulting in significant rainfall on the western slopes and drier conditions on the eastern side (Viale and Norte 2009; Viale et al., 2013; Lenaerts et al., 2014; Damseaux et al., 2020; Sauter, 2020). These high-resolution simulations solve fine-scale orographic precipitation processes, such as localized precipitation maxima and minima, by accurately depicting terrain features and elevation changes, which is essential for weather forecast and assessing glacier and surface mass balance implications in Patagonia (Schaefer et al., 2013; Bravo et al., 2019).
The use of simulations with higher resolution has allowed a more detailed investigation of orographic precipitation over the Andes (e.g., the mesoscale dynamics associated with its initiation), as shown by the reviewed studies, especially from around the last 10 years. However, a more comprehensive characterization and understanding of orographic precipitation over the Andes is still under development because of several reasons, including the diversity of characteristics (e.g., differences in phase of the mean diurnal cycle) along the region, the need for longer simulations for a better characterization of its climate, the need for a larger pool of simulated severe precipitation events for a more robust assessment of extremes, and a more detailed assessment of biases and model deficiencies for the region. This last issue is reviewed in the following section, and in Section 3 of Part II.
4 Model evaluation
Model validation with local (in situ) observations, especially for long periods, is essential for assessing atmospheric processes and patterns in the Andes, especially at small (e.g., kilometer-scale) spatial scales. In this sense, a dense network of surface observations (e.g., for temperature and precipitation), along with multi-level atmospheric information (e.g., from radiosondes, radars, etc.) is highly needed for the region. For example, in a review of the climatological and hydrological observations for the Andes, Condom et al. (2020) make emphasis on the lack of observation sites in high-elevation areas along the Andes (less than 4,100 stations above 2001 m), and on the very few regular radiosonde launching sites (∼16 along the whole mountain range), despite their importance for atmospheric monitoring and for the validation of atmospheric models. Other data sources, like satellite-based or reanalyses data, are commonly used, but these sources exhibit biases associated with instrument calibration and data processing (Cavazos et al., 2024). Furthermore, both observations and model output at increasingly higher temporal resolution (hourly, or even sub-hourly) would be needed for a better characterization of the diurnal cycle of different hydroclimate variables and extreme precipitation events. The PISCOp_h high-resolution (0.1°) hourly gridded precipitation dataset for Peru (Huerta et al., 2022) is one example of the type of datasets that can greatly help with model validation over the Andes. Field campaigns like SALLJEX (Vera et al., 2006), ChocoJEX (Yepes et al., 2019, 2020), OTREC (Mejía et al., 2021) and RELAMPAGO (Sasaki et al., 2022) also provide data (see Section 2.3.1) that is instrumental for model validation.
Utilizing a variety of data sources, a number of studies have reported on the type of biases of atmospheric models for representing or predicting variables like temperature, humidity and winds near the surface, precipitation, downward shortwave radiation, among others. Results about the biases in ensembles of long term (climate) simulations and sensitivity studies are reviewed throughout Part II, in the context of applications to climate projections (Section 2, Part II) and model configuration (Section 3, Part II). Here we briefly review some results about model performance and biases in applications regarding Numerical Weather Prediction (NWP).
There is a noticeable lack of peer-reviewed studies focusing on model performance for NWP applications in the Andean regions, although LAMs are routinely used by their national meteorological services (NMSs). Most examples of NWP studies for the Andes are based on CP simulations, and they focus on the short range (1–3 days). For example, for the Chajnantor plateau (∼5,100 m. a.s.l, ∼23°S) of northern Chile, Pozo et al. (2016) report about the performance of CP simulations with WRF (1 km grid-spacing) for the forecast of temperature, water vapor mixing ratio and winds near the surface, along with total column water vapor, for lead times between 1 and 3 days. For this very dry region, Pozo et al. (2016) find that their simulations underestimate the near surface temperature but overestimate the water vapor mixing ratio and the 10 m wind magnitude (especially the meridional component). For the central Andes of Peru (∼12°S), and comparing members from a multiphysics ensemble, Moya-Álvarez et al., 2018a find that most configurations overestimate precipitation for the region for 1–10 days lead time, with a slightly larger bias when in CP mode (3 km grid spacing). Martínez et al. (2024b) also found overestimation of 24-h precipitation (i.e. 1 day lead time) in CP simulations with WRF (grid spacing 4 km), both in seasonal averages and for two heavy precipitation events over the northern Andes. In contrast, compared with satellite estimates, the model underestimates the nocturnal precipitation over the lowlands around the Andes for most of the days.
On the other hand, in 36-h forecasts of precipitation from a multiphysics ensemble using parameterized deep cumulus convection, Moya-Álvarez et al. (2020) found that most ensemble members underestimate precipitation by about 7% over central Peru, which seems to be related with a boundary layer that is more stable than in observations. On a longer time scale, Arévalo et al. (2024) investigated the performance of forecasts in the subseasonal-to-seasonal range for central Chile (Andes around 33°S), utilizing a multi-physics ensemble (smallest grid spacing of 1 km), including ensemble members with an active deep cumulus scheme. Interestingly, despite the differences in experiment design, Arévalo et al. (2024) also find that the model mostly underestimates precipitation over the lowlands, but overestimates it elsewhere, similar to the findings by Moya-Álvarez et al. (2018b); Martínez et al., (2024b). In addition, Arévalo et al. (2024) find that in general the forecasts overestimate near surface winds and temperature.
The studies reviewed in the last paragraph are mostly devoted to the description of the experimental design and to the calculation of metrics for forecast errors, whereas a robust analysis and diagnosis devoted to the understanding of those errors is in general beyond the scope of this type of studies. However, the evaluation of model outputs might benefit from comprehensive studies that look at multiple variables, and performance metrics based on physical processes, in order to better assess the overall skills of the models (see e.g., Covey et al., 2016; García-Díe et al. 2015; Katragkou et al. 2015; Stegehuis et al. 2015; Eyring et al., 2019). Evaluations based on processes might help to better select models for ensembles, for identifying the added value of models, and for using them as an additional block in a chain that provides data at a much higher level of detail for local studies (e.g., Douville et al., 2022). In addition, none of the examples reviewed above about NWP refer to the use of data-assimilation techniques, or ensemble forecasting based on variations in initial conditions. Furthermore, in the case of validation of precipitation forecasts, the peer-reviewed literature about the Andes does not include many studies about categorical forecasts (i.e., based on contingency tables), or object based evaluation (e.g., for the forecast of storms). It is likely that this kind of model validation is performed within the NMSs of the Andean countries, but not reported in the peer-reviewed literature.
5 Final remarks
The relatively recent studies reviewed here have made important contributions to our understanding of the hydroclimate of the Andes, especially at the mesoscale. Numerical modeling for the region has also provided important lessons about forecasting and projections at different time scales. This review constitutes a step forward bringing together and connecting previous studies about the region, which has been possible both by the use of high resolution atmospheric modeling, and via a major incorporation of the general knowledge about mountain weather and climate to understand specific phenomena of the Andes. However, since the atmospheric science community is relatively small and the observations are limited in the region, major challenges remain, especially those related with model evaluation, which depend on the availability of more observation-based datasets, and on more sophisticated studies/techniques for model evaluation.
Since model biases will always exist, associated with uncertainties in model components and/or initial and boundary conditions, post-processing techniques, as for example, statistical bias correction, have added value to reduce biases before using the model outputs as atmospheric forcing for hydrological or other impact models (e.g., Rogelis and Werner, 2018). However, bias correction techniques are more efficient in regions with spatially uniform biases (e.g., in the case of precipitation, Heredia et al., 2018), which is not the case in the Andes, making them difficult to apply. The gathering and consolidation of the sparse observations available would be a necessary step for improving bias correction (and model validation) projects over the region. One successful example of data gathering and made available in one place is the Andean Observatory (Observatorio Andino, https://observatorioandino.com/), which provides information about the Andean regions in Chile and Argentina. In addition, the implementation of different techniques (e.g., leveraging on the power of Machine Learning), is also a pending task. Thus, the development and/or adaptation of bias correction techniques for model output (e.g., precipitation, surface temperature) is another big challenge for the Andes region.
Major applications of numerical modeling for the Andes include the study of the regional and local effects from climate change (e.g., elevation dependent warming) and from land-use/land cover changes. The correct simulation of the associated processes requires both high resolution (as discussed in previous sections, see also Section 3.1 in Part II) and improved model components, e.g., for surface fluxes, boundary layer dynamics over complex terrain, land-cover characteristics, surface hydrology, etc. (see Section 3, on Part II of this review). With these increasingly demanding applications, other major challenges emerge, such as the constant need for increased high performance computing (both for simulation and analysis), comprehensive high-resolution regional atmospheric and earth system simulations, as well as coordinated inter- and intra-disciplinary numerical experiments. In addition, in the case of the Andes, other challenges have to be overcome in order to fully exploit the potential benefits of atmospheric and climate modeling, including the need for funding, educational resources, and policies for the creation and addition of more academic and operational positions in the region for environmental monitoring and modeling. The topics and challenges listed in this paragraph are the subject of Part II of this review.
Author contributions
JM: Conceptualization, Investigation, Writing–original draft, Writing–review and editing. CJ: Conceptualization, Investigation, Writing–original draft, Writing–review and editing, Funding acquisition. DB: Writing–original draft, Writing–review and editing. MV: Writing–original draft, Writing–review and editing. LF: Writing–original draft, Writing–review and editing. KT: Writing–original draft, Writing–review and editing. LC: Writing–original draft, Writing–review and editing. PA: Writing–review and editing. JB: Writing–review and editing. TC: Writing–review and editing. KG: Writing–review and editing. JP-C: Writing–review and editing. GP: Writing–review and editing. SS: Writing–review and editing. AS: Writing–review and editing. JE: Writing–review and editing.
Funding
The author(s) declare that financial support was received for the research, authorship, and/or publication of this article. This research has been supported by the CECC project (Water Cycle and Climate Change, IRD/AFD) and the HighRes-AmSur project from the regional program CLIMAT-AmSud (22-CLIMAT-05). JM and PA are supported by MINCIENCIAS through program No. 80740-490-2020 and by ClimatAmSud through MINCIENCIAS grant 80740-238-2021. DB and JB. acknowledge support from ANID-FONDAP-1523A0002. DB acknowledges support from COPAS COASTAL ANID FB210021. KG acknowledges support from ANID (Concurso de Fortalecimiento al Desarrollo Científico de Centros Regionales 2020-R20F0008-CEAZA).
Acknowledgments
This work was developed within the GEWEX Regional Hydroclimate Project for the Andes (ANDEX, https://www.gewex.org/project/andex/). The authors also thank Yamina Silva (IGP, Peru) and Luis Blacutt (UMSA, Bolivia) for their participation in discussions. The authors thank Sly Wongchuig for contributing with Figure 2. The authors dedicate this study to the memory of Eugenia Kalnay, whose work was fundamental to the international Atmospheric Science community and to the memory of Kyoko Ikeda, whose work greatly contributed to atmospheric modeling in South America.
Conflict of interest
The author declares that the research was conducted in the absence of any commercial or financial relationships that could be construed as a potential conflict of interest.
The author(s) declared that they were an editorial board member of Frontiers, at the time of submission. This had no impact on the peer review process and the final decision.
Publisher’s note
All claims expressed in this article are solely those of the authors and do not necessarily represent those of their affiliated organizations, or those of the publisher, the editors and the reviewers. Any product that may be evaluated in this article, or claim that may be made by its manufacturer, is not guaranteed or endorsed by the publisher.
References
Aliaga, D., Sinclair, V. A., Andrade, M., Artaxo, P., Carbone, S., Kadantsev, E., et al. (2018). Identifying source regions of air masses sampled at the tropical high-altitude site of Chacaltaya using WRF-FLEXPART and cluster analysis. Atmos. Chem. Phys. 21 (21), 16453–16477. doi:10.5194/acp-21-16453-2021
Almazroui, M., Ashfaq, M., Islam, M. N., Rashid, I. U., Kamil, S., Abid, M. A., et al. (2021). Assessment of CMIP6 performance and projected temperature and precipitation changes over SouthSouth America. Earth Syst. Environ. 5, 155–183. doi:10.1007/s41748-021-00233-6
Ambrizzi, T., Reboita, M. S., da Rocha, R. P., and Llopart, M. (2019). The state of the art and fundamental aspects of regional climate modeling in South America. Ann. N. Y. Acad. Sci. 1436 (1), 98–120. doi:10.1111/nyas.13932
Antico, P. L., Chou, S. C., and Mourão, C. (2017). Zonda downslope winds in the central Andes of South America in a 20-year climate simulation with the Eta model. Theor. Appl. Climatol. 128 (1), 291–299. doi:10.1007/s00704-015-1709-2
Arévalo, J., Marín, J. C., Díaz, M., Raga, G., Pozo, D., Córdova, A. M., et al. (2024). Sensitivity of simulated conditions to different parameterization choices over complex terrain in Central Chile. Atmosphere 15 (1), 10. doi:10.3390/atmos15010010
Arias, P. A., Garreaud, R., Poveda, G., Espinoza, J. C., Molina-Carpio, J., Masiokas, M., et al. (2021). Hydroclimate of the andes part II: hydroclimate variability and sub-continental patterns. Front. Earth Sci. 8, 505467. doi:10.3389/feart.2020.505467
Arias, P. A., Martínez, J. A., and Vieira, S. C. (2015). Moisture sources to the 2010–2012 anomalous wet season in northern South America. Clim. Dyn. 45, 2861–2884. doi:10.1007/s00382-015-2511-7
Arraut, J. M., Nobre, C., Barbosa, H. M., Obregon, G., and Marengo, J. (2012). Aerial rivers and lakes: looking at large-scale moisture transport and its relation to Amazonia and to subtropical rainfall in South America. J. Clim. 25 (2), 543–556. doi:10.1175/2011jcli4189.1
Ballesteros-González, K., Espitia-Cano, S. O., Rincón-Caro, M. A., Rincón-Riveros, J. M., Perez-Peña, M. P., Sullivan, A., et al. (2022). Understanding organic aerosols in Bogotá, Colombia: in-situ observations and regional-scale modeling. Atmos. Environ. 284, 119161. doi:10.1016/j.atmosenv.2022.119161
Barrett, B. S., Garreaud, R., and Falvey, M. (2009). Effect of the Andes Cordillera on precipitation from a midlatitude cold front. Mon. Weather Rev. 137 (9), 3092–3109. doi:10.1175/2009mwr2881.1
Basantes-Serrano, R., Rabatel, A., Francou, B., Vincent, C., Maisincho, L., Caceres, B., et al. (2016). Slight mass loss revealed by reanalyzing glacier mass-balance observations on Glaciar Antisana 15α (inner tropics) during the 1995–2012 period. J. Glaciol. 62 (231), 124–136. doi:10.1017/jog.2016.17
Berbery, E. H., and Barros, V. R. (2002). The hydrologic cycle of the La Plata basin in South America. J. Hydrometeorol. 3 (6), 630–645. doi:10.1175/1525-7541(2002)003<0630:thcotl>2.0.co;2
Berbery, E. H., and Collini, E. A. (2000). Springtime precipitation and water vapor flux over southeastern South America. Mon. Weather Rev. 128 (5), 1328–1346. doi:10.1175/1520-0493(2000)128<1328:spawvf>2.0.co;2
Bischoff-Gauß, I., Kalthoff, N., Khodayar, S., Fiebig-Wittmaack, M., and Montecinos, S. (2008). Model simulations of the boundary-layer evolution over an arid Andes valley. Boundary-layer Meteorol. 128 (3), 357–379. doi:10.1007/s10546-008-9293-y
Böhm, C., Reyers, M., Knarr, L., and Crewell, S. (2021). The role of moisture conveyor belts for precipitation in the Atacama Desert. Geophys. Res. Lett. 48 (24), e2021GL094372. doi:10.1029/2021gl094372
Bozkurt, D., Rojas, M., Boisier, J. B., Rondanelli, R., Garreaud, R., and Gallardo, L. (2019). Dynamical downscaling over the complex terrain of southwest South America: present climate conditions and added value analysis. Clim. Dyn. 53, 6745–6767. doi:10.1007/s00382-019-04959-y
Bozkurt, D., Rondanelli, R., Garreaud, R., and Arriagada, A. (2016). Impact of warmer eastern tropical Pacific SST on the March 2015 Atacama floods. Mon. Weather Rev. (144) 11, 4441–4460. doi:10.1175/MWR-D-16-0041.1
Bravo, C., Bozkurt, D., Gonzalez-Reyes, A., Quincey, D., Ross, A. N., Farías, D., et al. (2019). Assessing snow accumulation patterns and changes on the patagonian icefields. Front. Environ. Sci. 7 (1), 30. doi:10.3389/fenvs.2019.00030
Broccoli, A. J., and Manabe, S. (1992). The effects of orography on midlatitude Northern Hemisphere dry climates. J. Clim. 5 (11), 1181–1201. doi:10.1175/1520-0442(1992)005<1181:teooom>2.0.co;2
Builes-Jaramillo, A., Yepes, J., and Salas, H. D. (2022a). The Orinoco low-level jet and its association with the hydroclimatology of northern SouthSouth America. J. Hydrometeorol. 23 (2), 209–223. doi:10.1175/jhm-d-21-0073.1
Builes-Jaramillo, A., Yepes, J., and Salas, H. D. (2022b). The Orinoco low-level jet during el niño–southern oscillation. Int. J. Climatol. 42 (15), 7863–7877. doi:10.1002/joc.7681
Carrasco-Escaff, T., Garreaud, R., Bozkurt, D., Jacques-Coper, M., and Pauchard, A. (2024). The key role of extreme weather and climate change in the occurrence of exceptional fire seasons in south-central Chile. Weather Clim. Extrem. 45, 100716. doi:10.1016/j.wace.2024.100716
Carrasco-Escaff, T., Rojas, M., Garreaud, R. D., Bozkurt, D., and Schaefer, M. (2023). Climatic control of the surface mass balance of the Patagonian Icefields. Cryosphere 17, 1127–1149. doi:10.5194/tc-17-1127-2023
Cavazos, T., Bettolli, M. L., Campbell, D., Sánchez Rodríguez, R. A., Mycoo, M., Arias, P. A., et al. (2024). Challenges for climate change adaptation in Latin America and the Caribbean region. Front. Clim. 6, 1392033. doi:10.3389/fclim.2024.1392033
Chimborazo, O., and Vuille, M. (2021). Present-day climate and projected future temperature and precipitation changes in Ecuador. Theor. Appl. Climatol. 143, 1581–1597. doi:10.1007/s00704-020-03483-y
Comin, A. N., Schumacher, V., Justino, F., and Fernrández, A. (2018). Impact of different microphysical parameterizations on extreme snowfall events in the Southern Andes. Weather Clim. Extrem. 21, 65–75. doi:10.1016/j.wace.2018.07.001
Condom, T., Martínez, R., Pabón, J. D., Costa, F., Pineda, L., Nieto, J. J., et al. (2020). Climatological and hydrological observations for the South American Andes: in situ stations, satellite, and reanalysis data sets. Front. Earth Sci. 8, 92. doi:10.3389/feart.2020.00092
Covey, C., Gleckler, P. J., Doutriaux, C., Williams, D. N., Dai, A., Fasullo, J., et al. (2016). Metrics for the diurnal cycle of precipitation: toward routine benchmarks for climate models. J. Clim. 29 (12), 4461–4471. doi:10.1175/jcli-d-15-0664.1
Damseaux, A., Fettweis, X., Lambert, M., and Cornet, Y. (2020). Representation of the rain shadow effect in Patagonia using an orographic-derived regional climate model. Int. J. Climatol. 40 (3), 1769–1783. doi:10.1002/joc.6300
Dominguez, F., Rasmussen, R., Liu, C., Ikeda, K., Prein, A., Varble, A., et al. (2024). Advancing South American water and climate science through multidecadal convection-permitting modeling. Bull. Am. Meteorological Soc. 105 (1), E32–E44. doi:10.1175/bams-d-22-0226.1
Douville, H., Allan, R. P., Arias, P. A., Betts, R. A., Caretta, M. A., Cherchi, A., et al. (2022). Water remains a blind spot in climate change policies. PLOS Water 1 (12), e0000058. doi:10.1371/journal.pwat.0000058
Egger, J., Blacutt, L., Ghezzi, F., Heinrich, R., Kolb, P., Lämmlein, S., et al. (2005). Diurnal circulation of the Bolivian Altiplano. Part I: observations. Mon. Weather Rev. 133, 911–924. doi:10.1175/mwr2894.1
Eghdami, M., and Barros, A. P. (2019). Extreme orographic rainfall in the eastern andes tied to cold air intrusions. Front. Environ. Sci. 7. doi:10.3389/fenvs.2019.00101
Emanuel, K. (2020). The relevance of theory for contemporary research in atmospheres, oceans, and climate. AGU Adv. 1 (2), e2019AV000129. doi:10.1029/2019av000129
Escobar, M., Hoyos, I., Nieto, R., and Villegas, J. C. (2022). The importance of continental evaporation for precipitation in Colombia: a baseline combining observations from stable isotopes and modelling moisture trajectories. Hydrol. Process. 36 (6), e14595. doi:10.1002/hyp.14595
Espinoza, J. C., Chavez, S., Ronchail, J., Junquas, C., Takahashi, K., and Lavado, W. (2015). Rainfall hotspots over the southern tropical Andes: spatial distribution, rainfall intensity, and relations with large-scale atmospheric circulation. Water Resour. Res. 51 (5), 3459–3475. doi:10.1002/2014wr016273
Espinoza, J. C., Garreaud, R., Poveda, G., Arias, P. A., Molina-Carpio, J., Masiokas, M., et al. (2020). Hydroclimate of the Andes Part I: main climatic features. Front. Earth Sci. 8, 64. doi:10.3389/feart.2020.00064
Eyring, V., Cox, P. M., Flato, G. M., Gleckler, P. J., Abramowitz, G., Caldwell, P., et al. (2019). Taking climate model evaluation to the next level. Nat. Clim. Change 9 (2), 102–110. doi:10.1038/s41558-018-0355-y
Fassoni-Andrade, A. C., Fleischmann, A. S., Papa, F., Paiva, R. C. D. D., Wongchuig, S., Melack, J. M., et al. (2021). Amazon hydrology from space: scientific advances and future challenges. Rev. Geophys. 59 (4), e2020RG000728. doi:10.1029/2020RG000728
Falco, M., Carril, A. F., Li, L. Z. X., Cabrelli, C., and Menéndez, C. G. (2020). The potential added value of Regional Climate Models in South America using a multiresolution approach. Clim. Dyn. 54, 1553–1569. doi:10.1007/s00382-019-05073-9
Flores Rojas, J. L., Moya-Alvarez, A. S., Kumar, S., Martínez-Castro, D., Villalobos-Puma, E., and Silva-Vidal, Y. (2019). Analysis of possible triggering mechanisms of severe thunderstorms in the tropical central Andes of Peru. Mantaro Val. Atmos. 10 (6), 301. doi:10.3390/atmos10060301
Flores-Rojas, J. L., Moya-Álvarez, A. S., Valdivia-Prado, J. M., Piñas-Laura, M., Kumar, S., Abi Karam, H., et al. (2021). On the dynamic mechanisms of intense rainfall events in the central Andes of Peru, Mantaro valley. Atmos. Res. 248, 105188. doi:10.1016/j.atmosres.2020.105188
Fritts, D. C., Lund, A. C., Lund, T. S., and Yudin, V. (2022). Impacts of limited model resolution on the representation of mountain wave and secondary gravity wave dynamics in local and global models. 1: mountain Waves in the stratosphere and mesosphere. J. Geophys. Res. Atmos. 127 (9), e2021JD035990. doi:10.1029/2021jd035990
Fritts, D. C., Lund, T. S., Wan, K., and Liu, H. L. (2021). Numerical simulation of mountain waves over the southern Andes. Part II: momentum fluxes and wave–mean-flow interactions. J. Atmos. Sci. 78 (10), 3069–3088. doi:10.1175/jas-d-20-0207.1
García-Díez, M., Fernández, J., and Vautard, R. (2015). An RCM multi-physics ensemble over Europe: Multi-variable evaluation to avoid error compensation. Clim. Dyn. 45 (11–12), 3141–3156. doi:10.1007/s00382-015-2529-x
Garreaud, R. (1999). Multiscale analysis of the summertime precipitation over the central Andes. Mon. Weather Rev. 127 (5), 901–921. doi:10.1175/1520-0493(1999)127<0901:maotsp>2.0.co;2
Garreaud, R., Falvey, M., and Montecinos, A. (2016). Orographic precipitation in coastal southern Chile: mean distribution, temporal variability, and linear contribution. J. Hydrometeorol. 17 (4), 1185–1202. doi:10.1175/jhm-d-15-0170.1
Garreaud, R., and Fuenzalida, H. A. (2007). The influence of the Andes on cutoff lows: a modeling study. Mon. Weather Rev. 135 (4), 1596–1613. doi:10.1175/mwr3350.1
Garreaud, R. D., Jacques-Coper, M., Marín, J. C., and Narváez, D. A. (2024). Atmospheric Rivers in South-Central Chile: Zonal and Tilted Events. Atmosphere (4) 15, 406. doi:10.3390/atmos15040406
Garreaud, R., and Wallace, J. M. (1998). Summertime incursions of midlatitude air into subtropical and tropical South America. Mon. Weather Rev. 126 (10), 2713–2733. doi:10.1175/1520-0493(1998)126<2713:siomai>2.0.co;2
Garreaud, R. D., Lopez, P., Minvielle, M., and Rojas, M. (2013). Large-scale control on the Patagonian climate. J. Clim. 26, 215–230. doi:10.1175/jcli-d-12-00001.1
Garreaud, R. D., Molina, A., and Farias, M. (2010). Andean uplift, ocean cooling and Atacama hyperaridity: a climate modeling perspective. Earth Planet. Sci. Lett. 292 (1-2), 39–50. doi:10.1016/j.epsl.2010.01.017
Gimeno, L., Stohl, A., Trigo, R. M., Dominguez, F., Yoshimura, K., Yu, L., et al. (2012). Oceanic and terrestrial sources of continental precipitation. Rev. Geophys. 50 (4). doi:10.1029/2012rg000389
Giovannettone, J. P., and Barros, A. P. (2009). Probing regional orographic controls of precipitation and cloudiness in the central Andes using satellite data. J. Hydrometeor 10, 167–182. doi:10.1175/2008jhm973.1
Gómez-Rios, S., Zuluaga, M. D., and Hoyos, C. D. (2023). Orographic controls over convection in an inter-Andean valley in northern SouthSouth America. Mon. Weather Rev. 151 (1), 145–162. doi:10.1175/mwr-d-21-0231.1
González, C. M., Ynoue, R. Y., Vara-Vela, A., Rojas, N. Y., and Aristizábal, B. H. (2018). High-resolution air quality modeling in a medium-sized city in the tropical Andes: assessment of local and global emissions in understanding ozone and PM10 dynamics. Atmos. Pollut. Res. 9 (5), 934–948. doi:10.1016/j.apr.2018.03.003
González-Rojí, S. J., Messmer, M., Raible, C. C., and Stocker, T. F. (2022). Sensitivity of precipitation in the highlands and lowlands of Peru to physics parameterization options in WRFV3.8.1. Geosci. Model Dev. 15, 2859–2879. doi:10.5194/gmd-15-2859-2022
Gutierrez, R. A., Junquas, C., Armijos, E., Sörensson, A. A., and Espinoza, J.-C. (2024). Performance of regional climate model precipitation simulations over the terrain-complex Andes-Amazon transition region. J. Geophys. Res. Atmos. 129, e2023JD038618. doi:10.1029/2023JD038618
Halladay, K., Kahana, R., Berthou, S., and Kendon, E. (2022). Convection-permitting climate simulations for South America: a land-surface perspective (with insights from Africa and Europe). Available at: https://www.cima.fcen.uba.ar/cpcmw2022/Posters/P4-2_KateHalladay.pdf.
Halladay, K., Kahana, R., Johnson, B., Still, C., Fosser, G., and Alves, L. (2023). Convection-permitting climate simulations for South America with the met office unified model. Clim. Dyn. doi:10.1007/s00382-023-06853-0
Henao, J. J., Mejía, J. F., Rendón, A. M., and Salazar, J. F. (2020). Sub-kilometer dispersion simulation of a CO tracer for an inter-Andean urban valley. Atmos. Pollut. Res. 11 (5), 928–945. doi:10.1016/j.apr.2020.02.005
Heredia, M. B., Junquas, C., Prieur, C., and Condom, T. (2018). New statistical methods for precipitation bias correction applied to WRF model simulations in the Antisana region, Ecuador. J. Hydrometeorol. 19 (12), 2021–2040. doi:10.1175/jhm-d-18-0032.1
Hierro, R., Steiner, A. K., Torre, A. D. L., Alexander, P., Llamedo, P., and Cremades, P. (2018). Orographic and convective gravity waves above the Alps and Andes Mountains during GPS radio occultation events–a case study. Atmos. Meas. Tech. 11 (6), 3523–3539. doi:10.5194/amt-11-3523-2018
Hodnebrog, Ø., Steensen, B. M., Marelle, L., Alterskjaer, K., Dalsøren, S. B., and Myhre, G. (2021). Understanding model diversity in future precipitation projections for South America. Clim. Dyn. 58, 1329–1347. doi:10.1007/s00382-021-05964-w
Hoyos, C. D., Ceballos, L. I., Pérez-Carrasquilla, J. S., Sepúlveda, J., López-Zapata, S. M., Zuluaga, M. D., et al. (2019). Meteorological conditions leading to the 2015 Salgar flash flood: lessons for vulnerable regions in tropical complex terrain. Nat. Hazards Earth Syst. Sci. 19 (11), 2635–2665. doi:10.5194/nhess-19-2635-2019
Hoyos, I., Dominguez, F., Cañón-Barriga, J., Martínez, J. A., Nieto, R., Gimeno, L., et al. (2018). Moisture origin and transport processes in Colombia, northern South America. Clim. Dyn. 50, 971–990. doi:10.1007/s00382-017-3653-6
Huerta, A., Lavado-Casimiro, W., and Felipe-Obando, O. (2022). High-resolution gridded hourly precipitation dataset for Peru (PISCOp_h). Data Brief 45, 108570. doi:10.1016/j.dib.2022.108570
Insel, N., Poulsen, C. J., and Ehlers, T. A. (2010). Influence of the Andes Mountains on South American moisture transport, convection, and precipitation. Clim. Dyn. 35, 1477–1492. doi:10.1007/s00382-009-0637-1
Jiménez-Sánchez, G., Markowski, P. M., Jewtoukoff, V., Young, G. S., and Stensrud, D. J. (2019). The Orinoco low-level jet: an investigation of its characteristics and evolution using the WRF model. J. Geophys. Res. Atmos. 124 (20), 10696–10711. doi:10.1029/2019jd030934
Jiménez-Sánchez, G., Markowski, P. M., Young, G. S., and Stensrud, D. J. (2020). The Orinoco low-level jet: an investigation of its mechanisms of formation using the WRF model. J. Geophys. Res. Atmos. 125 (13), e2020JD032810. doi:10.1029/2020jd032810
Jones, C. (2019). Recent changes in the South America low-level jet. npj Clim. Atmos. Sci. 2 (1), 20–28. doi:10.1038/s41612-019-0077-5
Junquas, C., Heredia, M. B., Condom, T., Ruiz-Hernández, J. C., Campozano, L., Dudhia, J., et al. (2022). Regional climate modeling of the diurnal cycle of precipitation and associated atmospheric circulation patterns over an Andean glacier region (Antisana, Ecuador). Clim. Dyn. 58, 3075–3104. doi:10.1007/s00382-021-06079-y
Junquas, C., Li, L., Vera, C. S., Le Treut, H., and Takahashi, K. (2016). Influence of SouthSouth America orography on summertime precipitation in southeastern SouthSouth America. Clim. Dyn. 46 (11), 3941–3963. doi:10.1007/s00382-015-2814-8
Junquas, C., Martinez, J. A., Bozkurt, D., Viale, M., Fita, L., Trachte, K., et al. (2024). Recent progress in atmospheric modeling over the Andes -Part II: Projected changes and modeling challenges. Front. Earth Sci. 12. doi:10.3389/feart.2024.142783
Junquas, C., Takahashi, K., Condom, T., Espinoza, J. C., Chávez, S., Sicart, J. E., et al. (2018). Understanding the influence of orography on the precipitation diurnal cycle and the associated atmospheric processes in the central Andes. Clim. Dyn. 50 (11), 3995–4017. doi:10.1007/s00382-017-3858-8
Kalnay, E., Mo, K. C., and Paegle, J. (1986). Large-amplitude, short-scale stationary Rossby waves in the Southern Hemisphere: observations and mechanistic experiments to determine their origin. J. Atmos. Sci. 43 (3), 252–275. doi:10.1175/1520-0469(1986)043<0252:lasssr>2.0.co;2
Katragkou, E., García-Díez, M., Vautard, R., Sobolowski, S., Zanis, P., Alexandri, G., et al. (2015). Regional climate hindcast simulations within EURO-CORDEX: Evaluation of a WRF multi-physics ensemble. Geosci. Model Dev. 8, 603–618. doi:10.5194/gmd-8-603-2015
LaBar, R. J., Douglas, M., Murillo, J., and Mejia, J. F. (2005). The llanos low-level jet and its association with Venezuelan convective precipitation. National weather center research experiences for undergraduates final project. Central Washington University.
Lange, S., Rockel, B., Volkholz, J., and Bookhagen, B. (2015). Regional climate model sensitivities to parametrizations of convection and non-precipitating subgrid-scale clouds over South America. Clim. Dyn. 44 (9), 2839–2857. doi:10.1007/s00382-014-2199-0
Lapere, R., Mailler, S., and Menut, L. (2021). The 2017 mega-fires in central Chile: impacts on regional atmospheric composition and meteorology assessed from satellite data and chemistry-transport modeling. Atmosphere 12 (3), 344. doi:10.3390/atmos12030344
Laraque, A., Ronchail, J., Cochonneau, G., Pombosa, R., and Guyot, J. L. (2007). Heterogeneous distribution of rainfall and discharge regimes in the Ecuadorian Amazon basin. J. Hydrometeorol. 8 (6), 1364–1381. doi:10.1175/2007JHM784.1
Lenaerts, J. T., Van Den Broeke, M. R., van Wessem, J. M., van de Berg, W. J., van Meijgaard, E., van Ulft, L. H., et al. (2014). Extreme precipitation and climate gradients in Patagonia revealed by high-resolution regional atmospheric climate modeling. J. Clim. 27 (12), 4607–4621. doi:10.1175/jcli-d-13-00579.1
Lenters, J. D., and Cook, K. H. (1995). Simulation and diagnosis of the regional summertime precipitation climatology of South America. J. Clim. 8 (12), 2988–3005. doi:10.1175/1520-0442(1995)008<2988:sadotr>2.0.co;2
Lenters, J. D., and Cook, K. H. (1997). On the origin of the Bolivian high and related circulation features of the South American climate. J. Atmos. Sci. 54 (5), 656–678. doi:10.1175/1520-0469(1997)054<0656:otootb>2.0.co;2
Llopart, M., Simões Reboita, M., and Porfírio da Rocha, R. (2020). Assessment of multi-model climate projections of water resources over South America CORDEX domain. Clim. Dyn. (54) 1, 99–116. doi:10.1007/s00382-019-04990-z
López, M. E., and Howell, W. E. (1967). Katabatic winds in the equatorial Andes. J. Atmos. Sci. 24 (1), 29–35. doi:10.1175/1520-0469(1967)024<0029:kwitea>2.0.co;2
Lucas-Picher, P., Argüeso, D., Brisson, E., Tramblay, Y., Berg, P., Lemonsu, A., et al. (2021). Convection-permitting modeling with regional climate models: latest developments and next steps. Wiley Interdiscip. Rev. Clim. Change 12 (6), e731. doi:10.1002/wcc.731
Lund, T. S., Fritts, D. C., Wan, K., Laughman, B., and Liu, H. L. (2020). Numerical simulation of mountain waves over the southern Andes. Part I: mountain wave and secondary wave character, evolutions, and breaking. J. Atmos. Sci. 77 (12), 4337–4356. doi:10.1175/jas-d-19-0356.1
Mapes, B. E., Warner, T. T., and Xu, M. (2003). Diurnal patterns of rainfall in northwestern South America. Part III: diurnal gravity waves and nocturnal convection offshore. Mon. weather Rev. 131 (5), 830–844. doi:10.1175/1520-0493(2003)131<0830:dporin>2.0.co;2
Marín, J. C., Barrett, B. S., and Pozo, D. (2021). The tornadoes of 30–31 May 2019 in south-Central Chile: sensitivity to topography and SST. Atmos. Res. 249, 105301. doi:10.1016/j.atmosres.2020.105301
Martinez, J. A., Arias, P. A., Castro, C., Chang, H. I., and Ochoa-Moya, C. A. (2019). Sea surface temperature-related response of precipitation in northern South America according to a WRF multi-decadal simulation. Int. J. Climatol. 39 (4), 2136–2155. doi:10.1002/joc.5940
Martinez, J. A., Arias, P. A., Dominguez, F., and Prein, A. F. (2024a). Mesoscale structures in the Orinoco basin during an extreme precipitation event in the tropical Andes. Front. Earth Sci. 11, 1307549. doi:10.3389/feart.2023.1307549
Martinez, J. A., Arias, P. A., Junquas, C., Espinoza, J. C., Condom, T., Dominguez, F., et al. (2022). The Orinoco low-level jet and the cross-equatorial moisture transport over tropical SouthSouth America: lessons from seasonal WRF simulations. J. Geophys. Res. Atmos. 127, e2021JD035603. doi:10.1029/2021jd035603
Martinez, J. A., and Dominguez, F. (2014). Sources of atmospheric moisture for the La Plata River basin. J. Clim. 27 (17), 6737–6753. doi:10.1175/jcli-d-14-00022.1
Martínez, J. A., Rendón, M. L., Buriticá-Ruíz, L. F., Giraldo-Cárdenas, S., and Arias, P. A. (2024b). Pronóstico de la precipitación en los Andes tropicales: lecciones de las simulaciones de convección permitida. Rev. Acad. Colomb. Ciencias Exactas, Físicas Nat. Available at: https://raccefyn.co/index.php/raccefyn/article/view/1965doi:10.18257/raccefyn.1965
Martínez-Castro, D., Kumar, S., Flores Rojas, J. L., Moya-Álvarez, A., Valdivia-Prado, J. M., Villalobos-Puma, E., et al. (2019). The impact of microphysics parameterization in the simulation of two convective rainfall events over the central Andes of Peru using WRF-ARW. Atmosphere 10 (8), 442. doi:10.3390/atmos10080442
Mass, C. F., Ovens, D., Westrick, K., and Colle, B. A. (2002). Does increasing horizontal resolution produce more skillful forecasts? the results of two years of real-time numerical weather prediction over the pacific northwest. Bull. Am. Meteorological Soc. 83 (3), 407–430. doi:10.1175/1520-0477(2002)083<0407:dihrpm>2.3.co;2
Mejía, F., and Douglas, M. (2006). Flow around the andean elbow from WRF simulations and P-3 aircraft measurements during the SALLJEX. Proc. 8 ICSHMO, Foz de Iguaçu, Braz. INPE, 795–802. Available at: http://mtc-m16b.sid.inpe.br/col/cptec.inpe.br/adm_conf/2005/10.31.22.08/doc/795-802.pdf
Mejía, J. F., Yepes, J., Henao, J. J., Poveda, G., Zuluaga, M. D., Raymond, D. J., et al. (2021). Towards a mechanistic understanding of precipitation over the far eastern tropical Pacific and western Colombia, one of the rainiest spots on Earth. J. Geophys. Res. Atmos. 126 (5), e2020JD033415. doi:10.1029/2020jd033415
Monaghan, A. J., Rife, D. L., Pinto, J. O., Davis, C. A., and Hannan, J. R. (2010). Global precipitation extremes associated with diurnally varying low-level jets. J. Clim. 23 (19), 5065–5084. doi:10.1175/2010jcli3515.1
Montecinos, A., Muñoz, R. C., Oviedo, S., Martínez, A., and Villagrán, V. (2017). Climatological characterization of puelche winds down the western slope of the extratropical Andes Mountains using the NCEP Climate Forecast System Reanalysis. J. Appl. Meteorology Climatol. 56 (3), 677–696. doi:10.1175/JAMC-D-16-0289.1
Montini, T. L., Jones, C., and Carvalho, L. M. (2019). The South American low-level jet: a new climatology, variability, and changes. J. Geophys. Res. Atmos. 124 (3), 1200–1218. doi:10.1029/2018jd029634
Morales, J. S., Arias, P. A., Martínez, J. A., and Durán-Quesada, A. M. (2021). The role of low-level circulation on water vapour transport to central and northern South America: insights from a 2D Lagrangian approach. Int. J. Climatol. 41, E2662–E2682. doi:10.1002/joc.6873
Mourre, L., Condom, T., Junquas, C., Lebel, T., E Sicart, J., Figueroa, R., et al. (2016). Spatio-temporal assessment of WRF, TRMM and in situ precipitation data in a tropical mountain environment (Cordillera Blanca, Peru). Hydrology Earth Syst. Sci. 20 (1), 125–141. doi:10.5194/hess-20-125-2016
Moya-Álvarez, A. S., Estevan, R., Kumar, S., Rojas, J. L. F., Ticse, J. J., Martínez-Castro, D., et al. (2020). Influence of PBL parameterization schemes in WRF_ARW model on short-range precipitation’s forecasts in the complex orography of Peruvian Central Andes. Atmos. Res. 233, 104708. doi:10.1016/j.atmosres.2019.104708
Moya-Álvarez, A. S., Gálvez, J., Holguín, A., Estevan, R., Kumar, S., Villalobos, E., et al. (2018b). Extreme rainfall forecast with the WRF-ARW model in the Central Andes of Peru. Atmosphere 9 (9), 362. doi:10.3390/atmos9090362
Moya-Álvarez, A. S., Martínez-Castro, D., Flores, J. L., and Silva, Y. (2018a). Sensitivity study on the influence of parameterization schemes in WRF_ARW model on short-and medium-range precipitation forecasts in the Central Andes of Peru. Adv. Meteorology 2018, 1–16. doi:10.1155/2018/1381092
Muñoz, R. C., Falvey, M. J., Arancibia, M., Astudillo, V. I., Elgueta, J., Ibarra, M., et al. (2018). Wind energy exploration over the atacama desert: a numerical model–guided observational program. Bull. Amer. Meteor. Soc. 99, 2079–2092. doi:10.1175/BAMS-D-17-0019.1
Nieto, R., Gallego, D., Trigo, R., Ribera, P., and Gimeno, L. (2008). Dynamic identification of moisture sources in the Orinoco basin in equatorial South America. Hydrological Sci. J. 53 (3), 602–617. doi:10.1623/hysj.53.3.602
Nogués-Paegle, J., Berbery, E. H., Collini, E. A., and Saulo, C. (2006). “An evaluation of the Eta model during SALLJEX,” in Proc. Eighth int. Conf. On southern hemisphere meteorology and oceanography, 51–56.
Norte, F. A. (2015). Understanding and forecasting Zonda wind (Andean foehn) in Argentina: a review. Atmos. Clim. Sci. 5, 163–193. doi:10.4236/acs.2015.53012
Ochoa, A., Campozano, L., Sanchez, E., Gualan, R., and Samaniego, E. (2016). Evaluation of downscaled estimates of monthly temperature and precipitation for a Southern Ecuador case study. Int. J. Climatol. 36 (3), 1244–1255. doi:10.1002/joc.4418
Ochoa, A., Pineda, L., Crespo, P., and Willems, P. (2014). Evaluation of TRMM 3B42 precipitation estimates and WRF retrospective precipitation simulation over the Pacific-Andean region of Ecuador and Peru. Hydrol. Earth Syst. Sci. 18 (8), 3179–3193. doi:10.5194/hess-18-3179-2014
Oglesby, R., Rowe, C., Grunwaldt, A., Ferreira, I., Ruiz, F., Campbell, J., et al. (2016). A high-resolution modeling strategy to assess impacts of climate change for Mesoamerica and the Caribbean. Am. J. Clim. Change 5 (2), 202–228. doi:10.4236/ajcc.2016.52019
Orlanski, I. S. I. D. O. R. O., Katzfey, J., Menendez, C., and Marino, M. (1991). Simulation of an extratropical cyclone in the Southern Hemisphere: Model sensitivity. J. Atmos. Sci. 48 (21), 2293–2312. doi:10.1175/1520-0469(1991)048<2293:SOAECI<2.0.CO;2
Ortega, G., Arias, P. A., Villegas, J. C., Marquet, P. A., and Nobre, P. (2021). Present-day and future climate over central and South America according to CMIP5/CMIP6 models. Int. J. Climatol. 41 (15), 6713–6735. doi:10.1002/joc.7221
Pabón-Caicedo, J. D., Arias, P. A., Carril, A. F., Espinoza, J. C., Borrel, L. F., Goubanova, K., et al. (2020). Observed and projected hydroclimate changes in the Andes. Front. Earth Sci. 8, 61. doi:10.3389/feart.2020.00061
Palmer, T., and Stevens, B. (2019). The scientific challenge of understanding and estimating climate change. Proc. Natl. Acad. Sci. 116 (49), 24390–24395. doi:10.1073/pnas.1906691116
Posada-Marín, J. A., Rendón, A. M., Salazar, J. F., Mejía, J. F., and Villegas, J. C. (2019). WRF downscaling improves ERA-Interim representation of precipitation around a tropical Andean valley during El Niño: implications for GCM-scale simulation of precipitation over complex terrain. Clim. Dyn. 52 (5), 3609–3629. doi:10.1007/s00382-018-4403-0
Poveda, G., Espinoza, J. C., Zuluaga, M. D., Solman, S. A., Garreaud, R., and van Oevelen, P. J. (2020). High impact weather events in the Andes. Front. Earth Sci. 8, 162. doi:10.3389/feart.2020.00162
Poveda, G., and Mesa, O. J. (2000). On the existence of Lloró (the rainiest locality on Earth): enhanced ocean-land-atmosphere interaction by a low-level jet. Geophys. Res. Lett. 27 (11), 1675–1678. doi:10.1029/1999gl006091
Poveda, G., Mesa, O. J., Salazar, L. F., Arias, P. A., Moreno, H. A., Vieira, S. C., et al. (2005). The diurnal cycle of precipitation in the tropical Andes of Colombia. Mon. Weather Rev. 133 (1), 228–240. doi:10.1175/mwr-2853.1
Pozo, D., Marín, J. C., Illanes, L., Curé, M., and Rabanus, D. (2016). Validation of WRF forecasts for the Chajnantor region. Mon. Notices R. Astronomical Soc. 459 (11), 419–426. doi:10.1093/mnras/stw600
Prein, A. F., Langhans, W., Fosser, G., Ferrone, A., Ban, N., Goergen, K., et al. (2015). A review on regional convection-permitting climate modeling: demonstrations, prospects, and challenges. Rev. Geophys. 53 (2), 323–361. doi:10.1002/2014rg000475
Puliafito, S. E., Allende, D. G., Mulena, C. G., Cremades, P., and Lakkis, S. G. (2015). Evaluation of the WRF model configuration for Zonda wind events in a complex terrain. Atmos. Res. 166, 24–32. doi:10.1016/j.atmosres.2015.06.011
Rasmussen, K. L., and Houze Jr, R. A. (2016). Convective initiation near the Andes in subtropical South America. Mon. Weather Rev. 144 (6), 2351–2374. doi:10.1175/mwr-d-15-0058.1
Reuder, J., and Egger, J. (2006). Diurnal circulation of the South American Altiplano: observations in a valley and at a pass. Tellus A 58, 254–262. doi:10.3402/tellusa.v58i2.14763
Rife, D. L., Pinto, J. O., Monaghan, A. J., Davis, C. A., and Hannan, J. R. (2010). Global distribution and characteristics of diurnally varying low-level jets. J. Clim. 23 (19), 5041–5064. doi:10.1175/2010jcli3514.1
Rocque, M. N., and Rasmussen, K. L. (2022). The impact of topography on the environment and life cycle of weakly and strongly forced MCSs during RELAMPAGO. Mon. Weather Rev. 150 (9), 2317–2338. doi:10.1175/mwr-d-22-0049.1
Rogelis, M. C., and Werner, M. (2018). Streamflow forecasts from WRF precipitation for flood early warning in mountain tropical areas. Hydrology Earth Syst. Sci. 22 (1), 853–870. doi:10.5194/hess-22-853-2018
Rojas, M. (2006). Multiply nested regional climate simulation for southern South America: sensitivity to model resolution. Mon. Weather Rev. 134, 2208–2223. doi:10.1175/MWR3167.1
Romatschke, U., and Houze, R. A. (2010). Extreme summer convection in South America. J. Clim. 23, 3761–3791. doi:10.1175/2010jcli3465.1
Rosales, A. G., Junquas, C., da Rocha, R. P., Condom, T., and Espinoza, J. C. (2022). Valley–Mountain circulation associated with the diurnal cycle of precipitation in the tropical andes (Santa river basin, Peru). Atmosphere 13, 344. doi:10.3390/atmos13020344
Roussel, M. L., Lemonnier, F., Genthon, C., and Krinner, G. (2020). Brief communication: evaluating antarctic precipitation in ERA5 and CMIP6 against CloudSat observations. Cryosphere 14, 2715–2727. doi:10.5194/tc-14-2715-2020
SAAG (2022). Historical and future hydroclimate of SouthSouth America: what we can learn from convection-permitting simulations. GEWEX Q. Quart. I. Available at: https://www.gewex.org/gewex-content/files_mf/1650030967Q12022.pdf
Saha, S., Moorthi, S., Pan, H. L., Wu, X., Wang, J., Nadiga, S., et al. (2010). The NCEP climate forecast system reanalysis. Bull. Am. Meteorological Soc. 91 (8), 1015–1058. doi:10.1175/2010bams3001.1
Sakamoto, M. S., Ambrizzi, T., and Poveda, G. (2011). Moisture sources and life cycle of convective systems over western Colombia. Adv. Meteorology 2011, 1–11. doi:10.1155/2011/890759
Salio, P., Nicolini, M., and Zipser, E. J. (2007). Mesoscale convective systems over southeastern South America and their relationship with the South American low-level jet. Mon. Weather Rev. 135 (4), 1290–1309. doi:10.1175/mwr3305.1
Sandu, I., van Niekerk, A., Shepherd, T. G., Vosper, S. B., Zadra, A., Bacmeister, J., et al. (2019). Impacts of orography on large-scale atmospheric circulation. NPJ Clim. Atmos. Sci. 2 (1), 10. doi:10.1038/s41612-019-0065-9
Sasaki, C. R., Rowe, A. K., McMurdie, L. A., and Rasmussen, K. L. (2022). New insights into the South American low-level jet from RELAMPAGO observations. Mon. Weather Rev. 150 (6), 1247–1271. doi:10.1175/mwr-d-21-0161.1
Saurral, R. I., Camilloni, I. A., and Ambrizzi, T. (2015). Links between topography, moisture fluxes pathways and precipitation over South America. Clim. Dyn. 45 (3), 777–789. doi:10.1007/s00382-014-2309-z
Sauter, T. (2020). Revisiting extreme precipitation amounts over southern South America and implications for the Patagonian Icefields. Hydrol. Earth Syst. Sci. 24, 2003–2016. doi:10.5194/hess-24-2003-2020
Scaff, L., Rutllant, J. A., Rahn, D., Gascoin, S., and Rondanelli, R. (2017). Meteorological interpretation of orographic precipitation gradients along an andes west slope basin at 30°S (Elqui valley, Chile). J. Hydrometeorol. 18 (3), 713–727. doi:10.1175/jhm-d-16-0073.1
Schaefer, M., Machguth, H., Falvey, M., and Casassa, G. (2013). Modeling past and future surface mass balance of the Northern Patagonia Icefield. J. Geophys. Res. Earth Surf. 118 (2), 571–588. (This reference is missing in the paper). doi:10.1002/jgrf.20038
Schumacher, V., Alfonso, F., Flavio, J., and Alcimoni, C. (2020). WRF high resolution dynamical downscaling of precipitation for the central andes of Chile and Argentina. Front. Earth Sci. 8. doi:10.3389/feart.2020.00328
Schwikowski, M., Schläppi, M., Santibañez, P., Rivera, A., and Casassa, G. (2013). Net accumulation rates derived from ice core stable isotope records of Pío XI glacier, Southern Patagonia Icefield. Cryosphere 7, 1635–1644. doi:10.5194/tc-7-1635-2013
Seluchi, M. E., Garreaud, R., Norte, F. A., and Saulo, A. C. (2006). Influence of the subtropical Andes on baroclinic disturbances: a cold front case study. Mon. Weather Rev. 134 (11), 3317–3335. doi:10.1175/mwr3247.1
Seluchi, M. E., Norte, F. A., Satyamurty, P., and Chou, S. C. (2003). Analysis of three situations of the foehn effect over the Andes (zonda wind) using the Eta–CPTEC regional model. Weather Forecast. 18 (3), 481–501. doi:10.1175/1520-0434(2003)18<481:aotsot>2.0.co;2
Shaw, T., Arias, P. A., Collins, M., Coumou, D., Diedhiou, A., Garfinkel, C., et al. (2023). Regional Climate Change: consensus, discrepancies, and ways forward. Front. Clim. 6, 1391634. doi:10.3389/fclim.2024.1391634
Sierra, J. P., Arias, P. A., Durán-Quesada, A. M., Tapias, K. A., Vieira, S. C., and Martínez, J. A. (2021a). The Choco low-level jet: past, present and future. Clim. Dyn. 56, 2667–2692. doi:10.1007/s00382-020-05611-w
Sierra, J. P., Arias, P. A., and Vieira, S. C. (2015). Precipitation over northern South America and its seasonal variability as simulated by the CMIP5 models. Adv. Meteorology 2015, 1–22. doi:10.1155/2015/634720
Sierra, J. P., Arias, P. A., Vieira, S. C., and Agudelo, J. (2018). How well do CMIP5 models simulate the low-level jet in western Colombia? Clim. Dyn. 51, 2247–2265. doi:10.1007/s00382-017-4010-5
Sierra, J. P., Junquas, C., Espinoza, J. C., Segura, H., Condom, T., Andrade, M., et al. (2021b). Deforestation impacts on Amazon-Andes hydroclimatic connectivity. Clim. Dyn. 58, 2609–2636. doi:10.1007/s00382-021-06025-y
Silva, G. A. M., Ambrizzi, T., and Marengo, J. A. (2009). Observational evidences on the modulation of the South American low level jet east of the andes according the ENSO variability. Ann. Geophys. 27 (2), 645–657. Göttingen, Germany: Copernicus Publications. doi:10.5194/angeo-27-645-2009
Smith, R. B. (2019). 100 years of progress on mountain meteorology research. Meteorol. Monogr. 59, 20.1–20.73. doi:10.1175/amsmonographs-d-18-0022.1
Solman, S. A. (2013). Regional climate modeling over South America: a review. Adv. Meteorology 2013, 1–13. doi:10.1155/2013/504357
Solman, S. A., Sanchez, E., Samuelsson, P., da Rocha, R. P., Li, L., Marengo, J., et al. (2013). Evaluation of an ensemble of regional climate model simulations over South America driven by the ERA-Interim reanalysis: model performance and uncertainties. Clim. Dyn. 41, 1139–1157. doi:10.1007/s00382-013-1667-2
Somos-Valenzuela, M., and Manquehue-Cheque, F. (2020). Evaluating multiple WRF configurations and forcing over the northern patagonian icecap (NPI) and baker river basin. Atmosphere 11, 815. doi:10.3390/atmos11080815
Stegehuis, A., Vautard, R., Ciais, P., Teuling, A., Gonzalez Miralles, D., and Wild, M. (2015). An observation-constrained multi-physics WRF ensemble for simulating European mega heat waves. Geosci. Model Dev. 8 (7), 2285–2298. doi:10.5194/gmd-8-2285-2015
Su, F., Duan, X., Chen, D., Hao, Z., and Cuo, L. (2013). Evaluation of the global climate models in the CMIP5 over the Tibetan plateau. J. Clim. 26 (10), 3187–3208. doi:10.1175/jcli-d-12-00321.1
Takahashi, K., and Battisti, D. S. (2007). Processes controlling the mean tropical Pacific precipitation pattern. Part I: the Andes and the eastern Pacific ITCZ. J. Clim. 20 (14), 3434–3451. doi:10.1175/jcli4198.1
Temme, F., Turton, J. V., Mölg, T., and Sauter, T. (2020). Flow regimes and föhn types characterize the local climate of Southern Patagonia. Atmosphere 11 (9), 899. doi:10.3390/atmos11090899
Torma, C., Giorgi, F., and Coppola, E. (2015). Added value of regional climate modeling over areas characterized by complex terrain: precipitation over the Alps. J. Geophys. Res. Atmos. 120 (9), 3957–3972. doi:10.1002/2014JD022781
Torrealba, E. R., and Amador, J. A. (2010). La corriente en chorro de bajo nivel sobre los Llanos Venezolanos de Sur América. Rev. Climatol. 10. Available at: https://rclimatol.eu/archivos/
Torres-Alavez, J. A., Das, S., Corrales-Suastegui, A., Coppola, E., Giorgi, F., Raffaele, F., et al. (2021). Future projections in the climatology of global low-level jets from CORDEX-CORE simulations. Clim. Dyn. 57, 1551–1569. doi:10.1007/s00382-021-05671-6
Torrez-Rodriguez, L., Goubanova, K., Muñoz, C., and Montecinos, A. (2023). Evaluation of temperature and precipitation from CORDEX-CORE South America and Eta-RCM regional climate simulations over the complex terrain of Subtropical Chile. Clim. Dyn. 61, 3195–3221. doi:10.1007/s00382-023-06730-w
Trachte, K. (2018). Atmospheric moisture pathways to the highlands of the tropical Andes: analyzing the effects of spectral nudging on different driving fields for regional climate modeling. Atmosphere 9 (11), 456. doi:10.3390/atmos9110456
Trachte, K., and Bendix, J. (2012). Katabatic flows and their relation to the formation of convective clouds—idealized case studies. J. Appl. meteorology Climatol. 51 (8), 1531–1546. doi:10.1175/jamc-d-11-0184.1
Trachte, K., Nauss, T., and Bendix, J. (2010a). The impact of different terrain configurations on the formation and dynamics of katabatic flows: Idealised case studies. Boundary-layer Meteorol. 134 (2), 307–325. doi:10.1007/s10546-009-9445-8
Trachte, K., Rollenbeck, R., and Bendix, J. (2010b). Nocturnal convective cloud formation under clear-sky conditions at the eastern Andes of south Ecuador. J. Geophys. Res. Atmos. 115 (D24). doi:10.1029/2010jd014146
Trachte, K., Seidel, J., Figueroa, R., Otto, M., and Bendix, J. (2018). Cross-Scale precipitation variability in a semiarid catchment area on the western slopes of the central Andes. J. Appl. Meteorol. Climatol. 57 (3), 675–694. doi:10.1175/jamc-d-17-0207.1
Urrego-Ortiz, J., Martínez, J. A., Arias, P. A., and Jaramillo-Duque, Á. (2019). Assessment and day-ahead forecasting of hourly solar radiation in medellín, Colombia. Energies 12 (22), 4402. doi:10.3390/en12224402
Urrutia, R., and Vuille, M. (2009). Climate change projections for the tropical Andes using a regional climate model: temperature and precipitation simulations for the end of the 21st century. J. Geophys. Res. Atmos. 114 (D2). doi:10.1029/2008jd011021
Van der Ent, R. J., Savenije, H. H., Schaefli, B., and Steele-Dunne, S. C. (2010). Origin and fate of atmospheric moisture over continents. Water Resour. Res. 46 (9). doi:10.1029/2010wr009127
Vera, C., Baez, J., Douglas, M., Emmanuel, C. B., Marengo, J., Meitin, J., et al. (2006). The South American low-level jet experiment. Bull. Am. Meteorological Soc. 87 (1), 63–78. doi:10.1175/bams-87-1-63
Viale, M., Bianchi, E., Cara, L., Ruiz, L. E., Villalba, R., Pitte, P., et al. (2019). Contrasting climates at both sides of the Andes in Argentina and Chile. Front. Environ. Sci. 7, 69. doi:10.3389/fenvs.2019.00069
Viale, M., and Garreaud, R. (2015). Orographic effects of the subtropical and extratropical Andes on upwind precipitating clouds. J. Geophys. Res. Atmos. 120 (10), 4962–4974. doi:10.1002/2014jd023014
Viale, M., Houze Jr, R. A., and Rasmussen, K. L. (2013). Upstream orographic enhancement of a narrow cold-frontal rainband approaching the Andes. Mon. weather Rev. 141 (5), 1708–1730. doi:10.1175/mwr-d-12-00138.1
Viale, M., and Norte, F. A. (2009). Strong cross-barrier flow under stable conditions producing intense winter orographic precipitation: a case study over the subtropical central andes. Wea. Forecast. 24, 1009–1031. doi:10.1175/2009WAF2222168.1
Viale, M., and Nuñez, M. N. (2011). Climatology of winter orographic precipitation over the subtropical central Andes and associated synoptic and regional characteristics. J. Hydrometeorol. 12 (4), 481–507. doi:10.1175/2010jhm1284.1
Villarroel, C., Carrasco, J., Casassa, G., and Falvey, M. (2013). Modeling near-surface air temperature and precipitation using WRF with 5-km resolution in the northern Patagonia icefield: a pilot simulation. Int. J. Geosciences 4 (8), 1193–1199. doi:10.4236/ijg.2013.48113
Walsh, K. (1994). On the influence of the Andes on the general circulation of the Southern Hemisphere. J. Clim. 7 (6), 1019–1025. doi:10.1175/1520-0442(1994)007<1019:otiota>2.0.co;2
Warner, T. T., Mapes, B. E., and Xu, M. (2003). Diurnal patterns of rainfall in northwestern South America. Part II: model simulations. Mon. Weather Rev. 131 (5), 813–829. doi:10.1175/1520-0493(2003)131<0813:dporin>2.0.co;2
Xu, W., Lee, J., Fox-Kemper, B., Planton, Y., and McPhaden, M. J. (2022). The andes affect ENSO statistics. J. Clim. 35, 7077–7091. doi:10.1175/JCLI-D-21-0866.1
Xue, M., Droegmeier, K., and Wong, V. (2000). The advanced regional prediction system (arps)-a multi-scale nonhydrostatic atmospheric simulation and prediction model. Part I:model dynamics and verification. Meteorog. Atmos. Phys. 75, 161–193. doi:10.1007/s007030070003
Yáñez-Morroni, G., Gironás, J., Caneo, M., Delgado, R., and Garreaud, R. (2018). Using the weather research and forecasting (WRF) model for precipitation forecasting in an andean region with complex topography. Atmosphere 9, 304. doi:10.3390/atmos9080304
Yepes, J., Mejía, J. F., Mapes, B., and Poveda, G. (2020). Gravity waves and other mechanisms modulating the diurnal precipitation over one of the rainiest spots on Earth: observations and Simulations in 2016. Mon. Weather Rev. 148 (9), 3933–3950. doi:10.1175/mwr-d-19-0405.1
Yepes, J., Poveda, G., Mejía, J. F., Moreno, L., and Rueda, C. (2019). Choco-jex: a research experiment focused on the Chocó low-level jet over the far eastern Pacific and western Colombia. Bull. Am. Meteorological Soc. 100 (5), 779–796. doi:10.1175/bams-d-18-0045.1
Zamuriano-Carbajal, J. M. (2019). Atmospheric circulation during heavy precipitation episodes over the central andes (Doctoral dissertation, Philosophisch-naturwissenschaftliche Fakultät der Universität Bern).
Zängl, G., and Egger, J. (2005). Diurnal circulation of the Bolivian Altiplano. Part II: theoretical and model investigations. Mon. weather Rev. 133 (12), 3624–3643. doi:10.1175/mwr3033.1
Keywords: atmospheric modeling, Andes, complex terrain, mountain hydroclimate, mesoscale meteorology
Citation: Martinez JA, Junquas C, Bozkurt D, Viale M, Fita L, Trachte K, Campozano L, Arias PA, Boisier JP, Condom T, Goubanova K, Pabón-Caicedo JD, Poveda G, Solman SA, Sörensson AA and Espinoza JC (2024) Recent progress in atmospheric modeling over the Andes – part I: review of atmospheric processes. Front. Earth Sci. 12:1427783. doi: 10.3389/feart.2024.1427783
Received: 04 May 2024; Accepted: 14 October 2024;
Published: 11 November 2024.
Edited by:
Masih Eghdami, National Center for Atmospheric Research (UCAR), United StatesReviewed by:
Justin Minder, University at Albany, United StatesXiaoming Sun, Los Alamos National Laboratory (DOE), United States
Copyright © 2024 Martinez, Junquas, Bozkurt, Viale, Fita, Trachte, Campozano, Arias, Boisier, Condom, Goubanova, Pabón-Caicedo, Poveda, Solman, Sörensson and Espinoza. This is an open-access article distributed under the terms of the Creative Commons Attribution License (CC BY). The use, distribution or reproduction in other forums is permitted, provided the original author(s) and the copyright owner(s) are credited and that the original publication in this journal is cited, in accordance with accepted academic practice. No use, distribution or reproduction is permitted which does not comply with these terms.
*Correspondence: J. A. Martinez, am9obi5tYXJ0aW5lekB1ZGVhLmVkdS5jbw==
†These authors have contributed equally to this work and share first authorship