 Tito Arosio1*
 Ulf Büntgen1,2,3
 Kurt Nicolussi4Gina E. Moseley5
 Matthias Saurer6Thomas Pichler4
 M. Paul Smith7
 Emilia Gutierrez8
 Laia Andreu-Hayles9,10,11
 Irka Hajdas12Tatiana Bebchuk1Markus Leuenberger13,14
- 1Department of Geography, University of Cambridge, Cambridge, United Kingdom
- 2Global Change Research Centre (CzechGlobe), Brno, Czechia
- 3Department of Geography, Faculty of Science, Masaryk University, Brno, Czechia
- 4Department of Geography, University of Innsbruck, Innsbruck, Austria
- 5Institute of Geology, University of Innsbruck, Innsbruck, Austria
- 6Swiss Federal Institute for Forest, Snow and Landscape (WSL), Birmensdorf, Switzerland
- 7Oxford University Museum of Natural History, Oxford, United Kingdom
- 8Department of Evolutionary Biology, Ecology and Environmental Sciences, Faculty of Biology, Universitat de Barcelona, Barcelona, Spain
- 9Centre for Ecological Research and Forestry Applications (CREAF), Bellaterra, Barcelona, Spain
- 10Catalan Institution for Research and Advanced Studies (ICREA), Barcelona, Spain
- 11Lamont-Doherty Earth Observatory of Columbia University, Palisades, NY, United States
- 12Laboratory of Ion Beam Physics, ETH Zürich, Zurich, Switzerland
- 13Climate and Environmental Physics, Physics Institute, University of Bern, Bern, Switzerland
- 14Oeschger Centre for Climate Change Research, University of Bern, Bern, Switzerland
Introduction: The Global Meteoric Water Line (GMWL) describes the linear relationship between stable hydrogen (δ2H) and oxygen (δ18O) isotopes in precipitation over large spatial scales and therefore represents a unique reference for water isotopic values. Although trees have the potential to capture the isotopic composition of precipitation, it remains unclear if the GMWL can be reconstructed from tree-ring stable isotopes, since δ18O and δ2H undergo in vivo physiological fractionation.
Methods: We analyze the tree rings δ18O and δ2H values from six regions along a latitudinal gradient from Spain to Greenland.
Results: The data show that the covariance between δ18O and δ2H closely follows the GMWL, which reflects the isotopic signature of large-scale precipitation patterns. We show that changes in regional tree-ring δ18O and δ2H values along wide latitudinal ranges are influenced by the isotopic composition of precipitation with temperature and latitude being the most significant drivers of spatial variation across the studied regions. In contrast, local tree-ring δ18O and δ2H values are mainly controlled by plant physiological fractionation processes that mask the isotopic signature of precipitation.
Conclusion: We conclude that covariance in tree-ring δ18O and δ2H reflects the GMWL at larger spatial scales, but not when evaluating them at individual sites.
Introduction
The isotopic composition of precipitation, represented by stable oxygen (δ18O) and hydrogen (δ2H) isotopes, is influenced by various factors such as temperature, the amount of precipitation, and relative humidity, as well as geographic elements such as latitude, altitude, and distance from the coast (Dansgaard, 1964; Gat, 1996; Bowen et al., 2019). Their relationship is globally defined by the Global Meteoric Water Line (GMWL), which is described by the equation δ2H = 8 δ18O + 10 (Craig, 1961) that primarily reflects the equilibrium fractionation factors between δ2H and δ18O in precipitation. These factors are influenced by evaporation processes (Dansgaard, 1964; Gat, 1996; Bowen et al., 2019) and vary at a local scale, leading to the Local Meteoric Water Lines (LMWL) that usually deviate from the GMWL (Lécuyer et al., 2020; Hatvani et al., 2023).
The GMWL provides a reference for the environmental and climatic interpretation of δ18O and δ2H values in a wide range of paleo proxy archives, including ice cores, speleothems, and lake sediments (Galewsky et al., 2016; Tappa et al., 2016; Pang et al., 2017; Ghadiri et al., 2020). The GMWL has demonstrated remarkable stability through time. Studies of European groundwaters have provided crucial evidence for this consistency, indicating stable atmospheric circulation patterns from the late Pleistocene through the Holocene (Rozanski, 1985).
Stable oxygen and hydrogen isotopes are preserved in the cellulose of living and relict tree rings, and their evaluation is used for climate reconstruction (Hafner et al., 2011; Nakatsuka et al., 2020; Büntgen et al., 2021; Nagavciuc et al., 2022; Xu et al., 2024) and eco-physiological studies (Cherubini et al., 2021; Lehmann et al., 2021; Holloway-Phillips et al., 2023; Vitali et al., 2023). The δ18O and δ2H isotopic values in cellulose, derived from soil water originally sourced from precipitation, are affected by fractionation processes occurring during pre-photosynthetic, photosynthetic, and post-carboxylation stages (Yakir, 1992; Roden et al., 2000). Thus, it is unclear if their final values in cellulose reflect those of the original precipitation water and if their mutual relationship corresponds to the GMWL. In fact, many factors affect the isotopic composition of cellulose. For example, transpiration enriches leaf water of both heavy isotopes (Roden et al., 2000), and carbonyl-water interactions during cellulose biosynthesis increase δ18O ratios (εo = 27‰) with values that are conserved in the analysed trees (Sternberg and DeNiro, 1983; Sternberg, 2009). Tree-ring δ18O records are widely used in paleoclimatic research as climate proxy (Siegwolf et al., 2022; Xu et al., 2024). In contrast, the δ2H ratio is decreased during cellulose biosynthesis compared to the leaf water (Cormier et al., 2018; Vitali et al., 2022) due to biological fractionation processes that are variable and differ between species (Arosio et al., 2020b). This, and the difficulty of their measurement (Roden et al., 2000; Cormier et al., 2018; Arosio et al., 2020a; Vitali et al., 2023), complicate the use of tree-ring δ2H values as a proxy archive, although they are potentially useful. One technical difficulty is that only the non-exchangeable, C-bound δ2H (referred to here as δ2Hn) carries climatic or physiological information, and thus, the exchangeable, oxygen-bound H must be subtracted from the measurements. In addition, the use of δ2Hn measures is complicated by uncertainties of hydrogen biological fractionation (Vitali et al., 2022). Moreover, there are inconsistencies between modelled and measured δ2H values (Waterhouse et al., 2002).
The uncertainties of the ability of tree-ring isotopes to faithfully preserve the original precipitation isotope signal is thus a major drawback for their utilization as proxy archives, even though they have the potential to provide broad geographical coverage. Initial efforts to relate δ2H and δ18O ratios to precipitation and to the GMWL have shown promise at regional scales (Lehmann et al., 2022; Churakova et al., 2023), but systematic studies at the hemispheric scale are still missing. The evaluation of δ18O and δ2Hn in the cellulose of a large number of samples collected at local and continental scales that cover extended time periods necessary in order to verify if they can be used to detect the GMWL and to identify the conditions for a reconstruction of the water cycle. Here, we show that we conduct study of δ18O and δ2Hn values in the tree-ring cellulose of living and subfossil wood samples from larch and non-larch conifers collected at six different sites across continental Europe, Iceland, and Greenland. The variations in δ18O and δ2Hn values between different sites and within each individual site were compared to understand the biological and physiological factors affecting the stable isotopes at different geographical scales.
Methods
Samples collection and stable isotope analysis
The δ18O and δ2Hn tree-ring cellulose data were analyzed from six sites across Spain, the European Alps, Iceland, and Greenland (Figure 1A; Table 1). While the datasets from Iceland and Greenland are unpublished, the Alpine arc data comes from the publicly available “Alpine Holocene Triple Tree Ring Isotope Record” (AHTTRIR) (Arosio et al., 2022), which comprises 202 trees at the tree line in the Swiss, Austrian, and Italian Alps, covering 46.03–47.03°N and 7.55–15.25°W. This dataset spans the last 9,000 years up to 2015 CE with a 5-year resolution. Analyses indicate a very low correlation (r < 0.2) between tree-ring width and isotopes in the Alpine dataset, confirming that favorable growing conditions (wider rings) do not significantly influence the 5-year average δ18O and δ2Hn values (Arosio et al., 2021). Greenland samples, with exceptionally narrow rings (mean 0.123 mm), were sectioned into 10-year blocks, while Icelandic wood was cut into annual slices. All samples underwent cellulose extraction (Ziehmer et al., 2018) and isotope analysis (Loader et al., 2015). The network spans six sites from 37°N to 80°N (Figure 1A), featuring larch and non-larch conifers. Samples from Spain and Iceland cover four centuries, the Alps span nine millennia, and Greenland’s wood extends over four centuries but predates the 14C dating limit by over 50 millennia (Table 1).
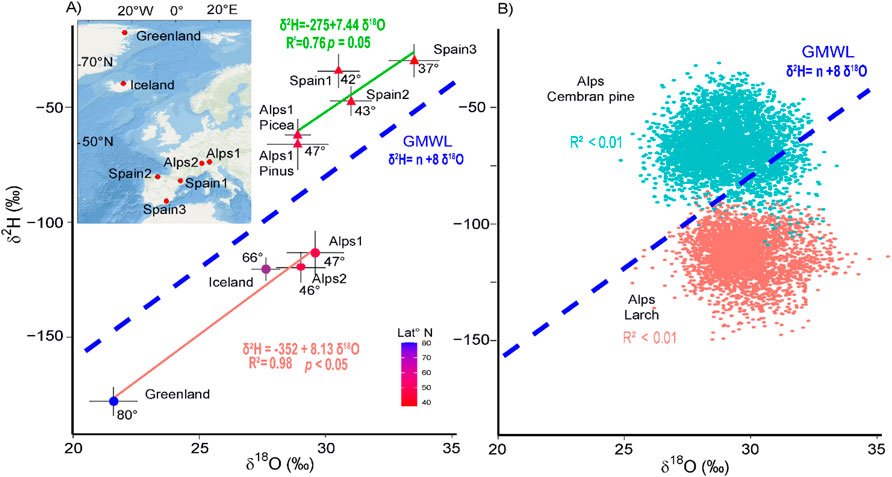
Figure 1. Comparison of δ18O and δ2H at continental and local scales. (A) plot of the δ18O and δ2H isotopic mean values for each site, the solid lines indicate linear regressions, the red line is for larch trees, and the green line is for pine and spruce trees. The dashed blue line represents the GMWL. For each region, the standard deviation is indicated, and linear regression fits, associated R values and p values for the two tree groups are shown. The number of trees for each site are: Alps (larch), 85; Greenland,1; Iceland, 1; Alps2, 19; Spain1, 5; Spain2, 5; Spain3, 5; Alps1 (Picea abies), 1; Alps1 (Pinus cembra), 116. The °N latitude is indicated by the colour of the points and expressed numerically (see Table 1 for details). The round dots are for larch trees, and the triangular dots are for pine and spruce trees. The inset shows sampling locations. (B) Scatter plot of tree-level δ2H and δ18O of the 85 larch trees (red) and 116 cembran pine trees (cyan), with the dotted blue line representing the GMWL.
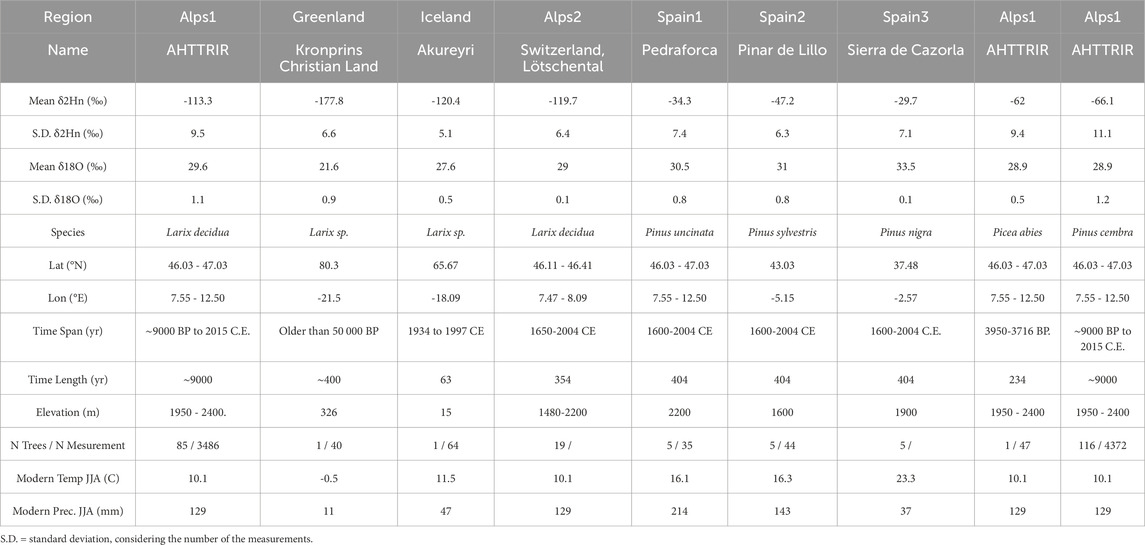
Table 1. Detailed characteristics of the sampling sites.
Isotope analysis and calibration
For the combined online measurements of δ13C, δ18O and δ2Hn, the samples were subjected to pyrolysis at temperatures exceeding 1,450°C in a Flash HT elemental analyzer to convert the cellulose to carbon monoxide and hydrogen (Leuenberger and Filot, 2007) following the method described in Filot et al. (2006). This high temperature is critical for decomposing the cellulose quantitatively into hydrogen and carbon monoxide, with the residue (partial carbon of the cellulose) (Leuenberger and Filot, 2007) collected in a graphite crucible. The resulting gases were separated via a 5 Å molecular sieve and analysed using a Thermo Delta XP or an Elementar/Isoprime mass spectrometer for δ13C and δ18O on CO and δ2Hn on H2.
δ2Hn values are determined using an online equilibration technique described by Filot et al. (2006) and extended to a triple isotope method (COH) described by Loader et al. (2015). The specific procedure involves equilibrating the cellulose samples with water vapour of known δ2H values (close to VSMOW, variable in the range of −2 to +2‰ over years depending on the aliquot of internal water standards, calibrated against VSMOW with a precision of 0.5‰) at 110°C for 10 min using a continuous flow of helium carrier gas at 80 mL/min. The rate of equilibration was checked with different calibration waters in the range (−429.1 (Dome C) to +1 (Meerwasser) ‰) to cover a wide range of δ2H values as already used by Filot et al. (2006). The samples and standards are stored in a desiccator when not being analysed. This equilibration method was cross-calibrated with the nitration method using cellulose standards with known δ2Hn (Filot et al., 2006).
The mass spectrometric analysis involved the determination of isotope ratios of hydrogen and carbon monoxide, which were sequentially detected and measured after elution. This process included working gas pulses for both hydrogen and carbon monoxide, yielding raw delta values, which were converted in per mil (‰) deviations relative to Vienna Standard Mean Ocean Water (VSMOW) for hydrogen and oxygen as well as carbon based on the calibration procedure described below.
Calibration and quality control were integral to our methodology. A two-point calibration of the raw delta values obtained against our working gas was performed for all isotope ratios (Table 2). For hydrogen, we used Merck cellulose (−34.94‰ δ2Htotal, and −70.9 δ2Hn) and IAEA-CH7 polyethylene standards (−100.3‰ for both δ2Htotal, and δ2Hn as no exchangeable hydrogen is available). This calibration approach allows us to determine the offset and contraction/stretching of the scale relative to the international VSMOW-SLAP scale. These scale correction terms are independent of whether there are available exchangeable hydrogen atoms. To check for drift in the reference gas and to evaluate precision over time, we additionally used Wei Ming 101 cellulose (from WEI MING Pharmaceutical MFG) and/or IAEA-C3 cellulose (form IAEA) and IAEA-C6 sucrose (form IAEA) standards (Rozanski et al., 1992; Coplen et al., 2006). This led to the evaluation of the machine performance and the implementation of the necessary corrections to a linear drift. Furthermore, the inclusion of IAEA-CH7 specifically enabled quality control of the non-exchangeable hydrogen measurements, while the cellulose standards accounted for the exchangeable portion. For δ18O and δ13C, we used Merck and IAEA-C3 for the calibration, the corresponding values are given in Table 2. The system’s stability allowed for consistent and reliable data within the standard precision limits of ±0.3‰ for oxygen and ±3.0‰ for hydrogen.
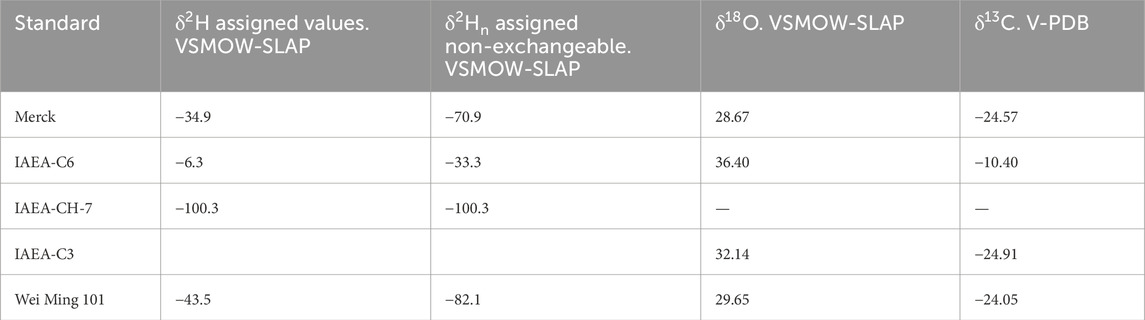
Table 2. Standard materials and assigned values: the values in bold were used for calibration. The other values were determined using these calibration values.
Tree-ring δ18O and δ2H data from three Spanish sites (Figure 1A; Table 1) were generated during the ISONET project (Treydte et al., 2006) and followed the methodology for δ18O detailed in Treydte (Treydte et al., 2014). The δ2Hn measurements were conducted using the technique described above. All samples in this study were measured for non-exchangeable, C-bound hydrogen from tree-ring cellulose (Filot et al., 2006; Loader et al., 2015).
All examined trees were absolutely dated with only one exception, the tree from Greenland, which was estimated to be older than 50,000 years. The fragmented remains of this tree were discovered within a glacier moraine at an elevation of 331 m asl, located more than 90 km away from the open sea.
Sea-level change correction for the alpine dataset
The δ2Hn and δ18O of the Alpine dataset were corrected for the effect of ice volume with a gradient obtained for δ18O (Fleitmann et al., 2009; Affolter et al., 2019) and converted to δ2H by multiplying it by a factor of eight, resulting in a gradient of −0.064‰ per meter of sea-level rise (Rozanski et al., 1982); as previously done for speleothem records from Switzerland (Affolter et al., 2019). The effect of ice volume correction on the Alpine database for δ2Hn and δ18O values is shown in Supplementary Figure S5. The other datasets do not require a correction as they are from the late Holocene period, where the correction is ineffective (Supplementary Figure S5). The Greenland sample has not been corrected for temperature because the growth temperature is unknown.
Larch oxygen isotope correction
The oxygen values of larch and non-larch trees are known to have similar values if they come from the same region and time, while those of hydrogen are known to be lower in larch than non-larch trees (Arosio et al., 2020b). Thus, we corrected all larch values based on the difference between the larch and non-larch species in the Alpine database (Figure 2, Supplementary Figures S2, S4-1, S5). The correction factor is −48.1‰.
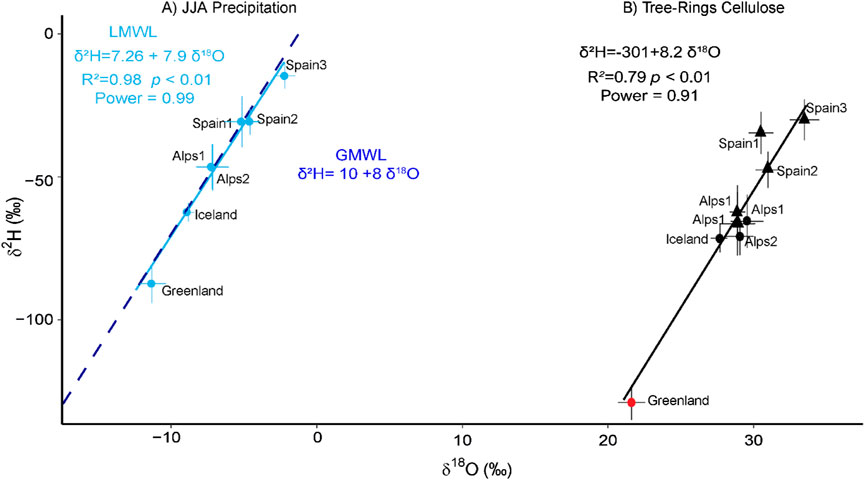
Figure 2. Comparison of δ18O and δ2H of cellulose and precipitation. (A) Modelled δ18O and δ2H isotopic mean values (Bowen et al., 2005) of the JJA (June, July and August) precipitation from the linear regression fits, representing the LMWL, associated R values and p values, in light blue. Dashed blue line represents the GMWL. (B) Plot of δ18O and δ2H isotopic region mean values. The larch values (round shapes) have been corrected to overlap the non-larch values (triangular shapes). Linear regression fits, associated R values and p values are shown. Round dots are for larch trees, and triangular dots are for pine and spruce trees. The Greenland point (blue) was not taken into account in the linear regression.
Climate data
Monthly temperature and precipitation data were extracted from the Climatic Research Unit’s CRU TS4.03 dataset (Harris et al., 2020) for the period 1905-2002 at each study site.
Summer (JJA) and winter (DJA) seasonal means deviation for monthly precipitation hydrogen (δ2Hp) and oxygen (δ18Op) stable isotope values were calculated per site by extrapolating the monthly values from the gridded data defined by Bowen et al. (2005), using each site’s latitude, longitude, and altitude. The modelled data are based on precipitation measurements from 1960 to the present (Bowen et al., 2005).
Statistical analysis
To assess the variable’s dependency, a linear regression has been calculated (Figures 1, 2, 3; Supplementary Figures S1–S5) and associated with the P value and the Statistical power. The Statistical power is defined as one minus the probability of type II error (Greenland et al., 2016). The choice to use the average and standard deviation to represent the site values is based on the normal distribution of the isotopic values (Supplementary Figures S3A, B).
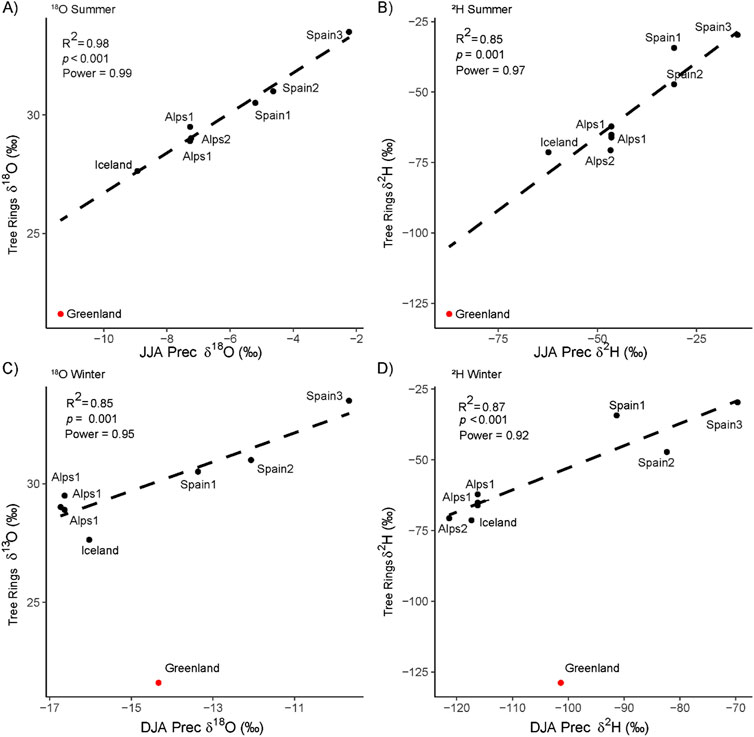
Figure 3. Seasonal modelled precipitation isotopic values vs. tree-ring isotopic values. Scatter plots of the correlation between isotopic measurements from tree rings and modelled precipitation during summer (JJA) and winter seasons (DJA). (A) Tree-ring δ18O (TR) versus summer δ18O precipitation, (B) Tree-ring δ2H versus summer δ2H precipitation, (C) Tree-ring δ18O versus winter δ18O precipitation, (D) Tree-ring δ2H versus winter δ2H precipitation. Each point represents a specific geographical location labelled accordingly. The lines of best fit are shown along with coefficient of determination (R2) and p-value, indicating the strength of the correlation. The Greenland point (red) was not taken into account in the linear regression.
To account for the uncertainty linked to the average of each region for δ2Hn and δ18O, we conducted a Monte Carlo simulation with 10,000 iterations whereby the linear model was fitted to δ2Hn and δ18O incorporating the uncertainty by randomly adding the standard deviation of both isotopes.
The inferred mean linear regression is 8.03 for larch and 6.64 for the non-larch group (Supplementary Figure S1.1). The same analysis was carried out for all regions together but with the correction for larch and not including the Greenland sample, with a mean linear regression of 8.19 (Supplementary Figures S1.2). To show the uncertainty generated from the Monte Carlo simulation, we calculated the distribution density of the simulated slopes and intercepts (Supplementary Figures S1.2B, C), simulated values and all linear interpolations (Supplementary Figure S1.2C).
The relationships between the isotope data (δ2Hn and δ18O) and geographical/climatic variables were analysed using two approaches: 1) linear regression between each isotope and each individual variable (Supplementary Figure S2, Supplementary Figure S4.1) and 2) multivariate regression analysis incorporating all variables simultaneously, excluding the Greenland sample (Supplementary Table S1).
All the data analysis was performed in R version 4.3.2.
Results
Species-specific analysis at continental scale
Our network is mostly focused over Europe and covers a large part of the Northern Hemisphere from the south of Spain to northern Greenland, across a range of time periods, and it shows that the slope of the linear interpolation of the regional averages of tree-ring δ18O and δ2H parallels that of the GMWL (Figure 1A) and the LMWL (Figure 2B). It is important to note that the GMWL has remained stable throughout the Holocene, providing a consistent reference for isotopic studies across this geological epoch (Rozanski, 1985). In contrast, we observe no relationship between δ18O and δ2Hn at the single site level (Figure 1B). An analysis of the Alpine dataset shows that the isotopes present a normal t-distribution (McCarroll and Loader, 2004) (Supplementary Figure S3), supporting the use of mean values and standard deviations for the representations of our datasets.
Larch was shown to have δ2Hn values different from those of non-larch conifers, in agreement with the previous study (Arosio et al., 2020b). Thus, δ18O and δ2Hn data were initially analysed separately. The linear regression of the means of their δ18O and δ2Hn values was statistically significant (Figure 1A, p < 0.05, R2 = 0.98 and slope = 8.13, power = 0.80, n = 4). This was confirmed by a Monte Carlo analysis, which includes the uncertainty of averages through the use of standard deviation. It produced a regression δ18O vs. δ2Hn with a similar slope (mean = 8.03, first quartile = 6.85 and third quartile = 9.01) (Supplementary Figure S1.1C). Importantly, the 8.13 slope value is close to that of the GMWL (Craig, 1961) (8.0), and to that of the LMWL (7.9 calculated with the modelled precipitation values) (Figure 2A). The linear regression of the δ18O and δ2Hn mean values of the non-larch was also significant but only marginally (p = 0.054, R2 = 0.76 and slope = 7.46, power = 0.54, n = 5), confirmed by Monte Carlo simulations that produced a similar slope value (mean = 6.64, first quartile = 4.67 and third quartile = 8.23) (Supplementary Figure S1.1B). Thus, the linear regression analysis of the δ18O-δ2Hn mean values of all the sites was statistically significant (Figure 1A) and aligned with the GMWL (Figure 1A) and the LMWL (Figure 2). However, the intercepts of the larch (−358‰) and of non-larch (−275‰) linear regressions differed remarkably from that of the GMWL (+10) (Craig, 1961), because of the isotopic fractionation occurring in trees. Their different intercepts could be explained as the δ18O in cellulose is ∼27‰ higher than that of leaf/precipitation water, while the δ2Hn was shown to be −171‰ after photosynthetic and +158‰ at post-photosynthetic steps (Lehmann et al., 2022) and differ in larch and non-larch conifers (Arosio et al., 2020b).
Larch correction and continental analysis
The regression lines of larch and non-larch trees have very similar slopes, indicating that the difference between larch and non-larch values is roughly constant among different sites. The use of the two species together is possible but only by correcting the larch samples (Figure 2B, Supplementary Figure S1.2). After correction and considering all the regions together, the linear regression produced a slope value of 8.2 (p < 001, R2 = 0.79, n = 8, power = 0.91, mean of 8.19 with a Monte Carlo analysis) (Figure 2B; Supplementary Figure S2). This value is similar to that of the regressions adjusted for the simulated isotopic precipitation values of the same sites (Figure 2A), which are 7.9 and 8.0 for the LMWL and the GMWL (Craig, 1961), respectively. Of note, we excluded the Greenland sample for the statistical analysis of Figure 2B, because it lacks an exact dating and its sea-level correction; moreover, its rather low values may affect the linear interpolation. Nevertheless, it remains an interesting verification sample.
Figure 2B shows that the mean values of all sites are well aligned on the regression line, except Spain1, which has higher δ2Hn values than Spain 2. This difference cannot be explained by climatic or geographical effects (Table 1), or isotopic value of precipitation (Figure 2A), and we attributed the increased δ2Hn values to physiological stress at Spain 1 that may increase autotrophic metabolism and affect isotopic fractionation (Cormier et al., 2018) (Figure 4).
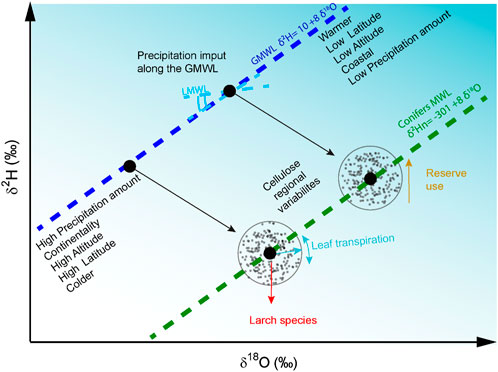
Figure 4. Scheme of the factors affecting tree-ring δ2H and δ18O and the GMWL. Incoming precipitation generally falls around the GMWL, described by the equation δ2H = 8 * δ18O+ 10. The range of precipitation isotope ratios at a given location is strongly related to its temperature, elevation, and continentality. The slope of 8.0 reflects the relative equilibrium fractionation factors between δ2H and δ18O and defines the GMWL. At the leaf or needle level, transpiration occurs along a line (light blue), the slope of which is controlled by the relative humidity (Lehmann et al., 2022). Biological fractionation of both isotopes can modify the isotopic values of leaf water. Hydrogen isotopic values can be enriched by reserve uses (Cormier et al., 2018) and have lower values in larch species compared to other conifers (Arosio et al., 2020b).
Seasonal, geographical, and present climatic influence
After excluding the Greenland sample, we found that the relationship between the mean regional summer temperatures and the mean regional isotopic values for both δ2H and δ18O was significant (p < 0.01 R2 = 0.85 and 0.83 for both δ18O and δ2Hn respectively) (Supplementary Figures S4-1A, B). In contrast, summer precipitation amounts do not seem to be a representative parameter of the regional tree-ring δ2Hn and δ18O, as the correlation is not significant (Supplementary Figures S4-1C, D). We conclude that temperature was the primary factor driving the variations observed in both δ2H and δ18O mean values across the different regions.
In addition, we found a strong significant correlation between the regional tree-ring δ18O and δ2Hn (larch corrected) and the modelled summer isotope precipitation values (Bowen et al., 2005; IAEA/WMOA, 2006; Bowen, 2012), while the correlation with winter isotope precipitation values was weaker, especially for δ18O (Figure 3). The correlation between tree-ring δ2Hn and precipitation δ2Hp is lower than that between tree-ring δ18O and δ18Op (Figure 3). This difference is likely caused by the higher biological fractionation of δ2Hn, which can dampen the seasonal climate signal. However, since hydrogen and oxygen come from the same water sources, the seasonal δ2H should reflect the summer seasonality as δ18O does. The correlations between tree-ring isotopes and the summer temperatures are similar(δ18O) or higher (δ2Hn) than those between model precipitation isotopes and temperatures (Supplementary Figures S4-1, S4-2).
The stronger summer δ18O signal is probably due to the high altitude (>1,000 m) (Spain and the Alps) or the high latitude (Greenland and Iceland) of the sampling sites, where tree growth occurs only in the summer season (Moser et al., 2010) and depends on δ18O of summer precipitation (Szymczak et al., 2020). This contrasts with lowland broadleaved trees, the leaf water of which reflects the winter δ18O precipitation stored in the soil (Allen et al., 2019). Note that the Greenland sample was excluded from this analysis since it comes from another interglacial stage where temperatures and precipitation amounts are unknown.
The relationship of δ2Hn and δ18O with latitude showed significant negative regression slopes (p < 0.01 for both isotopes, R2 = 0.88 for δ18O and R2 = 0.81 for δ2Hn) (Figures 1A, 2A; Supplementary Figures SA, B). This agrees with the known temperature-controlled isotope fractionation in precipitation caused by poleward air mass transport that carries lower δ2Hn and δ18O values at higher latitude sites (Dansgaard, 1964). The altitude effect was not statistically significant (R2 = 0.4, p = 0.08 for δ18O; R2 = 0.4, p = 0.09 for δ2Hn) (Supplementary Figures S2C, D), possibly because of the limited altitudinal range of our data (Kern et al., 2014).
A multivariate regression analysis confirms that a key driver of spatial δ18O and δ2Hn variation is summer temperatures and that the δ2Hn values are also significantly related to δ2Hn summer precipitation, latitude, and altitude (Supplementary Table S1).
Analysis of individual trees
In the sections above, we considered the mean values of the different regions, but it is also important to analyse the isotopic variation in the individual sites. We focused on our largest database, the Alps1 sites. In the larch and non-larch trees of the dataset, the correlations between the two isotopes were statistically non-significant (Figure 1B). The low correlation (R2 < 0.1) remained even after the normalisation of all trees (Supplementary Figure S3A), and also when considering the mean value of the different sites (R2 < 0.1) (Supplementary Figure S3B). Thus, the low correlation is intrinsic to the trees and is not due to the merging of trees from the same region, with mean R2 < 0.25 for all larch and R2 < 0.2 for all cembra pine (Supplementary Figure S3C).
Greenland sample
The Greenland sample was found at an altitude of 313 m a.s.l and 90 km from the ocean, indicating in situ growth during an interglacial phase when the climate in Greenland was warm. Now there are no trees nearby. Nevertheless, the Greenland sample falls remarkably close to the linear regression line for the region (shown by the red dot in Figure 2B).
Discussion
Species-specific analysis at continental scale
Present work analyses six sites covering a large part of the Northern Hemisphere from the south of Spain to northern Greenland, across a range of time periods. Our data show that the δ18O and δ2Hn means of regions exhibit a covariance that follows the GMWL, indicating that the tree-ring isotopes capture the regional value of precipitation isotopes, although with a difference between larch and non-larch conifers (Figure 1A).
The consistent offsets of the larch and non-larch linear regressions from the GMWL across the entire dataset suggest a nearly constant difference in the isotopic fractionation of the two groups during the processes of cellulose formation (Figure 1A). This suggests that large-scale systematic physiological effects on isotope fractionation do not occur over the large spatial and temporal range of our data, although there are exceptions, such as the deviation observed at Spain 1 attributed to metabolic fractionation (Figure 2B).
Larch correction and continental analysis
From the regression of the means of δ2Hn and δ18O, using all the samples corrected, we obtained a slope value close to 8, which is very close to the slope of the GMWL (Craig, 1961). Similar recent study reported slightly different results with a δ2Hn and δ18O slope value of 10, higher than the expected 8.0 for the GMWL or 7.8 for the LMWL (Supplementary Figure S9 in the appendix of Vitali et al. (2022)). The work was based on the ISONET dataset (Vitali et al., 2022) that contains conifers and oak trees of high and low altitudes and different δ2Hn measurement systems that may cause variability in tree-ring δ18O and δ2Hn (Kern et al., 2014; Allen et al., 2019). This may explain the difference from our study, which contains only high altitude/latitude conifers and uses the same δ2Hn measurement system. The precipitation signal appears coherent across our network and reflects the regional summer isotopic precipitation signal (Figure 2).
Seasonal, geographical, and present climatic influence
The δ2H and δ18O values of local precipitation are primarily influenced by regional-scale processes (Rozanski et al., 1982), which include geographical and climatic factors such as temperature, precipitation, latitude, continentality, and altitude (Craig, 1961; Ingraham, 1998). Given that this study employs what is likely one of the largest datasets available for continental-scale isotopic analysis, it enables a deeper investigation into the geographical and climatic factors driving tree rings isotopic variation. Our findings demonstrate that regional tree-ring δ2Hn and δ18O mean values reflect these continental precipitation isotopic variations, with temperature and latitude emerging as dominant drivers. The seasonal investigation points to regional tree-ring δ2Hn and δ18O values as predominantly reflecting summer precipitation isotopic patterns, suggesting that temperature and latitude significantly influence spatial variation. The globally coherent nature of the water cycle during the Common Era (Konecky et al., 2023) further supports the capacity of tree-ring δ2Hn and δ18O measurements to capture geographic isotopic shifts across different time periods.
This finding may be important for archaeological studies (Bernabei et al., 2019), as well as for tracing the origin of Arctic driftwood (Hellmann et al., 2013). However, this is partially limited by the difference between larch and non-larch conifers and possibly other species. Another potential confounding factor is that at high latitudes and under certain climatic conditions, the active permafrost with low δ2H and δ18O values can contribute to the tree water supply (Kirdyanov et al., 2024).
The main limitation of this study is the small and variable sample sizes across regions due to the scarcity of δ2Hn measurements. Strengths include wide spatial dataset coverage, exclusive use of conifer species, and consistent δ18O and δ2Hn measurement systems. Notably, an ancient Greenland sample, excluded from statistical analyses due to its uniqueness, was used for verification.
Analysis of individual trees
We found an absence of correlation if a single site is analysed; this absence of correlation is intrinsic to the trees and is not due to the merging of trees from the same region (Figure 1B). This cannot be explained by the relatively small spatial range or variation in the LMWL values in the European Alps (between 7.84 and 8.29) (Flaim et al., 2013; Hürkamp et al., 2019) or by the different sampling sites or offsets between trees. More likely, it is due to temporal variations of δ18O and δ2Hn in response to climate and weather conditions, which include leaf transpiration, soil condition and rooting variation. These factors influence the fractionation of tree-ring δ18O variations can retain temperature or hydroclimate signals utilized by paleoclimatic studies (McCarroll and Loader, 2004; Nagavciuc et al., 2019; Yang et al., 2021). However, they are masked in the continental analysis by averaging the regional tree-ring isotopic values. From this analysis, we conclude that the low correlation between δ18O and δ2Hn at the local level is due to the temporal variations of isotope fractionations rather than database heterogeneity.
Greenland sample
The Greenland sample is not used for the correlation analysis as it is not dated. Nevertheless, its proximity to the Conifers MWL (shown by the red dot in Figure 2B) could indicate that it experienced similar hydrological conditions and biological δ2Hn fractionations. However, the sample has lower δ2Hn and δ18O values compared to the present precipitation isotopic values (Figure 3), which can be interpreted as being due to a lower temperature than nowadays (Supplementary Figures S4-1A, B), or that the tree used melting ice water that has lower δ2H and δ18O values.
Conclusion
Our network analysis reveals that regional tree-ring δ18O and δ2Hn averages align with the GMWL, influenced by geographic and climatic gradients of summer precipitation isotopes. When site variance in δ18O and δ2H precipitation is large, the isotopic precipitation signal dominates, driven primarily by temperature and latitude. Effective reconstruction of these relationships requires multi-century regional averaging. Thus, tree-ring isotope variability can trace the geographic origin of living and relict wood on a hemispheric scale during interglacial phases. In contrast, short-term and local isotopic changes decouple the two isotopes due to distinct biological fractionation effects (Holloway-Phillips et al., 2023). The information obtained in this work is summarized in Figure 4. Precipitation δ2H and δ18O vary globally following the GMWL with local variations (LMWL). This global variation is reflected in the δ2Hn and δ18O of tree rings, which allow the identification of a European conifer MWL with a slope of about 8 and an intercept of −301‰ (Figure 4). Tree species diversity must also be taken into account as in our case by applying a larch correction. Of note, this global-continental variation can only be detected using data covering >300 years of length. For shorter time periods at local levels, the two isotopes no longer show a significant covariance but carry distinct climatic or physiological information, which may be exploited in climate reconstructions.
Data availability statement
The Alpine datasets are available on Pangaea https://doi.org/10.1594/PANGAEA.941604. The Greenland datasets are going to be deposited in PANGEA and will be publicly available. Inquiries can be directed to the corresponding author.
Author contributions
TA: Conceptualization, Investigation, Data curation, Formal analysis, Writing–original draft, Writing–review and editing. UB: Writing–original draft, Writing–review and editing. KN: Resources, Investigation, Writing–review and editing. GEM: Resources, Writing–review and editing. MS: Resources, Writing–review and editing. TP: Resources, Writing–review and editing. MPS: Writing–review and editing. EG: Writing–review and editing. LAH: Writing–review and editing. IH: Resources, Writing–review and editing. TB: Visualization, Writing–review and editing. ML: Conceptualization, Resources, Investigation, Writing–original draft, Writing–review and editing.
Funding
The author(s) declare that financial support was received for the research, authorship, and/or publication of this article. This research has been supported by the Swiss National Science Foundation (grant nos. SNF P500PN 210716, SNF 200021L_144255 and SNF 200020_172550) and the Austrian Science Fund (grant no. I-1183-N19). The Greenland sample was collected during fieldwork funded by the Austrian Science Fund. This research (the Greenland fieldwork) was funded in whole by the Austrian Science Fund (FWF) (Grant DOI 10.55776/Y1162). For open access purposes, the author has applied a CC BY public copyright licence to any author accepted manuscript version arising from this submission. The Greenland government is thanked for permission to undertake this fieldwork (KNNO Expedition Permit C-19-32; Scientific Survey Licence VU-00150; Greenland National Museum and Archives 2019/01).
Acknowledgments
We are grateful to Peter Nyfeler for lab assistance.
Conflict of interest
The authors declare that the research was conducted in the absence of any commercial or financial relationships that could be construed as a potential conflict of interest.
Publisher’s note
All claims expressed in this article are solely those of the authors and do not necessarily represent those of their affiliated organizations, or those of the publisher, the editors and the reviewers. Any product that may be evaluated in this article, or claim that may be made by its manufacturer, is not guaranteed or endorsed by the publisher.
Supplementary material
The Supplementary Material for this article can be found online at: https://www.frontiersin.org/articles/10.3389/feart.2024.1440064/full#supplementary-material
SUPPLEMENTARY FIGURE S1.1Linear regression using a 1000-time Monte Carlo simulation: a) the linear regression of larch (red) and non-larch group (cyan) separately, b) the frequency of the coefficient values for Monte Carlo simulation of the linear regression of the non-larch group, the vertical line is the mean slope value. c) the frequency of the coefficient values for Monte Carlo simulation of the linear regression of larch group, the vertical line is the mean slope value.
SUPPLEMENTARY FIGURE S1.2Linear regression using a 1000-time Monte Carlo simulation adding the uncertainty to both isotopes: A) the linear regression of all species but with the correction for the larch species, excluding the Greenland sample in red; B) the frequency of the slope values for Monte Carlo simulation of the linear regression, the vertical line is the mean slope value. C) all the linear regressions of the Monte Carlo simulation, and the simulated points in gray, the Greenland sample was not considered, D) the frequency of the intercept values for the Monte Carlo simulation of the linear regression, the vertical line is the mean slope value.
SUPPLEMENTARY FIGURE S2Geographical variables vs. tree-ring isotopic values. Linear regression latitude (°N) and elevation (m) vs. cellulose δ18O and δ2H isotope value by region, with linear regression fits and associated R2 values. The Greenland point (red) has not been taken into account in the linear regression. A) latitude °N vs. cellulose δ18O. B) latitude °N vs. cellulose δ2H. C) elevation (m) vs. cellulose δ18O. D) elevation (m) vs. cellulose δ2H.
SUPPLEMENTARY FIGURE S3Scatter plot of tree-mean δ2Hn and δ18O and R2 of all the trees of the Alpine database. A) Scatter plot of tree-level δ2H and δ18O of the 85 larch trees (red, LADE) and 116 cembran pine trees (cyan, PICE). Along the top and right margins of the scatter plot, there are density plots that show the distribution of the δ1⁸O and δ2H values for both species. B) Scatter plot of tree-level δ2H and δ18O of the 85 larch trees (red, LADE) and 116 cembran pine trees (cyan, PICE), after the normalisation of the mean for each tree in both isotopes. Along the top and right margins of the scatter plot, there are density plots that show the distribution of the δ1⁸O and δ2H values for both species. C) Scatter plot of tree-level δ2H and δ18O of the mean value of 85 larch trees (red, LADE) and 116 cembran pine trees (cyan, PICE). D) Box plot showing the R2 of the δ2Hn and δ18O correlation, for 85 larch (red, LADE) tree) and 116 cembran pine trees (cyan, PICE) of the Alpine database.
SUPPLEMENTARY FIGURE S4-1Climate variables vs. tree-ring δ18O and δ2Hn values. Linear regression between mean isotope value by region and mean seasonal climate variable by region, with linear regression fits and associated R2 values. A) JJA temperature (1905–2002 CE) vs. cellulose δ18O. B) JJA precipitation (1905–2002 CE) vs. cellulose δ18O. C) JJA temperature vs. cellulose δ2H. D) JJA precipitation vs. cellulose δ2H. The Greenland point (red) has not been taken into account in the linear regression.
SUPPLEMENTARY FIGURE S4-2Climate variables vs. modelled precipitation δ18O and δ2H values. Linear regression between mean isotope value by region and mean seasonal climate variable by region, with linear regression fits and associated R2 values. A) JJA temperature (1905–2002 CE) vs. cellulose δ18O. B) JJA precipitation (1905–2002 CE) vs. cellulose δ18O. C) JJA temperature vs. cellulose δ2H. D) JJA precipitation vs. cellulose δ2H. The Greenland point (red) has not been taken into account in the linear regression.
SUPPLEMENTARY FIGURE S5 Alpine δ18O and δ2Hn tree-ring isotope values Correction effect. Before using the Alpine database, which covers the last 9,000 years, δ18O and δ2Hn were corrected for the effect of ice volume with a gradient obtained for δ18O (Fleitmann et al., 2009; Affolter et al., 2019), converted by a factor of eight to δ2H of −0.064‰ per-meter of sea-level rise (Rozanski et al., 1982); previously done in speleothems from Switzerland(Affolter et al., 2019). Non-corrected values are shown in black, corrected values are shown in red.
SUPPLEMENTARY TABLE S1Multivariate analysis for δ18O and δ2Hn. Multivariate regression model results of predicting tree-ring δ18O (top) and δ2Hn (bottom) values based on climate variables. Listed are model coefficient estimates, standard errors, t-values, and p-values indicating statistical significance.
References
Affolter, S., Häuselmann, A., Fleitmann, D., Edwards, R. L., Cheng, H., and Leuenberger, M. (2019). Central Europe temperature constrained by speleothem fluid inclusion water isotopes over the past 14,000 years. Sci. Adv. 5, eaav3809. doi:10.1126/sciadv.aav3809
Allen, S. T., Kirchner, J. W., Braun, S., Siegwolf, R. T., and Goldsmith, G. R. (2019). Seasonal origins of soil water used by trees. Hydrology Earth Syst. Sci. 23, 1199–1210. doi:10.5194/hess-23-1199-2019
Arosio, T., Ziehmer, M., Nicolussi, K., Schluechter, C., Thurner, A., Österreicher, A., et al. (2022). Alpine Holocene triple tree ring isotope record. PANGAEA. Available at: https://doi.pangaea.de/10.1594/PANGAEA.941604.
Arosio, T., Ziehmer, M. M., Nicolussi, K., Schlüchter, C., and Leuenberger, M. (2020a). Alpine Holocene tree-ring dataset: age-related trends in the stable isotopes of cellulose show species-specific patterns. Biogeosciences 17, 4871–4882. doi:10.5194/bg-17-4871-2020
Arosio, T., Ziehmer-Wenz, M. M., Nicolussi, K., Schlüchter, C., and Leuenberger, M. (2020b). Larch cellulose shows significantly depleted hydrogen isotope values with respect to evergreen conifers in contrast to oxygen and carbon isotopes. Front. Earth Sci. 8, 579. doi:10.3389/feart.2020.523073
Arosio, T., Ziehmer-Wenz, M. M., Nicolussi, K., Schlüchter, C., and Leuenberger, M. C. (2021). Investigating masking effects of age trends on the correlations among tree ring proxies. Forests 12, 1523. doi:10.3390/f12111523
Bernabei, M., Bontadi, J., Rea, R., Büntgen, U., and Tegel, W. (2019). Dendrochronological evidence for long-distance timber trading in the Roman Empire. PloS one 14, e0224077. doi:10.1371/journal.pone.0224077
Bowen, G. J., Cai, Z., Fiorella, R. P., and Putman, A. L. (2019). Isotopes in the water cycle: regional-to global-scale patterns and applications. Annu. Rev. Earth Planet. Sci. 47, 453–479. doi:10.1146/annurev-earth-053018-060220
Bowen, G. J., Wassenaar, L. I., and Hobson, K. A. (2005). Global application of stable hydrogen and oxygen isotopes to wildlife forensics. Oecologia 143, 337–348. doi:10.1007/s00442-004-1813-y
Büntgen, U., Urban, O., Krusic, P. J., Rybníček, M., Kolář, T., Kyncl, T., et al. (2021). Recent European drought extremes beyond Common Era background variability. Nat. Geosci. 14, 190–196. doi:10.1038/s41561-021-00698-0
Cherubini, P., Battipaglia, G., and Innes, J. L. (2021). Tree vitality and forest health: can tree-ring stable isotopes Be used as indicators? Curr. For. Rep. 7, 69–80. doi:10.1007/s40725-021-00137-8
Churakova, O. V., Porter, T. J., Zharkov, M. S., Fonti, M. V., Barinov, V. V., Taynik, A. V., et al. (2023). Climate impacts on tree-ring stable isotopes across the Northern Hemispheric boreal zone. Sci. Total Environ. 870, 161644. doi:10.1016/j.scitotenv.2023.161644
Coplen, T. B., Brand, W. A., Gehre, M., Gröning, M., Meijer, H. A. J., Toman, B., et al. (2006). New guidelines for δ13 C measurements. Anal. Chem. 78, 2439–2441. doi:10.1021/ac052027c
Cormier, M.-A., Werner, R. A., Sauer, P. E., Gröcke, D. R., Leuenberger, M. C., Wieloch, T., et al. (2018). 2H-fractionations during the biosynthesis of carbohydrates and lipids imprint a metabolic signal on the δ2H values of plant organic compounds. New Phytol. 218, 479–491. doi:10.1111/nph.15016
Craig, H. (1961). Isotopic variations in meteoric waters. Science 133, 1702–1703. doi:10.1126/science.133.3465.1702
Dansgaard, W. (1964). Stable isotopes in precipitation. tellus 16, 436–468. doi:10.1111/j.2153-3490.1964.tb00181.x
Filot, M. S., Leuenberger, M., Pazdur, A., and Boettger, T. (2006). Rapid online equilibration method to determine the D/H ratios of non-exchangeable hydrogen in cellulose. Rapid Commun. Mass Spectrom. An Int. J. Devoted Rapid Dissem. Up-to-the-Minute Res. Mass Spectrom. 20, 3337–3344. doi:10.1002/rcm.2743
Flaim, G., Camin, F., Tonon, A., and Obertegger, U. (2013). Stable isotopes of lakes and precipitation along an altitudinal gradient in the Eastern Alps. Biogeochemistry 116, 187–198. doi:10.1007/s10533-013-9855-z
Fleitmann, D., Cheng, H., Badertscher, S., Edwards, R. L., Mudelsee, M., Göktürk, O. M., et al. (2009). Timing and climatic impact of Greenland interstadials recorded in stalagmites from northern Turkey. Geophys. Res. Lett. 36, 2009GL040050. doi:10.1029/2009GL040050
Galewsky, J., Steen-Larsen, H. C., Field, R. D., Worden, J., Risi, C., and Schneider, M. (2016). Stable isotopes in atmospheric water vapor and applications to the hydrologic cycle. Rev. Geophys. 54, 809–865. doi:10.1002/2015rg000512
Gat, J. R. (1996). Oxygen and hydrogen isotopes in the hydrologic cycle. Annu. Rev. Earth Planet. Sci. 24, 225–262. doi:10.1146/annurev.earth.24.1.225
Ghadiri, E., Affolter, S., Brennwald, M. S., Fleitmann, D., Häuselmann, A. D., Cheng, H., et al. (2020). Estimation of temperature–altitude gradients during the Pleistocene–Holocene transition from Swiss stalagmites. Earth Planet. Sci. Lett. 544, 116387. doi:10.1016/j.epsl.2020.116387
Greenland, S., Senn, S. J., Rothman, K. J., Carlin, J. B., Poole, C., Goodman, S. N., et al. (2016). Statistical tests, P values, confidence intervals, and power: a guide to misinterpretations. Eur. J. Epidemiol. 31, 337–350. doi:10.1007/s10654-016-0149-3
Hafner, P., Robertson, I., McCarroll, D., Loader, N. J., Gagen, M., Bale, R. J., et al. (2011). Climate signals in the ring widths and stable carbon, hydrogen and oxygen isotopic composition of Larix decidua growing at the forest limit in the southeastern European Alps. Trees 25, 1141–1154. doi:10.1007/s00468-011-0589-z
Harris, I., Osborn, T. J., Jones, P., and Lister, D. (2020). Version 4 of the CRU TS monthly high-resolution gridded multivariate climate dataset. Sci. data 7, 109. doi:10.1038/s41597-020-0453-3
Hatvani, I. G., Smati, A. E., Erdélyi, D., Szatmári, G., Vreča, P., and Kern, Z. (2023). Modeling the spatial distribution of the meteoric water line of modern precipitation across the broader Mediterranean region. J. Hydrology 617, 128925. doi:10.1016/j.jhydrol.2022.128925
Hellmann, L., Tegel, W., Eggertsson, Ó., Schweingruber, F. H., Blanchette, R., Kirdyanov, A., et al. (2013). Tracing the origin of Arctic driftwood. JGR Biogeosciences 118, 68–76. doi:10.1002/jgrg.20022
Holloway-Phillips, M., Cernusak, L. A., Nelson, D. B., Lehmann, M. M., Tcherkez, G., and Kahmen, A. (2023). Covariation between oxygen and hydrogen stable isotopes declines along the path from xylem water to wood cellulose across an aridity gradient. New Phytol. 240, 1758–1773. doi:10.1111/nph.19248
Hürkamp, K., Zentner, N., Reckerth, A., Weishaupt, S., Wetzel, K.-F., Tschiersch, J., et al. (2019). Spatial and temporal variability of snow isotopic composition on Mt. Zugspitze, Bavarian Alps, Germany. J. Hydrology Hydromechanics 67, 49–58. doi:10.2478/johh-2018-0019
Ingraham, N. L. (1998). “Isotopic variations in precipitation,” in Isotope tracers in catchment hydrology (Elsevier), 87–118. Available at: https://www.sciencedirect.com/science/article/pii/B9780444815460500100 (Accessed February 19, 2024).
Kern, Z., Kohán, B., and Leuenberger, M. (2014). Precipitation isoscape of high reliefs: interpolation scheme designed and tested for monthly resolved precipitation oxygen isotope records of an Alpine domain. Atmos. Chem. Phys. 14, 1897–1907. doi:10.5194/acp-14-1897-2014
Kirdyanov, A. V., Saurer, M., Arzac, A., Knorre, A. A., Prokushkin, A. S., Churakova, O. V., et al. (2024). Thawing permafrost can mitigate warming-induced drought stress in boreal forest trees. Sci. Total Environ. 912, 168858. doi:10.1016/j.scitotenv.2023.168858
Konecky, B. L., McKay, N. P., Falster, G. M., Stevenson, S. L., Fischer, M. J., Atwood, A. R., et al. (2023). Globally coherent water cycle response to temperature change during the past two millennia. Nat. Geosci. 16, 997–1004. doi:10.1038/s41561-023-01291-3
Lécuyer, C., Bojar, A.-V., Daux, V., and Legendre, S. (2020). Geographic variations in the slope of the δ2H–δ18O meteoric water line over Europe: a record of increasing continentality, 507. 10.1144/SP507-2020-68: Geological Society, London, Special Publications.
Lehmann, M. M., Schuler, P., Cormier, M.-A., Allen, S. T., Leuenberger, M., and Voelker, S. (2022). “The stable hydrogen isotopic signature: from source water to tree rings,” in Stable isotopes in tree rings: inferring physiological, climatic and environmental responses (Cham: Springer International Publishing), 331–359.
Lehmann, M. M., Vitali, V., Schuler, P., Leuenberger, M., and Saurer, M. (2021). More than climate: hydrogen isotope ratios in tree rings as novel plant physiological indicator for stress conditions. Dendrochronologia 65, 125788. doi:10.1016/j.dendro.2020.125788
Leuenberger, M. C., and Filot, M. S. (2007). Temperature dependencies of high-temperature reduction on conversion products and their isotopic signatures. Rapid Comm. Mass Spectrom. 21, 1587–1598. doi:10.1002/rcm.2998
Loader, N. J., Street-Perrott, F. A., Daley, T. J., Hughes, P. D. M., Kimak, A., Levanic, T., et al. (2015). Simultaneous determination of stable carbon, oxygen, and hydrogen isotopes in cellulose. Anal. Chem. 87, 376–380. doi:10.1021/ac502557x
McCarroll, D., and Loader, N. J. (2004). Stable isotopes in tree rings. Quat. Sci. Rev. 23, 771–801. doi:10.1016/j.quascirev.2003.06.017
Moser, L., Fonti, P., Büntgen, U., Esper, J., Luterbacher, J., Franzen, J., et al. (2010). Timing and duration of European larch growing season along altitudinal gradients in the Swiss Alps. Tree Physiol. 30, 225–233. doi:10.1093/treephys/tpp108
Nagavciuc, V., Ionita, M., Kern, Z., McCarroll, D., and Popa, I. (2022). A ∼700 years perspective on the 21st century drying in the eastern part of Europe based on δ18O in tree ring cellulose. Commun. Earth and Environ. 3, 277. doi:10.1038/s43247-022-00605-4
Nagavciuc, V., Ionita, M., Perșoiu, A., Popa, I., Loader, N. J., and McCarroll, D. (2019). Stable oxygen isotopes in Romanian oak tree rings record summer droughts and associated large-scale circulation patterns over Europe. Clim. Dyn. 52, 6557–6568. doi:10.1007/s00382-018-4530-7
Nakatsuka, T., Sano, M., Li, Z., Xu, C., Tsushima, A., Shigeoka, Y., et al. (2020). A 2600-year summer climate reconstruction in central Japan by integrating tree-ring stable oxygen and hydrogen isotopes. Clim. Past 16, 2153–2172. doi:10.5194/cp-16-2153-2020
Pang, Z., Kong, Y., Li, J., and Tian, J. (2017). An isotopic geoindicator in the hydrological cycle. Procedia Earth Planet. Sci. 17, 534–537. doi:10.1016/j.proeps.2016.12.135
Roden, J. S., Lin, G., and Ehleringer, J. R. (2000). A mechanistic model for interpretation of hydrogen and oxygen isotope ratios in tree-ring cellulose. Geochimica Cosmochimica Acta 64, 21–35. doi:10.1016/s0016-7037(99)00195-7
Rozanski, K. (1985). Deuterium and oxygen-18 in European groundwaters—links to atmospheric circulation in the past. Chem. Geol. Isot. Geosci. Sect. 52, 349–363. doi:10.1016/0168-9622(85)90045-4
Rozanski, K., Sonntag, C., and Münnich, K. O. (1982). Factors controlling stable isotope composition of European precipitation. Tellus 34, 142–150. doi:10.1111/j.2153-3490.1982.tb01801.x
Rozanski, K., Stichler, W., Gonfiantini, R., Scott, E. M., Beukens, R. P., Kromer, B., et al. (1992). The IAEA 14C intercomparison exercise 1990. Radiocarbon 34, 506–519. doi:10.1017/s0033822200063761
Siegwolf, R. T., Brooks, J. R., Roden, J., and Saurer, M. (2022). “Stable isotopes in tree rings: inferring physiological,” in Climatic and environmental responses.
Sternberg, L., and DeNiro, M. J. (1983). Isotopic composition of cellulose from C3, C4, and CAM plants growing near one another. Science 220, 947–949
Sternberg, L. L. O. (2009). Oxygen stable isotope ratios of tree-ring cellulose: the next phase of understanding. New. Phytologist. 181, 553–562
Szymczak, S., Barth, J., Bendix, J., Huneau, F., Garel, E., Häusser, M., et al. (2020). First indications of seasonal and spatial variations of water sources in pine trees along an elevation gradient in a Mediterranean ecosystem derived from δ18O. Chem. Geol. 549, 119695. doi:10.1016/j.chemgeo.2020.119695
Tappa, D. J., Kohn, M. J., McNamara, J. P., Benner, S. G., and Flores, A. N. (2016). Isotopic composition of precipitation in a topographically steep, seasonally snow-dominated watershed and implications of variations from the global meteoric water line. Hydrol. Process. 30, 4582–4592. doi:10.1002/hyp.10940
Treydte, K., Boda, S., Graf Pannatier, E., Fonti, P., Frank, D., Ullrich, B., et al. (2014). Seasonal transfer of oxygen isotopes from precipitation and soil to the tree ring: source water versus needle water enrichment. New Phytol. 202, 772–783. doi:10.1111/nph.12741
Treydte, K., Schleser, G. H., Esper, J., Andreu, L., Bednarz, Z., Berninger, F., et al. (2006). Climate signals in the European isotope network ISONET. TRACE-Tree Rings Archaeol. Climatol. Ecol. 5. Available at: https://hdl.handle.net/20.500.12259/47260 (Accessed October 25, 2023).
Vitali, V., Martínez-Sancho, E., Treydte, K., Andreu-Hayles, L., Dorado-Liñán, I., Gutierrez, E., et al. (2022). The unknown third–Hydrogen isotopes in tree-ring cellulose across Europe. Sci. Total Environ. 813, 152281. doi:10.1016/j.scitotenv.2021.152281
Vitali, V., Peters, R. L., Lehmann, M. M., Leuenberger, M., Treydte, K., Büntgen, U., et al. (2023). Tree-ring isotopes from the Swiss Alps reveal non-climatic fingerprints of cyclic insect population outbreaks over the past 700 years. Tree Physiol. 43, 706–721. doi:10.1093/treephys/tpad014
Waterhouse, J. S., Switsur, V. R., Barker, A. C., Carter, A. H. C., and Robertson, I. (2002). Oxygen and hydrogen isotope ratios in tree rings: how well do models predict observed values? Earth Planet. Sci. Lett. 201, 421–430. doi:10.1016/s0012-821x(02)00724-0
Xu, C., Huang, R., An, W., Zhao, Q., Zhao, Y., Ren, J., et al. (2024). Tree ring oxygen isotope in Asia. Glob. Planet. Change 232, 104348. doi:10.1016/j.gloplacha.2023.104348
Yakir, D. (1992). Variations in the natural abundance of oxygen-18 and deuterium in plant carbohydrates. Plant, Cell and Environ. 15, 1005–1020. doi:10.1111/j.1365-3040.1992.tb01652.x
Yang, B., Qin, C., Bräuning, A., Osborn, T. J., Trouet, V., Ljungqvist, F. C., et al. (2021). Long-term decrease in Asian monsoon rainfall and abrupt climate change events over the past 6,700 years, Proc. Natl. Acad. Sci. U. S. A. Long-term decrease Asian monsoon rainfall abrupt Clim. change events over past 6,700 years. 118, e2102007118, doi:10.1073/pnas.2102007118
Keywords: global meteoric water line, GMWL, hydrogen stable isotopes, oxygen stable isotopes, paleoclimate, precipitation, tree rings
Citation: Arosio T, Büntgen U, Nicolussi K, Moseley GE, Saurer M, Pichler T, Smith MP, Gutierrez E, Andreu-Hayles L, Hajdas I, Bebchuk T and Leuenberger M (2024) Tree-ring δ18O and δ2H stable isotopes reflect the global meteoric water line. Front. Earth Sci. 12:1440064. doi: 10.3389/feart.2024.1440064
Received: 28 May 2024; Accepted: 18 November 2024;
Published: 16 December 2024.
Edited by:
Nadia Solovieva, University College London, United KingdomReviewed by:
Ichiro Tayasu, Research Institute for Humanity and Nature, JapanSoumaya Belmecheri, University of Arizona, United States
Copyright © 2024 Arosio, Büntgen, Nicolussi, Moseley, Saurer, Pichler, Smith, Gutierrez, Andreu-Hayles, Hajdas, Bebchuk and Leuenberger. This is an open-access article distributed under the terms of the Creative Commons Attribution License (CC BY). The use, distribution or reproduction in other forums is permitted, provided the original author(s) and the copyright owner(s) are credited and that the original publication in this journal is cited, in accordance with accepted academic practice. No use, distribution or reproduction is permitted which does not comply with these terms.
*Correspondence: Tito Arosio, dGl0by5hcm9zaW84N0BnbWFpbC5jb20=