 Hui Zhou
 Jiarong Qing
 Rui Qi
 Xingfu Huang
 Jie Liao
 Rui Gao
- 1School of Earth Sciences and Engineering, Sun Yat-sen University, Zhuhai, China
- 2Department of Mathematical Sciences, Tsinghua University, Beijing, China
- 3College of Earth Sciences, Guilin University of Technology, Guilin, China
- 4Key Laboratory of Deep Earth Exploration Science and Technology, Chinese Academy of Geological Sciences, Beijing, China
- 5State Key Laboratory of Tibetan Plateau Earth System, Environment and Resources (TPESER), Institute of Tibetan Plateau Research, Chinese Academy of Sciences, Beijing, China
The Qilian orogenic belt (QOB) located in the northeast margin of the Tibetan Plateau is featured by remarkable crustal thrusting and shortening, providing a key natural example to understand the lithospheric deformation of the Tibetan Plateau. Two types of continental collision are observed in the QOB: lithosphere subduction beneath Southern Qilian and crust underthrusting of Alxa terrain along the North Border Thrust (NBT). Deep seismic reflection profiles reveal complex stress field evolution, including compressional deformation in the lower crust, extensional deformation in the upper crust, and detachment deformation in the middle crust. In this study, we use 2D numerical modeling to investigate the dynamics of these two different collision types and the evolution of Qilian uplift. Model results suggest three patterns of continental collision, i.e., crust underthrusting follows lithosphere subduction, lithosphere subduction and the failed underthrusting/subduction. The key factors that may influence model evolution, including crustal rheology, convergence direction and rate, are systematically investigated. Our model results are further compared to observations, suggesting that lower convergence rate and crust underthrusting along NBT likely control the uplift and crust stress stratification of the QOB.
1 Introduction
The Qilian orogenic belt (QOB) located in the northeastern margin of the Tibetan Plateau, far from the continental plate margins, is a typical intracontinental orogenic belt. Its geological history can be divided into three main stages: Paleozoic orogeny, Mesozoic peneplanation, and Cenozoic re-uplift. The Cenozoic uplift of the QOB is primarily attributed to the collision between the Indian and Eurasian plates. This continuous convergence with the northward indentation of the Indian plate drives the outward expansion of the Tibetan Plateau (Zhang et al., 2004; Wang et al., 2014; Zheng et al., 2017). The India-Eurasia collision initiated the early deformation in the Qilian Mountains (Yin et al., 2002; Yuan et al., 2013; Cheng et al., 2019; He, 2020), followed by the second collisional event at 20–8 Ma representing the latest crustal shortening and thickening of the Tibetan Plateau (Jolivet et al., 2001; Craddock et al., 2011; Duvall et al., 2013; Wang et al., 2016; 2017; Zheng et al., 2017; Li et al., 2019; Pang et al., 2019). Understanding the lithospheric structures and tectonic evolution of the QOB is essential for understanding the dynamics of the Tibetan Plateau.
High-resolution deep seismic reflection profiles across the Qilian Mountain have demonstrated multi-staged lithospheric structures. Previous studies have presented two significant deep seismic reflection profiles (Figure 1A). The first seismic profile (Figure 1B, MM') located in the Northwestern Qilian Mountain and the Hexi Corridor Basin reveals that the Alxa terrain southward underthrusts along the North Boundary Thrust (NBT) under the Hexi Corridor (Gao et al., 1999; Ye et al., 2015; Huang et al., 2021). The second seismic profile (Figure 1B, NN') crosses the central and Southern Qilian, delineating a significant south-dipping fault (Haiyuan Fault) in the mantle lithosphere, which is related to the subduction and closure of the North Qilian Ocean in the Late Paleozoic. This fault was reactivated due to the northward indentation of the Indian plate during the Cenozoic, facilitating lithosphere subduction along the fault and contributing to the uplift of the Qilian Mountains. Under the plate convergence of the Indian plate and Alxa block, the Southern and northern margins of the QOB are undergoing intensive crustal shortening (Hao et al., 2021; Huang et al., 2021; Gao et al., 2022), featured by decoupled deformation between the upper and lower crust, i.e., the upper crust is migrating outward while the lower crust is shortening (Liu et al., 2021; Liu et al., 2023).
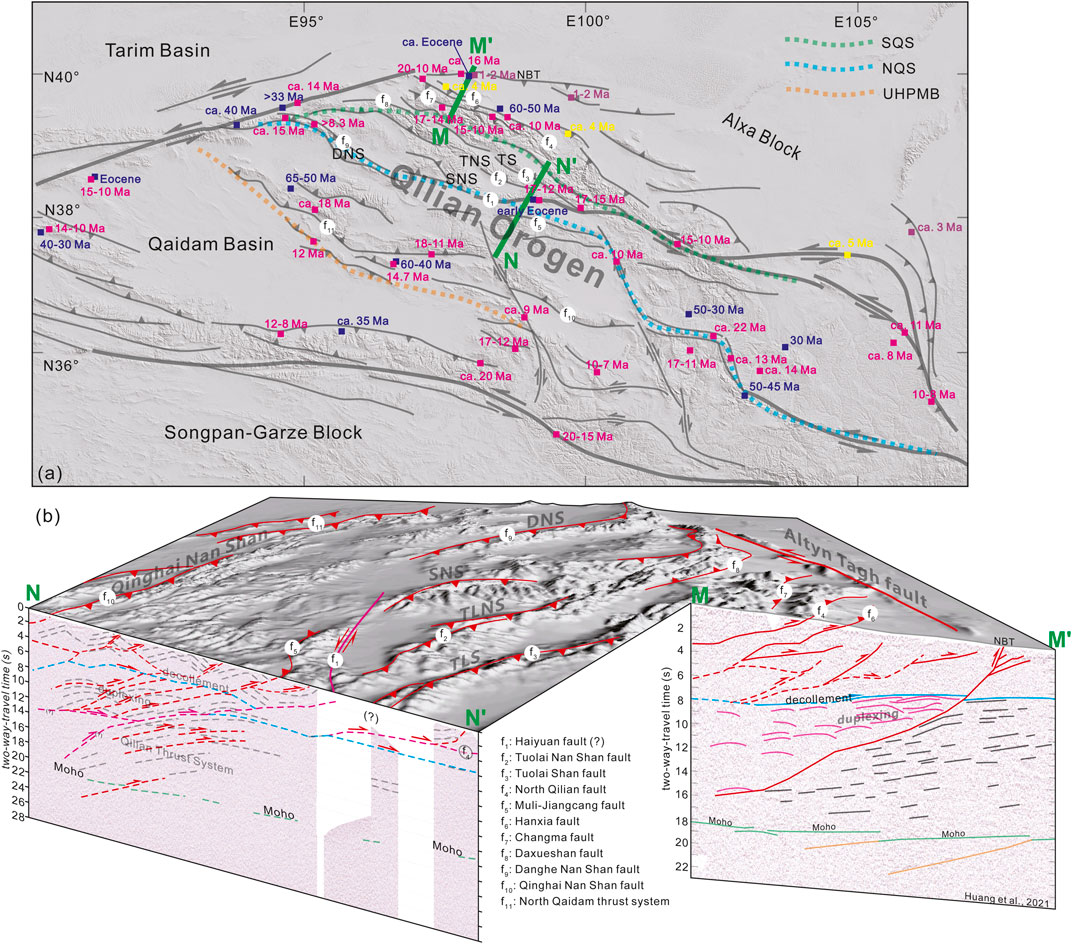
Figure 1. Geological settings and lithospheric structures of the QOB. (A) Geological background with the ages indicating surface uplift events (uplift ages from Pang et al. (2019) and references therein). The locations of the two deep seismic reflection profiles are shown (Green lines). TS: Tuolai Shan; TNS: Tuolai Nan Shan; SNS, Shule Nan Shan; DNS, Danghe Nan Shan. (B) Deep seismic reflection profiles revealed lithosphere subduction (NN') and crust underthrusting (MM') in the south and north of the QOB, respectively (Gao et al., 2022).
Based on the lithospheric structure revealed by deep seismic reflection profiles, the Qilian orogen may have experienced lithosphere subduction and crust underthrusting simultaneously. Lithosphere subduction is associated with the re-activation of faults caused by the closure of the North Qilian Ocean. Crust underthrusting caused by southward underthrusting of the Alxa block beneath the Qilian Mountains (Figure 1B). And when the continental collision, the QOB may has experienced two stages of uplift during the Cenozoic. However, the processes by which these two types of continental collision occur in the QOB, the pattern of the QOB uplift, and the formation of crust stratification remain obscure. This study aims to answer this question by linking detailed lithospheric structures revealed by deep seismic reflection profiles to geodynamical modeling. 2D thermos-mechanical models are employed to investigate intracontinental thrusting/subduction based on the QOB.
2 Methods
2.1 Numerical method
We use the 2D thermo-mechanical coupled geodynamic numerical code I2VIS to simulate continental collision (Gerya and Yuen, 2003). Finite differences and marker-in-cell techniques are used in the code to solve the conservation equations for mass, momentum and energy:
where
In this study, the visco-plastic rheology is applied. The non-Newtonian viscous rheology is strain rate-, pressure-, and temperature-dependent. Plastic rheology is described by a Drucker–Prager yield criterion, where the yield stress (
See further explanation of variables/symbols in Table 1.
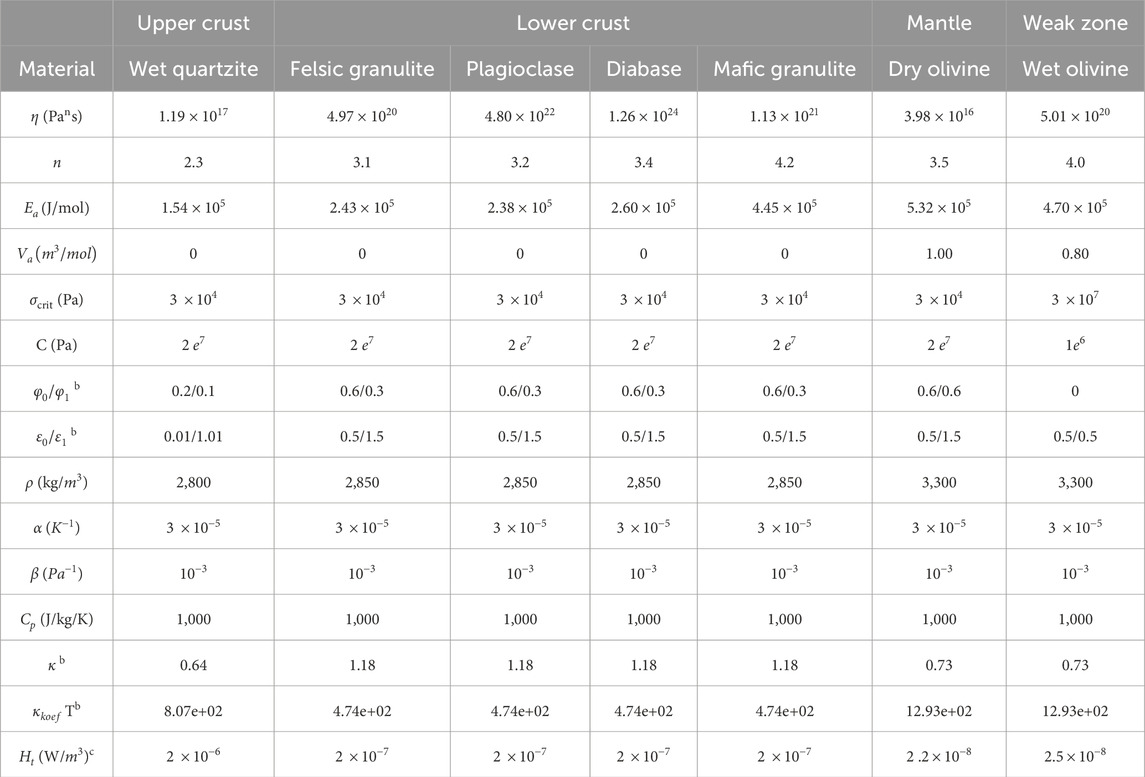
Table 1. Material parameters used in the numerical experiments. aFlow laws: from (Kirby and Kronenberg, 1987; Wilks and Carter, 1990; Ranalli, 1995; Afonso and Ranalli, 2004) bHeat conductivity is from Clauser and Huenges (1995). cRadioactive heating is from Turcotte and Schubert (2002).
2.2 Model setup
The initial model setup is shown in Figure 2. The model size is 2,500 km × 450 km, consisting of 401 × 151 numerical nodes distributed unevenly with the highest resolution in the center of the model domain. The grid spacing decreases linearly from 20 km at the edge of the box to 2 km in the center and increases from 1 km at the top to 5 km at the bottom of the model. The model has several layers, from top to bottom: “sticky air”, continental crust, mantle lithosphere, and asthenosphere. The crust and mantle lithosphere are 40 km and 80 km thick, respectively, as observed in the Qilian region (Ye et al., 2015; Huang et al., 2021; Ye et al., 2021). With fixed crust thickness, the lower crust thickness is gradually increased from 10, 15, 20, to 25 km. A crustal-scale weak zone was established on the right side of the model to represent the NBT (Figure 1B, profile MM'; Figure 2), and a lithospheric-scale weak zone is incorporated into the model on the left side (Figure 1B, profile NN'; Figure 2). These two weak zones are set up based on deep seismic observations and previous studies (Gao et al., 2022).
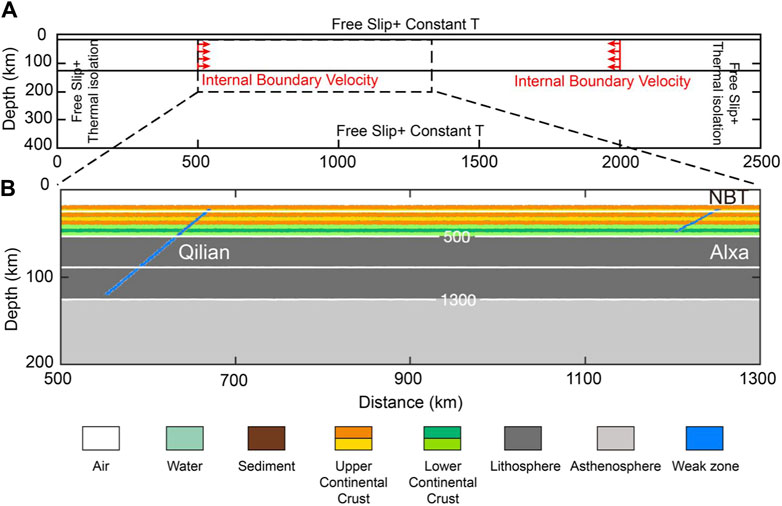
Figure 2. Initial model setup. (A) Boundary condition setup. (B) Lithological layers are shown by colors. Oblique weak zones are imposed representing pre-existing crustal faulting zones. White lines are isotherms with an interval of 400°C. The velocity and temperature boundary conditions are labeled in the figure.
We set a 20 km thick layer with ‘sticky air' at the top of the model domain, approximating the free surface. Our surface process is highly simplified and uses gross-scale erosion/sedimentation rates which are independent of local elevation and topography slopes (Burov and Cloetingh, 1997). We use a moderate erosion/sedimentation rate (0.315 mm/yr) which falls within naturally observed ranges.
Velocity boundary conditions are free-slip on all boundaries. We prescribed internal boundary velocities to drive plate convergence (Figure 2A). The initial temperature distribution of the lithosphere is uniform and zero-flux across the vertical boundaries. The initial temperatures on the crustal surface, Moho, and the lithosphere-asthenosphere boundary (LAB) are 0°C, 450°C, and 1,300°C, respectively. Temperature increases linearly in the crust and mantle lithosphere. Beneath the LAB, the temperature gradient is prescribed as 0.5°C/km.
3 Model results
We conduct a series of models to simulate the continental collision along the imposed pre-existing weak zones. Based on the model results, three patterns of continental collision are recognized: 1) crust underthrusting follows the lithosphere subduction, 2) lithosphere subduction, and 3) failed underthrusting/subduction.
3.1 Crust underthrusting follows the lithosphere subduction
The first pattern is characterized by two modes of continental collision (Figure 3), i.e., lithosphere subduction initiated first beneath Southern Qilian and crust underthrusting of Alxa terrain along the NBT. In the beginning, strain localized along two pre-existing weak zones, and the lithosphere subduction forms quickly. Under continuous convergence, the thrust fault around NBT evolves to the crust underthrusting (Figure 3A). A remarkable feature of this pattern is the decoupled deformation between the upper and lower crust. The upper crust migrates northward and shortens significantly, while the lower crust slowly moves (Figure 3B), analogous to natural observations (Huang et al., 2018).
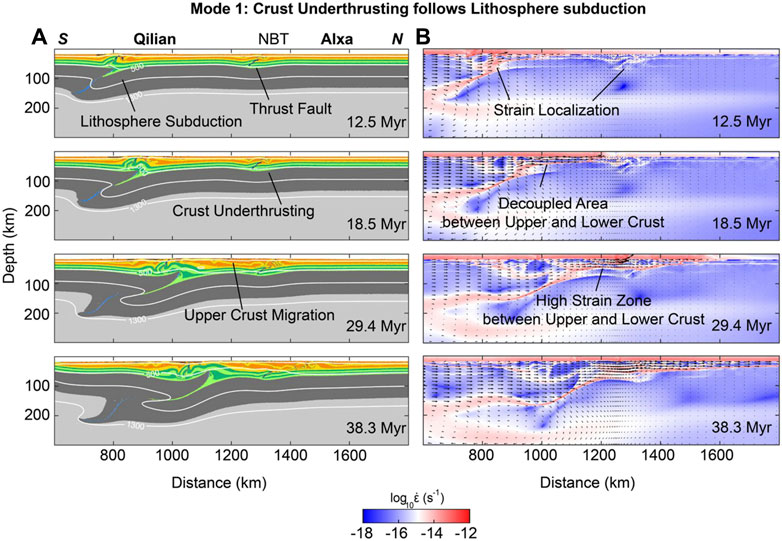
Figure 3. Typical evolution of crust underthrusting follows lithosphere subduction (Mode 1). (A) Composition fields show the lithospheric deformation (color coding refers to Figure 2). (B) Model evolution shown by strain rate. White lines represent isotherms with a temperature interval of 400°C.
3.2 Lithosphere subduction
By testing different lower crust strengths, such as decreasing lower crust thickness will be weaker and more mafic rheology will be stronger, we obtain the Mode 2 models. This pattern only shows one lithosphere subduction. In terms of the subduction initiates along which pre-existing weak zone, we categorized the models into Mode 2A and Mode 2B. Mode 2A and 2B show the lithosphere subduction beneath Southern Qilian or NBT, respectively (Figures 4, 5). Compared to the Mode 1, strain localized rapidly along pre-existing weak zones. When the strain is localized successfully in one of those weak zones, negligible deformation will be observed in the other weak zones.
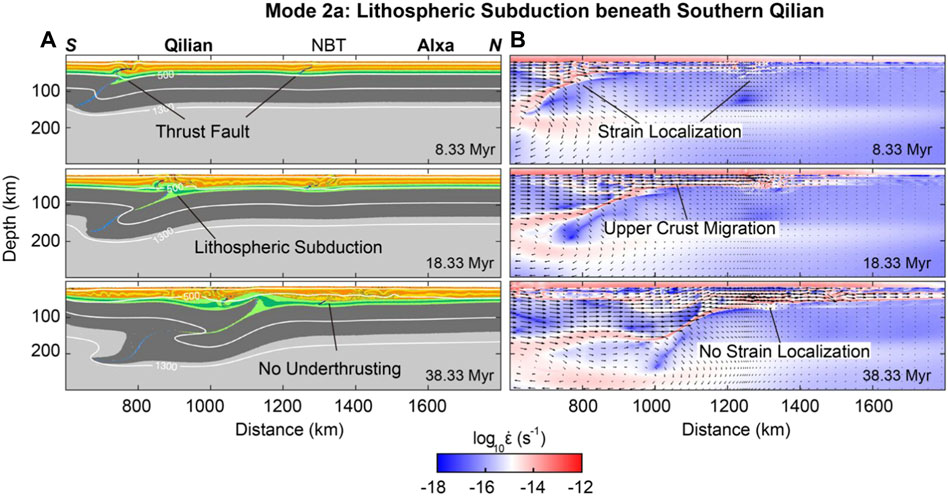
Figure 4. Typical evolution of lithosphere subduction beneath Souther Qilian (Mode 2a). (A) Composition fields show the lithospheric deformation (color coding refers to Figure 2). (B) Model evolution shown by strain rate. White lines represent isotherms with a temperature interval of 400°C.
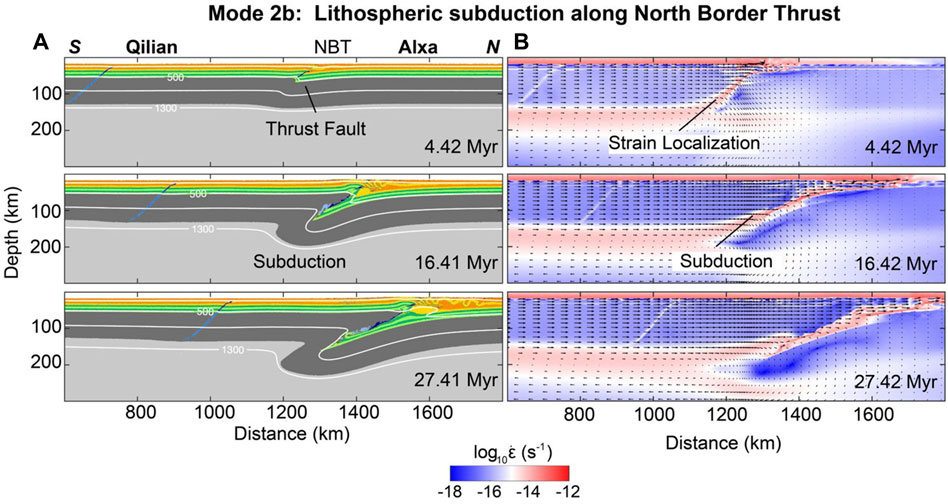
Figure 5. Typical evolution of lithosphere subduction along NBT. (A) Composition fields show the lithospheric deformation (color coding refers to Figure 2). (B) Model evolution shown by strain rate. White lines represent isotherms with a temperature interval of 400°C.
3.3 Failed crust underthrusting/lithosphere subduction
A few models failed to generate underthrusting/subduction. The typical evolution of this mode is shown in Figure 6. In the early stage, strain localized and formed thrusting faults near the NBT due to the strong lower crust (Figure 6A). However, with further model evolution, it fails to form underthrusting/subduction, instead, it forms lithospheric thickening due to two-sided convergence. Crustal deformation is also seen in Southern Qilian, mainly because subduction fails to initiate along the NBT. Compared with the subduction cases, failed cases are mainly promoted by a lower convergence rate and weak continental crust (Figure 7).
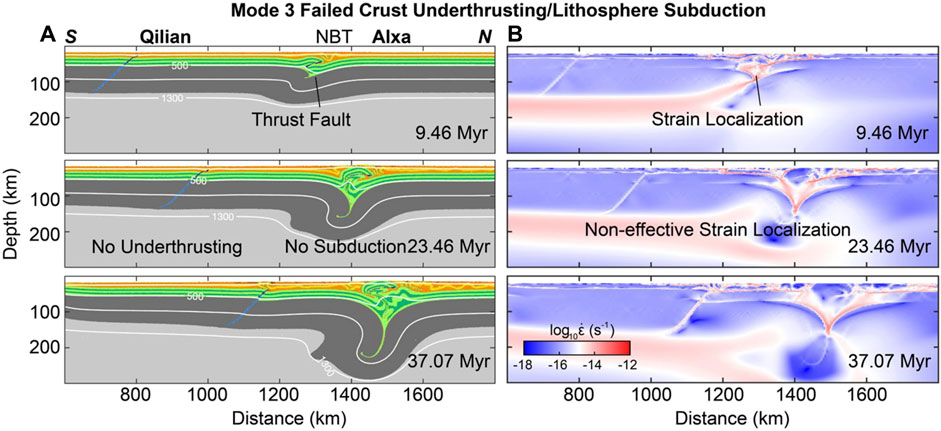
Figure 6. Typical evolution of failed underthrusting and subduction cases. (A) Composition fields show the lithospheric deformation (color coding refers to Figure 2). (B) Model evolution shown by strain rate. White lines represent isotherms with a temperature interval of 400°C.
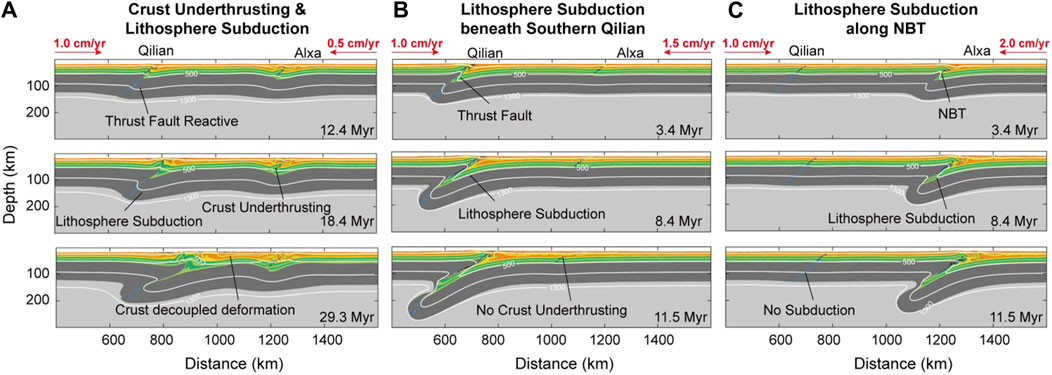
Figure 7. Three evolution models of stress field under two-sided convergence condition. (A) Crust underthrusting and Lithosphere subduction. Lithosphere subduction (B) beneath Southern Qilian or (C) along NBT.
3.4 Two-sided convergence
Based on the aforementioned models with one-sided plate convergence, we increase the right plate velocities to investigate the effect of two-sided convergence (Figure 7). We increase the right plate velocities to the aforementioned model results, three types of model evolution are observed in this set of models, i.e., crust underthrusting follows the lithosphere subduction, lithosphere subduction, and failed underthrusting/subduction. However, changes in lithospheric deformation due to double-direction convergence are still observed. The right plate velocity dramatically affects model evolution. Lower right plate velocities and relatively lower convergence rates favor the crust underthrusting form, which follows the lithosphere subduction (Figure 7A). While higher right plate velocities and a large convergence rate from the right boundary promote the formation of lithosphere subduction (Figures 7B, C).
3.5 Model parameter effect
The thickness of the crust and the rheological properties of the lower crust can influence the initiation of intracontinental subduction (Huangfu et al., 2018). We systematically tested the crustal strength by varying the thickness and rheology of the lower crust (Figure 8A). In our model, the total crustal thickness is constant (i.e., 40 km), while the tested lower crustal thickness gradually changes from 10, 15, 20, and 25 km. Besides, varied lower crustal rheology (i.e., felsic granulite, plagioclase, diabase, mafic granulite) is tested. Model results show that crustal strength affects the pattern of intracontinental subduction. The formation of Mode 1 or 2 depends on strain localization, i.e., occurring fast in Southern Qilian or along the NBT. With a weak lower crust, characterized by a thin lower crust and felsic rheology, models favor the formation of crust underthrusting following lithosphere subduction. In such models, strain localization is hard to form along the NBT, resulting in a relatively more distributed stress distribution. With continuous plate convergence, deformation concentrates along the Qilian faulting zone, initiating intracontinental subduction and prompting the migration of crustal shortening into the plate's interior. On the contrary, with high crustal strength, characterized by more mafic and thicker lower crust, lithospheric deformation is prone to localize in the NBT, resulting in lithosphere subduction.
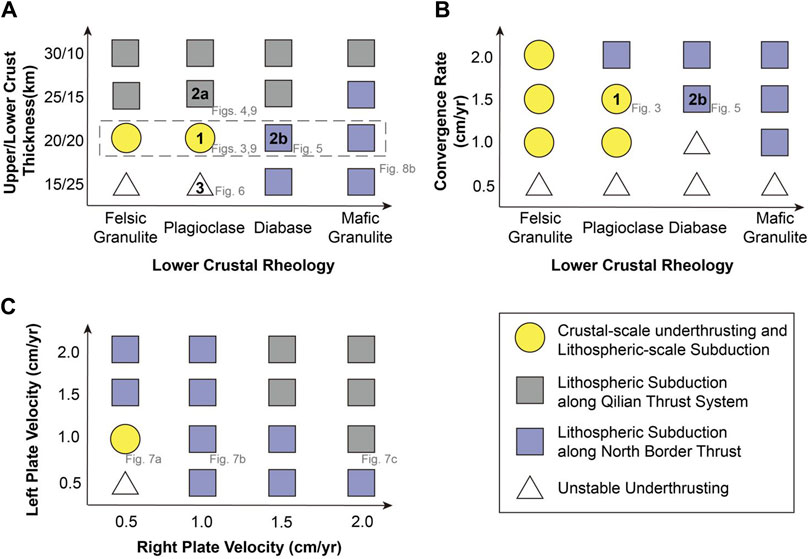
Figure 8. Model results influenced by different model parameters. (A) Regime diagram illustrates the impact of lower crustal rheology and upper/lower crustal thickness on model evolution. Upper crustal rheology is prescribed by wet quartz in these models. A fixed convergence rate of 1.5 cm/yr is set on the left plate. (B) Regime diagram showing the effect of convergence rate. (C) Regime diagram showing the effect of double direction convergence. Convergence rates are tested by changing the plate velocities.
The convergence rate of Indian plate subduction is 5–20 cm/yr (Pusok and Stegman, 2020). Previous study indicates that the southward underthrusting of Alxa terrane influences the QOB. However, the magnitude of underthrusting influence has not yet been determined. And high convergence rate will promote strain localization and will influence shear heating (Faccenda et al., 2008), which may influence the intracontinental underthrusting. Thus, to systematically test the influence of convergence rate, we change the internal boundary velocity to test varied convergence rates 1, 1.5, 2.0, and 2.5 cm/yr with a lower crust thickness of 20 km. The model results are shown in Figure 8B. With the convergence rate of 0.5 cm/yr, strain localization becomes difficult and fails to form underthrusting/subduction in the models. Increase the convergence rate, crust underthrusting occurs in the models. When we use more mafic lower crust, with the same convergence rate, the lithosphere subduction occurs.
Different directions of convergence result in different deformation patterns and different subduction polarities (Mishin et al., 2008; Liu et al., 2024a; Liu et al., 2024b). In the additional models with two-sided plate convergence, the right plate velocities are systematically tested while the left plate velocities maintain constant (Figures 2A, 8C). Modeling results show that as the convergence rate increases, the position of lithosphere subduction initiation shifts from the NBT to the Qilian Thrust system (Figure 8C). However, the crust underthrusting following lithosphere subduction is difficult to form, and only one tested model forms this deformation type. Thus, compared to the single-direction convergence models, the models with two-sided plate convergence do not favor the formation of crust underthrusting along NBT following lithosphere subduction, and thus could not be applied to the QOB.
4 Discussion
4.1 Model comparison
We compare model results through topography and stress fields (Figure 9). The regions dominated by extensional or compressional stress are distinguished in the plots. In the early stage of these two modes, strain localized along pre-existing weak zones, compressional stress dominates all mode types (Figures 9B, G). When lithosphere subduction initiates along the Southern Qilian, the upper crust shows extensional stress and starts to migrate (Figures 9C, D). When the crust underthrusting along NBT, Mode 1 shows significant crustal stress stratification, but Mode 2a does not (Figures 9D, I). The notable difference is the lower crust compressional stress state and the shortening deformation, which indicates the main reason for crustal stress stratification is crust underthrusting. Moreover, the topographic uplift of the Mode 1 is relatively higher than Mode 2a. Differences in topography are mainly due to the shortening of lower crust. Compared with the observation of deep seismic reflection profiles (Figure 1), the evolution of Mode 1 is similar to the deformation pattern of the QOB.
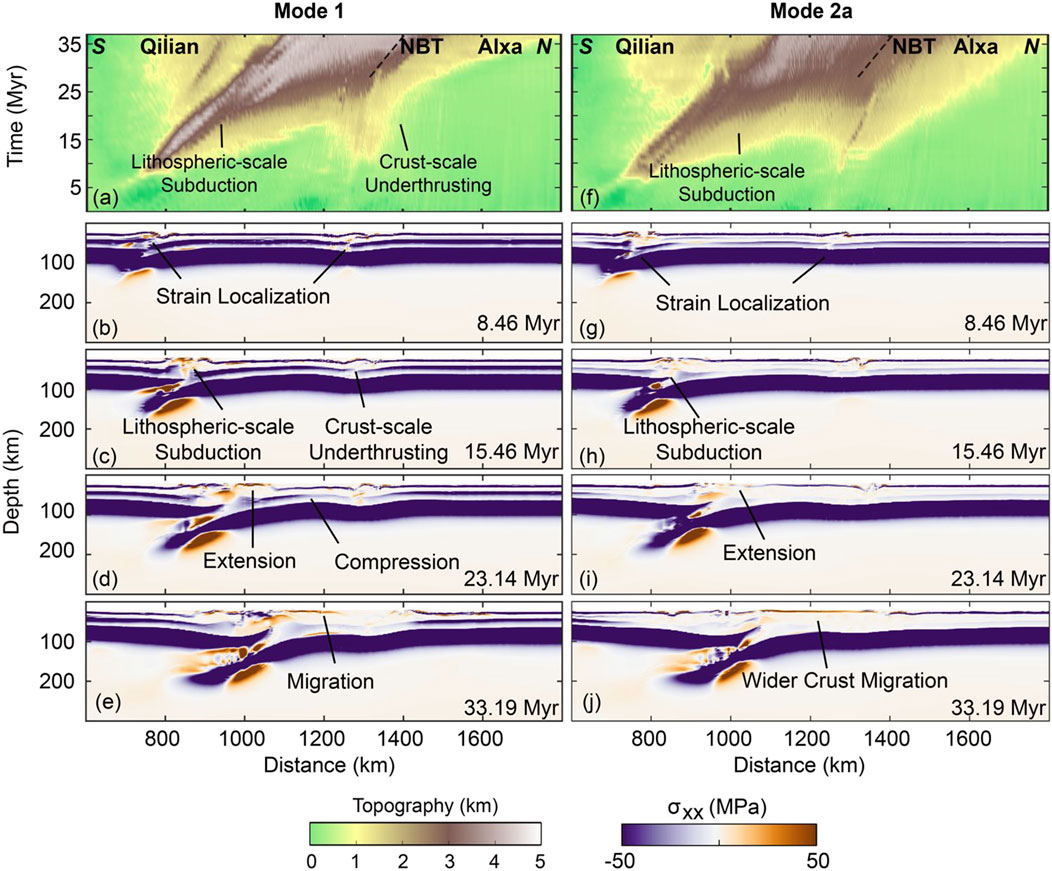
Figure 9. Reference Mode 1 and Mode 2a comparison through topography and stress fields. (A–E) Crust underthrusting follows lithosphere subduction (Mode 1). (F–J) Lithosphere subduction beneath Southern Qilian (Mode 2a). Lower crustal rheology is prescribed by plagioclase but with varied thickness of lower crust. A fixed convergence rate of 1.5 cm/yr is set on the left plate.
4.2 Comparison between simulation and observation
The tectonic uplift and evolution history of the Qilian Mountain can be explained based on the model results. Following the closure of the Proto-Tethys Ocean and the commencement of continental collision, the interior of the Tibetan Plateau was subjected to the northward indentation of the Indian Plate (Figure 10A). The far-field compression stress exerted by the Indian plate led to the reactivation of two pre-existing faults. Subsequently, lithosphere subduction initiated beneath the Southern Qilian, and crust underthrusting occurred along the NBT (Figure 10B). The processes of underthrusting and subduction result in significant uplift in the Qilian Mountains. In the absence of the Alxa terrain underthrusting, the uplift of the Qilian Mountains would be significantly reduced (Figure 9). Accordingly, based on the model results, the crust underthrusting favors the uplift and the crust stress stratification. Besides, our model results suggest that the multiple intracontinental subduction in the Qilian orogenic belt primarily results from plate convergence from the south.
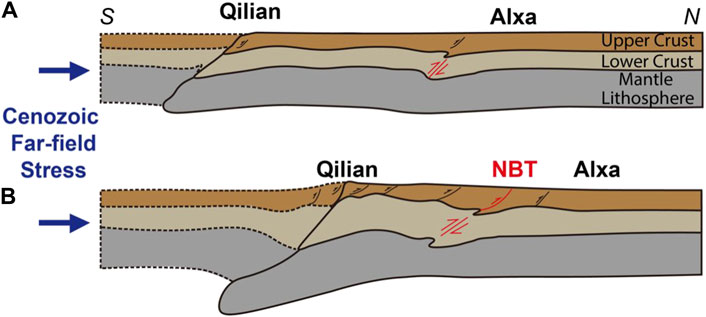
Figure 10. Schematic diagram showing two types of continental collision in the QOB (A) Lithosphere subduction initiated beneath Southern Qilian. (B) Crust underthrusting along the NBT.
5 Conclusion
Based on the constraints from the deep seismic reflection profiles of the QOB, we conducted a 2D thermo-mechanical coupled numerical modeling. We investigate continental collision and surface uplift in the Qilian Mountain from the Cenozoic. We obtained the following conclusions.
(1) Three patterns of continental collision are recognized, i.e., crust underthrusting follows lithosphere subduction, lithosphere subduction beneath Southern Qilian or along NBT, and failed underthrusting/subduction.
(2)The controlling effect of crustal rheology on model evolution was recognized, i.e., the felsic lower crust promotes the formation of crust underthrusting following lithosphere subduction. A lower convergence rate allows the crust to underthrust along NBT.
(3) Two-sided convergence influences the model evolution. A lower convergence rate from the right plate favors the crust underthrusting along NBT, which indicates that the uplift of the QOB is likely driven by southern compressional convergence.
(4) The presence of crust underthrusting along NBT leads to the crustal stress stratification between the upper and lower crust. And crust underthrusting along NBT promotes the uplift of the QOB.
Data availability statement
The original contributions presented in the study are included in the article/supplementary material, further inquiries can be directed to the corresponding authors.
Author contributions
HZ: Writing–original draft, Writing–review and editing, Data curation, Formal Analysis, Methodology. JQ: Data curation, Methodology, Writing–original draft. RQ: Data curation, Writing–review and editing, Methodology. XH: Data curation, Writing–review and editing, Formal Analysis. JL: Supervision, Writing–review and editing, Methodology. RG: Funding acquisition, Methodology, Supervision, Writing–review and editing.
Funding
The author(s) declare that financial support was received for the research, authorship, and/or publication of this article. This work was financially supported by the Second Tibetan Plateau Scientific Expedition and Research Program (STEP) [Grant numbers 2019QZKK0701]; the National Natural Science Foundation of China [Grant numbers 41904083, 41590683]; and the Pearl River Talent Recruitment Program of Guangdong Province, China [Grant number 2017ZT07Z066].
Acknowledgments
We thank the anonymous reviewer for their constructive comments and suggestions.
Conflict of interest
The authors declare that the research was conducted in the absence of any commercial or financial relationships that could be construed as a potential conflict of interest.
Publisher’s note
All claims expressed in this article are solely those of the authors and do not necessarily represent those of their affiliated organizations, or those of the publisher, the editors and the reviewers. Any product that may be evaluated in this article, or claim that may be made by its manufacturer, is not guaranteed or endorsed by the publisher.
References
Afonso, J. C., and Ranalli, G. (2004). Crustal and mantle strengths in continental lithosphere: is the jelly sandwich model obsolete? Tectonophysics 394 (3–4), 221–232. doi:10.1016/j.tecto.2004.08.006
Burg, J.-P., and Gerya, T. V. (2005). The role of viscous heating in Barrovian metamorphism of collisional orogens: thermomechanical models and application to the Lepontine Dome in the Central Alps. J. Metamorph. Geol. 23 (2), 75–95. doi:10.1111/j.1525-1314.2005.00563.x
Burov, E., and Cloetingh, S. (1997). Erosion and rift dynamics: new thermomechanical aspects of post-rift evolution of extensional basins. Earth Planet. Sci. Lett. 150 (1), 7–26. doi:10.1016/S0012-821X(97)00069-1
Cheng, F., Garzione, C. N., Mitra, G., Jolivet, M., Guo, Z., Lu, H., et al. (2019). The interplay between climate and tectonics during the upward and outward growth of the Qilian Shan orogenic wedge, northern Tibetan Plateau. Earth-Sci Rev. 198, 102945. doi:10.1016/j.earscirev.2019.102945
Clauser, C., and Huenges, E. (1995). Thermal conductivity of rocks and minerals. Christoph Clauser Ernst Huenges 23.
Craddock, W., Kirby, E., and Zhang, H. (2011). Late Miocene-Pliocene range growth in the interior of the northeastern Tibetan Plateau. Lithosphere 3, 420–438. doi:10.1130/l159.1
Duvall, A. R., Clark, M. K., Kirby, E., Farley, K. A., Craddock, W. H., Li, C., et al. (2013). Low-temperature thermochronometry along the Kunlun and Haiyuan faults, NE Tibetan Plateau: evidence for kinematic change during late-stage orogenesis. Tectonics 32, 1190–1211. doi:10.1002/tect.20072
Faccenda, M., Gerya, T. V., and Chakraborty, S. (2008). Styles of post-subduction collisional orogeny: influence of convergence velocity, crustal rheology and radiogenic heat production. Lithos 103 (1–2), 257–287. doi:10.1016/j.lithos.2007.09.009
Gao, R., Cheng, X., and Wu, G. (1999). “Lithospheric structure and geodynamic model of the Golmud-Ejn transect in northern Tibet,” in Himalaya and tibet: mountain roots to mountain tops. Editors A. Macfarlane, R. B. Sorkhabi, and J. Quade (Boulder, CO: Geological Society of America).
Gao, R., Qi, R., Huang, X., Chen, X., Xiong, X., Guo, X., et al. (2022). Disclosure of high-resolution crustal structure beneath the central region of Qilian Shan, northeastern Tibetan Plateau. Chin. J. Geophys. 65 (8), 2857–2871.
Gerya, T. V., and Yuen, D. A. (2003). Characteristics-based marker-in-cell method with conservative finite-differences schemes for modeling geological flows with strongly variable transport properties. Phys. Earth Planet. Interiors 140 (4), 293–318. doi:10.1016/j.pepi.2003.09.006
Hao, S., Huang, Z., Han, C., Wang, L., Xu, M., Mi, N., et al. (2021). Layered crustal azimuthal anisotropy beneath the northeastern Tibetan Plateau revealed by Rayleigh-wave Eikonal tomography. Earth Planet. Sci. Lett. 563, 116891. doi:10.1016/j.epsl.2021.116891
He, C. (2020). Upwelling mantle plume and lithospheric delamination beneath the North China Craton. Phys. Earth Planet. Interiors 306, 106548. doi:10.1016/j.pepi.2020.106548
Huang, X., Gao, R., Guo, X., Li, W., and Xiong, X. (2018). Deep crustal structure beneath the junction of the Qilian Shan and Jiuxi Basin in the northeastern margin of the Tibetan Plateau and its tectonic implications. Chin. J. Geophys. (in Chinese) 61 (9), 3640–3650. doi:10.6038/cjg2018L0632
Huang, X., Gao, R., Li, W., and Xiong, X. (2021). Seismic reflection evidence of crustal duplexing and lithospheric underthrusting beneath the western Qilian Mountains, northeastern margin of the Tibetan Plateau. Sci. China Earth Sci. 64 (1), 96–109. doi:10.1007/s11430-020-9677-y
Huangfu, P., Li, Z.-H., Gerya, T., Fan, W., Zhang, K.-J., Zhang, H., et al. (2018). Multi-terrane structure controls the contrasting lithospheric evolution beneath the western and central–eastern Tibetan plateau. Nat. Commun. 9 (1), 3780. doi:10.1038/s41467-018-06233-x
Jolivet, M., Brunel, M., Seward, D., Xu, Z., Yang, J., Roger, F., et al. (2001). Mesozoic and Cenozoic tectonics of the northern edge of the Tibetan Plateau: fission-track constraints. Tectonophysics 343, 111–134. doi:10.1016/s0040-1951(01)00196-2
Kirby, S. H., and Kronenberg, A. K. (1987). Rheology of the lithosphere: selected topics. Rev. Geophys. 25 (6), 1219–1244. doi:10.1029/RG025i006p01219
Li, S., Yin, C., Guilmette, C., Ding, L., and Zhang, J. (2019). Birth and demise of the bangong-nujiang tethyan ocean: a review from the gerze area of central tibet. Earth-Science Rev. 198, 102907. doi:10.1016/j.earscirev.2019.102907
Liu, L., Cao, Z., Morgan, J. P., Li, H.-Y., Yang, F., and Xu, Y.-G. (2024a). Long-lived Northern Hemisphere convergence systems driven by upper-mantle thermal inhomogeneity. Geology 52 (5), 373–378. doi:10.1130/G51948.1
Liu, L., Liu, L., Morgan, J. P., Xu, Y.-G., and Chen, L. (2023). New constraints on cenozoic subduction between India and tibet. Nat. Commun. 14 (1), 1963. doi:10.1038/s41467-023-37615-5
Liu, L., Liu, L., and Xu, Y. (2021). Intermittent post paleocene continental collision in south asia. Geophys. Res. Lett. 48 (14), e2021GL094531. doi:10.1029/2021GL094531
Liu, L., Liu, L., Xu, Y.-G., and Morgan, J. P. (2024b). Intermittent terrane arrival induces pulses of inland tectonic cycles. Earth Planet. Sci. Lett. 641, 118861. doi:10.1016/j.epsl.2024.118861
Mishin, Y. A., Gerya, T. V., Burg, J.-P., and Connolly, J. A. D. (2008). Dynamics of double subduction: numerical modeling. Phys. Earth Planet. Interiors 171 (1–4), 280–295. doi:10.1016/j.pepi.2008.06.012
Pang, J., Yu, J., Zheng, D., Wang, W., Ma, Y., Wang, Y., et al. (2019). Neogene expansion of the qilian Shan, north tibet: implications for the dynamic evolution of the Tibetan plateau. Tectonics 38 (3), 1018–1032. doi:10.1029/2018TC005258
Pusok, A. E., and Stegman, D. R. (2020). The convergence history of India-Eurasia records multiple subduction dynamics processes. Sci. Adv. 6 (19), eaaz8681. doi:10.1126/sciadv.aaz8681
Wang, C., Dai, J., Zhao, X., Li, Y., Graham, S. A., He, D., et al. (2014). Outward-growth of the Tibetan plateau during the cenozoic: a review. Tectonophysics 621, 1–43. doi:10.1016/j.tecto.2014.01.036
Wang, W., Zheng, W., Zhang, P., Li, Q., Kirby, E., Yuan, D., et al. (2017). Expansion of the Tibetan plateau during the neogene. Nat. Commun. 8 (1), 15887. doi:10.1038/ncomms15887
Wang, W. T., Zhang, P. Z., Yu, J. X., Wang, Y. Z., Zheng, D. W., Zheng, W. J., et al. (2016). Constraints on mountain building in the northeastern Tibet: detrital zircon records from synorogenic deposits in the Yumen Basin. Sci. Rep. 6, 27604. doi:10.1038/srep27604
Wilks, K. R., and Carter, N. L. (1990). Rheology of some continental lower crustal rocks. Tectonophysics 182 (1–2), 57–77. doi:10.1016/0040-1951(90)90342-6
Ye, Z., Gao, R., Lu, Z., Yuan, Z., Xiong, X., Li, W., et al. (2021). A lithospheric-scale thrust-wedge model for the formation of the northern Tibetan plateau margin: evidence from high-resolution seismic imaging. Earth Planet. Sci. Lett. 574, 117170.
Ye, Z., Gao, R., Li, Q., Zhang, H., Shen, X., Liu, X., et al. (2015). Seismic evidence for the North China plate underthrusting beneath northeastern Tibet and its implications for plateau growth. Earth Planet. Sci. Lett. 426, 109–117. doi:10.1016/j.epsl.2015.06.024
Yin, A., Rumelhart, P. E., Butler, R., Cowgill, E., Harrison, T. M., Foster, D. A., et al. (2002). Tectonic history of the Altyn Tagh fault system in northern Tibet inferred from Cenozoic sedimentation. Geol. Soc. Am. Bull. 114, 1257–1295. doi:10.1130/0016-7606(2002)114<1257:thotat>2.0.co;2
Yuan, D. Y., Ge, W. P., Chen, Z. W., Li, C. Y., Wang, Z. C., Zhang, H. P., et al. (2013). The growth of northeastern Tibet and its relevance to large-scale continental geodynamics: a review of recent studies. Tectonics 32, 1358–1370. doi:10.1002/tect.20081
Zhang, P.-Z., Shen, Z., Wang, M., Gan, W., Bürgmann, R., Molnar, P., et al. (2004). Continuous deformation of the Tibetan Plateau from global positioning system data. Geology 32 (9), 809. doi:10.1130/G20554.1
Keywords: Qilian orogenic belt, lithosphere subduction, crust underthrusting, deep seismic reflection profile, geodynamic numerical modeling
Citation: Zhou H, Qing J, Qi R, Huang X, Liao J and Gao R (2024) Geodynamic modeling on continental collision in Qilian orogenic belt. Front. Earth Sci. 12:1456165. doi: 10.3389/feart.2024.1456165
Received: 28 June 2024; Accepted: 07 August 2024;
Published: 20 August 2024.
Edited by:
Xintong Dong, Jilin University, ChinaReviewed by:
Yangming Wu, Shantou University, ChinaLiang Liu, Chinese Academy of Sciences (CAS), China
Copyright © 2024 Zhou, Qing, Qi, Huang, Liao and Gao. This is an open-access article distributed under the terms of the Creative Commons Attribution License (CC BY). The use, distribution or reproduction in other forums is permitted, provided the original author(s) and the copyright owner(s) are credited and that the original publication in this journal is cited, in accordance with accepted academic practice. No use, distribution or reproduction is permitted which does not comply with these terms.
*Correspondence: Rui Qi, cWlydWk5QHRzaW5naHVhLmVkdS5jbg==; Rui Gao, Z2FvcnVpNjZAbWFpbC5zeXN1LmVkdS5jbg==