 Jiakai Gu
 Yanmin Ma2
 Yutao Huang
- 1Heilongjiang Province Key Laboratory of Geographical Environment Monitoring and Spatial Information Ser-vice in Cold Regions, Harbin Normal University, Harbin, China
- 2Remote Sensing Application Server, Institute of Meteorological Sciences of Jilin Province, Changchun, China
Under the backdrop of climate warming and changes in snow cover area, the spatial fragmentation characteristics of snow cover need to be studied in depth. In this study, we analyzed the spatial and temporal change patterns of the snow cover area and explored the changing characteristics of its spatial fragmentation in Northeast China from 1980 to 2019 using the “China AVHRR Daily Cloudless 5 km Snow Area Product Dataset.” The findings indicate that the mean stable snow cover area in Northeast China from 1980 to 2019 was 79.41 × 10⁴ km2 (±14.47 × 10⁴ km2), with no significant changes observed since the 1980s. However, compared to the 1980s, mountainous areas such as the Changbai Mountain and Lesser Khingan Mountain regions were identified as the main areas of snow cover recession. The mean patch size (MPS), largest pach index (LPI) and patch size coefficient of variation (PSCV) for spatial fragmentation from 1980 to 2019 showed the following rates of change of −1.06 × 10⁴ km2/10 a (p < 0.05), −1.04%/10 a (p > 0.05), and 71.6%/10 a (p < 0.05), respectively. The spatial continuity of snow fragmentation in Northeast China has significantly increased, with fragmentation showing significant growth. From 2010 to 2019, the spatial fragmentation of snow cover in Northeast China increased by 50% compared to the 1980–1989 period. This paper suggests that the increase in temperature is the major factor leading to the fragmentation of snow cover. The main contribution of this paper is the analysis of the change characteristics of the spatial fragmentation in regional snow cover.
1 Introduction
Snow cover is considered a key indicator of climate change because of its high albedo and low thermal conductivity, which affect surface radiation equilibrium, and it is highly sensitivity and responds rapidly to environmental changes (Déry and Brown, 2007; Fu et al., 2017). Thus, snow cover plays a key role in the global climate system. It has been pointed out that climate change on any scale will lead to fluctuations in snow resources (Li, 1999), and the impact of climate on snow cover will be reflected first and foremost in changes in the snow cover area (Bulygina et al., 2009).
Currently, the world is heading toward 2–3°C of global warming (Armstrong McKay et al., 2022). Under climate warming, researchers have concluded that the multi-year average snow cover area in the Northern Hemisphere has decreased by approximately 7% since the 1970s (Barry and Gan, 2011), exhibiting a significant decreasing trend (Zhang et al., 2019; Hernándezhenríquez et al., 2015). Since the beginning of the 21st century, research has shown a decline in snow cover area in the Arctic, with the rate of decline significantly accelerating (Mohammadzadeh Khani et al., 2022; Woo and Young, 2014; Thoman et al., 2020). The study of snow in China is mainly distributed across three stable snow cover areas (North Xinjiang, Northeast China, and Qinghai–Tibet region). Some researchers believe that the snow cover area in the Qinghai–Tibet region has decreased significantly (Huang et al., 2017; Huang et al., 2023). The snow cover area in northern Xinjiang, China, has exhibited clear periodicity, with an overall decreasing trend (Ke and Liu, 2014; Zhao et al., 2021). In addition, the snow cover area in Northeast China has remained relatively stable (Li et al., 2020; Chen and Zhao, 2020). Changes in snow cover area are not only reflected in changes in net snow cover area and spatial coverage but also inevitably lead to changes in landscape patterns. The spatial heterogeneity of temperature change and the influence of human activities may exacerbate the degree of spatial fragmentation of snow cover to a certain extent. Currently, there are not many studies on the spatial fragmentation of snow cover, and the interactions between spatial changes in snow cover and the characteristics of snow cover landscape patterns remain largely unexplored. Zhang et al. (2016) pointed out that since the 1960s, Northeast China has become the region with the greatest spatial variation in snow cover in China. Therefore, this paper analyzes the spatial and temporal distribution and change characteristics of the snow cover area and evaluates a specific combination of snow cover area change and fragmentation in Northeast China. This study can explain the changes in spatial fragmentation of snow cover in Northeast China, deepen the study of spatial changes in snow cover under climate warming, and provide scientific references for regional snow cover economic development and regional ecological security.
2 Materials and methods
2.1 Overview of the study area
Northeast China is the second-largest stable snow cover region in China and one of the five stable snow cover regions in Eurasia (Shi et al., 2000). It is located between 115°05′–135°02′E and 38°40′–53°34′N, encompassing the Heilongjiang, Jilin, and Liaoning provinces, along with four municipalities in eastern Inner Mongolia (Hulun Buir, Hinggan League, Tongliao, and Chifeng). The western and northwestern parts are dominated by the Greater Khingan Range, while the eastern and southeastern parts are characterized by the Lesser Khingan Mountains and Changbai Mountain, covering a total area of approximately 124.19 × 10⁴ km2 (Figure 1). This region experiences a temperate continental climate, with an average annual precipitation of approximately 519 mm and an average annual temperature range from −5°C to 11°C. It is known for having the widest range of stable snow cover and the largest average snow depth in China, with an annual cumulative snow depth of 498 cm, and the snow cover period in this region ranges from 30 to 190 d (Zheng et al., 2022). The region is distinguished from other snow areas by its large annual average snow reserves and the most obvious inter-annual variability (Che and Li, 2005).
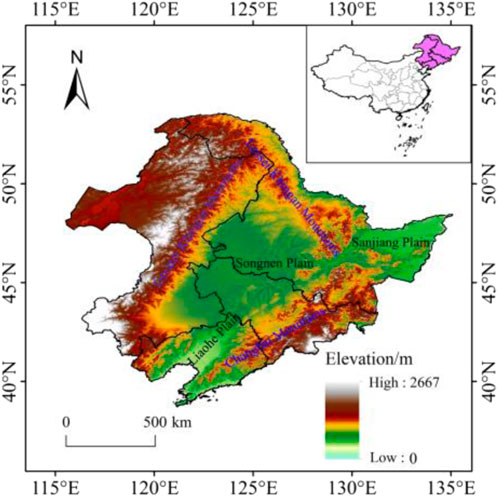
Figure 1. Study area.
2.2 Data sources
The China AVHRR Daily Cloudless 5 km Snow Area Product Dataset is provided by the National Cryosphere Desert Data Center (NCDC, http://www.ncdc.ac.cn/ (accessed on 28 March 2023; the time span is from 1 July 1980 to 30 June 2020, with a total of 14,610 raster images)). This product focuses on snow distribution area across China and is derived from the AVHRR CDR SR product using a multi-level decision tree classification method combined with a vacancy-filling algorithm, such as the spatio-temporal interpolation algorithm of the hidden Markov random field model, to remove cloud effects from products. A comprehensive validation conducted by Hao et al. (2021), with reference to ground snow-depth measurements during the snow seasons in China, revealed an overall accuracy of 87.4%, producer’s accuracy of 81.0%, user’s accuracy of 81.3%, and a Cohen’s kappa (CK) value of 0.717.
2.3 Sample collection and determination of chronology
2.3.1 Calculation of snow cover area
First, the hydrological year is defined as beginning on the 1st of July of one year and ending on the 30th of June of the following year (Chen and Li, 2011). Then, format conversion was conducted on the snow cover data, where the snow grids were uniformly assigned a value of 1 and the snow-free grids were assigned a value of 0. After cropping using ArcGIS, the daily snow cover area data for Northeast China were obtained.
The SCA is defined as the snow cover area on a given day obtained by counting the number of snow cover pixels in the daily image and multiplying by the size of the grid pixels. Calculate using Equation 1:
where SRaster is the sum of the number of pixels with snow in the daily image and ARaster is the area of a single pixel.
In terms of the stable snow cover area, a grid is considered part of the stable snow cover area when the number of snow cover days exceeds 60 days. If the multi-year average of snow cover days in a grid is more than 60 days per year, it is considered a multi-year stable snow cover area (Li and Mi, 1983). The daily snow grids are superimposed to generate the monthly snow grids. If the snow covers more than 10% of the grid during the month, the grid is considered stable, and if the average number of snow cover occurrences over multiple years exceeds 10% of the total days in a month (3 days), it is considered to be a multi-year stable snow grid.
2.3.2 Mean patch size
The mean patch size (MPS) represents the average condition that characterizes the spatial fragmentation of the snow cover distribution. The smaller the value at the patch level, the greater the landscape fragmentation. The greater the value, the smaller the landscape fragmentation (Qiu et al., 2019; Xu et al., 2018). Calculate using Equation 2:
where A is the total snow cover area and N is the total number of snow cover patches.
2.3.3 Largest patch index
The largest patch index (LPI) is used to asses fragmentation and dominance, with an interval of values 0 <LPI ≤ 100. The closer the LPI value to 100, the lower the fragmentation and the higher the dominance of the land cover (Nurwanda et al., 2016). Calculate using Equation 3:
where ni is the largest snow cover area and N is the total area of snow cover patches.
2.3.4 Patch size coefficient of variation
Patch size coefficient of variation (PSCV) is a statistical measure used to assess the relative dispersion of patch sizes (Niu et al., 2022). Calculate using Equation 4:
where PSSD is the standard deviation of patch sizes and MPS is the mean patch size.
We use Fragstats 4.1 to calculate SCA, MPS, LPI, and PSCV.
2.3.5 Mann–Kendall test
The Mann–Kendall (M–K) test, as a non-parametric trend test method, is widely used in the trend significance tests of long time-series data. The M–K test does not require the measured values to obey the normal distribution and is not affected by missing values and outliers (Mann, 1945; Kendall et al., 1948). In this study, the confidence level of 95% (α = ± 1.96) was used to evaluate the significance of trend and correlation, UFi is a standard normal distribution, which is a sequence calculated according to time-series x order x1, x2, …, xn. UBi is the inverse sequence of the time series. If the values of UF and UB are greater than 0, then the sequence shows an upward trend; values below 0 indicate a downward trend. When the value exceeds the critical line, this indicates that the rising or falling trend is significant. The range beyond the critical line is defined as the time zone of mutation. If the UF and UB curves appear on an intersection point and the intersection point is between the critical line, then the intersection point corresponds to the time the mutation begins.
3 Results
3.1 Spatial–temporal distribution and variation characteristics of stable snow cover area in Northeast China from 1980 to 2019
3.1.1 Temporal variation characteristics of annual snow cover area
Table 1 and Figure 2 show the sequences of stable snow cover areas for Northeast China from 1980 to 2019 calculated based on AVHRR data. The mean stable snow cover area during this period was 79.41 × 10⁴ km2 (±14.47 × 10⁴ km2), accounting for 64.03% of the entire region. The results reveal that more than 90% of Northeast China was covered by snow in the year with maximum snow coverage, whereas in the year with minimum snow coverage, more than 30% was covered by snow. The coefficient of variation indicates that the stable snow cover was 18.23%, indicating a large inter-annual variation.
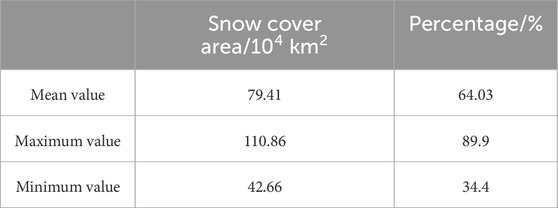
Table 1. Statistical table of inter-annual variation in the stable snow cover area for 1980–2019.
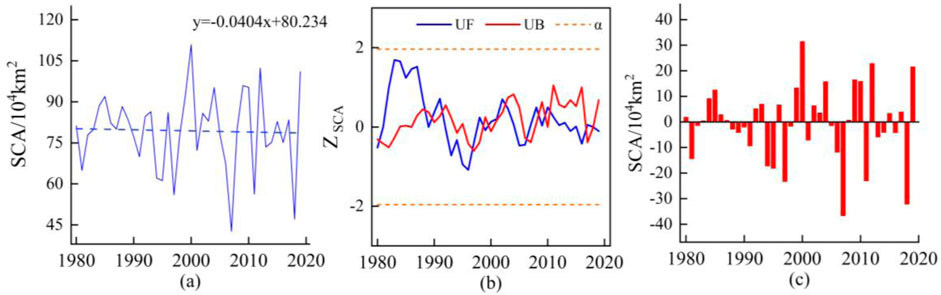
Figure 2. Inter-annual variation in the stable snow cover area (A), Mann–Kendall trend of the stable snow cover area (B), and the snow cover area anomaly (C) in Northeast China, 1980–2019.
According to the variation trend, the stable snow cover areas in Northeast China exhibited decreasing trends from 1980 to 2019, with a rate of change of−0.404 × 10⁴ km2/10a. However, this did not pass the significance test, indicating no significant changes in the stable snow areas during this period. Compared to the previous decade (1980–1989), the stable snow cover areas in Northeast China decreased by 3.18 × 10⁴ km2 in the most recent decade (2010–2019). Further analysis was conducted using the M-K test (Figure 2B). There were multiple intersections of the UF and UB of the stable snow cover areas. Based on the snow cover area anomalies and sliding t-tests, it was concluded that the stable snow cover area underwent an abrupt changed in 1987, with a noticeable decline in the stable snow cover area after this mutation compared to the period before it.
Figure 3 illustrates that the stable snow cover area in Northeast China was mainly distributed in the northeastern part of Northeast China. There was no snow cover in the southwest. The snow zone exhibited an inverted U-shape distribution. The southern boundary of the central stable snow cover zone is located at approximately 46°N, which is in the Hada Mountains in Jilin Province, the southwestern part of the Songnen Plain, and the Zhangguangcai Ridge.
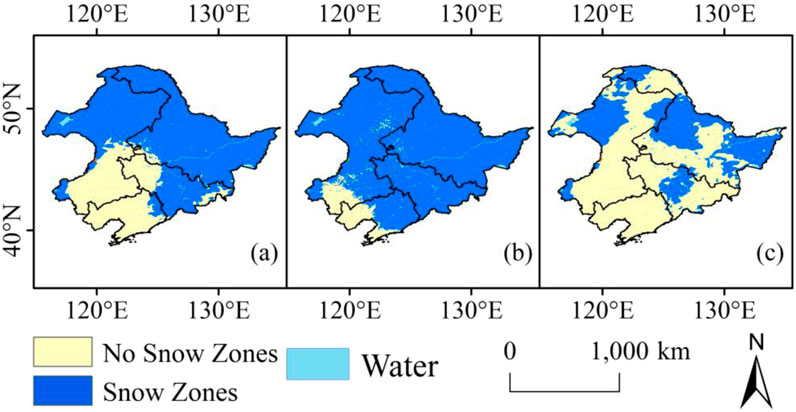
Figure 3. Spatial distribution of the mean annual stable snow cover area (A), maximum stable snow cover area (B), and minimum stable snow cover area (C) in Northeast China, 1980–2019.
The spatial distribution characteristics of the maximum stable snow cover area were similar to those of the mean stable snow cover area. The difference was that the southern boundary shifted southwest and was located at approximately 41°N in the Liaodong Peninsula, Liaoxi Hills, and Qilaotu Mountains. The spatial distribution of the minimum stable snow cover area exhibited clear characteristics of northward retreat and fragmentation and was mainly located outside the mountainous areas, such as the Greater Khingan Mountains, the Lesser Khingan Mountains, and the Changbai Mountains, as well as the Sanjiang Plain in the east.
In order to further elucidate the spatial variation in snow cover area, we have drawn a map of snow cover spatial variation separated by 10 years. The figure shows that the snow cover change zone is mainly located on the southwestern and southeastern edges of the stable snow area. A comprehensive comparison of decadal changes indicates that the southwestern edge mainly changes from no snow to snow, while the southwestern edge mainly changes from snow to no snow. Figure 4 shows that compared with 1980–1989, the snow cover in the Songnen Plain from 2010 to 2019 showed a clear southward trend, with an expansion area of approximately 5.78 × 10⁴ km2, accounting for 2.04%. The snow relief area is mainly located in the Changbai Mountain and Xiaoxing’an Mountain regions, with an area of approximately 2.56 × 10⁴ km2, accounting for 1.03%.
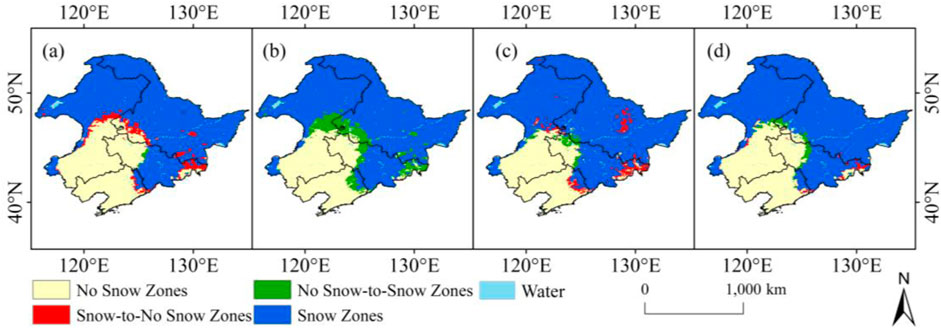
Figure 4. Spatial distribution of snow cover area change in Northeast China. 1980s–1990s (A), 1990s–2000s (B), 2000s–2010s (C), and 1980s–2010s (D).
3.1.2 Temporal variation characteristics of monthly snow cover area
Figure 5 shows the annual changes in the stable monthly snow area after statistics, showing distinct trends from 1980 to 2019. During this period, the snow area in Northeast China showed a decreasing trend from September to February, with a rate of change ranging from −3.52 × 10⁴ km2/10a to −0.53 × 10⁴ km2/10a. Conversely, from March onward, the month-by-month snow area showed an increasing trend, with a rate of change ranging from 0.02 × 10⁴ km2/10a to 1.9 × 10⁴ km2/10a. These patterns indicate that the snow cover area in Northeast China has been decreasing during the snow accumulation period (September–November) and the stabilization period (December–February), while increasing during the ablation period (March–May).
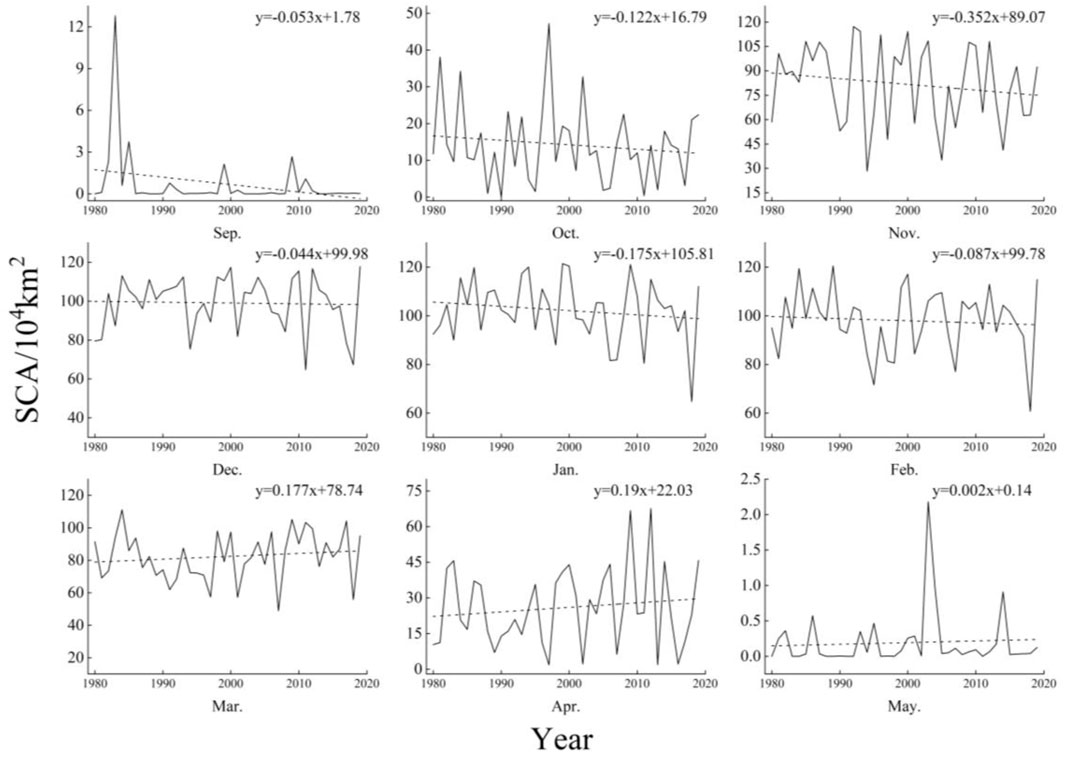
Figure 5. Annual change in the stable monthly snow cover area in Northeast China, 1980–2019.
Figure 6 shows the variation in multi-year average of monthly snow cover area in Northeast China. The results reveal that the snow cover area in Northeast China exhibited a parabolic distribution with time and was characterized by non-linear variation. The snow cover area index regularly increased from October to November and regularly decreased from February to May.
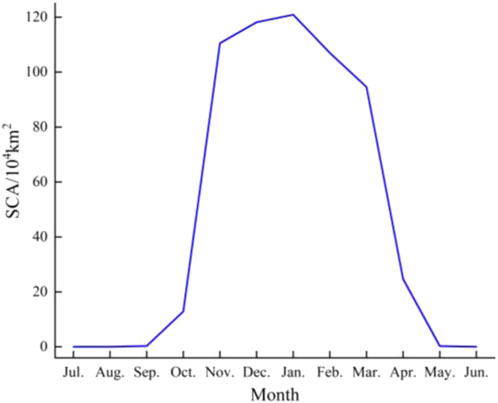
Figure 6. Variation in the multi-year average monthly snow cover area in Northeast China.
The changes in the monthly snow cover area in Northeast China between the former decade and the latter decade are compared, with the results presented in Table 2. The results show that the snow cover area increased in all the months, except December, March, April, and May, during which it decreased. In comparison, the largest reduction in the snow cover area occurred in February.

Table 2. Changes in the monthly snow cover area for 1980–2019.
As shown in Figure 7, there was no snow cover in June, July, and August in Northeast China. In September, the snow cover was mainly distributed near Manzhouli and Genhe on the west side of the Greater Khingan Mountains in the northern part of Northeast China. In October, the snow cover was distributed near the Greater Khingan Mountains and the northern Heihe. The southern boundary of the snow cover extended to 41°N in November and was distributed along Xinglong, Shenyang, and Benxi. The snow cover continued to increase in December and essentially covered the entirety of Northeast China by January. The snow cover area in Northeast China began to decrease and retreat northward in February and basically disappeared by May.
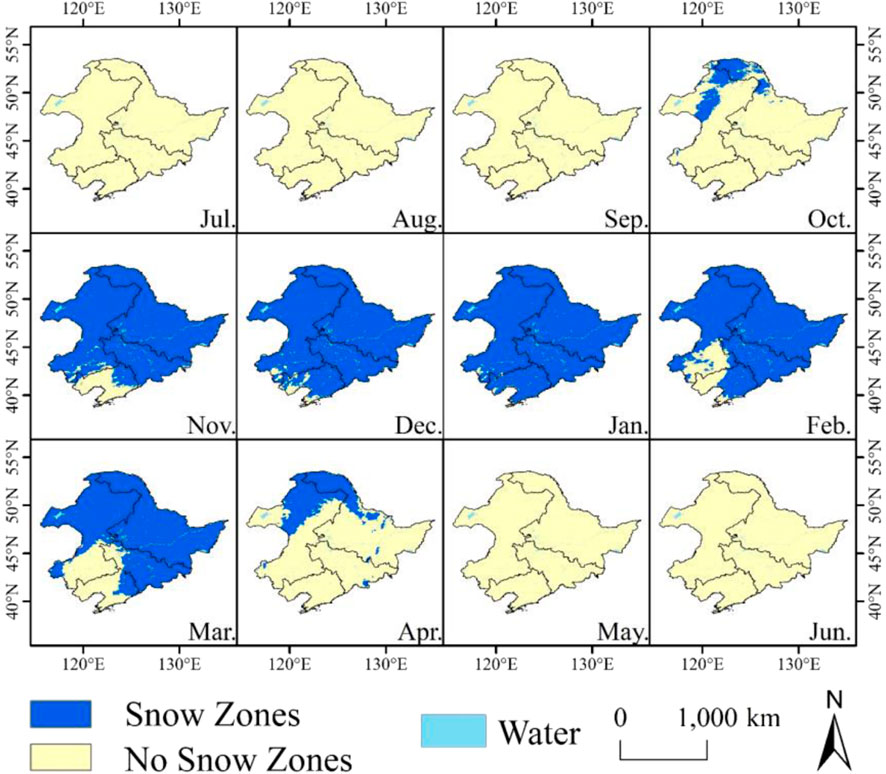
Figure 7. Spatial distribution of monthly snow cover area in Northeast China, 1980–2019.
The monthly changes in the snow cover area between the latter decade and the former decade are compared in order to further explore the variation characteristics of the snow cover area in Northeast China (Figure 8; Table 3). Table 3 illustrates that the snow cover area in each month during the entire snow period differed in the latter decade compared to the former decade. The snow cover area decreased from October to February (with a slight increase in December) and increased from March to May, indicating that the snow cover area decreased in each of the fall and winter months and increased in each of the spring months, with the greatest decline in October (−11.89 × 10⁴ km2) and the greatest increase in April (7.59 × 10⁴ km2). Table 3 shows that there were changes from snow cover to no snow cover and from no snow cover to snow cover in each month. The area that changed from snow cover to no snow cover was greater than the area that changed from no snow cover to snow cover in all the fall and winter months except December, indicating a decrease in the snow cover area in fall and winter. In contrast, the area that changed from no snow cover to snow cover was greater than the area that changed from snow cover to no snow cover in spring, indicating an increase in the snow cover area in spring.
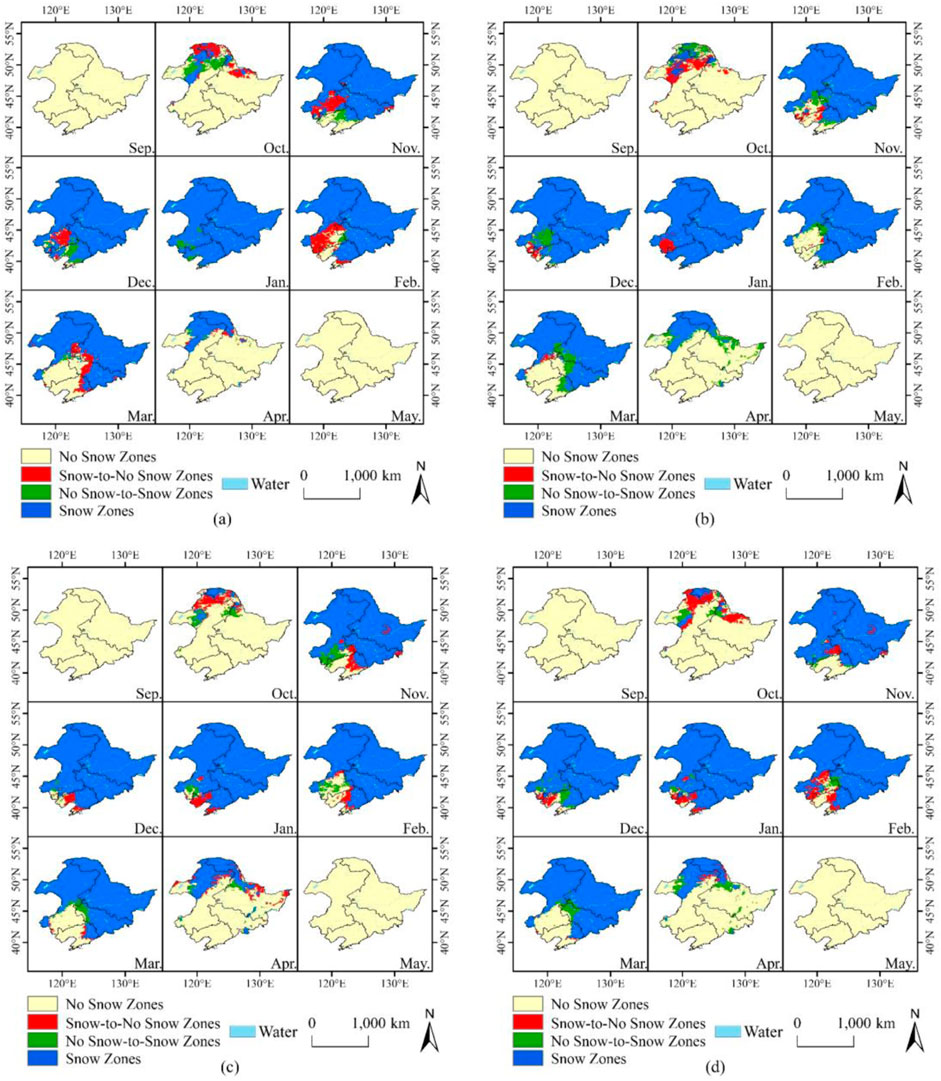
Figure 8. Spatial distribution of monthly snow cover area change in Northeast China. 1980s–1990s (A), 1990s–2000s (B), 2000s–2010s (C), and 1980s–2010s (D).

Table 3. Change in monthly snow cover area for 1980–2019.
The spatial distributions of the snow-to-no snow zones and no snow-to-snow zones in each month revealed that the spatial variations in each month had similar characteristics. The snow-to-no snow zones were mainly distributed on the southern edge of the original stable snow cover area each month, while the no snow-to-snow zones were mainly distributed on the west side of the original stable snow cover area. This feature was evident in most months, such as October, November, December, February, and March, suggesting that with climate warming, the snow cover in Northeast China decreased in low-latitude regions and expanded radially westward from 1980 to 2019.
3.2 Spatial–temporal distribution and variation characteristics of snow cover area fragmentation in Northeast China from 1980 to 2019
3.2.1 Temporal distribution of spatial continuity and variation characteristics of annual snow cover
The MPS, LPI, and PSCV were calculated to analyze the variations in the spatial continuity of the snow cover in Northeast China (Figure 9). The mean MPS, LPI, and PSCV in the Northeast China from 1980 to 2019 were 4.75 × 10⁴ km2 (±3.81 × 10⁴ km2), 61.81% (±14.91%), and 469.59% (±201.54%), and the rate of change of the MPS, LPI, and PSCV from 1980 to 2019 were −1.06 × 10⁴ km2/10 a (P < 0.05), −1.04%/10 a (P > 0.05), and 71.6%/10 a (P < 0.05). It can be seen that MPS shows a significant decreasing trend, and the smaller the MPS, the greater the degree of fragmentation of snow space. In addition, PSCV also showed a significant increasing trend, and the larger the PSCV, the greater the difference in the patch size of snow distribution space, indicating a significant increase in snow spatial continuity. Although the rate of change of LPI did not pass the significance test, it also showed a decreasing trend, and the smaller its value, the higher its degree of spatial fragmentation. Therefore, it can be concluded that since the 1980s, the spatial continuity of snow cover in Northeast China has significantly decreased, and the fragmentation of snow cover spatial distribution has significantly increased. The results indicate that with climate warming, although the stable snow cover area in Northeast China did not undergo significant changes, the snow distribution becomes increasingly discontinuous, leading to greater spatial fragmentation.
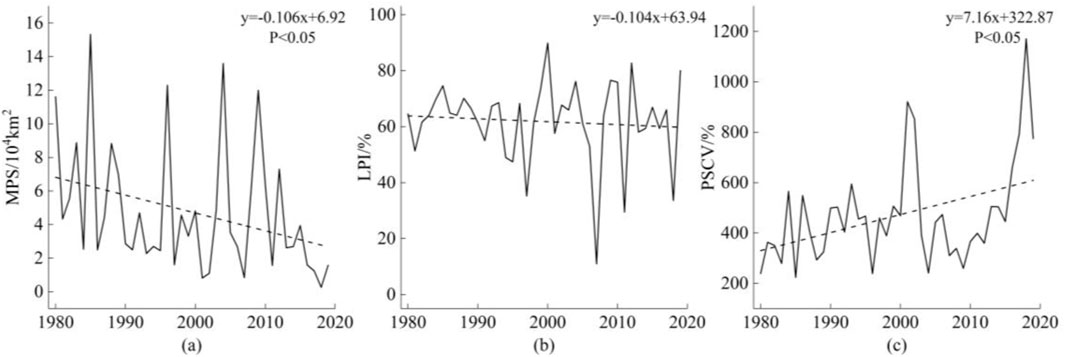
Figure 9. Inter-annual variation in MPS (A), LPI (B), and PSCV (C) in Northeast China, 1980–2019.
In order to explore the spatial variations in the fragmentation of the snow cover in Northeast China, Figure 10 shows the spatial distribution of snow cover every decade (1980s, 1990s, 2000s, and 2010s). It can be seen that the spatial distribution of snow cover in Northeast China is significantly fragmented, especially in the 2010s compared to the 1980s when snow fragmentation increased significantly. From 1980 to 1989, the MPS of snow cover in Northeast China was 8.24, and from 2010 to 2019, it was 4.07. Compared with the previous decade, the MPS of snow cover in Northeast China decreased by 4.17, and the fragmentation increased by 50% in the latter decade. Fragmentation has occurred in the southeastern, northeastern, and southwestern parts of the Northeast region, specifically in the spatial distribution of the southeastern part of the Changbai Mountain and the western part of Sanjiang and Songnen Plains, showing a clear trend of fragmentation. Therefore, under the backdrop of climate warming, the spatial distribution continuity of snow has significantly decreased.
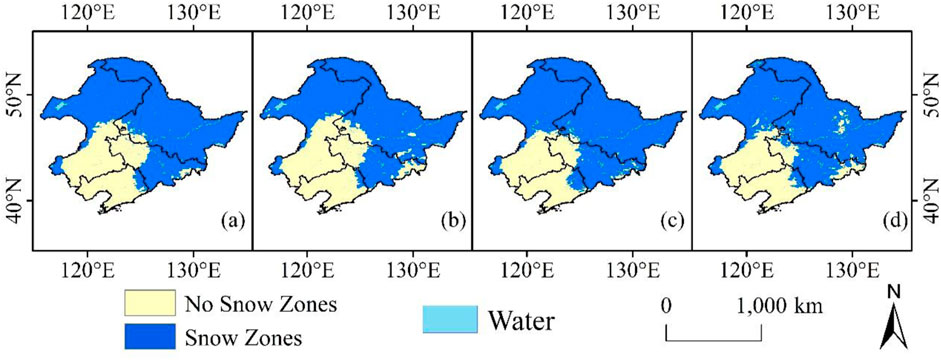
Figure 10. Spatial distribution of snow cover area in northeast China in the 1980s (A), 1990s (B), 2000s (C), and 2010s (D).
3.2.2 Temporal distribution of spatial continuity and variation characteristics of monthly snow cover
The annual changes in the MPS, LPI, and PSCV of the snow cover area during the snowy months were analyzed (Table 4). The MPS of the snow cover area in Northeast China from 1980 to 2019 exhibited a decreasing trend in all the snowy months except March, and the LPI also exhibited a decreasing trend except from March to May, while the PSCV exhibits an increasing trend except in September, indicating an increasing trend of the fragmentation of the spatial distribution of the snow cover area. The MPS of the snow cover area exhibited a significant decreasing trend in November, February, and April, with rates of change of −0.49/10a, −1.31/10a, and −0.08/10a, respectively, indicating significant fragmentation of the snow cover area during these months.
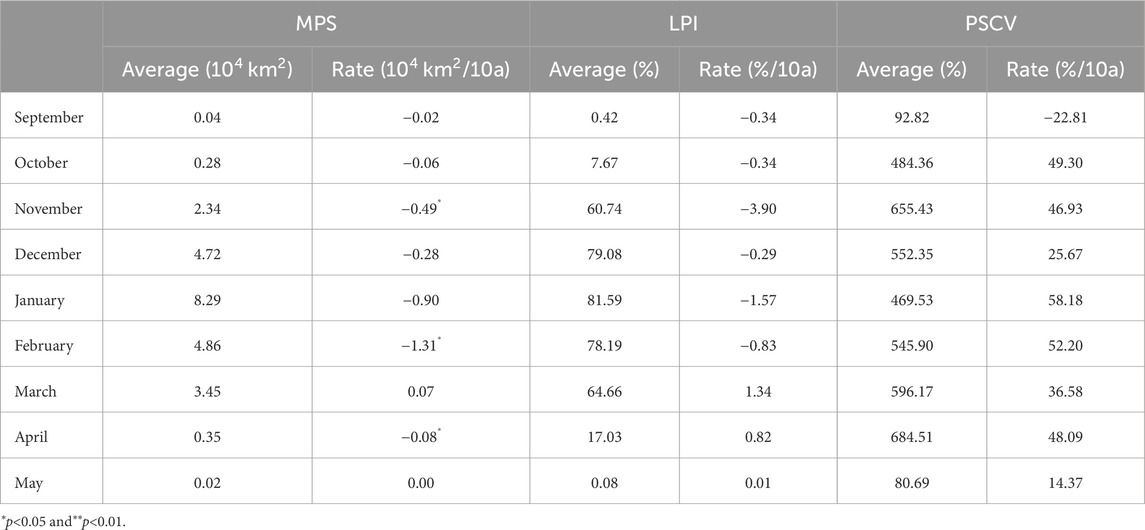
Table 4. Inter-annual variation in the MPS, LPI, and PSCV by month in Northeast China, 1980–2019.
In order to explore the spatial variations in the fragmentation of the snow cover area in each month, the monthly distribution and fragmentation statistics of the snow cover area were obtained for 1980–1989 (the former decade) and 2010–2019 (the latter decade) (Figure 11; Table 5). Compared with the former decade, the MPS of the monthly snow cover in Northeast China exhibited a decreasing trend in the latter decade, with a decreased range of 0.49–9.81, while the PSCV exhibited an increasing trend with an increased range of 7.8%–342.9%, indicating an increase in the snow cover fragmentation in each month in this region. There was no significant change in September compared with the spatial distribution of the monthly fragmentation variation. Compared to the former decade, the fragmentation intensified in the snow-covered zones in October. In addition, the fragmentation on the southern edge of the stable snow-covered zones increased significantly from November to February.
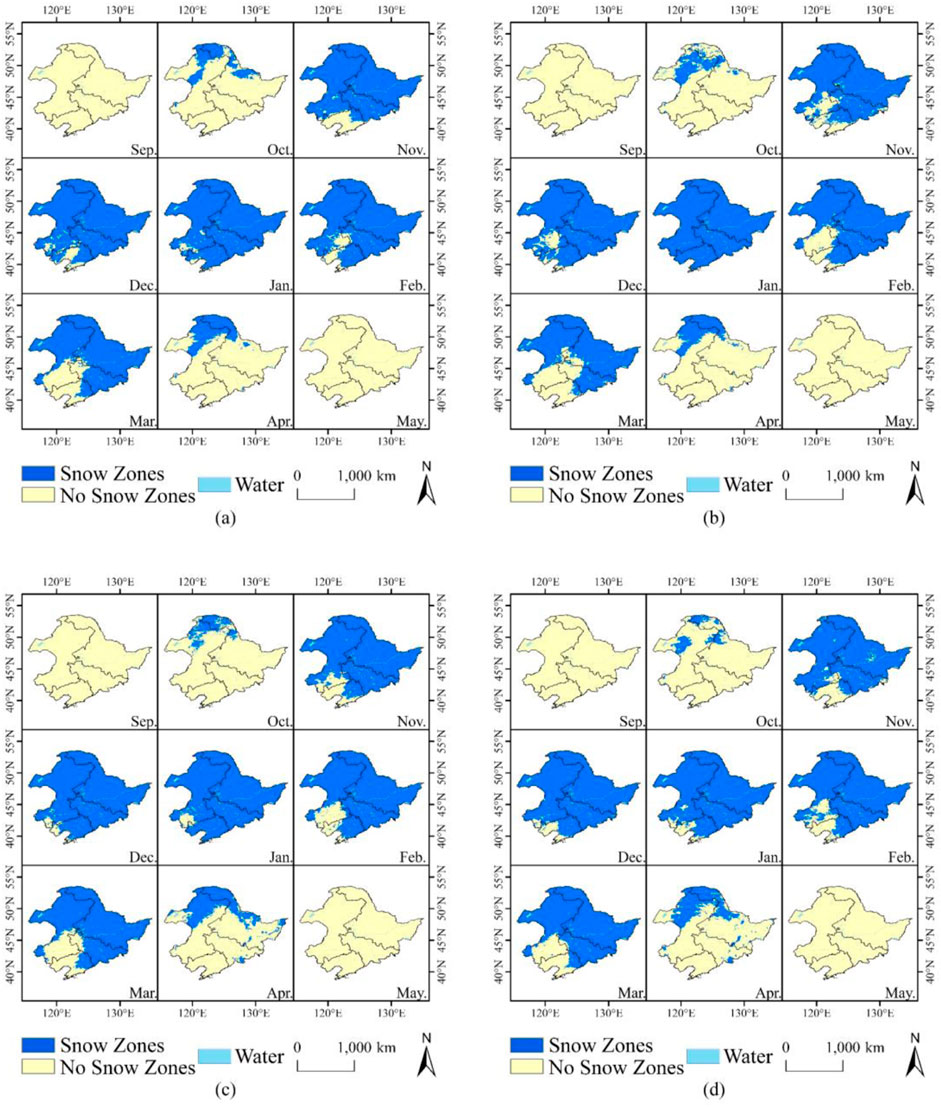
Figure 11. Spatial distribution of monthly snow cover area in Northeast China, 1980–1989 (A), 1990–1999 (B), 2000–2009 (C), and 2010–2019 (D).
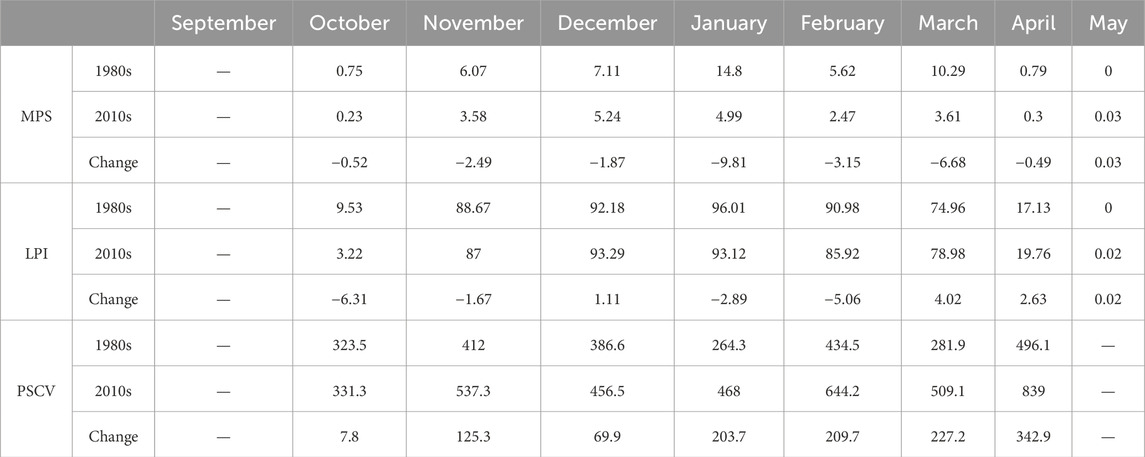
Table 5. Variation in monthly snow MPS, LPI, PSSD, and PSCV.
4 Discussion
4.1 Comparison with previous results
At present, research on the snow cover area has mainly focused on the Northern Hemisphere. Previous studies have suggested that since the 1970s, the mean annual snow cover area in the Northern Hemisphere has decreased by approximately 7% (Barry and Gan, 2011). The trend of the reduction in the snow cover area was significant in spring, with a decrease of 3.1%/10a and 13.6%/10a in May and June, respectively (Derksen and Brown, 2012; Bormann et al., 2018). In addition, many researchers have also conducted research on the snow cover area in certain typical snow cover regions. Rizzi et al. (2018) found that the snow cover area in Norway has decreased by 6% since 1980. Huang et al. (2023) concluded that the mean snow cover area on the Tibetan Plateau has significantly decreased by 3.9 × 10⁴ km2 since 1980. Our results suggest that the stable snow cover area exhibited decreasing trends from 1980 to 2020, yet the trends were not significant, which is different from the significant area reduction in other snow cover zones. Compared with the 1980s, the stable snow cover areas in Northeast China decreased by 3.18 × 10⁴ km2 in the 2010s. In addition, we concluded that compared to the former decade, the snow cover area in the latter decade decreased in each month in fall and winter and increased in each month in spring, which is also different from the spring snow cover area reductions derived for other snow cover zones.
It has been shown that since 1961, the amount of snowfall and the number of snow days in November in Northeast China have been decreasing, while the amount of snowfall of different grades in March in Northeast China has been increasing, and the number of snow days of moderate snow–heavy snowfall has also increased (Zhou et al., 2020). Meanwhile, the average temperature in March in Northeast China is below 0°C, so snow accumulation occurs when there is a moderate snow-blizzard, leading to an increase in the area of snow accumulation during the melt-free period.
4.2 Response of snow cover to climate
In order to further analyze the correspondence between the snow cover area and temperature in Northeast China, the fifth generation European Centre for Medium-Range Weather Forecasts (ECMWF) atmospheric reanalysis of the global climate (ERA5-Land) dataset was used to analyze the changes in the inter-annual mean temperature and mean temperature in the snowy months in Northeast China from 1980 to 2019 (Figure 12). The mean annual temperature in Northeast China exhibited a significant increasing trend, with a rate of change of 0.36°C (p < 0.01). The temperature in all the snowy months also exhibited an increasing trend, with a rate of change of 0.12°C/10a–0.67°C/10a. In addition, the temperature exhibited significant increasing trends in September, October, March, and May (p < 0.05). The correlation between the snow cover area and temperature was calculated (Table 6). The results show that there were extremely significant negative correlations between the snow cover areas and the annual mean temperature (p < 0.01). This explains the reductions in the snow cover areas in Northeast China in the latter decade compared to the former decade. However, the overall reduction has not yet reached a significant level.
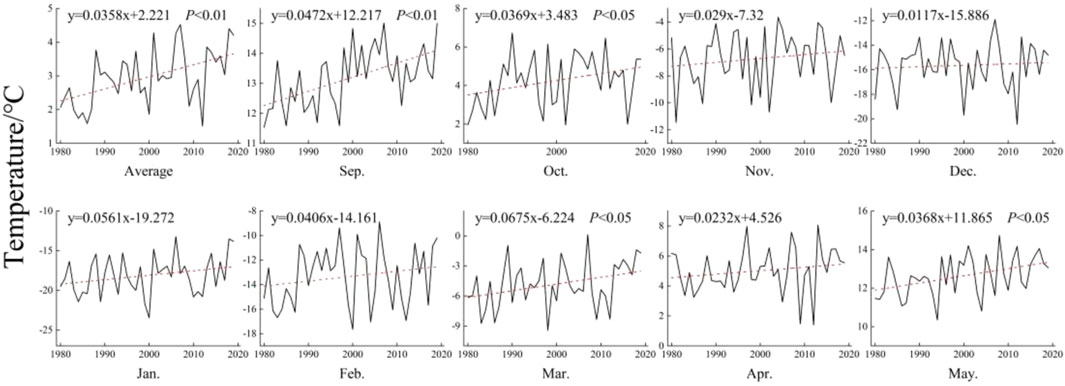
Figure 12. Changes in the inter-annual mean temperature and mean temperature in the snowy months in Northeast China.
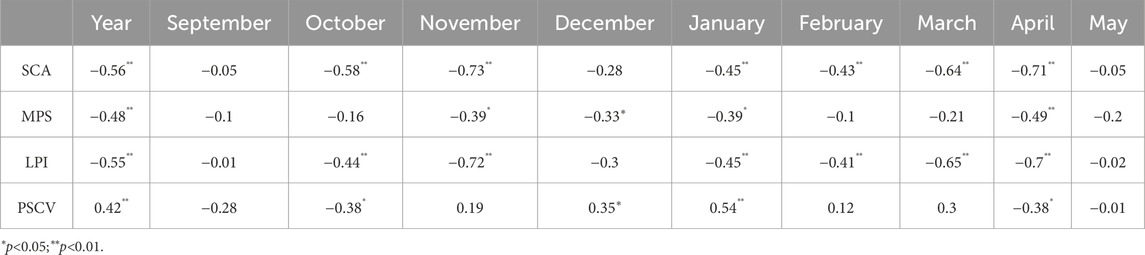
Table 6. Correlations between the snow cover areas, MPS, LPI, PSCV, and temperature.
In addition, Table 6 shows that there was a significant negative correlation between the monthly snow cover area and temperature (p < 0.01), indicating a decreasing trend in the snow cover area from 2010 to 2019 compared with 1980–1989. However, we found that in Northeast China, although temperatures increased in March and April, the snow cover area showed an increasing trend. We discovered that compared to 1980–1989, the water vapor flux in Northeast China increased by 5.5 kg/(m s) in 2010–2019. The increase in water vapor flux will also affect the generation of snowfall (Wang et al., 2020). This indicates that, in addition to temperature, changes in weather systems and water vapor flux were also important factors affecting snow cover area, and this is also an important factor that causes the fluctuation of snow cover area, warranting further research in the future.
We conclude that the snow cover distribution was spatially characterized by fragmentation. Correlation analysis was conducted between the MPS, LPI, PSCV, and temperature (Table 6). The results revealed that the MPS and LPI were negatively correlated with temperature, with an extremely significant negative correlation in most months. As the temperature increased, the MPS and LPI decreased, and the PSCV was also significantly affected by temperature. Comparison with the spatial variation of mean annual temperature (Figure 13) also shows that the junction areas of faster and slower warming regions also coincide better with the areas of increased snow cover fragmentation, fully demonstrating that the increase in temperature was an important factor leading to the intensification in the fragmentation of snow cover.
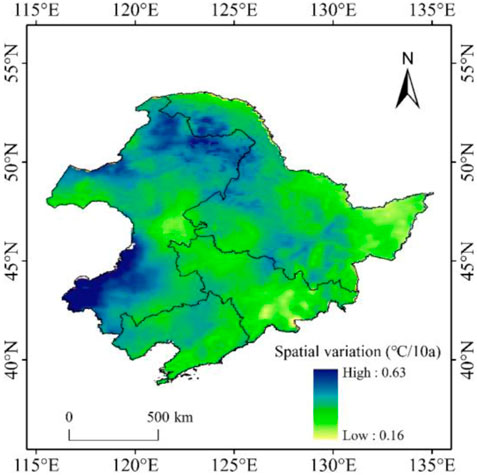
Figure 13. Spatial variation in temperature.
Previous studies have suggested that the mean annual temperature in Northeast China abruptly changed around late 1987 (Hu et al., 2021), which is consistent with the years of abrupt changes in the mean annual snow cover area and stable snow cover area obtained in this study. Moreover, in this study, we combined the mean annual and stable snow cover area anomalies (Figure 2C) to calculate the mean annual, coefficient of variation, extreme value, and number of extreme years of the snow cover area before and after 1987 (using as standard statistics). The results are shown in Table 7. The result shows that the coefficients of variation of the stable snow cover areas in Northeast China increased after 1987, indicating significant enhancement of the inter-annual variations. The stable snow cover area increased in terms of their annual mean values. Yet, the extreme value changed significantly. The maximum values increased significantly, with increases of 18.87%. The minimum values decreased by 22.29%. Furthermore, the decreases in the minimum values were relatively more severe, indicating an increased inter-annual variation in the spatial extent of the snow cover in Northeast China. The frequency distribution of the extreme years before and after 1987 was calculated using
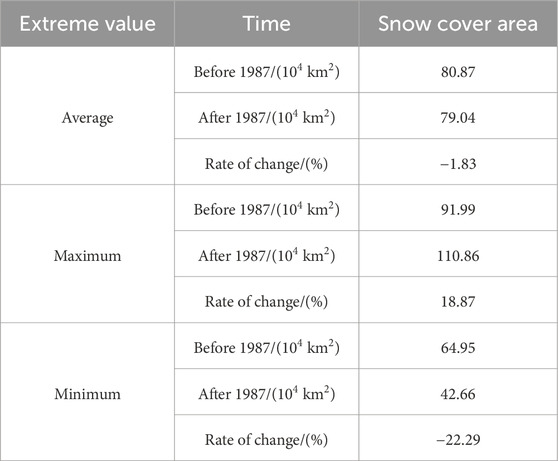
Table 7. Snow cover areas before and after 1987.
4.3 Limitations of data
The correlation coefficient between air temperature and snow cover area was calculated, and it was concluded that there was a significant inverse relationship between air temperature and snow cover area, i.e., the snow cover area decreased with increasing air temperature. Figure 4D shows the spatial changes of snow cover in Northeast China for the periods 2010–2019 and 1980–1989, showing that the snow cover area increased in the central part of Northeast China and decreased in the eastern part of the Lesser Khingan Mountains and the lower altitude area of the southeastern part of Northeast China. We compared the spatial zone of temperature change in Northeast China from 1980 to 2019 (Figure 14) with the DEM map (Figure 15A) and the land use map (Figure 15B). It can be observed that the average annual temperature across Northeast China is increasing, with the central part of Northeast China experiencing a relatively smaller increase in temperature. In addition, based on the DEM map of Northeast China, the central part is the Northeast Plain, which consists primarily of arable land with no vegetation cover from autumn and winter through to the following spring. This area has seen an increase in snow cover. In the higher elevation area, which are basically covered by forests, there is a greater increase in temperature. Based on the conclusion that temperature and snow area are inversely proportional, one would expect the area with the greatest decrease in snow. However, despite the greater snow depth in the Greater Khingan Mountains, no decrease in snow was observed. In contrast, a decrease in the area of snow was observed on the eastern edge of the Lesser Khingan Mountains and the southeastern part of Northeast China,. This conclusion does not exclude the influence of remote sensing data limitations in forested areas.
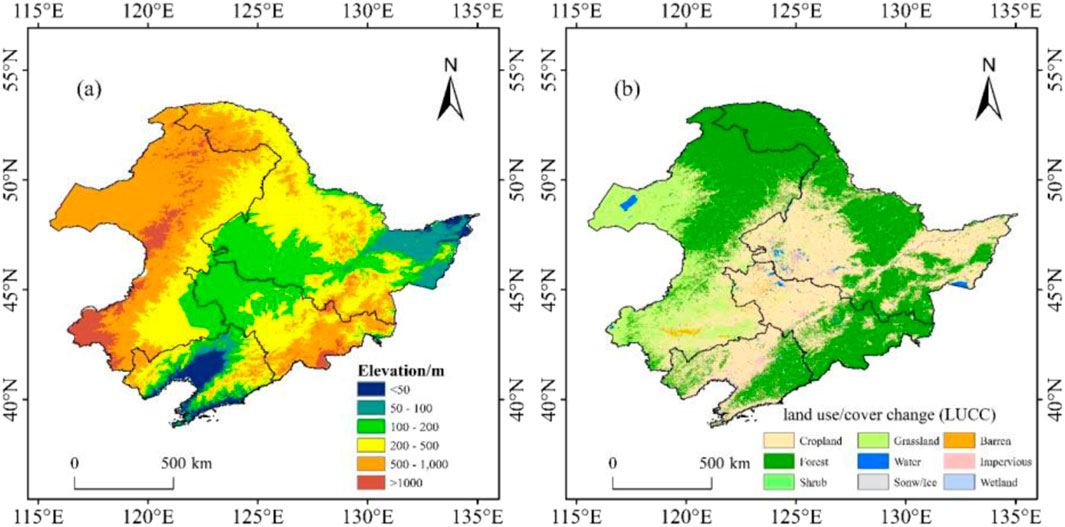
Figure 14. Spatial variation in elevation (A) and land use (B) in Northeast China.
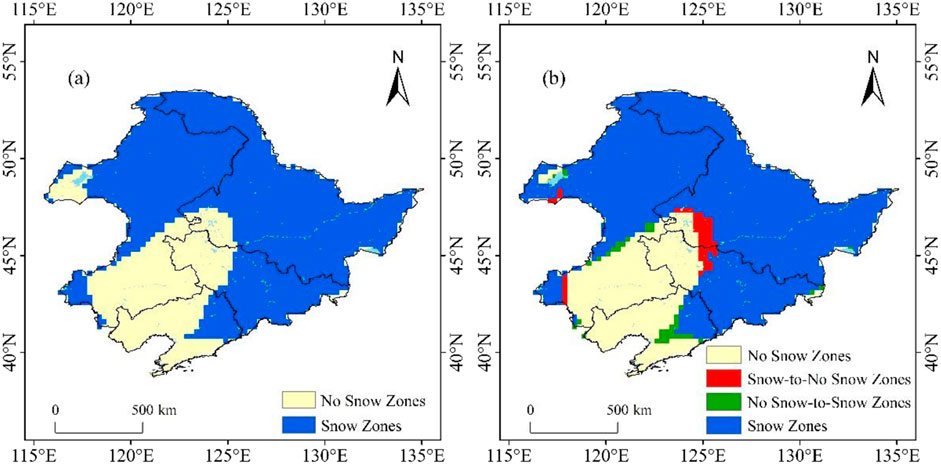
Figure 15. Spatial distribution of snow cover area (A) and snow cover area change (B) in Northeast China from 1980-2019 by using WESTDC.
In the analysis process of this article, three sets of data sources were selected. The actual year of the MODIS data is 2002, and its spatial resolution is 0.5 km × 0.5 km. The long-term snow depth dataset of China (WESTDC) starts in 1979 and has a resolution of 25 km × 25 km. The China AVHRR Daily Cloudless 5 km Snow Area Product Dataset (AVHRR) starts in 1979 and has a resolution of 0.5 km × 0.5 km. Compared to AVHRR data, which has an earlier time scale and higher spatial resolution, this article chooses to use AVHRR data for analysis.
This article compares the distribution maps of stable snow cover areas in the study area from 1980 to 2019 obtained using WESTDC data and AVHRR data (Figure 15), as well as the variation maps of 2010s and 1980s (Figures 3, 4). Compared to AVHRR data, the spatial resolution of the snow spatial distribution and variation maps obtained in the study area is higher. Therefore, this article uses AVHRR data.
5 Conclusion
Taking Northeast China as the study area, the spatial–temporal variation characteristics and distribution of the snow cover area in Northeast China from 1980 to 2019 were analyzed using the China AVHRR Daily Cloudless 5 km Snow Cover Area Product Dataset. The conclusions of this research are as follows:
(1) The stable snow cover area in Northeast China from 1980 to 2019 was 79.41 × 10⁴ km2 (±14.47 × 10⁴ km2). The rates of change of the stable snow cover area were −0.404 × 10⁴ km2/10a. The stable snow zones in Northeast China exhibited an inverted U-shape distribution pattern from 1980 to 2019.
(2) The snow cover area in Northeast China occurs mainly from September to May. The month-by-month stable snow cover area decreased during the snow accumulation period from September to February and increased from March to May, but the changes were not significant in all months. The snow cover in Northeast China generally showed a decrease in autumn and winter and an increase in spring.
(3) The rate of change of the MPS, LPI, and PSCV from 1980 to 2019 was −1.06 × 10⁴ km2/10 a (p < 0.05), −1.04%/10 a, and 71.6%/10 a (p < 0.05), respectively, indicating that the snow cover in Northeast China exhibited spatial fragmentation, and the trend of snow cover fragmentation is significant in November, February, and April.
(4) The increase in temperature is the major factor in the decline in snow cover and increased fragmentation.
Data availability statement
The raw data supporting the conclusions of this article will be made available by the authors, without undue reservation.
Author contributions
JG: writing–original draft, writing–review and editing, conceptualization, methodology, and visualization. YM: conceptualization, methodology, writing–review and editing, and writing–original draft. LZ: funding acquisition and writing–review and editing. YH: software and writing–review and editing. WZ: software and writing–review and editing. FZ: validation and writing–review and editing. JL: resources and writing–review and editing. CL: resources and writing–review and editing.
Funding
The author(s) declare that financial support was received for the research, authorship, and/or publication of this article. This research was funded by the National Natural Science Foundation of China (Grant No. 42271136) and the Natural Science Foundation of Heilongjiang Province of China (No. ZD2020D002).
Conflict of interest
The authors declare that the research was conducted in the absence of any commercial or financial relationships that could be construed as a potential conflict of interest.
Publisher’s note
All claims expressed in this article are solely those of the authors and do not necessarily represent those of their affiliated organizations, or those of the publisher, the editors, and the reviewers. Any product that may be evaluated in this article, or claim that may be made by its manufacturer, is not guaranteed or endorsed by the publisher.
References
Armstrong McKay, D. I., Staal, A., Abrams, J. F., Winkelmann, R., Sakschewski, B., Loriani, S., et al. (2022). Exceeding 1.5°C global warming could trigger multiple climate tipping points. Science 377, eabn7950. doi:10.1126/science.abn7950
Barry, R. G., and Gan, T. Y. (2011). The global Cryosphere: past, present and future. Cambridge, UK: Cambridge University Press.
Bormann, K. J., Brown, R. D., Derksen, C., and Painter, T. H. (2018). Estimating snow-cover trends from space. Nat. Clim. Change 8, 924–928. doi:10.1038/s41558-018-0318-3
Bulygina, O. N., Razuvaev, V. N., and Korshunova, N. N. (2009). Changes in snow cover over Northern Eurasia in the last few decades. Environ. Res. Lett. 4, 045026. doi:10.1088/1748-9326/4/4/045026
Che, T., and Li, X. (2005). Spatial distribution and temporal variation of snow water resources in China during 1993–2002. J. Glaciol. Geocryol. 27, 64–67. doi:10.7522/j.issn.1000-0240.2005.0009
Chen, G., and Li, D. (2011). Temporal-spatial characteristics of cumulative snow depth in Northeast China and its vicinity. Meteorol. Mon. 37, 513–521. doi:10.7519/j.issn.1000-0526.2011.5.001
Chen, P., and Zhao, H. (2020). Analysis on the spatial and temporal evolution of snow cover in the three northeastern provinces China from 2008 to 2018. Highlights Sci. Online 13, 324–341.
Derksen, C., and Brown, R. (2012). Spring snow cover extent reductions in the 2008–2012 period exceeding climate model projections. Geophys. Res. Lett. 39, L19504. doi:10.1029/2012GL053387
Déry, S. J., and Brown, R. D. (2007). Recent northern hemisphere snow cover extent trends and implications for the snow-albedo feedback. Geophys. Res. Lett. 34, 60–64. doi:10.1029/2007GL031474
Fu, S., Jiang, Y., Xu, S., and Zhang, X. (2017). Spatial and temporal variation characteristics of the onset and melting dates of snow cover and its relationship with air temperature and precipitation in Jilin province during 1960-2015. J. Arid. Environ. 35, 567–574. doi:10.11755/j.issn.1006-7639(2017)-04-0567
Hao, X., Huang, G., Che, T., Ji, W., Sun, X., Zhao, Q., et al. (2021). The NIEER AVHRR snow cover extent product over China – a long-term daily snow record for regional climate research. Earth Syst. Sci. Data 13, 4711–4726. doi:10.5194/essd-13-4711-2021
Hernándezhenríquez, M. A., Déry, S. J., and Derksen, C. (2015). Polar amplification and elevation-dependence in trends of Northern Hemisphere snow cover extent, 1971- 2014. Environ. Res. Lett. 10, 044010. doi:10.1088/1748-9326/10/4/044010
Hu, C. L., Li, J., Guo, T., Wang, W., Wang, T., Ding, K., et al. (2021). Variation characteristics of winter cold wave events in Northeast China and its response to regional climate warming during 1961—2016. J. Glaciol. Geocryol. 43, 1755–1763. doi:10.7522/j.issn.1000-0240.2021.0110
Huang, X., Deng, J., Wang, W., Feng, Q. S., and Liang, T. G. (2017). Impact of climate and elevation on snow cover using integrated remote sensing snow products in Tibetan Plateau. Remote Sens. Environ. 190, 274–288. doi:10.1016/j.rse.2016.12.028
Huang, X., Ma, Y., Li, Y., and Yang, X. (2023). Spatiotemporal variation characteristics of snow cover over the Tibetan Plateau from 1980 to 2020. J. Glaciol. Geocryol. 45, 423–434. doi:10.7522/j.issn.1000-0240.2023.0032
Ke, C. Q., and Liu, X. (2014). MODIS-observed spatial and temporal variation in snow cover in Xinjiang, China. Clim. Res. 59, 15–26. doi:10.3354/cr01206
Li, P. (1999). Variation of snow water resources in Northwest China during 1951 - 1997. Sci. China Ser. D Earth Sci. 29, 163–169. doi:10.1007/BF02878855
Li, P., and Mi, D. (1983). Distribution of snow cover in China. Glaciol. Geocryol. 4, 9–18. doi:10.7522/j.issn.1000-0240.1983.0059
Li, X., Wan, L., and He, X. (2020). Spatio-temporal variation of snow cover in Northeast China from 1980 to 2016. Nat. Sci. J. Harbin Norm. Univ. 36, 73–81.
Mann, H. B. (1945). Nonparametric tests against trend. Econom. J. Econom. Soc. 13, 245–259. doi:10.2307/1907187
Mohammadzadeh Khani, H., Kinnard, C., and Lévesque, E. (2022). Historical trends and projections of snow cover over the high arctic: a review. Water 14, 587. doi:10.3390/w14040587
Niu, X., Hu, Y., Zhen, L., Wang, Y., and Yan, H. (2022). Analysis of the future evolution of biocapacity and landscape characteristics in the agro-pastoral zone of northern China. Int. J. Environ. 19, 16104. doi:10.3390/ijerph192316104
Nurwanda, A., Zain, A., and Rustiadi, E. (2016). Analysis of land cover changes and landscape fragmentation in Batanghari Regency, Jambi Province. Procedia Soc. Behav. 227, 87–94. doi:10.1016/j.sbspro.2016.06.047
Qiu, Y., Ren, S., Wang, X., Yang, P., Li, Y., Li, S., et al. (2019). The spatial dynamics of vegetation revealed by unnamed aerial vehicles images in a straw-checkerboards-based ecological restoration area. Acta Ecol. Sin. 39, 9053–9067. doi:10.5846/stxb201810172245
Rizzi, J., Nilsen, I. B., Stagge, J. H., Gisnås, K., and Tallaksen, L. M. (2018). Five decades of warming: impacts on snow cover in Norway. Hydrol. Res. 49, 670–688. doi:10.2166/nh.2017.051
Shi, Y., Huang, M., Yao, T., and Deng, Y. (2000). Glaciers and their environments in China–the present, past and future. Beijing, China: Science Press.
Thoman, R. L., Richter-Menge, J., and Druckenmiller, M. L. (2020). Arctic report card 2020 executive summary; Arctic Report Card. Washington, DC, United States: NOAA, 1–4. doi:10.25923/mn5p-t549
Wang, W., Li, H., Wang, J., and Hao, X. (2020). Water vapor from western Eurasia promotes precipitation during the snow season in northern Xinjiang, a typical arid region in central Asia. Water 12, 141. doi:10.3390/w12010141
Woo, M. K., and Young, K. L. (2014). Disappearing semi-permanent snow in the High Arctic and its consequences. J. Glaciol. 60, 192–200. doi:10.3189/2014JoG13J150
Xu, X., Xie, G., and Qiu, P. (2018). Dynamic analysis of landscape changes in Bamen port and the surrounding lands of Hainan Province from 1964 to 2015. Acta Ecol. Sin. 38, 7458–7468. doi:10.5846/stxb201710261922
Zhang, L., Wang, C., Li, Y., Huang, Y., Zhang, F., and Pan, T. (2021). High-latitude snowfall as a sensitive indicator of climate warming: a case study of Heilongjiang Province, China. Ecol. Indic. 122, 107249. doi:10.1016/j.ecolind.2020.107249
Zhang, R., Zhang, R., and Zuo, Z. (2016). An overview of wintertime snow cover characteristics over China and the impact of eurasian snow cover on Chinese climate. J. Appl. Meteor. Sci. 27, 513–526. doi:10.11898/1001-7313.20160501
Zhang, T. T., Wang, T., Krinner, G., Wang, X. Y., Gasser, T., Peng, S. S., et al. (2019). The weakening relationship between Eurasian spring snow cover and Indian summer monsoon rainfall. Sci. Adv. 5, eaau8932. doi:10.1126/sciadv.aau8932
Zhao, Q., Hao, X., He, D., Wang, J., Li, H., and Wang, X. (2021). The relationship between the temporal and spatial changes of snow cover and climate and vegetation in northern Xinjiang from 1980 to 2019. Remote Sens. Technol. Appl. 36, 1247–1258. doi:10.11873/j.issn.1004-0323.2021.6.1247
Zheng, Y., Zhang, L., Li, W., Zhang, F., and Zhong, X. (2022). Spatial-temporal variation of snow black carbon concentration in snow cover in Northeast China from 2001 to 2016 based on remote sensing. Sustainability 14, 959. doi:10.3390/su14020959
Keywords: snow cover, fragmentation, spatio-temporal variation, Northeast China, AVHRR
Citation: Gu J, Ma Y, Zhang L, Huang Y, Zhang W, Zhang F, Liu J and Li C (2024) Spatio-temporal variation in snow cover area and its fragmentation in Northeast China. Front. Earth Sci. 12:1465071. doi: 10.3389/feart.2024.1465071
Received: 15 July 2024; Accepted: 11 November 2024;
Published: 12 December 2024.
Edited by:
Satoru Yamaguchi, National Research Institute for Earth Science and Disaster Resilience (NIED), JapanReviewed by:
Chuntan Han, Chinese Academy of Sciences (CAS), ChinaWon Young Lee, Catholic University of Daegu, Republic of Korea
Copyright © 2024 Gu, Ma, Zhang, Huang, Zhang, Zhang, Liu and Li. This is an open-access article distributed under the terms of the Creative Commons Attribution License (CC BY). The use, distribution or reproduction in other forums is permitted, provided the original author(s) and the copyright owner(s) are credited and that the original publication in this journal is cited, in accordance with accepted academic practice. No use, distribution or reproduction is permitted which does not comply with these terms.
*Correspondence: Lijuan Zhang, emhsakBocmJudS5lZHUuY24=