 Yongliang Tang1,2,3,4,5,6,7Dong Chen1,2,3,4,7Hucheng Deng8Fenglai Yang1,2,3,4Haiyan Ding1
 Yuyong Yang8*Cuili Wang1,4,7Xiaofei Hu8Naidong Chen1,4Chuan Luo8
 Ming Tang8Yu Du8
- 1PetroChina Tarim Oilfield Company, Korla, China
- 2R & D Center for Ultra-Deep Complex Reservoir Exploration and Development, CNPC, Korla, China
- 3Engineering Research Center for Ultra-deep Complex Reservoir Exploration and Development, Korla, China
- 4Xinjiang Key Laboratory of Ultra-deep Oil and Gas, Korla, China
- 5State Energy Key Laboratory of Carbonate Oil and Gas, Korla, China
- 6Key Laboratory of Carbonate, CNPC, Korla, China
- 7Key Laboratory of Gas Reservoir Formation and Development, CNPC, Korla, China
- 8Chengdu University of Technology, Chengdu, China
Fractures play a crucial role in tight sandstone gas reservoirs with low permeability and low effective porosity. If open, they not only significantly increase the permeability of the reservoir but also serve as channels connecting the storage space. Among numerous fracture identification methods, seismic data provide unique advantages for fracture identification owing to the provision of three-dimensional information between wells. How to accurately identify the development of fractures in geological bodies between wells using seismic data is a major challenge. In this study, a tight sandstone gas reservoir in the Kuqa Basin (China) was used as an example for identifying reservoir fractures using deep-learning-based method. First, a feasibility analysis is necessary. Intersection analysis between the fracture density and seismic attributes (the characteristics of frequency, amplitude, phase, and other aspects of seismic signals) indicates that there is a correlation between the two when the fracture density exceeds a certain degree. The development of fractures is closely related to the lithology and structure, indirectly affecting differences in seismic attributes. This indicates that the use of seismic attributes for fracture identification is feasible and reasonable. Subsequently, the effective fracture density data obtained from imaging logging were used as label data, and the optimized seismic attribute near the well data were used as feature data to construct a fracture identification sample dataset. Based on a feed-forward neural network algorithm combined with natural fracture density and effectiveness control factor constraints, a trained identification model was obtained. The identification model was applied to seismic multi-attribute data for the entire work area. Finally, the accuracy of the results from the training, testing, and validation datasets were used to determine the effectiveness of the method. The relationship between the fracture identification results and the location of the fractures in the target reservoir was used to determine the reasonableness of the results. The results indicate that there is a certain relationship between multiple seismic attributes and fracture development, which can be established using deep learning models. Furthermore, the deep-learning-based seismic data fracture identification method can effectively identify fractures in the three-dimensional space of reservoirs.
1 Introduction
With the continuous consumption of conventional oil and gas resources, unconventional tight sandstone oil and gas has gradually increased (Schmoker, 1996). Oil and gas resources in tight sandstone reservoirs exhibit enormous development potential, and many countries have made their development a key component of their national energy strategies (Nelson, 1985). Natural fractures play a significant role in tight sandstone gas reservoirs (Olson et al., 2009). Most of the fractures will be fully or partly sealed by mineral cement. When opening and filled.
Fractures are combined, with high fracture density there are probably significant numbers of open fractures, but nonetheless, the degree of mineral fill is an extremely important parameter (Laubach et al., 2019). It is especially important in deep sandstone reservoirs where high temperatures facilitate quartz cementation, both in the host rock and in fractures. Where open, they not only significantly increase the permeability of the reservoir but also facilitate the flow and migration of fluids (Ding et al., 2012). Moreover, due to the low permeability of tight sandstones, natural fractures become channels connecting the storage space (Gong et al., 2019), forming effective storage that helps gas escape from the reservoir more easily. In certain cases, e.g., the ultra-deep tight sandstone, due to the very low matrix porosity, the fracture porosity is much greater than that of grain pores, resulting in natural fractures becoming the main storage space for oil and gas (Zeng and Li, 2009; Zeng and Liu, 2009).
Recent oil and gas exploration practices have shown that the degree of nature fracture development is the key to determining whether tight sandstone reservoirs can achieve efficient and stable production (Deng et al., 2013; Ding et al., 2015a). The development characteristics of natural fractures in tight sandstone gas reservoirs are complex, including fracture types, geometric shapes, formation, evolution, and distribution patterns, which differ from those of conventional reservoirs. This imposes higher requirements for works on natural fracture identification, quantitative evaluation, and distribution identification. To evaluate and identify natural fractures more accurately, researchers have comprehensively applied various technical methods, such as geological descriptions (Gale et al., 2014; Lyu et al., 2022), core logging (Deng et al., 2024), seismic interpretation (Shoaib et al., 2022) and geochemistry analysis (Davalos, 2022), to quantitatively characterize the development status, formation mechanisms, and main controlling factors of different natural fractures in tight sandstone reservoirs (e.g., Ding et al., 2015b).
How to accurately identify the development of fractures in geological bodies between wells is a major challenge. The identification of natural fractures has undergone a qualitative, semiquantitative, and quantitative processes, and a preliminary technical system for identifying reservoir fractures has been formed (Liu et al., 2019; Zhang et al., 2021; Guo et al., 2022a; Hu, 2022; Yasin et al., 2022). However, in nature fracture research and identification, there are still two main issues: first, a single method is difficult to be applied universally owing to its inherent limitations. For example, seismic curvature (one of the seismic attributes) can only indirectly identify the development of natural fractures related to tectonic deformation of the strata and these fractures should be large scale. Second, the identification accuracy in practical applications must be improved. Therefore, identification research of fractured oil and gas reservoirs is still in the exploratory stage. Various identification technologies need to be further integrated and innovated to improve the identification accuracy to better guide the exploration and development of tight sandstone gas reservoirs.
Reservoir fractures can be identified using logging, core, and field data (Qi et al., 2024; Ding et al., 2013). Logging data are often used to identify natural fractures because of their high vertical resolution in a single well (Aghli et al., 2016). Logging methods for identifying natural fractures use conventional logging data and special logging data (e.g., full-waveform logging and wellbore imagers from Ezhov and Dubinya (2017) to identify and interpret natural fractures (Yong and Zhang, 2007). By analyzing the conventional logging data of oil and gas wells, a series of abnormal responses caused by fracture development can be observed, as reflected in the porosity, permeability, and electrical properties. Wellbore imaging technology uses two-dimensional images to visually display fracture information, which is helpful for identifying natural fractures (Hao, 2016). However, this technology relies primarily on resistivity scanning imaging, which limits its ability to identify natural fractures in three-dimensional zone between wells. Furthermore, this technology is dominated by manual analysis, relying on experience and multiple identification criteria, which are affected by the professional knowledge level of technicians, resulting in low identification efficiency.
The analysis of field data included the observation of outcrops and the study of geological structures. In the field, the outcrop fractures are formed by geological processes; however, traditional outcrop fracture research relies on manual delineation and traditional image processing algorithms, which not only consume considerable manpower but also introduce human errors, affecting the accuracy of geological research. Although modern image-processing technology can assist in simplifying fracture processing, it needs good quality input image data (Tian et al., 2018). Macroscopic and microscopic observations of natural fractures in field outcrops and rock cores can yield various natural fracture parameters, providing valuable basic data for fracture feature research and serving as a verification tool for other identification methods (Gale et al., 2014). A continuous underground fracture network model can be constructed by directly observing the natural fracture morphology in field outcrops, rock cores, and other samples combined with a small amount of drilling data (Bisdom et al., 2014). This model can detail the characteristics of natural fractures, such as type, occurrence, direction, density, length, opening degree, and filling degree, and quantitatively characterize the degree of natural fracture development at different scales in tight sandstone reservoirs (Ding et al., 2015b; Peacock and Sanderson, 2018). In addition, this model needs to be validated through the interpretation results of conventional logging or imaging logging. The data or model generated by the methods has low stability. Meanwhile, these methods are time-consuming and the results are data-dependent. The location, amount, and measurement method of data collected in the field can all affect the results.
Seismic data are typically used to interpret faults and indirectly identify natural fractures; however, it is difficult to identify small faults that are closely related to natural fracture development. Furthermore, many natural fractures are not related to faults at all. Seismic response characteristics indicate that when seismic events exhibit reflection and diffraction characteristics, such as complex waves, distortion, disorder, and discontinuity, they may indicate the presence of natural fractures in the reservoir. Natural fracture identification methods based on seismic data can be divided into two main types: anisotropic seismic fracture identification and seismic attribute analysis. Anisotropy is based on the principle that natural fractures enhance the anisotropy of geological structures and produce significant responses to seismic waves (Sun et al., 2014). The commonly used methods of this theory include shear wave splitting analysis (Ramos-Martinez et al., 2000; Bansal and Sen, 2008; Yang et al., 2022; Yang K. et al., 2024; Yang et al., 2024), P-wave anisotropy analysis (Jia et al., 2013), and multi-wave and multi-component methods (Wu et al., 2006). Post-stack seismic attribute analysis refers to the processing and analysis of seismic data on a profile using seismic attributes after the seismic data interpretation is completed to identify natural fractures and evaluate the degree of natural fracture development. This method can extract fracture-related information by calculating various attributes of the seismic data, such as amplitude, frequency, and phase (Baytok and Pranter, 2013). For example, the presence of natural fractures can lead to a decrease in seismic wave velocity and an increase in amplitude; thus, fractures can be identified by calculating the changes in seismic wave velocity and amplitude. In addition, natural fracture identification algorithms and models in seismic attribute analysis software (e.g., Petrel from Schlumberger) can be utilized to identify and classify fractures automatically. Currently, the application of curvature and coherence attributes to fracture identification methods is becoming increasingly widespread (Babasafari et al., 2022; de Oliveira et al., 2023). Coherent volume analysis technology and the curvature method are used to identify large-scale fractures to achieve a more accurate identification and identification of natural fractures in the study area.
However, for more complex geological conditions, relying solely on a single seismic attribute is no longer sufficient to meet identification requirements. Therefore, combining multiple attribute analyses may improve the accuracy of natural-fracture identifications. The combination and validation of multiple attributes can reduce the multiplicity of identification results and improve their reliability. The resolution of seismic data cannot identify individual fractures. However, seismic data attributes have a certain response to major faults, geological deformation, and lithological conditions. And these kinds of information are strongly related to the development of fractures. Therefore, using seismic data can indirectly identify areas with high-density development of fractures. Neural network technology based on deep learning has demonstrated a strong anti-interference ability and fault tolerance in oil and gas reservoir identification (Alizadeh et al., 2022; Tian et al., 2023; Li et al., 2023a; Li et al., 2023b; Kohzadvand et al., 2024). Artificial intelligence models are applied to identify fractures using logging data (Zerrouki et al., 2014; Tabasi et al., 2022; Ismail et al., 2024). However, the fractures between wells affect the deployment of well locations and engineering applications, which requires that seismic data should be utilized to identify fractures. To improve the accuracy of natural fracture identification and identify the development of natural fractures in the three-dimensional space between wells, this study proposed a deep-learning-based natural fracture identification technology workflow. In this workflow, at different depths in the well, the fracture densities obtained from the interpretation of image logging were used as the label data points, and multiple seismic attributes near the well were used as feature data points to construct a dataset. Using feedforward neural networks to obtain identification models, we identified the development of natural fractures in three-dimensional space using various seismic attributes. Comparative analysis of the verification wells showed that the results were highly accurate. The use of multiple seismic attributes for natural fracture identification based on deep learning is worthy of further promotion and application.
2 Geological setting
The Tarim Basin, located in the Xinjiang Uyghur Autonomous Region, is the largest petroliferous basin in China (Li J. et al., 2023). In the northern region, the Kuqa Depression is an important structural unit with abundant oil and gas resources (Li et al., 2024). Currently, medium-to-large natural gas fields, such as Kela 2, Keshen, Dabei, and Bozi, have been discovered (Liu et al., 2021; Liu et al., 2023). The Kelasu Tectonic Belt is the second row of tectonic belts in front of the Tianshan Mountains, and its formation was influenced by the Late Himalayan orogeny, particularly by the intense uplift of the South Tianshan Mountains (Guo et al., 2016). During the southward thrust process, it was obstructed by the Wensu-Xiqiu ancient uplift, resulting in large-scale compression and fragmentation of the western section and the formation of anticline structural traps of thrust faults and fault-related folds (Yang K. et al., 2024). Since the Yanshan period, this tectonic belt has formed four northward-dipping thrust faults with basement involvement. These are the Bozi-Kela, Kelasu, Keshen, and Baicheng faults, with gradually decreasing fault distances from north to south. They control the formation of four rows of fault structural zones, namely, the Bozi-Kela, Keshen, Baicheng, and southern Baicheng fault structural zones, as shown in Figure 1A and b (Tian et al., 2020).
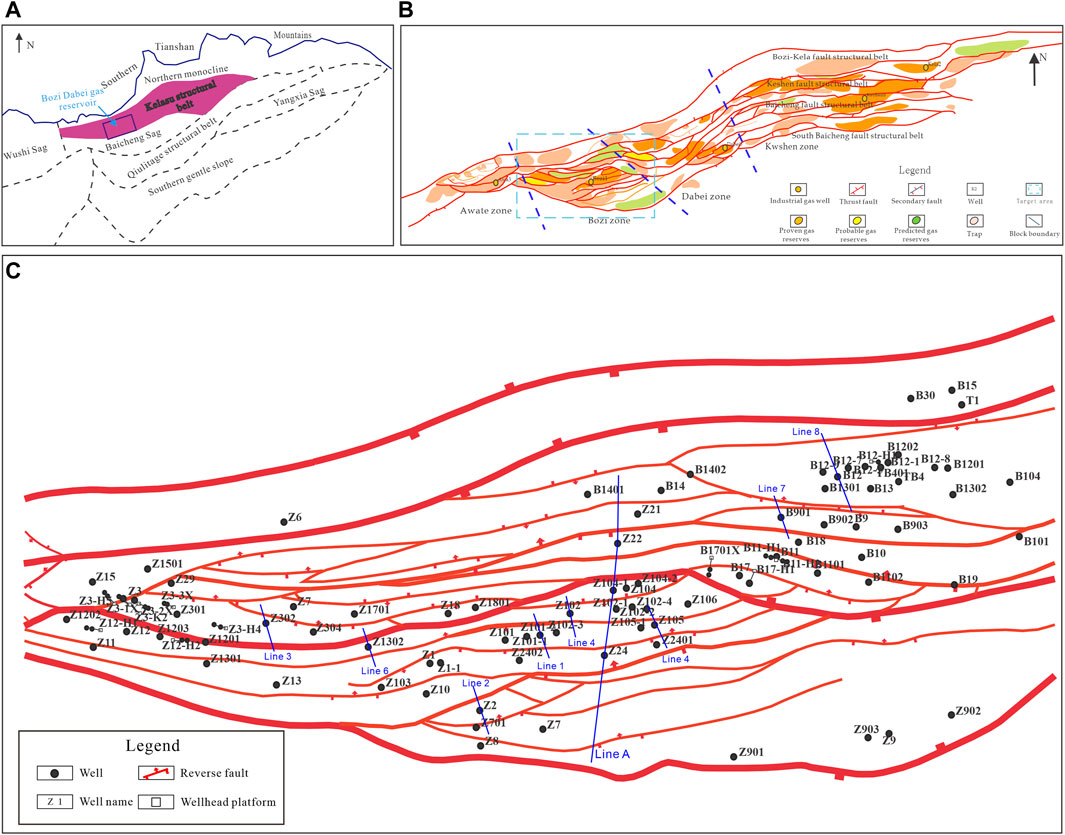
Figure 1. Regional location (Xu et al., 2022) (A) and structural outline map (Wang et al., 2023) (B) of the Krasu Structural Belt. (C) The structural map of the Bozi Dabei region.
The Kuqa Depression was an intracontinental depression basin in the Late Yanshan period (96.6–65 Ma) with uniform stratigraphic thickness and no significant thickening. During the Cretaceous–Jurassic, no significant uplift occurred in the strata of the area. In the Early Himalayan period (65–23 Ma), during the sedimentary period of the Kumglimu-Kangcun Formation, gypsum salt rocks were deposited in the basin, forming separated salt lakes. After co-sedimentation, the salt-rock layers began to flow, but no large-scale thrust structures appeared. In the Mid-to-Late Himalayan period (23–0.7 Ma), the Kuqa Depression was influenced by the uplift of the South Tianshan Mountains and evolved into an intracontinental foreland basin with an increase in the structural deformation styles (Luo et al., 2020; Wang et al., 2022; Yang K. et al., 2024). At this stage, the Central Kelasu fold-thrust belt (Zheng et al., 2020) is revived and the salt layer flows to form various salt structures. The above- and below-salt structural layers underwent layered deformation. In the Late Himalayan period (2.6–0.7 Ma), the Indian and Eurasian plates rapidly converged, and the Qinghai Tibet Plateau and Tianshan Mountains rapidly uplifted. The main stress direction in the Kelasu structural belt tends to be N-S or NW-SE.
The Bozi Dabei region is located in the western part of the Kelasu tectonic belt, is distributed in the NEE direction, and exhibits north–south zoning and east-west segmentation (as shown in Figure 1C). The region was vertically divided into three structural units: above salt, below salt, and basement (Fan et al., 2008). There are two types of construction styles: above and below salt. Typical synsedimentary structures developed in the salt structural unit include growth anticlines and faults. This characteristic is deformation during sedimentation, and the difference in sedimentary thickness reflects the process of structural deformation. The below-salt structural unit formed owing to the strong thrust of the South Tianshan Mountains, characterized by imbricated tectonic zones, with the development of northward-dipping and locally southward-dipping thrust faults. The structural styles are mainly fault-related folds, with both basement involvement and cover detachment structures bounded by the Bozi-Kela Fault. On this horizon, the area north of the Keshen Fault is mainly characterized by imbalanced fault anticlines, whereas the area south of the Keshen Fault is characterized by gentle folds. The central and southern regions of the Keshen section commonly have gentle back-thrust and counter-thrust gentle folds.
The study area has developed three types of natural fractures related to regional tectonic stress, faults, and tectonic deformation respectively. (Zhou, 1998) (as shown in Figure 2). Based on the filling properties of fractures in the core and the relationship between fractures, it can be determined that there are mainly three periods of fractures (Figure 3A). Mid-period full-filled fractures cut early full-filled fractures, while late-period fractures are mainly half-filled or unfilled. The cathode luminescence photo of the fracture filling material indicates that there is a significant difference in the cathode luminescence color of calcite. The photo shows two periods of calcite-filling characteristics (Figure 3B). The homogenization temperature analysis of the calcite in the fracture filling material of the core showed two obvious peak ranges: 100°C–120°C and 130°C–160°C. The uniform temperature of a small amount of inclusions is between 170 and∼180°C (Figure 3C). The C-O isotope results of the fracture filling material indicate that the filled and half-filled fractures are mainly developed in three periods. Unfilled fractures mainly formed during the late Himalayan period to the present (Figure 3D).
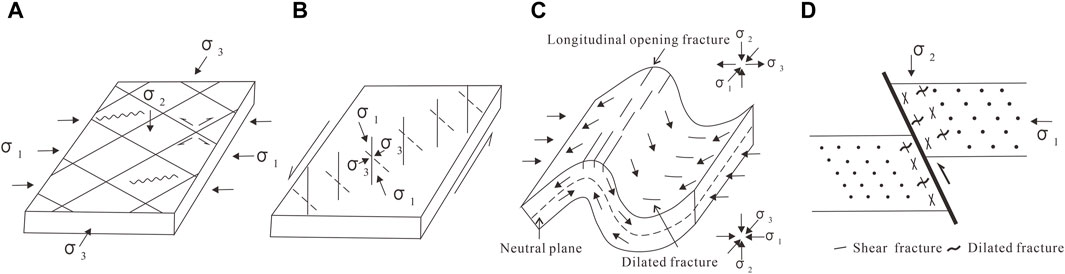
Figure 2. Classification of fracture types based on genesis. Different types of fracture formation. (A) Regional tectonic fracture (Squeeze stress field); (B) Regional tectonic fracture Shear stress field; (C) Deformation-related fractures; (D) Fault co-derived fractures (Zhou, 1998).
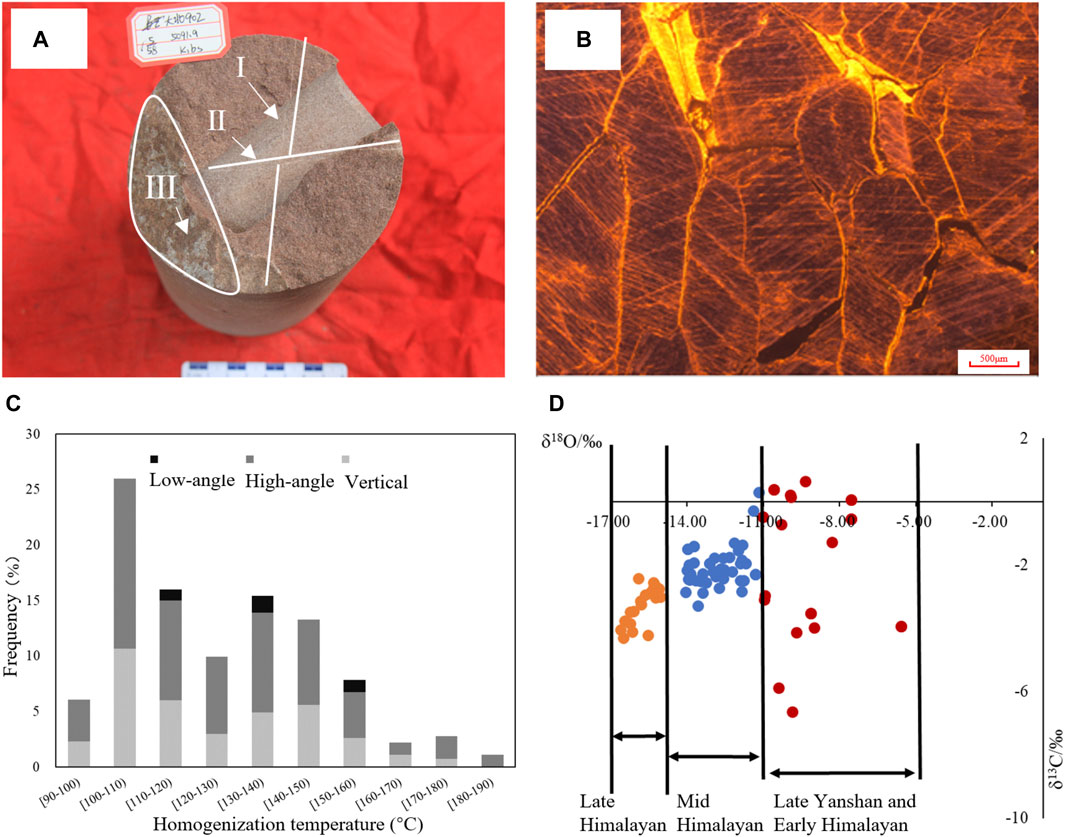
Figure 3. The periodic characteristics of fractures. (A) A core at a depth of 5,091.9 m in well B902. Visible shear fractures in three periods. The fracture of period II (full-filled) cut through the period I (full-filled). The period III is half-filled. (B) Cathode luminescence photos of fracture filling materials in K1bx formation; (C) A uniform temperature bar chart of calcite filling material inclusions in the study area, with a total of 181 data points; The range of the low-angle, high-angle, and vertical are 15°–45°, 45°–75°, and 75°–90°, respectively. (D) Stable C-O isotope results of calcite filling material in the study area, with a total of 89 data points. (Modified from Wang et al., 2023).
3 Database
The seismic data coverage area of the study area is 1,200 km2, including the Bozi and Dabei areas. A typical seismic profile of the study area is shown in Figure 4A (the section location is Line A in Figure 1). The seismic profile shows that the strata in the region are vertically divided into three structural units: salt above the structural unit, salt below the structural unit, and the basement structural unit. The target layer (Cretaceous Bashijiqike (K1bs) and Baxigai (K1bx) Formation) of this study area is nearly 200–300 m thick. Therefore, most of the wells in this work area have only reached around 300 m, starting from the top of the Cretaceous strata.
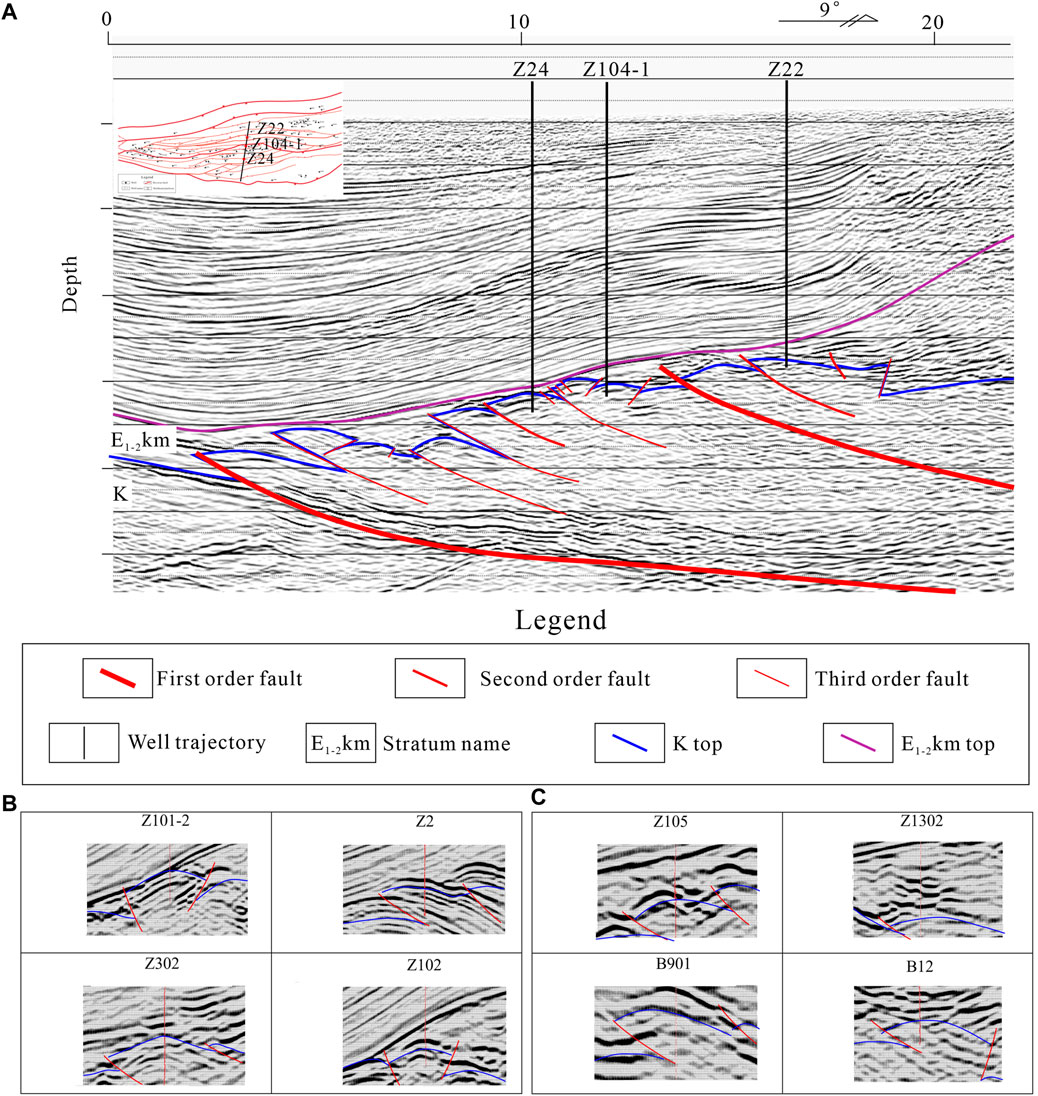
Figure 4. (A) Typical seismic section in the Bozi-Dabei region. The lithology between the K top and E1-2km top is a gypsum salt layer. The upper and lower layers of the gypsum salt layer exhibit two distinct structural features. Seismic data under gypsum salt at different well locations in the Bozi-Dabei area (B) Wells with thinner salt layers (less than 100 m); (C) Wells with thicker salt layers (greater than 200 m). The blue lines represent the top of the Cretaceous, the red diagonal lines represent the faults, and the red vertical lines represent the wells. The continuity of the events in the four sections on the left is significantly better than that in the four sections on the right.
The surface of the Kuqa Basin includes two landforms, the Gobi and mountainous areas; thus, seismic data are easily affected by the surface during seismic acquisition. The Gobi Desert forms a low-velocity zone near the surface, causing attenuation of the energy generated by seismic sources and further attenuation of the energy when reflection waves propagate upward to the ground. In contrast, the target layer was located under the gypsum salt layer at a greater depth, and the inaccurate velocity of the gypsum salt layer made it difficult to image the subsurface structures. A thick salt layer significantly affects imaging quality. The seismic sections passing through Z101-2, Z2, Z302, and Z102 are shown in Figure 4B (the section locations are Line 1, Line2, Line3, and Line4 in Figure 1C, respectively), and the seismic profiles passing through the Z105, Z1302, B901, and B12 wells are shown in Figure 4C (the section locations are Line 5, Line6, Line7, and Line8 in Figure 1C, respectively). The thicknesses of the gypsum salt layers in the two sets of wells were less than 100 m and greater than 200 m, respectively. A comparison between the two sets of seismic sections indicates that the quality of the seismic data is better when the gypsum salt layer is thinner. Therefore, the quality of the seismic data can be judged based on the thickness of the gypsum salt layer. Regions with higher seismic data quality had higher reliability in obtaining the identified results. The thickness of the gypsum salt layer obtained from the logging data was interpolated on a plane, and the results are shown in Figure 5. The thickness of the gypsum salt layer within the region delineated by the white dashed line in the Figure 5 was relatively small (less than 100 m). The quality of seismic data in this region was less affected by the gypsum salt layer, and logging data were more suitable for natural fracture identification than data outside the region.
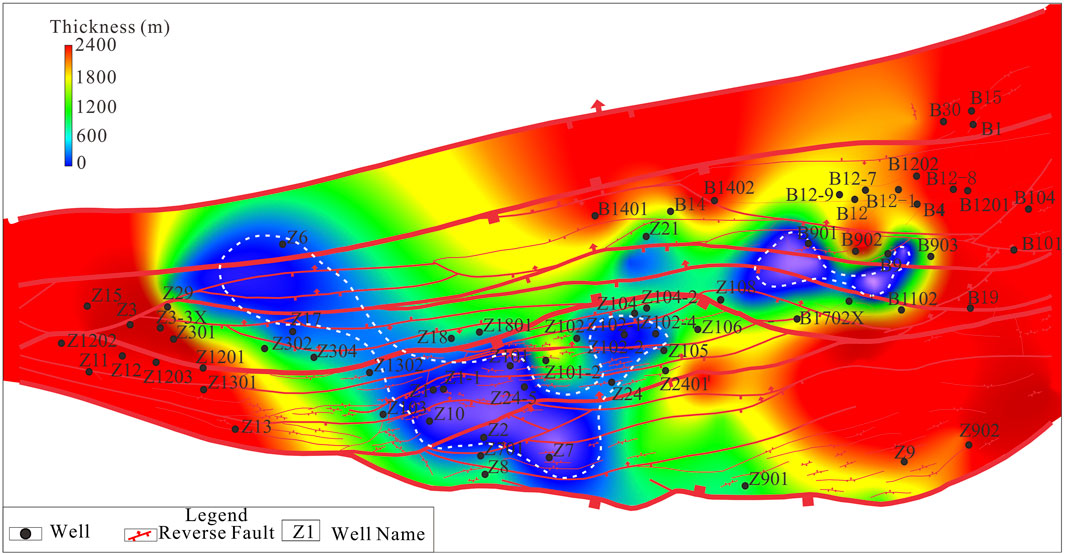
Figure 5. Salt layer thickness of Bozi-Dabei area. The thicknesses of the gypsum salt layers in the areas near wells Z10, Z24, and B901 are relatively thin.
The study area has abundant imaging logging and core data. Fracture information recorded by imaging logging and rock cores is the basis and inspection standard for characterizing and identifying natural fractures using seismic data (Wilson et al., 2015). Based on the core and image logging data, we can interpret the development characteristics of natural fractures in the study area. Imaging logging data provide reliable image data for evaluating fractures and their characteristic parameters. These images clearly display the characteristics of the wellbore fractures. The high-density sampling, high resolution, and high wellbore coverage of imaging logging enable not only the identification of natural fractures, classification of fracture types, and determination of fracture development intervals, but also the quantitative analysis of fractures and calculation of fracture parameters.
Fractures can be classified into unfilled, half-filled, full-filled, and closed according to their filling properties. Based on thin section identification, core observation, and imaging logging data, these types of fractures can be identified. We define unfilled and half-filled fractures as effective fractures. Full-filled and closed fractures are defined as ineffective fractures. Different types of features are shown in Figure 6A. The main filling materials are calcite, quartz, and dolomite. Based on the measured gamma-ray intensity of the core, the corresponding gamma curve of the rock core is matched with that of the logging data to achieve the conversion from the core depth to the logging depth. The statistical results of fracture widths indicate they are mainly concentrated between 0.2 and 0.6 mm (as shown in Figure 6B).
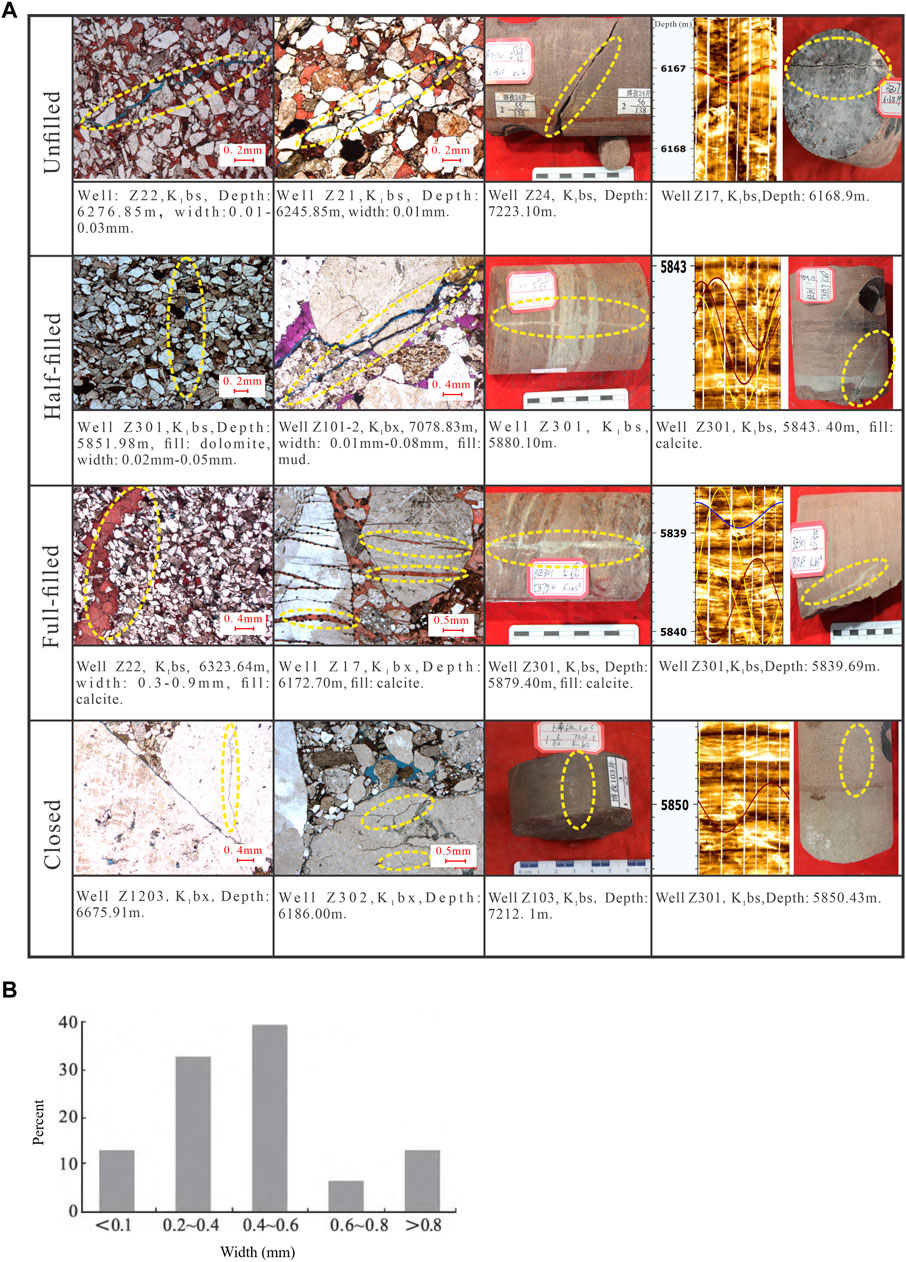
Figure 6. (A) Classification of fracture types based on filling characteristics. The first and second columns: thin section photos; the third column: core photos; the fourth column: imaging logging and core images. The yellow dashed ellipses in the images indicate the fractures. (Modified from Wang et al., 2023). (B) The percentage of fractures with different widths.
4 Workflow
4.1 Data preparation
The first step in natural fracture identification based on deep-learning method is establishing a training sample set. The sample data consisted of well-known fracture developments and their corresponding seismic attributes. The seismic attributes are the characteristic data of the sample set. Currently, the seismic attributes commonly used for natural fracture identification can be classified into three categories: waveform similarity (Cheng et al., 2022), geometric features (Lv et al., 2024), and absorption attenuation (Guo et al., 2022b). Waveform similarity classes include coherent bodies, edge detection, and variance bodies. Geometric feature classes include curvature and inclination attributes. The absorption attenuation category includes amplitude, frequency, and spectral attributes. The development of natural fractures is related to the lithology, faults, and deformation of the strata; the lithology, faults, and other responses to deformation affect the seismic attributes. In particular, the lithology affects the wave impedance of the seismic. Fault characteristics affect the coherence and ant tracking (Gai et al., 2022) properties of seismic data. The deformation of the strata affects the curvature and dip angle properties. Therefore, after extracting the seismic attributes based on the above categories, they can be used as feature data of the sample set.
The label data in the sample set represent the development of fractures. In this method, we used the fracture density (the number of the fractures per meter) as the label data. While fracture size is typically a key component of a fracture intensity measure (Ortega et al., 2006) in our study there is not much variation in the widths of fractures in a given same well (Figure 6). The core and imaging log data from the well do not allow the height of the fractures to be measured (except for a few vertical fractures), because we cannot determine the location of the fracture terminations that lie beyond the core or wellbore. The target layers we studied are Cretaceous Bashijiqike and Baxigai Formation, with a thickness between 100 and 300 m and mostly comprise a single lithology. Our current method is insufficient to identify the opening degree and height of fractures.
Using image-logging data, the location of natural fractures in the wellbore can be intuitively obtained, including their occurrence, degree of opening, and extension along the wellbore direction. From imaging logging data, natural fractures and induced fractures can be identified and distinguished. The induced fractures in the logging image appear as feather-shaped and symmetrically arranged. This type of fracture does not belong to natural fractures, so we did not consider this type when establishing the labeled dataset. Natural fractures can be further divided into effective and ineffective fractures. The opened fractures appear as dark sinusoidal stripes on the image and are manually selected to obtain characteristic information such as the inclination, dip angle, and orientation of each fracture at different depths. As shown in Figure 6, the fracture development identified by image logging was converted into fracture density results as well as seismic attribute curves near the well.
In this case study, the sample interval for seismic data as feature data is 8 m. The image-logging data, which serves as label data, clearly has higher accuracy in identifying fractures than seismic data. In order to unify the label data with the feature data, we calculated the fracture density of one sampling point per 8 m, as shown in Figure 7. The fracture development identified by image logging was converted into fracture density results as well as seismic attribute curves near the well.
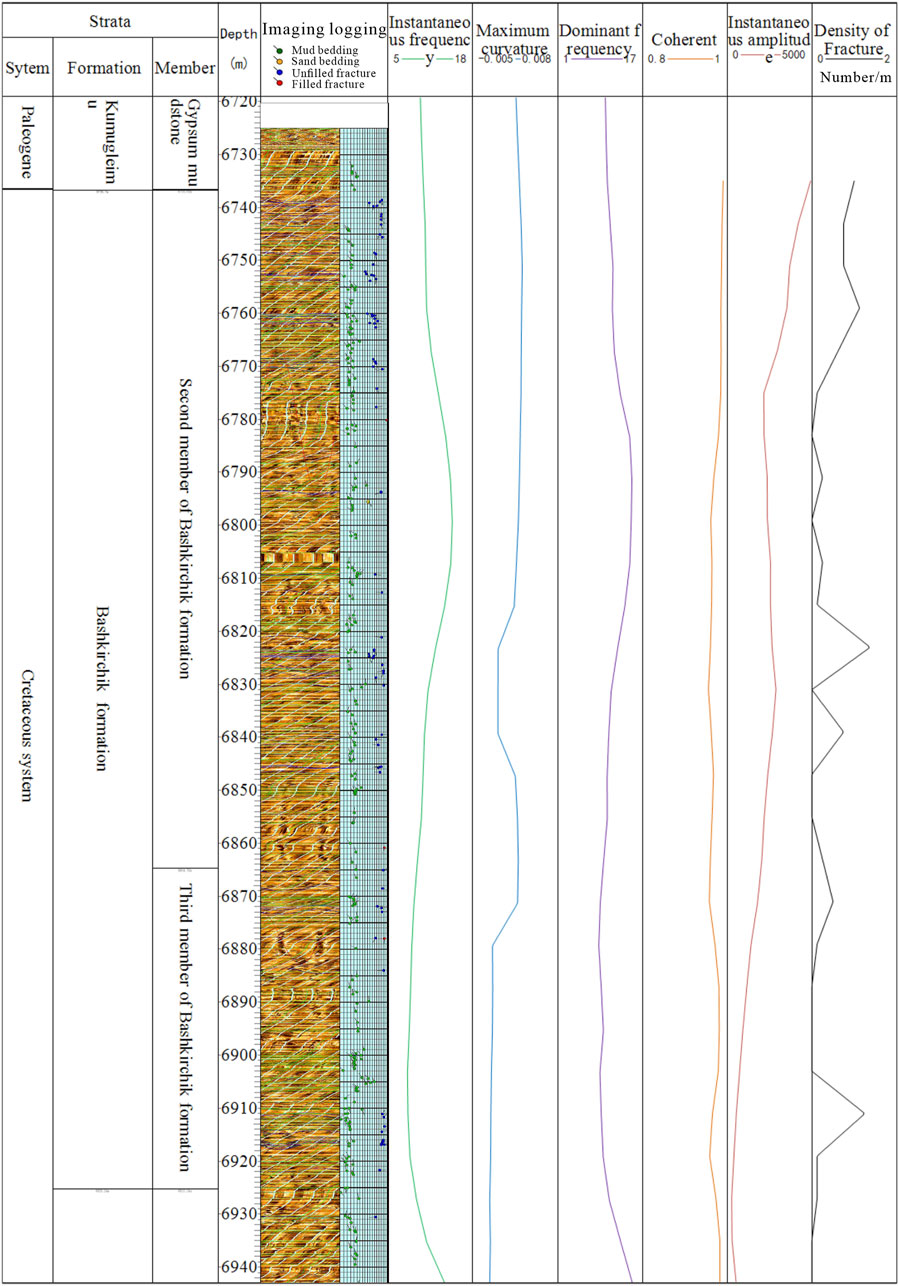
Figure 7. Comparison diagram of fracture development and seismic attributes in well Bozi 104. Only 5 seismic attributes are displayed here. The seismic attributes and fracture density curves are both connected by a data point every 8 m.
4.2 Response analysis of natural fractures with multiple seismic attributes
The credibility of the seismic data was determined by analyzing the correlation between the fracture density and seismic-related attributes. When seismic waves propagate through fractures, they are scattered and cause energy attenuation. In addition, under regional stress conditions, different lithologies of the strata can affect the development of fractures (Nemati and Pezeshk, 2005). The lithology of the strata is related to the wave impedance attribute in seismic properties (Jin et al., 2023). Therefore, there is a connection between wave impedance properties and regional structural fractures. For structural deformation-related fractures, the stronger the degree of deformation, the more developed the fractures, and the greater the curvature (Patra, 2019). Therefore, the deformation-related fractures are related to curvature. For fault co-derived fractures, the development degree of fractures near the fault is high, and the corresponding coherence and ant tracking properties have abnormal responses. Therefore, this type of fracture is related to properties such as coherence and tracking properties. In summary, there is a certain relationship between seismic attributes and fracture development, but this relationship is not a simple linear relationship, so it is necessary to use neural network models to establish this relationship. Therefore, the presence of fractures can indirectly affect the attribute characteristics of the seismic data.
To test the correlation between seismic attributes and fracture density, an intersection map was created using the fracture density in the wellbore and the corresponding seismic attributes at the corresponding locations, as shown in Figure 8A. The intersection analysis results indicated a linear negative correlation with the wave impedance attribute, a linear or exponential positive correlation with the three-dimensional curvature attribute, and a linear positive correlation with the instantaneous Q value (attenuation) attribute when the fracture density was greater than 0.1–0.5 (number/m). This indicates that the seismic attributes have a certain degree of correlation with the density of fracture development and indicates the feasibility of using seismic attributes to identify fractures during subsequent steps. Meanwhile, this also indicates that only when the density of the fractures reaches a certain degree can they cause a response to seismic attributes.
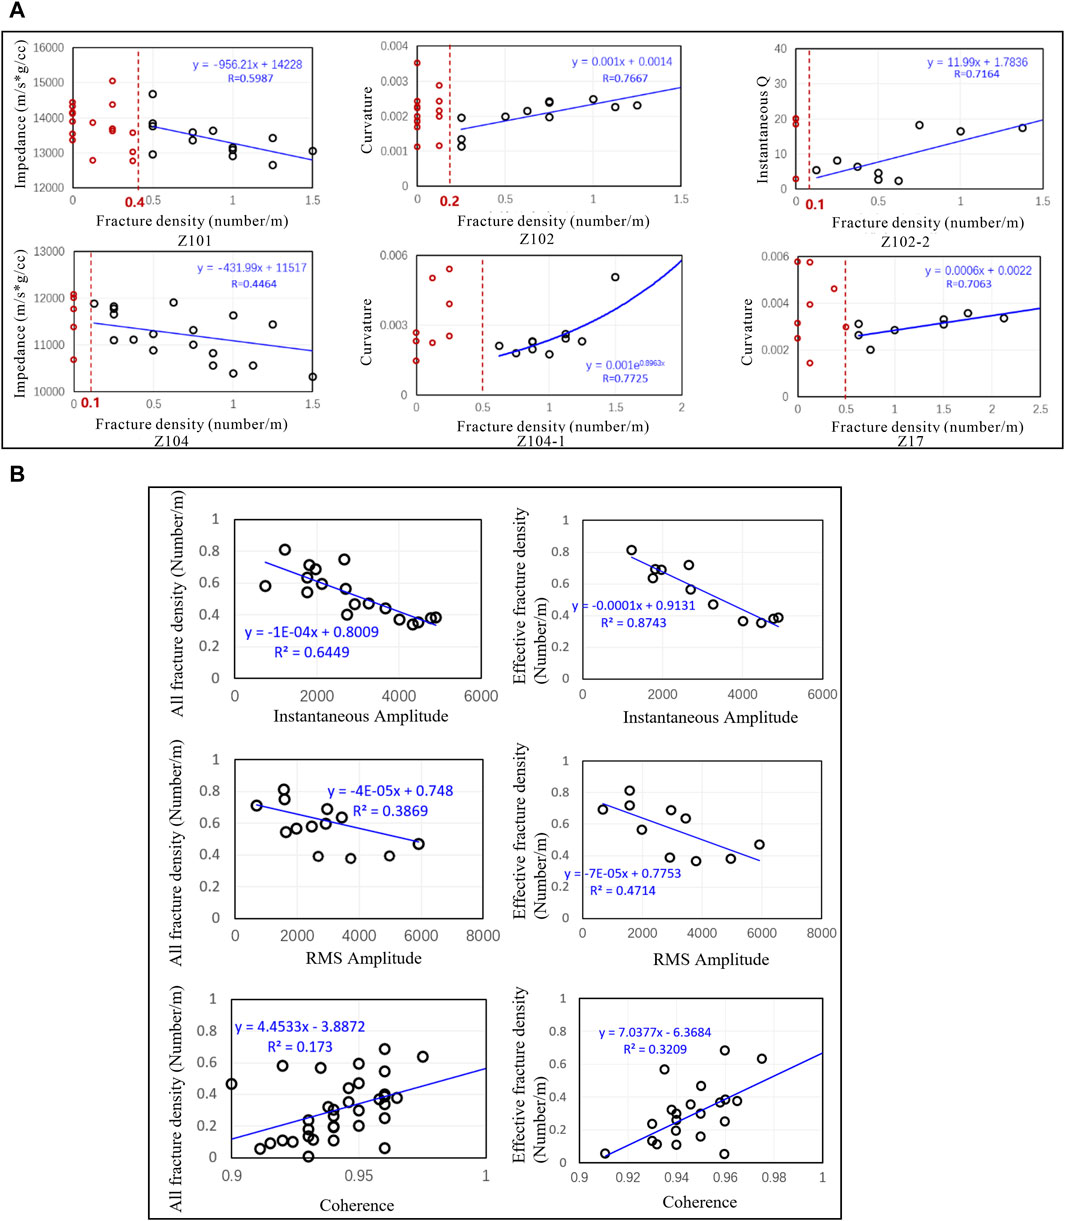
Figure 8. Relationship between single well fracture density and seismic attributes. The blue lines in the Figure represent the fitting curves, R represents the correlation coefficients, the red dashed lines represent the fitting boundary (samples smaller than this limit are not included in the fitting), and the red circles represent the data points that did not participate in the fitting. The relationships are chosen with the best correlation coefficients to linear, exponential, and logarithmic relationships. (A) The fracture densities of all subgraphs are the effective fracture densities. (B) The left and right columns represent all fracture and effective fracture densities, respectively; From top to bottom are instantaneous amplitude, root mean square amplitude, and coherent attributes.
The seismic responses of effective and ineffective fractures are different. We analyzed the relationship between seismic attributes and fracture density in two situations: all fractures and effective fractures. The results indicate a better correlation between effective all fractures and seismic attributes than all fractures, as shown in Figure 8B. Therefore, in this study, we focused on the effective fractures.
A correlation between the density of the fractures in the wells shown in Figures 4B, C with the seismic attributes was made, and the results are shown in Figures 9A, B, respectively. The events of the seismic data near the wells with a significant correlation between the effective fracture development density and seismic attributes were relatively continuous, with clear structures and a thin overlying gypsum salt layer. The seismic data near the well, with no clear correlation, showed discontinuous events (likely small faults) and thick salt layers. The quality of the seismic data of the Cretaceous strata is relatively poor. Statistical results show that the correlation between seismic attributes such as coherence, curvature, and fracture density can reflect the quality of the seismic data (as shown in Figure 9).
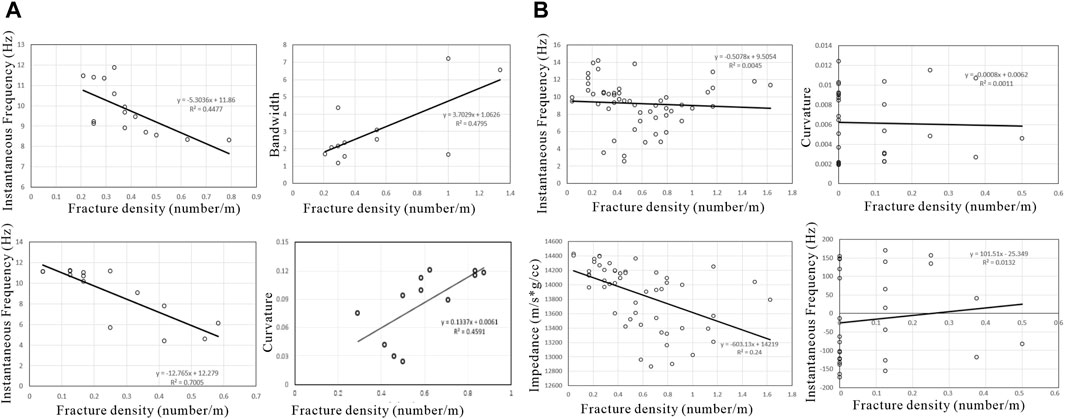
Figure 9. Intersection diagram of fracture density and seismic attributes at wells with (A) thin and (B) thick salt layers. The correlation coefficients of the four statistical graphs on the left are significantly better than those on the right.
4.3 Sample set
Different geological and mechanical environments in different well areas result in different relationships between fracture development and structure or lithology. Therefore, when establishing the sample set, all the selected data were from the same well area. Most of the wells were selected as training data, and the remaining few wells did not participate in training to verify the identification results.
Owing to the differences in amplitude and physical meaning between different attributes, the first step is to normalize the selected attributes with a value range of [0,1] using Equation 1.
where, A is the value of seismic attribute, min () and max () are the maximum and minimum functions, respectively. Then, in a particular location in the well, statistical parameters were calculated, such as the variance and mean of different attributes near the well for different radii. To unify the seismic attribute and fracture density information into the same spatial sampling grid, the fracture density information must be gridded. Fracture interpretation results from image logging were generated as equidistant data points based on the seismic resolution (8 m). The fracture-density data obtained from image logging were discrete and could undergo drastic changes at certain positions. Therefore, to improve the degree of matching between the fracture density and seismic attributes, we smoothed the fracture density curve using Equation 2.
To quantitatively analyze the relationship between different seismic attributes and fracture density, we used neighborhood component analysis (NCA) to calculate the sample similarity between different attributes and fracture density using Equation 3.
where
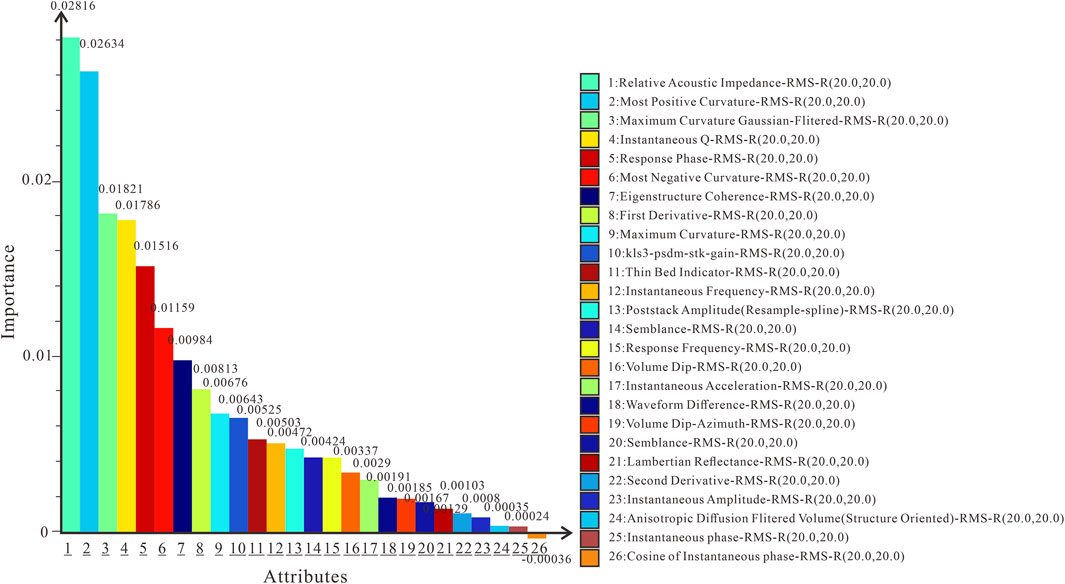
Figure 10. Ranking of correlation between different seismic attributes and fracture density. RMS means root mean square, and R (a, b) represents the range of values for inline a and crossline b attributes. The “Importance” value has no quantitative meaning, indicating the contribution of this attribute to the network model. The larger this value, the greater the impact and sensitivity of these attributes on the results.
4.4 Constructing the neural network structure for fracture identification
In order to ensure that the training data covers the study area, we randomly divided the dataset. The fracture density curve and seismic attribute data obtained from image logging were randomly divided into training, testing, and validation sets by well location. Generally, around 80% of the samples are selected for training, 10% are used for validation, and the remaining 10% are used for testing. The fracture density curve in the training set was used as the label data and the filtered seismic attribute data were used as the feature data. The deep learning network structure used was U-net, which segments the input data based on its features, extracts the feature information from the segmented data to form a new image grid, and then uses this new image grid as the input for subsequent iterations. This process continues until the smallest data unit that accurately reflects the original input features is obtained. The number of nodes in the input layer, middle layer, and output layer were 29, 10, and 1, respectively. The maximum number of iterations was set to 2,000, and the minimum mean square error for regression was 10–5. A trained identification model based on the feedforward neural network algorithm was obtained (Figures 11A, B). Finally, based on the identification model, the development of fractures was identified using seismic attribute information. A comparison between the identified results of the training, test, and validation sets and the actual results is shown in Figure 12, and a comparison of the results of the training and validation wells is shown in Figure 13. The training wells were the input wells that participated in the neural network training, and the validation wells were the wells that did not participate in the training. The identified results for the training and validation wells exhibited a high degree of agreement with the actual fracture densities obtained in the image logging. These results confirm the accuracy of the identification results. Through this verification process, the method could accurately identify the development of natural fractures.
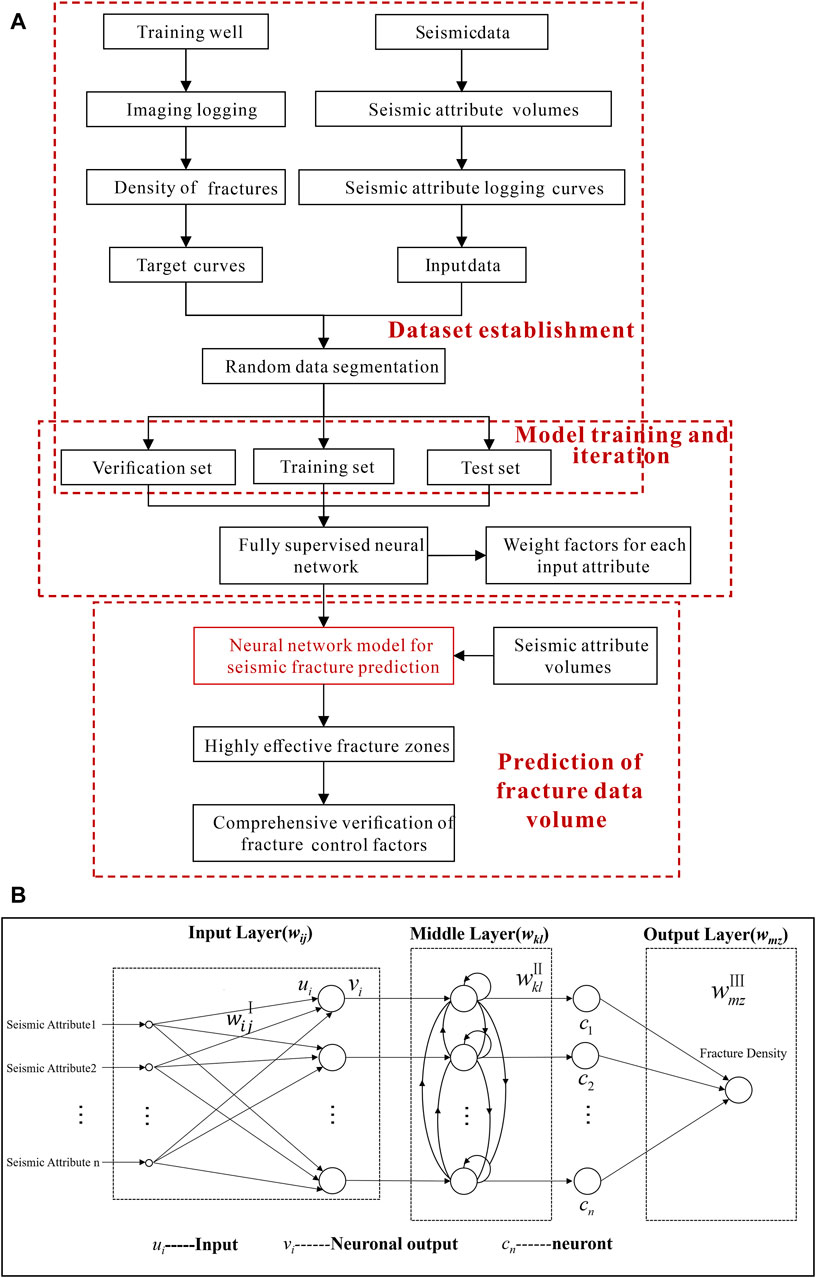
Figure 11. (A) Workflow diagram of neural network fracture identification process. The workflow is generally divided into three parts: dataset establishment, model training and iteration, and fracture data volume identification. (B) Structure diagram of feedforward neural network. It is mainly divided into three layers: input, middle, and output layers.
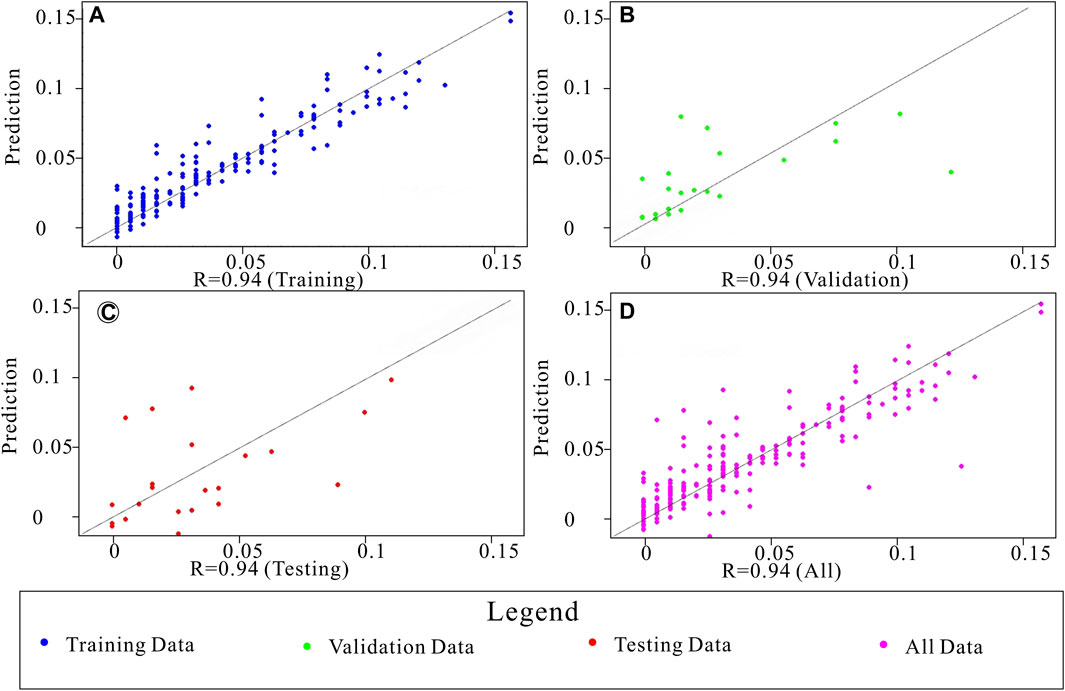
Figure 12. Intersection diagram between identified and actual results. (A–D) are the results for the training set, validation set, test set, and all data scenarios, respectively. Generally, around 80% of the samples are selected for training, 10% are used for validation, and the remaining 10% are used for testing.
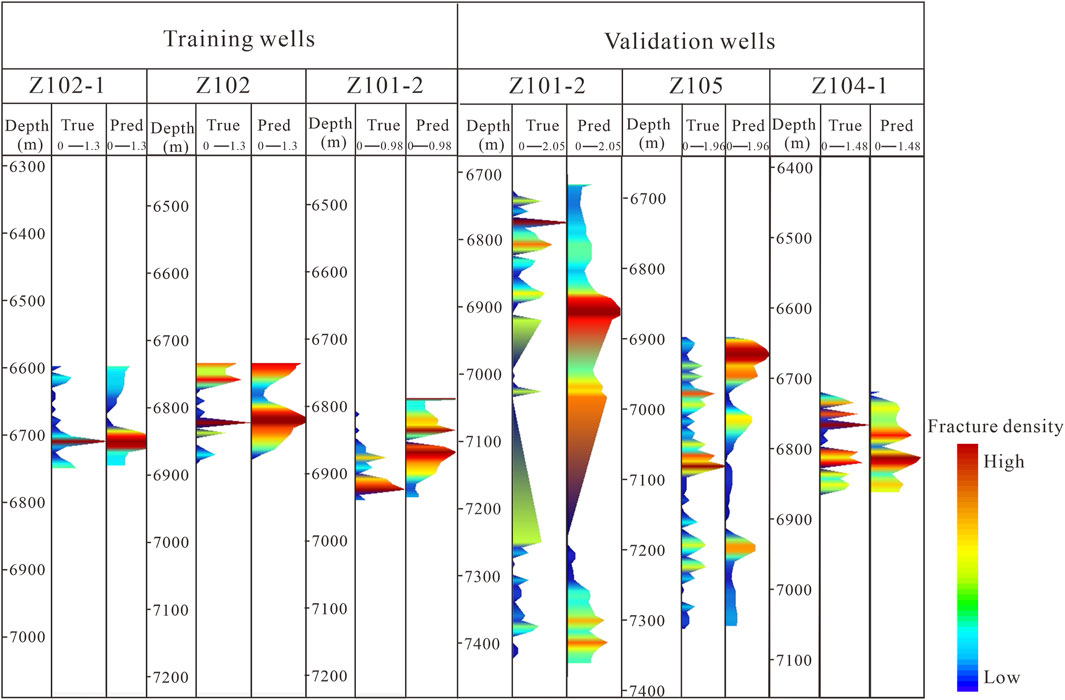
Figure 13. True density curves and identified results of fractures in the (A) training and (B) validation wells. True means the actual fracture density, while Pred means the identification results of the fracture density. The results show that there is an overall excellent agreement in the actual and identification of fracture densities.
To ensure the accuracy of the identification model during the training process, the following measures were taken: a) select long well segment data to participate in the training and reduce the randomness of the sample wells; b) smooth fracture density data to reduce the impact of outliers; and c) use as many attributes as possible, explore the effective information of seismic signals and identify the development of fractures using a total of 26 attributes (as shown in Figure 10) from four types of seismic attributes.
5 Application results and evaluation
The fracture identification results for the Z101 and Z102 fault blocks are shown in Figure 14. The identified fracture development has a matching relationship with faults and local deformation, indicating that certain fractures are fault-related and others are related to formation deformation.
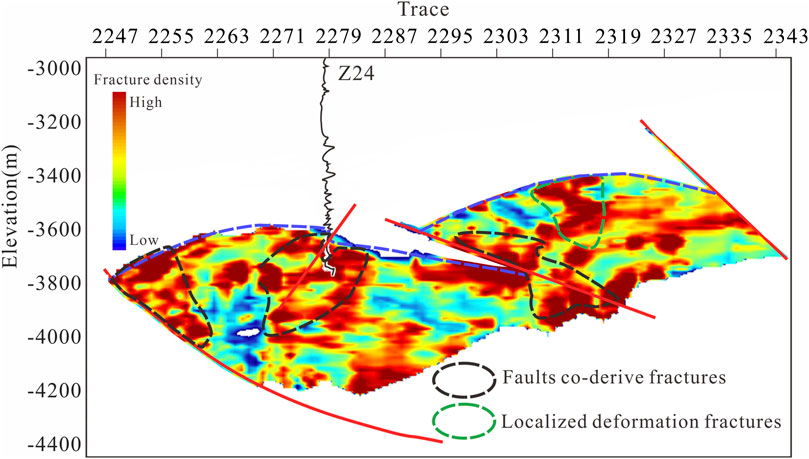
Figure 14. Identification results of local fractures in Bozi 101 and Bozi 102 fault blocks. The red lines represent the faults, the blue dashed lines represent the top of the Cretaceous strata, and the black lines represent the density curve of well Z24.
Based on the location of the target layer, the three-dimensional data volume of the fracture identification results was extracted along the layer and displayed in three-dimensional space, as shown in Figure 15A. The area covered in pink in Figure 15A is the high fracture development area. The position of the Z102 fault block is marked in Figure 15A with a black dashed line. The results indicate that the fracture density of the Z102 fault block is relatively high compared to that of the other fault blocks, and it has a certain resource potential. Based on the thickness of the Cretaceous strata, the fracture density data volume was layered to extract the fracture density results. The identified fractures in the different sublayers of the Cretaceous strata in the Z1 well area are shown in Figures 15B–D. The identification results indicate that the effective fracture densities in the central and eastern parts of the Z104, Z102, and Z105 blocks, as well as in the western part of Z1, were relatively high (>0.3 number/m).
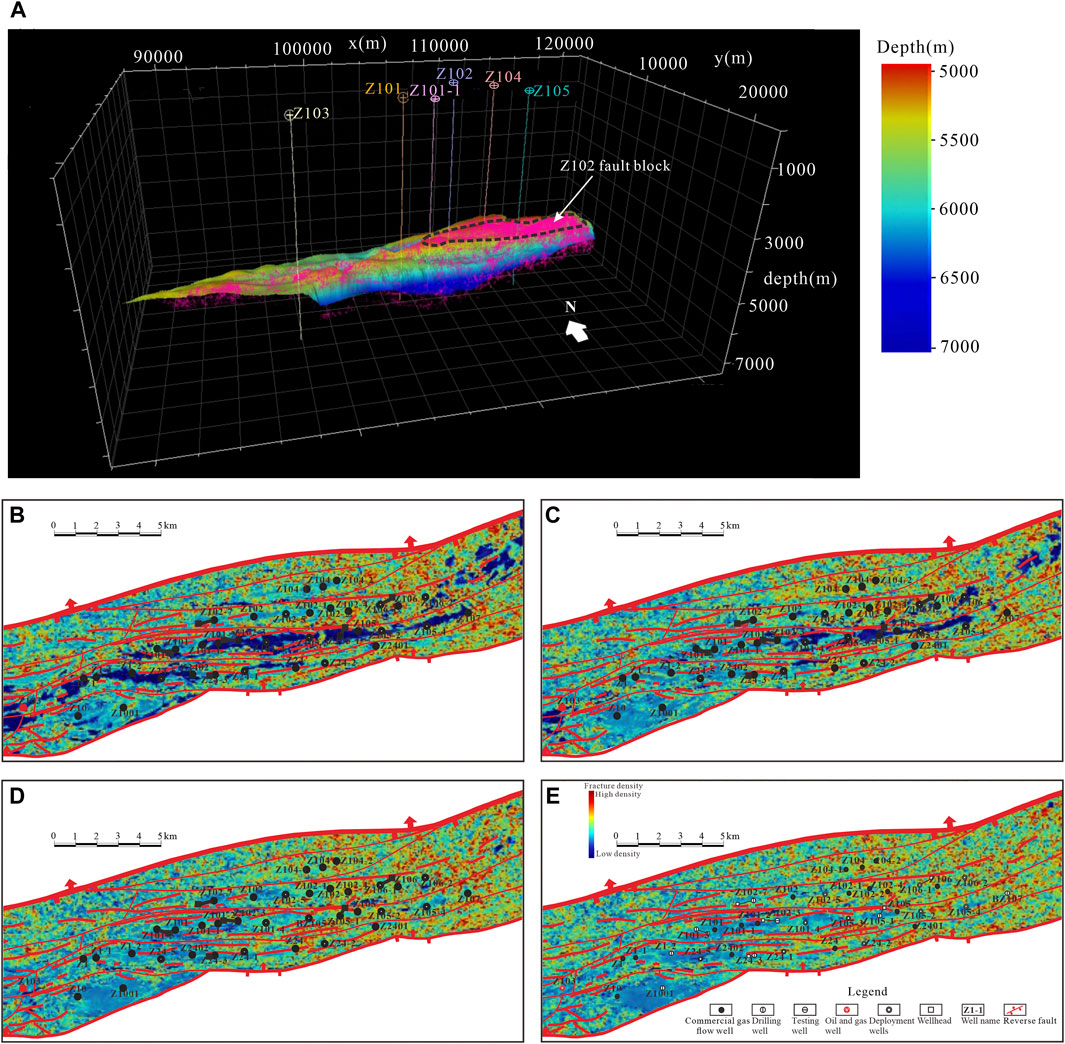
Figure 15. The results of identified fractures in the Cretaceous strata. (A) Three-dimensional map of identified fractures in the Cretaceous strata. Distribution map of fracture identification results for different layers: Cretaceous Bashijiqike (B) second and (C) third sections and Baxigai (D) first and (E) second sections.
6 Discussion
We tried to consider the correlation between seismic attributes and fractures as much as possible. Based on this rationality, we used seismic attributes for identification, instead of randomly selecting a large number of attributes for purposeless training. The well logs can be used to develop a fracture signature function equation for determining natural fractures, which requires no special image log to identify natural fractures. However, this machine learning models did not identify the fracture and non-fracture zones with acceptable accuracy (Ismail et al., 2024). Therefore, the development of fractures in the three-dimensional space between wells needs to be constrained using seismic data with deterministic information. Conventional attribute-based methods can be used to identify the fractures. However, the fractures identified by these methods are of single genesis. In general, multiple genesis fractures exist simultaneously, making it difficult to fuse the results of fracture identification based on multiple attributes. The relationship between seismic attributes and natural fractures is indeed complex and difficult to establish with an accurate formula. Therefore, this article adopts a neural network model to establish the relationship between these two parts. This relationship can effectively fuse the identification results of fractures with different genesis. Furthermore, if some attributes with poor performance were used in training, it would almost not affect the final identification results. Because the weights of these attributes with poor performance in the training model are relatively low. If we only selected the few attributes with the highest correlation coefficients with fracture density, the results would be unstable.
Different types of seismic attributes characterize different geological features such as stratigraphic continuity, degree of stratigraphic deformation, lithology, and fluid-related characteristics (Guo et al., 2022a; Cheng et al., 2022; Lv et al., 2024). The correlation between the seismic attributes and natural fractures can be obtained through neural network analysis. Based on the current analysis results, the wave impedance and attenuation Q attributes are strongly correlated with the density of natural fractures. Therefore, the results of the neural network analysis and their geological significance can be obtained, and the properties related to the lithology (wave impedance and Q attenuation) and deformation degree (curvature) of the strata control the development of fractures.
The fracture density curves in the training set were used as the label data and the filtered seismic attribute data were used as the feature data. The resolution difference between imaging logging data and seismic data is very significant. To unify the resolution of these two types of data, we have taken the following measures: setting the sampling rate of the fracture density curve to 8 m, which enables the resolution of label data and feature data to match. On the other hand, seismic data samples are not selected from individual sampling points near the wellbore but rather averaged within a certain range around the wellbore because the response of seismic signals is determined by the characteristics of the rock medium within a certain range around the well.
Pre-stack seismic data can reflect mechanical parameters, such as the Young’s modulus and Poisson’s ratio. In addition, relying solely on post-stack data includes only wave impedance and seismic attribute information. Rock mechanics parameters affect the stress state of rock media and directly affect fracture development (Mejia et al., 2020). For example, the fracture density peaks when the dynamic Young’s modulus is in the range of 45–48.5 GPa and the dynamic Poisson’s ratio is negatively correlated with the fracture density (Liu et al., 2022). Therefore, further utilization of pre-stack data to obtain rock mechanics parameters can more accurately identify the development of fractures. In subsequent research, if pre-stack seismic data can be effectively applied or more information obtained from wide-angle seismic data can be introduced into the training model, the effectiveness of fracture identification will be further improved.
Fracture information can be obtained through different methods. The value of nuanced interpretation of what little data we do have from cores, logs, and outcrop work is essential. Natural fracture systems are complex, multiscale, 3D entities, whose properties vary depending on a large number of factors. The orientation (strike) is a key fracture attribute and can be guided by the orientations of the microfractures in the samples of the core. The orientations of the fractures are the important parameters (Laubach et al., 2019), but our workflow is currently unable to identify this parameter. Burial history and fracture diagenesis influence fracture attributes and may provide more information for fracture identification than is commonly appreciated (Gale et al., 2014) and need to be further utilized to identify the fractures. Deep learning methods can combine multiple factors for fracture identification. Therefore, in our future research, in order for a machine learning approach to be useful these factors need to be understood in a general way and included in the training.
The size and opening degree of fractures are important parameters. The pore volume of fractured foundation rock depends on the fracture porosity and on the widths and sizes of fractures. These properties can be calculated from water-pressure tests if the intergranular permeability is minimal compared to the fracture permeability. Taking into account them, the volume ratio of fractures can be calculated more accurately. Our current method makes it difficult to identify the widths and heights of fractures. We will consider identifying them in the future study. Fractures can be divided into structural-, fault-, and deformation-related fractures based on their genesis. To a certain extent, these fractures were related to different geological characteristics. For example, the distance from the fault determines the degree of development of the fault co-derived fractures (Valencia, 2020). As the tectonic deformation of the strata, the development of fractures varies at different locations of the strata (Xu et al., 2021). The development characteristics of the fractures related to regional tectonic stress vary in different lithology under the same tectonic stress environment (Yasin et al., 2022). Therefore, different types of fractures affect seismic attributes. If different types of fractures are identified based on seismic data, more reliable results can be obtained. Meanwhile, although there are differences in the characteristics of fractures generated in different periods, our current methods still struggle to identify fractures in different periods. We will study the methods identifying the fractures at different periods in our future research.
The advantage of identifying natural fractures based on logging data and rock cores is that they have high vertical resolution in single wells (Dong et al., 2020). The method of identifying fractures in field outcrops using local sampling does not directly identify the development of fractures in the target layer (Zeeb et al., 2013). Our method first establishes the relationship between seismic information and fractures in the well. Based on this relationship, the fractures between wells can be identified. This method effectively utilizes the high-resolution advantage of wellbore fractures and identifies fractures in three-dimensional space.
In summary, the fractures in three-dimensional space between wells are important for the characterization of oil and gas reservoirs, understanding geological processes, and estimating mechanical environments. Seismic are effective signals for detecting fractures in three-dimensional space. By using deep learning methods to establish relationships based on known samples, the geological features in the three-dimensional space between wells can be quantitatively detected.
7 Conclusion
This study conducted methodological research on the identification of reservoir fractures in tight sandstone gas reservoirs. The feasibility of identifying fractures using seismic attributes was determined by analyzing the response of natural fractures with multiple seismic attributes. The analysis results of the seismic data indicated that when the thickness of the gypsum salt was low, the quality of the seismic data improved. Therefore, the quality of seismic data can be determined based on the thickness of the gypsum salt layer.
The high-density sampling, high resolution, and high wellbore coverage of imaging logging enable its use for the quantitative analysis of fractures as label data. The intersection analysis of fracture density and seismic attributes showed that there is a correlation between fracture density and seismic attributes when it is higher than a certain degree, indicating the feasibility of using seismic attributes to identify fractures in subsequent steps. The correlation ranking results of the seismic attributes indicate that the lithology of the strata (wave impedance and Q attenuation) and the degree of strata deformation (curvature) of the reflecting strata control the development of fractures in this area. However, it is currently uncertain whether only these parameters controlled the development of fractures in this area. To determine all the controlling factors of these fractures, further research is needed based on the development characteristics of the fractures.
The identification results for the training and validation wells showed a high degree of agreement with the actual image-logging fracture density. This confirms the accuracy of the identification results. The identified results of fractures have a matching relationship with faults and local deformation, indicating that certain fractures are co-derived from faults, and others are local deformation fractures. There is a certain relationship between multiple attributes and fracture development, which can be established using deep learning models. Furthermore, the deep-learning-based seismic data fracture identification method can effectively identify fractures in the three-dimensional space between wells. Deep-learning-based techniques provide a feasible solution for geological features that cannot be directly measured. A single source of information cannot fully describe a geological body, and we need to integrate multiple sources of information to understand geological features more accurately.
Data availability statement
The original contributions presented in the study are included in the article/supplementary material, further inquiries can be directed to the corresponding author.
Author contributions
YT: Writing–review and editing. DC: Writing–review and editing. HuD: Writing–original draft. FY: Writing–review and editing. HaD: Writing–review and editing. YY: Writing–original draft. CW: Writing–review and editing. XH: Writing–review and editing. NC: Writing–review and editing. CL: Writing–original draft. MT: Writing–original draft. YD: Writing–original draft.
Funding
The author(s) declare that no financial support was received for the research, authorship, and/or publication of this article.
Acknowledgments
We greatly appreciate editors and reviewers for their comments and helpful suggestions. We also thank the software tool VVA from Geomodeling Beijing Technology Corp. for data processing, and CorelDraw (Trial version) and Petrel from Schlumberger for the result presentation.
Conflict of interest
Authors YT, DC, FY, HD, CW, and NC were employed by PetroChina Tarim Oilfield Company. Authors YT, DC, FY, and CW were employed by CNPC.
The remaining authors declare that the research was conducted in the absence of any commercial or financial relationships that could be construed as a potential conflict of interest.
Publisher’s note
All claims expressed in this article are solely those of the authors and do not necessarily represent those of their affiliated organizations, or those of the publisher, the editors and the reviewers. Any product that may be evaluated in this article, or claim that may be made by its manufacturer, is not guaranteed or endorsed by the publisher.
References
Aghli, G., Soleimani, B., Moussavi-Harami, R., and Mohammadian, R. (2016). Fractured zones detection using conventional petrophysical logs by differentiation method and its correlation with image logs. J. Pet. Sci. Eng. 142, 152–162. doi:10.1016/j.petrol.2016.02.002
Alizadeh, N., Rahmati, N., Najafi, A., Leung, E., and Adabnezhad, P. (2022). A novel approach by integrating the core derived FZI and well logging data into artificial neural network model for improved permeability prediction in a heterogeneous gas reservoir. J. Petroleum Sci. Eng. 214, 110573. doi:10.1016/j.petrol.2022.110573
Babasafari, A., Chinelatto, G., and Vidal, A. (2022). Fault and fracture study by incorporating borehole image logs and supervised neural network applied to the 3D seismic attributes: a case study of pre-salt carbonate reservoir, Santos Basin, Brazil. Petroleum Sci. Technol. 40 (12), 1492–1511. doi:10.1080/10916466.2021.2025072
Bansal, R., and Sen, M. K. (2008). Finite-difference modelling of S-wave splitting in anisotropic media. Geophys. Prospect. 56 (3), 293–312. doi:10.1111/j.1365-2478.2007.00693.x
Baytok, S., and Pranter, M. J. (2013). Fault and fracture distribution within a tight-gas sandstone reservoir: mesaverde group, mamm creek field, piceance basin, Colorado, USA. Geosci 19 (3), 203–222. doi:10.1144/petgeo2011-093
Bisdom, K., Gauthier, B. D. M., Bertotti, G., and Hardebol, N. J. (2014). Calibrating discrete fracture-network models with a carbonate three-dimensional outcrop fracture network: implications for naturally fractured reservoir modeling. AAPG Bull. 98 (7), 1351–1376. doi:10.1306/02031413060
Cheng, Z., Bian, L., Chen, H., Wang, X., Ye, D., and He, L. (2022). Multiscale fracture prediction technique via deep learning, seismic gradient disorder, and aberrance: applied to tight sandstone reservoirs in the Hutubi block, southern Junggar Basin. Interpretation 10 (4), T647–T663. doi:10.1190/INT-2021-0249.1
Davalos, E. E. (2022). Assessing fracture networks and geochemistry of geothermal systems in magma-poor continental rifts: an example from the Malawi rifted zone. Stillwater, Oklahoma, United States: Oklahoma State University.
Deng, G., Ren, W., Cao, F., Yang, D., and Jiang, L. (2024). Fracture prediction and application in carbonate reservoirs based on the rescaled range analysis-finite difference numerical analysis methods. Petroleum Sci. Technol., 1–17. doi:10.1080/10916466.2024.2337391
Deng, H.-C., Zhou, W., Zhou, Q.-M., Chen, W.-L., and Zhang, H.-T. (2013). Quantification characterization of the valid natural fractures in the 2nd Xu Member. Acta Petrol. Sin. 29 (3), 1087–1096.
de Oliveira, N., Eberton, N., Fatah, R., Dias, T. Y. A., Freire, R. M. A. F. M., and Lupinacci, W. M. (2023). Curvature analysis and its correlation with faults and fractures in presalt carbonates, Santos Basin, Brazil. Mar. Petroleum Geol. 158, 106572. doi:10.1016/j.marpetgeo.2023.106572
Ding, W., Mei, Y., Yin, S., Liu, Z., Zhao, D., and Liu, J. (2015a). Logging inversion on pore-crack features of coal measure strata in Qinshui Basin. Coal Sci. Technol. 43 (2), 53–57.
Ding, W., Wang, X., Hu, Q., Yin, S., Cao, X., and Liu, J. (2015b). Progress in tight sandstone reservoir fracture research. Adv. Earth Sci. 30 (7), 737–750. doi:10.11867/j.issn.1001-8166.2015.07.0737
Ding, W.-L., Li, C., Li, C.-Y., Xu, C.-C., Jiu, K., Zeng, W., et al. (2012). Fracture development in shale and its relationship to gas accumulation. Geosci. Front. 3 (1), 97–105. doi:10.1016/j.gsf.2011.10.001
Ding, W.-L., Zhu, D.-W., Cai, J.-J., Gong, M.-L., and Chen, F. (2013). Analysis of the developmental characteristics and major regulating factors of fractures in marine-continental transitional shale-gas reservoirs: a case study of the Carboniferous-Permian strata in the southeastern Ordos Basin, central China. Mar. Pet. Geol. 45, 121–133. doi:10.1016/j.marpetgeo.2013.04.022
Dong, S., Zeng, L., Lyu, W., Xia, D., Liu, G., Wu, Y., et al. (2020). Fracture identification and evaluation using conventional logs in tight sandstones: a case study in the Ordos Basin, China. Energy Geosci. 1 (3-4), 115–123. doi:10.1016/j.engeos.2020.06.003
Ezhov, K., and Dubinya, N. (2017). “Application of special well logging techniques for geomechanical model improvement in naturally fractured reservoirs,” in Spe Russian Petroleum technology conference 2017. Moscow, Russia.
Fan, Q., Lü, X., Yang, M., and Xie, H. (2008). Influence of salt beds on the segmentation of structure and hydrocarbon accumulation in Qiulitag Structural Belt, Tarim Basin, China. J. China Univ. Geosciences 19 (2), 162–173. doi:10.1016/S1002-0705(08)60035-7
Gai, S., Jia, A., Wei, Y., and Liu, R. (2022). Characterization and modelling of multiscale natural fractures in shale reservoirs: a case study from a block in the southern sichuan basin. Geofluids 2022, 1–11. doi:10.1155/2022/6872983
Gale, J. F., Laubach, S. E., Olson, J. E., Eichhubl, P., and Fall, A. (2014). Natural fractures in shale: a review and new observations. AAPG Bull. 98 (11), 2165–2216. doi:10.1306/08121413151
Gong, L., Su, X., Gao, S., Fu, X., Jabbari, H., Wang, X., et al. (2019). Characteristics and formation mechanism of natural fractures in the tight gas sandstones of Jiulongshan gas field, China. J. Pet. Sci. Eng. 175, 1112–1121. doi:10.1016/j.petrol.2019.01.021
Guo, X., Liu, K., Jia, C., Song, Y., Zhao, M., Zhuo, Q., et al. (2016). Constraining tectonic compression processes by reservoir pressure evolution: overpressure generation and evolution in the Kelasu Thrust Belt of Kuqa Foreland Basin, NW China. Mar. Petroleum Geol. 72, 30–44. doi:10.1016/j.marpetgeo.2016.01.015
Guo, Z., Nie, N., and Liu, C. (2022a). Fracture characterization based on improved seismic amplitude variation with azimuth inversion in tight gas sandstones, Ordos Basin, China. Mar. Petroleum Geol. 146, 105941. doi:10.1016/j.marpetgeo.2022.105941
Guo, Z., Zhang, X., Liu, C., Liu, X., and Liu, Y. (2022b). Hydrocarbon identification and bedding fracture detection in shale gas reservoirs based on a novel seismic dispersion attribute inversion method. Surv. Geophys. 43 (6), 1793–1816. doi:10.1007/s10712-022-09726-z
Hao, B.-Y. (2016). Oil and gas reservoir fracture prediction methods and development trends. Chem. Manag. 2018 (26), 330. doi:10.3969/j.issn.1008-4800.2016.26.284
Hu, L. (2022). A review of mechanical mechanism and prediction of natural fracture in shale. Arabian J. Geosciences 15 (6), 474–516. doi:10.1007/s12517-022-09786-w
Ismail, A., Torabi, F., Azadbakht, S., and Yasin, Q. (2024). Identification of natural fractures in shale gas reservoirs using fracture signature function and machine learning models. Unconv. Resour. 4, 100069. doi:10.1016/j.uncres.2023.100069
Jin, H., Liu, C., and Guo, Z. (2023). Characterization of tight gas sandstone properties based on rock physical modeling and seismic inversion methods. Energies 16 (22), 7642. doi:10.3390/en16227642
Jiu, K., Ding, W., Huang, W., You, S., Zhang, Y., and Zeng, W. (2013). Simulation of paleotectonic stress fields within Paleogene shale reservoirs and prediction of favorable zones for fracture development within the Zhanhua Depression, Bohai Bay Basin, East China. J. Pet. Sci. Eng. 110, 119–131. doi:10.1016/j.petrol.2013.09.002
Kohzadvand, K., Mahmoudi, K., Ghasemi, M., and Shafiei, A. (2024). Novel robust Elman neural network-based predictive models for bubble point oil formation volume factor and solution gas–oil ratio using experimental data. Neural Comput. Appl., 1–24. doi:10.1007/s00521-024-09821-9
Laubach, S., Lander, R., Criscenti, L. J., Anovitz, L. M., Urai, J. L., Pollyea, R. M., et al. (2019). The role of chemistry in fracture pattern development and opportunities to advance interpretations of geological materials. Rev. Geophys. 57, 1065–1111. doi:10.1029/2019RG000671
Li, J., Wang, R., Qin, S., Shi, W., Geng, F., Luo, F., et al. (2024). Evolution of Mesozoic paleo-uplifts and differential control on sedimentation on the southern margin of Kuqa Depression, Tarim Basin. Mar. Petroleum Geol. 161, 106707. doi:10.1016/j.marpetgeo.2024.106707
Li, T., Zhang, Y., Zhu, G., Chen, Z., and Li, Xi. (2023). Environmental controls on organic matter enrichment of the lower Cambrian source rocks in the Tarim Basin, Northwest China. Mar. Petroleum Geol. 158, 106539. doi:10.1016/j.marpetgeo.2023.106539
Li, X., Qi, Q., Huang, H., Yang, Y., Duan, P., and Cao, Z. (2023a). An efficient deep learning method for VSP wavefield separation: a DAS-VSP case. Geophysics 88 (6), WC91–WC105. doi:10.1190/geo2023-0062.1
Li, X., Qi, Q., Yang, Y., Duan, P., and Cao, Z. (2023b). Removing abnormal environmental noise in nodal land seismic data using deep learning. Geophysics 89 (1), WA143–WA156. doi:10.1190/geo2023-0143.1
Liu, J., Chen, P., Xu, K., Yang, H., Liu, H., and Liu, Y. (2022). Fracture stratigraphy and mechanical stratigraphy in sandstone: a multiscale quantitative analysis. Mar. Petroleum Geol. 145, 105891. doi:10.1016/j.marpetgeo.2022.105891
Liu, J.-S., Ding, W.-L., Xiao, Z.-K., and Dai, J.-S. (2019). Advances in comprehensive characterization and prediction of reservoir fractures. Prog. Geophys. in Chin. 34 (6), 2283–2300. doi:10.6038/pg2019CC0290
Liu, Z., Chen, D., Gao, Z., Wu, Y., Zhang, Y., Fan, K., et al. (2023). 3D geological modeling of deep fractured low porosity sandstone gas reservoir in the Kuqa Depression, Tarim Basin. Front. Earth Sci. 11, 1171050. doi:10.3389/feart.2023.1171050
Liu, Z., Zhang, Y., Liu, H., Lv, Z., and Huang, W. (2021). Analysis of gas well classifications and productivity influencing factors in kela-2 gas field. CT&F - Cienc. Tecnol. Futuro 11, 63–70. doi:10.29047/01225383.382
Luo, W., Liang, S.-H., Jiang, X., An, N., and Du, R. (2020). Crack recognition of outcrop area based on deep learning. Comput. Mod. 2020 (5), 56–62. doi:10.3969/j.issn.1006-2475.2020.05.010
Lv, B., Chen, X., Qie, C., and Jiang, W. (2024). Integrated characterization of deep karsted carbonates in the tahe oilfield, Tarim Basin. J. Geophys. aand Eng. 21 (2), 668–684. doi:10.1093/jge/gxae031
Lyu, W., Zeng, L., Lyu, P., Yi, T., Dong, S., Wang, S., et al. (2022). Insights into the mechanical stratigraphy and vertical fracture patterns in tight oil sandstones: the upper triassic yanchang formation in the eastern Ordos Basin, China. J. Of Petroleum Sci. Eng. 212, 110247. doi:10.1016/j.petrol.2022.110247
Mejia, S., Eleazar, C., Rueda, C., Julio, A., and Roehl, D. (2020). Numerical simulation of three-dimensional fracture interaction. Comput. Geotechnics 122, 103528. doi:10.1016/j.compgeo.2020.103528
Nelson, R. A. (1985). Geological analysis of naturally fractured reservoirs. Texas: Gulf Publishing Company.
Nemati, M., and Pezeshk, H. (2005). Spatial distribution of fractures in the Asmari Formation of Iran in subsurface environment: effect of lithology and petrophysical properties. Nat. Resour. Res. 14 (4), 305–316. doi:10.1007/s11053-006-9000-y
Olson, J. E., Laubach, S. E., and Lander, R. H. (2009). Natural fracture characterization in tight gas sandstones: integrating mechanics and diagenesis. AAPG Bull. 93 (11), 1535–1549. doi:10.1306/08110909100
Ortega, O., Marrett, R., and Laubach, E. (2006). A scale-independent approach to fracture intensity and average spacing measurement. AAPG Bull. 90 (2), 193–208. doi:10.1306/08250505059
Patra, D. (2019). “Azimuthal Amplitude Analysis, Coherence Attribute, and 3D Curvature for Basement Fracture Characterization in Magenta Field, South Sumatra, Indonesia,”. Tulsa, Oklahoma, United States: The University of Tulsa.
Peacock, D. C. P., and Sanderson, D. J. (2018). Structural analyses and fracture network characterisation: seven pillars of wisdom. Earth-Science Rev. 184, 13–28. doi:10.1016/j.earscirev.2018.06.006
Qi, Q., Xue, Y., Cao, J., and Wang, X. (2024). Inversion of shear wave slowness and attenuation from dipole acoustic logging data based on an equivalent tool theory. Geophysics 89 (4), D255–D265. doi:10.1190/geo2023-0587.1
Ramos-Martinez, J., Ortega, A. A., and McMechan, G. A. (2000). 3-D seismic modeling for cracked media: shear-wave splitting at zero-offset. Geophysics 65 (1), 211–221. doi:10.1190/1.1444712
Schmoker, J. W. (1996). Resource evaluation of the continuous oil accumulation of the bakken formation (upper devonian and lower mississippian) in the williston basin, north Dakota, and Montana. Prog. Geophys. 33 (1), 2–9.
Shoaib, K., Zafar, Z. A., Raja, Z. A., and Burley, S. D. (2022). Ratana field, Potwar fold belt, Northern Pakistan: high intensity fracture zones related to major thrust faults as revealed by seismic fracture prediction. J. Petroleum Geol. 45 (3), 253–282. doi:10.1111/jpg.12819
Sun, W., Li, Y.-F., Fu, J.-W., and Li, T.-Y. (2014). Review of fracture identification with well logs and seismic data. Prog. Geophys 29 (3), 1231–1242. doi:10.6038/pg20140332
Tabasi, S., Tehrani, P. S., Rajabi, M., Wood, D. A., Davoodi, S., Ghorbani, H., et al. (2022). Optimized machine learning models for natural fractures prediction using conventional well logs. Fuel 326, 124952. doi:10.1016/j.fuel.2022.124952
Tian, J., Yang, H., Wu, C., Mo, T., Zhu, W., and Shi, L. (2020). Discovery of Well Bozi 9 and ultra-deep natural gas exploration potential in the Kelasu tectonic zone of the Tarim Basin. Nat. Gas. Ind. 40 (1), 11–19. doi:10.3787/j.issn.1000-0976.2020.01.002
Tian, X., Daigle, H., and Jiang, H. (2018). Feature detection for digital images using machine learning algorithms and image processing. Houston, Texas, United States: SPE/AAPG/SEG Unconventional Resources Technology Conference, D023S034R004.
Tian, Y., Stovas, A., Gao, J., Meng, C., and Yang, C. (2023). Frequency-dependent AVO inversion and application on tight sandstone gas reservoir prediction using deep neural network. IEEE Trans. Geoscience Remote Sens. 61, 1–13. doi:10.1109/TGRS.2023.3328183
Valencia, I. (2020) “A secondary guide for fracture density incorporating structural deformation, distance from faults and fault displacement,” in Offshore technology conference 2020, 2020. Houston, Texas, United States: OTC. doi:10.4043/30786-ms
Wang, B., Qiu, N., Amberg, S., Duan, Y., and Littke, R. (2022). Modelling of pore pressure evolution in a compressional tectonic setting: the Kuqa Depression, Tarim Basin, northwestern China. Mar. Petroleum Geol. 146, 105936. doi:10.1016/j.marpetgeo.2022.105936
Wang, Z., Wang, C., Xu, K., Zhang, H., Chen, N., Deng, H., et al. (2023). Characteristics and controlling factors of tectonic fractures of ultra-deep tight sandstone: case study of the lower Ccetaceous reservoir in Bozi-Dabei area, Kuqa Depression, Tarim Basin. Nat. Gas. Geosci. 34 (9), 1535–1551. doi:10.11764/j.issn.1672-1926.2023.05.006
Wilson, T. H., Smith, V., and Brown, A. (2015). Developing a model discrete fracture network, drilling, and enhanced oil recovery strategy in an unconventional naturally fractured reservoir using integrated field, image log, and three-dimensional seismic data. AAPG Bull. 99 (4), 735–762. doi:10.1306/10031414015
Wu, F., Li, Y., Wang, Y., Deng, Y., and Xiong, Y. (2006). Comprehensive seismic prediction of fractured zone in reservoir. Nat. Gas. Ind. 26 (11), 49–51.
Xu, G., Li, H., Li, D., and Zhang, Y. (2021). Method to calculate mining-induced fracture based on the movement and deformation of overburden strata. Shock Vib. 2021. doi:10.1155/2021/9965466
Xu, K., Zhang, H., Wang, H., Wang, Z., Yin, G., Wang, X., et al. (2022). 3D geomechanical modeling and prediction of fractures in the Bozi ultra-deep gas field in the Kuqa depression of Tarim Basin. Front. Earth Sci. 10. doi:10.3389/feart.2022.863033
Yang, K., Qi, J., Shen, F., Sun, T., Duan, Z., Cui, M., et al. (2024). Formation mechanism of salt piercement structures in a compressive environment: an example from the Kuqa depression, western China. J. Struct. Geol. 178, 105005. doi:10.1016/j.jsg.2023.105005
Yang, Y., Lu, J., Li, H., Qi, Q., and Zhou, H. (2022) Fracture prediction based on walkaround 3D3C vertical seismic profiling data: a case study from the Tarim Basin in China: geophysics, 87, D123–D136.
Yang, Y., Stovas, A., Qi, Q., and Zhou, H. (2024). Inversion of fracture weakness parameters based on the 3CVSP data—Part I: HTI media composed of A single fracture set in the isotropic background media. Geophysics 89 (3), 1–87.
Yasin, Q., Ding, Y., Baklouti, S., Boateng, C., Du, Q., and Golsanami, N. (2022). An integrated fracture parameter prediction and characterization method in deeply-buried carbonate reservoirs based on deep neural network. J. Petroleum Sci. Eng. 208, 109346. doi:10.1016/j.petrol.2021.109346
Yong, S., and Zhang, C. (2007). Logging data processing and comprehensive interpretation. Dongying: China University of Petroleum Press.
Zeeb, C., Gomez-Rivas, E., Bons, P. D., and Blum, P. (2013). Evaluation of sampling methods for fracture network characterization using outcrops. AAPG Bull. 97 (9), 1545–1566. doi:10.1306/02131312042
Zeng, L., and Li, X. (2009). Fractures in sandstone reservoirs with ultra-low permeability: a case study of the upper triassic yan–chang formation in the ordos basin, China. AAPG Bull. 93, 461–477. doi:10.1306/09240808047
Zeng, L., and Liu, H. (2009). The key geological factors influencing on development of low-permeability sandstone reservoirs: a case study of the Taizhao area in the Songliao Basin, China. Energy explor. Exploit. 27 (6), 425–437. doi:10.1260/0144-5987.27.6.425
Zerrouki, A. A., Aïfa, T., and Baddari, K. (2014). Prediction of natural fracture porosity from well log data by means of fuzzy ranking and an artificial neural network in Hassi Messaoud oil field, Algeria. Algeria. J. Petroleum Sci. Eng. 115, 78–89. doi:10.1016/j.petrol.2014.01.011
Zhang, X., Yu, J., Li, N., and Wang, C. (2021). Multi-scale fracture prediction and characterization method of a fractured carbonate reservoir. J. Petroleum Explor. Prod. Technol. 11 (1), 191–202. doi:10.1007/s13202-020-01033-w
Zheng, C., Sun, X., and Hou, G. (2020). Discrete-element numerical modeling of sub-salt structures in the Central Kelasu fold-thrust belt, Kuqa Depression, northwestern China. J. Geodyn. 134, 101687. doi:10.1016/j.jog.2019.101687
Keywords: fractures, deep learning, tight sandstone, Kuqa basin, identification model, seismic multi-attribute, gas reservoir
Citation: Tang Y, Chen D, Deng H, Yang F, Ding H, Yang Y, Wang C, Hu X, Chen N, Luo C, Tang M and Du Y (2024) Deep-learning-based natural fracture identification method through seismic multi-attribute data: a case study from the Bozi-Dabei area of the Kuqa Basin, China. Front. Earth Sci. 12:1468997. doi: 10.3389/feart.2024.1468997
Received: 23 July 2024; Accepted: 08 August 2024;
Published: 26 August 2024.
Edited by:
Qingchun Li, Chang’an University, ChinaReviewed by:
Qing Wang, Beijing Information Science and Technology University, ChinaZhen Yang, SINOPEC Petroleum Exploration and Production Research Institute, China
Copyright © 2024 Tang, Chen, Deng, Yang, Ding, Yang, Wang, Hu, Chen, Luo, Tang and Du. This is an open-access article distributed under the terms of the Creative Commons Attribution License (CC BY). The use, distribution or reproduction in other forums is permitted, provided the original author(s) and the copyright owner(s) are credited and that the original publication in this journal is cited, in accordance with accepted academic practice. No use, distribution or reproduction is permitted which does not comply with these terms.
*Correspondence: Yuyong Yang, eWFuZ3l1eW9uZzE5QGNkdXQuZWR1LmNu