 Enxi Qiu1,2
 Tangjin Ye3Zicheng Yang4
 Liyong Tian4*Hao Bai5Chaodong Yang4Zhuang Peng4
 Bin Wang2Changmao Zhong6Mengfei Qu2Jun Liu2
- 1State Key Laboratory of Geohazard Prevention and Geoenvironment Protection (SKLGP), Chengdu, China
- 2School of Civil Engineering and Geomatics, Southwest Petroleum University, Chengdu, China
- 3Sichuan College of Architectural Technology, Chengdu, China
- 4Sichuan Mianjiu Expressway Co., Ltd., Mianyang, China
- 5Sichuan Expressway Construction and Development Group Co., Ltd., Chengdu, China
- 6Sichuan Institute of Geological Engineering Investigation Group Co., Ltd., Chengdu, China
Geological disasters in the Emei to Mianning section of the Chengdu–Kunming Railway located in southwestern China occur frequently, and many debris flow gullies are distributed along the line. Debris flows often cause damage to the railway and highway that threatens the safe operation of the original line and the double-track line. Along the railway, the debris flow outbreak risks are analyzed for 53 debris flow gullies using field survey, remote sensing interpretation, and numerical simulation. Their developmental characteristics were judged according to the code. The results are used for numerical simulation of debris flow to further determine the movement characteristics and the accumulation range of debris flow. The results are combined with high-definition satellite images to analyze the form of the railway passing from the mouth of the ditch and the simulation results to determine the impact on the safe operation of the Chengdu–Kunming Railway when the debris flow erupts. Finally, disaster prevention and mitigation projects are proposed, and the prevention and control effects of the proposed works are validated.
1 Introduction
Debris flow is a sudden natural disaster phenomenon. It has the characteristics of a complex formation process, a high content of solid material, large stones, and strong destructive power to structures. Like earthquakes and other natural disasters, debris flows have become a major disaster that cannot be ignored in economic construction, transportation, and ecological environment in the southwestern mountainous area of China. The occurrence of debris flow is difficult to predict in time, the monitoring cost is high, and they have high potential destructiveness (Hungr et al., 2012). Unlike ordinary floods, even if they are far from the eruption channel, a debris flow will hit the affected areas and even expose and damage buried infrastructure (Jakob et al., 2020). Therefore, it is crucial to conduct a prediction analysis before the occurrence of a debris flow and an inversion analysis after the occurrence of a debris flow. At present, international debris flow hazard analysis is carried out by numerical simulation, model tests, and empirical formula calculations (Glade, 2005). The hazard analysis results are used to evaluate the risk of debris flow gullies and serve as the basis for predicting and mitigating debris flow hazards. In countries where landslide debris flow disasters are more serious, debris flow hazard studies have received much attention. However, due to the diversity, complexity, and variability of debris flow impact factors, the evaluation of debris flow hazard has become more complicated, and the study of hazard has been the focus and difficulty of debris flow research both in China and around the world.
The Chengdu–Kunming Railway is an important transportation trunk line in southwest China. There are many mineral resources along the line. It is one of the important strategic lines for Chinese politics, economy, and national defense. The geological structure of the area is extremely complex. Most of the river valleys in the mountains, such as the Niri River, Anning River, Jinsha River, etc., are fault valleys formed by large faults, and the neotectonic movement is active and intense. In addition, due to the 2008 Wenchuan earthquake that triggered many landslides and collapses, much loose material accumulated in the valleys along the Chengdu–Kunming Railway. In recent years, many debris flow disasters have occurred under the conditions of heavy rainfall. Several scholars have studied the representative debris flow ditches along the line, such as Leri Gully (Geng, 2010), Chipu Gully (Jing, 2010), Lengzi Gully (Wang et al., 2022; Liu et al., 2020), and the 2020 mass debris flow in Ganluo, Sichuan (Li et al., 2020). Earlier, Chinese scholars investigated and analyzed the regional debris flow in southwest China. Based on the survey and empirical formula calculation, Mu et al. (2016) analyzed the formation mechanism and development trend of debris flow in the Lugu-Xichang section of the Chengdu–Kunming Railway. Based on an artificial intelligence BP neural network, Zhuang and Cui (2009) used the debris flow data along 80 Chengdu–Kunming railways to establish a judgment model of debris flow development characteristics. The model was successfully applied to judging the development stages of some debris flows on the Kundong-Kunming Railway. Ciccarese et al. (2021) believe that this research method relies too much on the analysis of the relationship between the distribution of past landslides and debris flow hazards and several geological environmental factors. Reichenbach et al. (2018) organized these research methods and divided them into six categories: (1) classical statistics (such as logistic regression, discriminant analysis, and linear regression), (2) weight analysis, (3) machine learning, (4) neural networks, (5) multi-criteria decision analysis, and (6) other statistics. Ciccarese et al. (2021) recommend that, in addition to evaluating the fit and prediction of the model, it is necessary to quantitatively measure the uncertainty of the model and partition.
Scholars have used different numerical simulation methods to predict the movement characteristics of future debris flows. In addition to the probability and scale of future debris flow occurrence, debris flow process analysis is an important part of hazard assessment (Jakob et al., 2020; Ouyang et al., 2017). At present, the most commonly used method for the analysis of a debris flow process analysis is the numerical simulation method. The numerical simulation of debris flow has been developed for many years, and its theory has been perfected. The earliest model is the viscoplastic flow model proposed by Johnson A M (1970), and Bagnold expanded on the flow model (Takahashi, 1980). In 1989, Savage and Hutter proposed the particle flow model (Savage and Hutter, 1989; Savage and Hutter, 1991). Iverson proposed a two-dimensional flow-solid kinetic energy transfer model (Iverson, 1997), and Iverson and Denlinger proposed a new and more rigorous computational model in 2004 to simulate the motion process of dry rock slope collapse under irregular terrain conditions and achieved good results (Denlinger and Iverson, 2004; Iverson et al., 2004). However, this model ignores the role of the fluid medium and only considers the interaction between solid particles, which makes the application of the model limited.
The existing mathematical models of debris flow dynamics simulation, whether simplified or complex, face certain difficulties in practical applications. The main reason is the difference between the numerical analysis methods used in the models. Three categories of conceptual models are used: particle-based, bar-partition-based, and continuous medium-based numerical simulation methods (Lan et al., 2007). In debris flow disaster assessment, short-term and efficient disaster assessment methods are crucial, and numerical simulation provides feasibility for rapid and efficient assessment of debris flow. Currently, the more commonly used simulation software packages are FLO⁃2D (Gerundo et al., 2022), RAMMS (Mikos and Bezak, 2022), DAN3D (Lee et al., 2019; Choi et al., 2019), AschFlow (Quan Luna et al., 2016), MassMov2D (Iannacone et al., 2013), and MassFlow (Horton et al., 2019). In 2013, Ouyang proposed the numerical analysis method of MassFlow. The depth-integrated continuum media mechanics method serves as its theory, and it uses the MacCormach-TVD finite-difference calculation method with variable computational domain as the core solution method. This model uses the Coulomb and Voellmy friction law to simulate the debris flow motion process and considers the interaction and momentum exchange between the flow material and sediments during the debris flow motion, which can realistically recreate the disaster process that has occurred (Ouyang et al., 2013). In the current study, the computational methods proposed by Ouyang were used to simulate debris flows in the study area. In general, these computational methods can be classified into 1D and 2D computations based on the computational dimension, where 1D computations of debris flows are generally performed along a pre-selected profile, in contrast to 2D computations, which usually use an elevation digital model (DEM) to compute the dynamic characteristics of debris flows in the area. Thus, 1D computational methods must be extrapolated to 2D to obtain debris flow hazard maps, whereas 2D methods can be used directly to create debris flow hazard maps (Hürlimann et al., 2008). The values of the total flow distance, hazard area, flow velocity, and other kinematic characteristics of the debris flow process are necessary information in the debris flow hazard map, but the selection of a suitable model and parameters is the most critical step in its process analysis. This method is also applied to calculate the regional debris flow characteristics in this study. The field data and previous studies of multiple debris flows in a single ditch are used to derive and calibrate the debris rheology parameters to obtain more accurate simulation results.
Many scholars at home and abroad have studied debris flow disasters along the Chengdu–Kunming Railway or other regions, but the research results based on mathematical statistics may not be applicable to a single channel, and the general research direction is the susceptibility or sensitivity of debris flow disasters, ignoring the characteristics of debris flow disasters. Therefore, there is insufficient regional research into the damage to the infrastructure and buildings in the gully caused by debris flow and the characteristics of debris flow. This article makes a detailed evaluation of each of the 53 debris flow ditches along the Chengdu–Kunming Railway. The study is based on a high-precision DEM elevation digital model and the latest debris flow prevention and control survey specifications. It uses numerical simulation methods to simulate the debris flow in each ditch. Simulation is performed to identify the movement characteristics and accumulation characteristics of outbursts when debris flow disasters occur along the channel, as well as their hazard to the railway, highway, or other infrastructure at the mouth of the line, and to express the distribution characteristics of regional debris flows in a more intuitive way. It is expected to contribute to the disaster prevention and mitigation work of the local administrative department and the safe operation of the Chengdu–Kunming Railway.
2 Study area
2.1 Geological characteristics
The Emei-Mianning section of the Chengdu–Kunming Railway mainly passes through seven counties and districts (Mianning County, Xide County, Yuexi County, Ganluo County, Hanyuan County, Ebian Yi Autonomous County, and Shawan District), mostly in a mountainous area of strongly eroded geological tectonic action with complex topography and strong seismic activity (see Figure 1). The main rivers that the railway passes through mostly developed along large fault zones, which belong to tectonic denudation valleys, and various adverse geological phenomena are widely developed along the rivers. Under the action of rainstorm runoff, the formation and development of debris flows are promoted. Among the various sections along the railway, the Shawan to Niri area belongs to the deep-cut canyon section, and the profile is V-shaped or box-shaped. The section from Niri to Xiapuxiong is a strong canyon section. The Niri River is strongly incised, and the terrain is steep. Most sections are developed into box-shaped canyons. The river valley section from Lower Puxiong to Xide is a watershed. The slopes on both sides are relatively gentle, and small valley basins are developed alternately. The canyon section is from Xide Station to Manshuiwan Station. The Anning River Valley is slightly open, with strong erosion and undercutting (Sun, 2010).
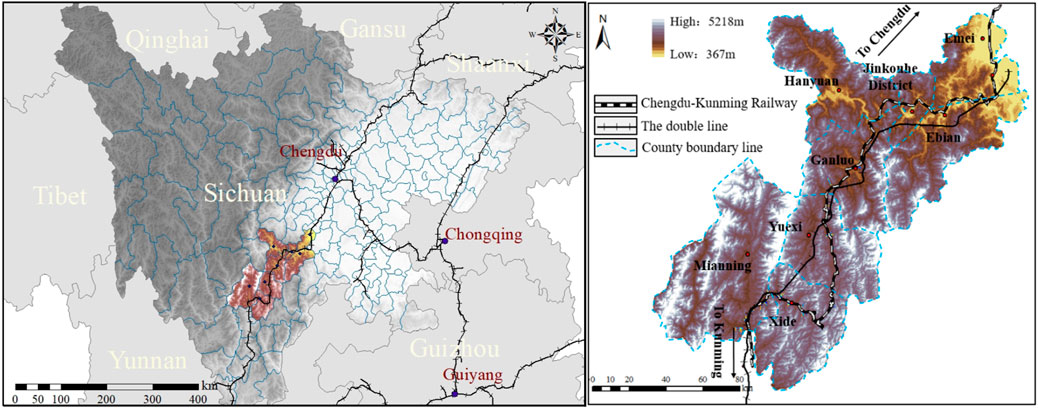
Figure 1. Location map of the study area.
The geological structure controlled the development of debris flow along the Chengdu–Kunming Railway (Sun et al., 2012). The railway in the study area passes through three tectonic systems, as shown in Figure 2A: the Emeishan fault block, the Liangshan fold area, and the Anninghe uplift area. The geological structure in the region is complex. Due to the influence of various natural and human factors over the years, new debris flow gullies have formed, and some of the debris flow gullies that had been in recession were revived, or their hazard extent was aggravated. These gullies pose a great threat to the life and property along the line and the safe operation of the Chengdu–Kunming Railway.
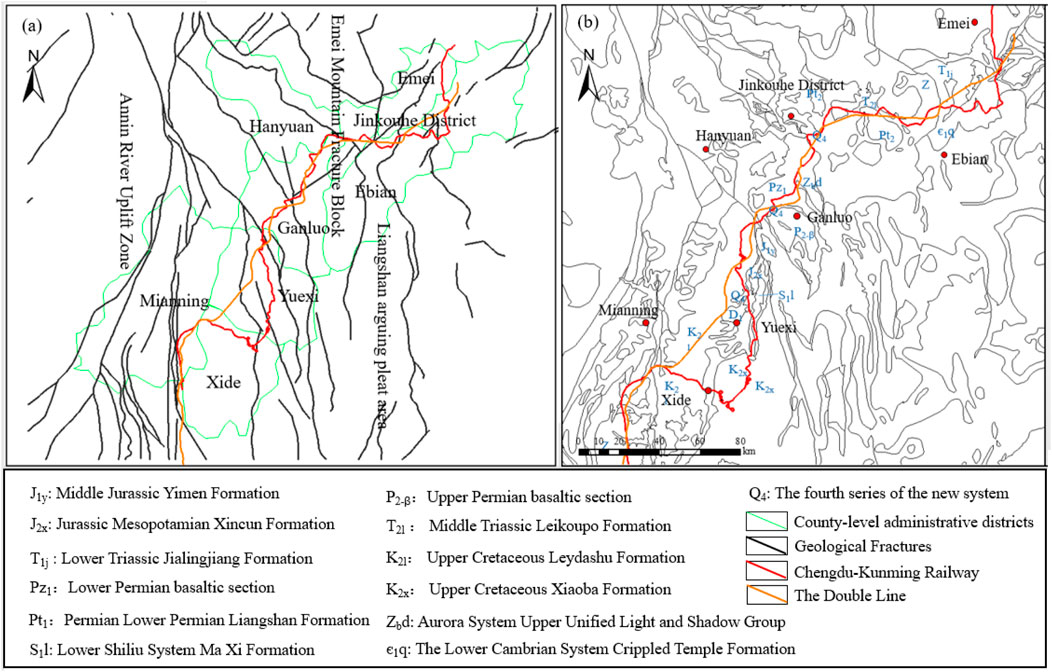
Figure 2. Fault structure and lithology map of the Emei to Mianning section of the Chengdu-Kunming Railway. (A) Fracture tectonic distribution in the study area. (B) Characterization of lithological distribution in the study area.
The strata lithology of the study area is shown in Figure 2B. The strata along the Emei to Mianning of the Chengdu–Kunming Railway are Quaternary, Cretaceous, Jurassic, Triassic, Permian, Devonian, Silurian, Ordovician, Cambrian, and Sinian. Among them, the Quaternary (Q) is mainly distributed in the valley and plain along the line, mostly in the floodplain and grade I terraces, mainly of clay soil, sand, gravel, and pebble soil. Triassic (T) is mainly distributed in the Ebian area, Permian (P) is mainly distributed in the Shawan to Suxiong area, Cretaceous (K) is distributed in the Yuexi, Tiekou, and Wazu stations and Xide County, Jurassic (J) is distributed in Ganluo and Baiguo, Devonian (D) is distributed in Ganluo Baishiyan, and Cambrian (K) is mainly distributed in the Ebian area to the Wusi River.
2.2 Meteorological characteristics
The meteorology of the study area is divided into two parts. The first part is the wet temperature area of the western Sichuan Plain, composed of Ebian Yi Autonomous County, Shawan District, and Jinkou River District. A subtropical monsoon climate prevails in this area, and the annual average temperature is 17.3°C. The four seasons of rainfall in this area are quite different; summer rainfall accounts for 59% of the annual total, approximately 782.7 mm; winter rainfall is 54.4 mm, or 5% of the annual total. In mountainous areas, the higher the altitude is, the greater the rainfall intensity is because the hot air flows upward, and cold air flows along the hillside. The average annual rainfall days is more than 190, and the average rainfall is 1430 mm. The second part is the humid and cold area of the southwest Sichuan alpine canyon, composed of Hanyuan and Mianning. It has a subtropical monsoon climate; the average annual temperature is 16.6°C, and the highest temperature is 40.4°C. The average annual precipitation is 970.4 mm. The areas with higher altitudes in the region have more precipitation and lower temperatures; the mid-mountain and valley areas have high temperatures; the low-valley areas have less rainfall, higher temperatures, and more concentrated precipitation (Sun, 2013).
Figure 3 shows the monthly average rainfall in six counties of the study area from 2017 to 2021. The seasonal distribution of rainfall in the study area is very uneven, forming two obvious dry seasons. The dry season is from October to April of the following year, which is generally the debris flow exhaustion period. At this time, due to low rainfall and low runoff flow in gullies, the material source is in the development stage, with the natural effects of neotectonic movement, earthquakes, weathering, and so on. Landslides occur on both sides of the slope, and the loose material sources gradually accumulate at the foot of the slope on both sides of the gully. From April to June of the following year, the weather warms up, the frequent rainfall begins, and the material sources in the gully further increase. Because of the rainfall, the loose material sources accumulated at the foot of the slope move to the channel and gradually block the channel, which provides conditions for the outbreak of debris flow. From June to September, the rainfall intensity of debris flow in western Sichuan is approximately 30 mm, and the rain intensity in 10 min is above 10 mm. Rainwater gathers in the channel in the study area; the small channels produce a blocking effect, and the large channels may even cause a dammed lake, which can further cause the outbreak of large debris flow. Therefore, in the high mountain canyon, a wet and cold area from Hanyuan to Mianning, the location of heavy rainstorms and the intensity of rain in a short calendar time play an important role in instigating a debris flow.
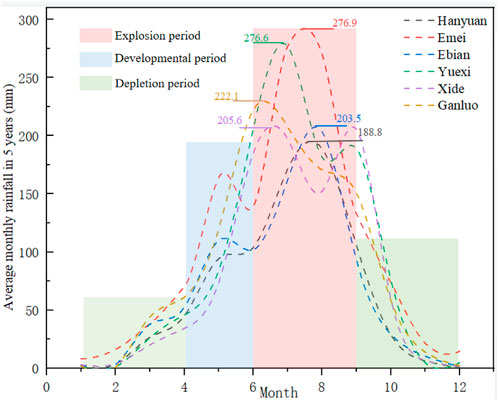
Figure 3. Average monthly rain map from 2017 to 2021 in the study area.
3 Materials and methods
3.1 Analysis of surface deformation in the study area
Debris flow is influenced by many factors, such as topography, water source, and physical source. The topography provides the necessary environment. When the regional geological action is strong, and the topography changes at a faster rate, the probability and frequency of debris flow occurrence also increase. Therefore, observing the topographic evolution of the study area over time through surface deformation is beneficial to the study of debris flow and the identification of debris flow channels in the study area. Numerous scholars are currently using InSAR-related techniques to monitor topographic changes. In InSAR, the phase difference between two images of the studied area at different times is calculated by differential interferometry (D-InSAR) to derive the surface deformation at the millimeter level in the region (Frodella et al., 2017; Huntley et al., 2020; Yi et al., 2023). With the promotion and application of modern mapping and remote sensing technology, InSAR has strong advantages and application potential in monitoring glacial movement, volcanic activity, tectonic movement, earthquakes, urban surface subsidence, landslide deformation, etc. It can accurately obtain changes in geological hazards and provide technical support for monitoring geological hazards such as landslides and mudslides.
InSAR technology can be used to monitor slowly deforming geological hazards such as landslides and ground subsidence and thus locate these hazard areas. In this study, the InSAR technology was applied to monitor the surface changes of six counties in the study area from 2018 to 2022. The surface deformation amplitude over 5 years was used to assist in discerning debris flow trenching. The results obtained are shown in Table 1 The highest surface uplift in Jinkouhe District was 0.24 m, and the largest subsidence was 0.15 m.

Table 1. Surface deformation in the study area in the past 5 years.
3.2 Identification of debris flow ditch
In mountain construction, due to an incorrect perception, gullies not yet broken out into debris flow are identified as clear water gullies or generally treated as flash flood gullies. As a result of not recognizing the risk of these gullies breaking out, mega debris flow disasters are not uncommon. The Emei to Mianning section of the Chengdu–Kunming Railway is mostly in the high mountain valley area, and the railway passes through both sides of the gully. To ensure the safe operation of the railway in the rainy season, it is very important to correctly judge whether there is a debris flow gully along the line. Generally speaking, any debris flow or potential danger of debris flow occurring in the valley is called a debris flow ditch. According to the Geological Investigation for Debris Flow Stabilization specification (T/CAGHP 006-2018), a mountain trench can be identified as a debris flow trench when it meets all the necessary conditions and some sufficient and necessary conditions in Table 2.

Table 2. Discriminatory conditions of debris flow ditches.
Information about 117 debris flow ditches that met the conditions for debris flow ditch discrimination was collected from seven counties and districts. Of these, 53 are distributed on both sides of the original railway line and the double-track line of the Chengdu–Kunming Railway. In this paper, these 53 debris flow ditches were analyzed. The stage of debris flow development is judged according to the Chinese specification TCAGHP006-2018 Debris Flow Disaster Prevention and Control Engineering Survey Specification (for trial implementation), and the judging conditions are shown in Table 3.

Table 3. Conditions for discerning the development stage of debris flow channels.
3.3 Type of debris flow
Two types of debris flows depend on the topographic and geomorphological conditions of the study area: slope-type debris flow and valley-type debris flow. The occurrence and movement of slope-type debris flows happen along the hillside or in the gully of the hillside. They are deposited at the foot of the slope or the junction of the outlet of the gully and the main river, and the solid material mainly comes from the gully slope. It has the characteristics of short grooves, large average longitudinal slope, small watershed area, serious weathering and peeling of rock mass, small collapses in the grooves, and development of rock piles or landslides. It belongs to the development stage of valley-type debris flows. The valley-type debris flow has an obvious formation, circulation, and accumulation area. The length of the main ditch and the watershed area are larger, the average longitudinal slope is generally smaller than the slope-type debris flow ditch, and the watershed area is generally 0.2–10 km2. The outbreak of gully debris flow depends on the amount of loose material in the gully and the rainfall intensity.
3.4 Calculating debris flow source
The high seismic fracture sources in the strong seismic zone are easily ignored during the investigation because of high concealment among bedrock hills. However, these sources are usually very large in scale, and once destabilized, they can supply a huge amount of loose material. Therefore, the early identification and long-term monitoring of such sources should be strengthened to achieve effective disaster prevention and mitigation. The storage and supply of loose solids in debris flow ditches are important parameters for determining the cause of debris flows, developing debris flow prevention and control programs, and analyzing the development trend of debris flows. The product of the area and the average thickness is used to determine the material source volume, and the calculation formula is
where V is the volume of the material source (×104 m3); A is the source distribution area (×104 m2);
Two methods are used to determine the source distribution area: the field survey method and the remote sensing interpretation method. Due to the many debris flow channels in the study area, the complex topography, and the challenging travel, the source survey of the debris flow is realized by remote sensing interpretation in this study. First, the slope analysis of the debris flow channels in the study area is carried out by high precision (5 m) DEM, and the location of the high slope is precisely located. Second, the distribution of the loose solids is further determined by combining with Global Mapper HD images (taken in May 2021), and the source distribution area is measured.
To determine the thickness of the source distribution, which varies, the average thickness value is generally used to calculate the total number of sources. Various methods of determining the thickness of different types of sources are used. The methods also vary due to the different accuracy requirements determined by the importance of the working area. Avalanches and landslides are the most common sources of debris flow, and their calculation methods are different from other sources, which have certain special characteristics. The following calculation methods are given in the Chinese debris flow survey and design specifications.
(a) Simulation calculation method: The average thickness of the potential landslide is simulated and calculated based on the distribution of the potential landslide by the classical method, such as the Swedish arc method, and the number of potential landslide sources is calculated based on this method. According to the rupture arc analysis theory, when the average slope is less than or equal to 45°, the average thickness of the landslide is calculated by the following formula.
where
(b) Field survey method: The average thickness of landslide deposits and potential landslides is determined by drilling, physical prospecting, and trenching. Drilling and trenching are used to detect the thickness of landslide deposits and potential landslides at a certain point, while physical prospecting means (geological radar and other methods) can determine the boundary line between potential landslides and landslide deposits and the overlying geological body. Then, the thickness of landslide loose deposits and potential landslides is determined. Physical prospecting means are not applicable in this study area because of the wide area and many kinds of trenches.
(c) Statistical methods: The statistical analysis of collapse landslide volume and collapse landslide area in the Wenchuan earthquake area found a relationship between the average thickness of the collapse landslide body and the collapse landslide area. Equation 3 is used to determine the average thickness of individual landslides investigated in the field. Equation 4 is used to determine the average thickness of landslides determined by remote sensing methods.
Tang et al. (2012) selected 49 landslides of different sizes in the Wenchuan earthquake area as samples for determining landslide thickness. A regression analysis of landslide surface area and landslide thickness was conducted based on 49 field measurements, and the relationship between landslide area and landslide thickness was determined with the following regression equation.
where t is the average thickness of avalanches and landslides (m); SL is the area of avalanches and landslides (m2). The obtained regression equation fit showed squared correlation (R2) and root mean square error (RMSE) of 0.93 and 0.62, respectively. These significance test values indicate that the model is statistically valid.
The study area is close to Wenchuan, and through the preliminary study of the Zile ditch (Qiu and Wang, 2022), it was found that Tang proposed the relationship between the area of avalanches and landslides in the earthquake area and their thickness, which can determine the area of avalanches and landslides in the ditch more accurately. This calculation method has been widely used in the study of debris flows in western Sichuan and Tibet (Li et al., 2021; Chen et al., 2021; Chang and Tang, 2014). Therefore, in this study, the avalanche and landslide areas of each debris flow gully were further counted based on the existing survey and high-precision DEM data combined with Global Mapper HD images. All avalanche and landslide areas were calculated using ArcGIS software and combined with the relationship between the avalanche and landslide areas and their thicknesses proposed by Tang et al. (2012) to derive the average thickness of all avalanche and landslide areas. Based on the average thickness and the avalanche and landslide areas, the total reserves of material sources were calculated and further combined with the evaluation method of debris flow material reserves in the earthquake area proposed by Zhang et al. (2020) and Qiao et al. (2012) to estimate the reserves of loose material and dynamic reserves that may participate in debris flow movement in each debris flow trench. When the total source volume is less than 50×104 m3, the proportion of dynamic storage can be 15%; when the total source volume reaches 100×104 m3, the proportion of dynamic storage can be 30%; when the total source volume reaches 200×104 m3, the proportion of dynamic storage can be 37%. After that, the proportion of dynamic reserves develops slowly and basically stays below 40%. In this study, first, the source type and location were determined according to the slope analysis of the debris flow ditch, high-definition images, and survey data. Next, ArcGIS was used to calculate the source area, and then the above calculation method was used to calculate the summary of the source of the ditch.
3.5 Numerical analysis
3.5.1 Model building
In this paper, MassFlow numerical simulation software is used to predict and simulate the possible debris flow in the high-risk debris flow channel of the Chengdu–Kunming Railway. MassFlow is based on a geological model with contour data to analyze the disaster characteristics of debris flow, and the model parameters are all from the field-measured parameters of debris flow. The software has been widely used in the research and analysis of debris flow, landslides, and other geological disasters in recent years. It has excellent performance and can ensure that the simulation results are accurate. MassFlow derives the mass and momentum control equations from the Navier–Stokes equations of fluid dynamics, based on the continuum mechanics equations. The MassFlow software considers features such as complex topography and valley bed erosion with second-order accuracy and adaptive solving capabilities. The controlling equations are as follows: Equation 6 is the mass conservation equation; Equation 7 and Equation 8 are the momentum conservation equations.
where ρ is the fluid density (kg/m3); t is time; u, v are the fluid velocities in the x and y directions (m/s); gx, gy, and gz are the gravity components on each axis; Zb is the riverbed elevation (m); h is the mud depth of the debris flow body (m); τb is the shear stress at the bottom (Pa); kap is the earth pressure coefficient.
When considering gully erosion, the erosion rate uses the simplified erosion model of landslide and debris flow (Li et al., 2020).
where α is the basal erosion growth rate along the debris flow; h is the depth of debris flow movement (m); u and v are the fluid velocity (m/s) in x and y directions; Vf is the final volume of debris flow movement; V0 is the initial volume of debris flow movement; S is the average erosion distance.
The flow model chosen in this paper is the Voellmy model, which improves on the Coulomb model and applies to mud and debris flow hazards. In this model, the turbulence coefficient, which can limit the higher velocity of fluid movement, was taken into account with the following expressions:
where τb is the shear stress at the bottom (Pa); σ is the positive stress (Pa); μ is the friction coefficient; ρ is the debris flow capacity (kg/m3); ξ is the turbulence coefficient (m·s-2).
3.5.2 Terms and definitions
The Voellmy model is selected as the calculation model in this paper, and the friction coefficient and turbulence coefficient are respectively determined as 0.1 to 0.3 and 180 m‧s−2–250 m‧s−2 according to different channel characteristics. According to the results of the on-site investigation, the material source, starting point, and bulk density of the debris flow involved are determined. The bulk density of some channels is determined based on the results of the on-site survey and previous related research. For the channels with incomplete data, the China Debris Flow Disaster Prevention and Control Engineering Survey Specifications (Trial) 2018 were used to quantitatively score the degree of susceptibility, and the quantitative score (N) and density (γc) relationship comparison table were used to determine the channel debris flow density. The results are shown in Table 3.
4 Results
4.1 Distribution characteristics
To explore the impact of debris flow along the Chengdu–Kunming Railway and the double-track on its safe operation, this paper further combines high-precision DEM data to conduct a statistical analysis of the development characteristics of debris flow ditches along the line. The statistical results are shown in Tables 4, 5, and the distribution locations of high-risk debris flow trenches in the study area are shown in Figure 4.

Table 4. Basin characteristics and their parameters in the study area.

Table 5. Distribution of debris flow.
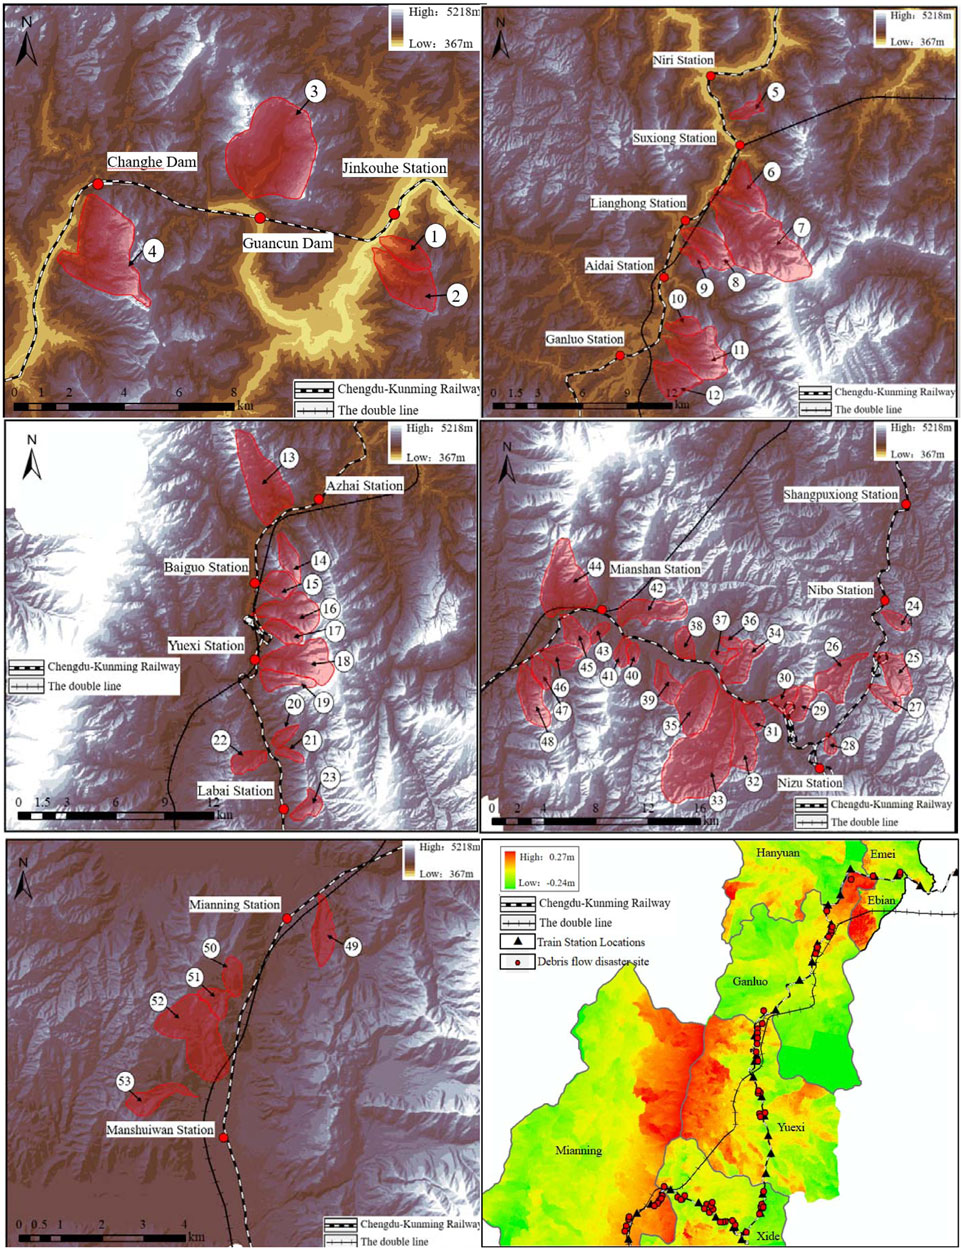
Figure 4. Distribution map of debris flow basins in the study area.
Among them, the debris flow from Jinkou River to Nier station is mainly distributed along both sides of the Dadu River, the debris flow from Niri station to Lewu station is distributed along both sides of the Niri River, a tributary of the Dadu River, and the debris flow along the Lewu station to Mianning station section is distributed along both sides of the Sunshui River, a tributary of the Jinsha River. Most of the debris flow channels have developed the waterfall phenomenon. The terrain of the channels has the characteristics of abundant water sources and large amounts of source material. The coupling effect of terrain, water source, and material source is strong in these channels, and the possibility of debris flow disasters is high, threatening the nearby safety of residents, traffic arteries, engineering facilities, etc.
4.2 Basin area analysis
According to the current statistics results (Figure 5), there are 53 high-risk debris flow ditches, and 13 have a watershed area of more than 10 km2. Most debris flow ditches have a watershed area between 2.0 km2 and 9.0 km2. Under normal circumstances, the reserves of loose material source in the debris flow gully increase with the increase of the watershed area, which further affects the amount of material source flushed out at one time when a debris flow occurs.
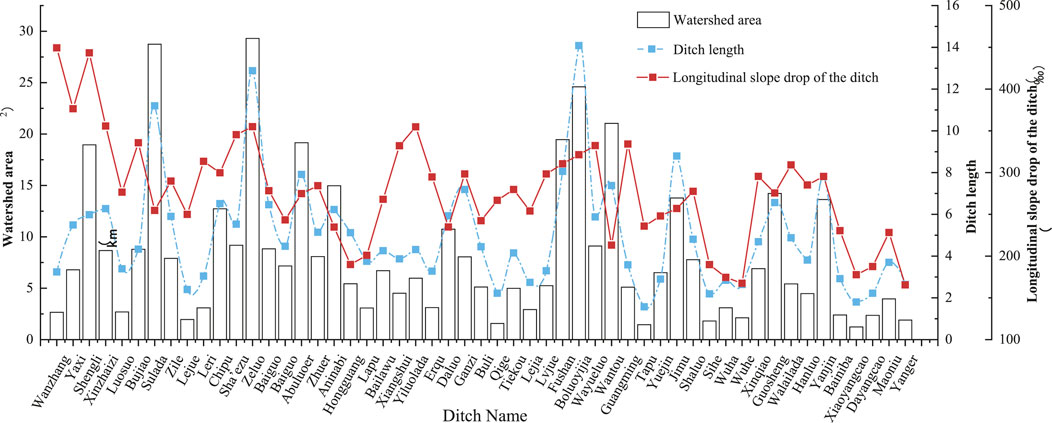
Figure 5. Debris flow watershed characteristics in the study area.
Most of the large debris flow channels along the Chengdu–Kunming Railway have developed a waterfall phenomenon, and the perennially flowing water in the channel will carry out loose material, so the frequency of debris flow is low. However, the watershed area is relatively large. A short, heavy rainfall is conducive to the accumulation of a large amount of surface water and the formation of a larger flood peak. Therefore, when a debris flow occurs in a ditch with a large watershed area, its ability to carry large particles and scour its bottom far exceeds that of small watershed debris flow disasters, causing a greater threat to life and property.
4.3 Characteristics of a debris flow channel
The length of the main ditch of the debris flow ditch is the plane projection length from the ditch head to the ditch mouth, which is the main influencing factor for the duration of the debris flow disaster and the ability to carry loose materials along the way. Moreover, the boundary conditions of the main trench, such as the geometry and roughness of the trench bed and trench wall, constrain the formation and movement of debris flow. As shown in Figure 5, the length of the main ditch of the investigated debris flow ditch is generally between 2 km and 8 km, accounting for 92% of the total debris flow ditch under investigation. According to existing research (Zhang et al., 2023), debris flow trenches with a drainage area greater than 8 km2 and a channel length greater than 5 km are defined as “super-large high-level remote debris flows in the earthquake area.” Among the debris flow ditches investigated in this paper, 21 meet this condition, accounting for about 40% of the total investigations.
The longitudinal slope of the ditch bed provides energy for the occurrence and development of debris flow and is one of the main factors affecting the formation of debris flow. The ditch-bed gradient is the base condition for fluid to convert from gravitational potential energy to kinetic energy and is an important factor affecting the formation and movement of debris flow. Generally speaking, the larger the gradient of the ditch bed, the more likely the flow is to occur. Some scholars analyzed the average longitudinal slope of the ditch bed of 150 representative types of debris flows in Tibet and found that ditches with an average longitudinal slope of 50‰–300‰ accounted for 90.7% of the total, and the ditch-bed ratio of 100‰–300‰ was the largest, accounting for 54.7%. It shows that the gradient of the gully bed within this range is most favorable to the formation and movement of debris flows. Therefore, in the valleys within this gradient range, debris flow outbreaks are very frequent, and the gradient of the gully bed not only shows the relationship between the slope erosion of the valley and the channel erosion but also reflects the development of a debris flow valley. In this paper, the longitudinal slope of 53 debris flow trenches in the study section is analyzed. The longitudinal gradient of all ditches is greater than 50‰, of which ditches of 50‰–300‰ account for 72% of the total survey, and the remaining ditches have a longitudinal slope greater than 300‰. Therefore, the longitudinal slope of the ditches in the study section is in the interval that is conducive to the outbreak of debris flow disasters, and debris flow disasters occur frequently.
4.4 Analysis of debris flow sources
The study area has 31 debris flow ditches with total loose source reserves higher than 200×104 m3, accounting for 58% of the total. Of these, the highest reserves are approximately 488×104 m3. In total, 33 debris flow ditches have loose source dynamic reserves higher than 50×104 m3, accounting for 62% of the total number (Figure 6). The dynamic reserves of debris flow sources are not fixed values. As a result, the article combines the field survey data and analyzes the causes of specific sources in each ditch, the duration of debris flow control projects, and the characteristics of the ditch. Then, high-definition satellite images, unmanned aerial vehicle surveys, and other technologies combined with numerical simulations were applied to further analyze the reserves of various sources in the study area and provide effective references for debris flow control.
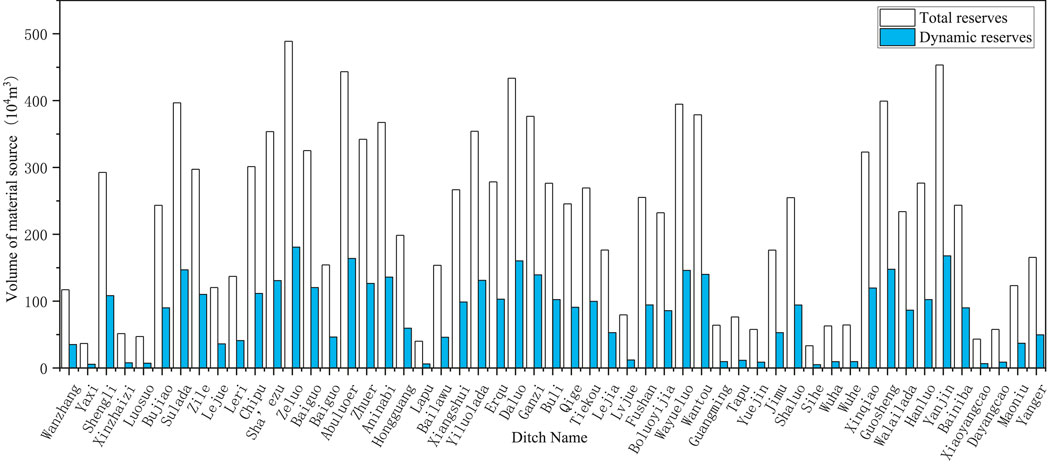
Figure 6. Schematic diagram of potential sources of debris flow gullies in the study area.
4.5 Valley morphology and development trend
This article evaluates the development stages of debris flow channels in the study section according to the identification method of debris flow development stages in the Debris Flow Disaster Prevention and Control Engineering Survey Specifications (Trial) 2018, combined with high-definition satellite images and identification marks determined by the specification. There are 46 debris flow channels in the development period, accounting for 86.8% of the total number. There were seven debris flows during the formation period, accounting for 13.2% of the total number.
A debris flow gully can have various shapes due to the different types and development stages of debris flow. Among them, the funnel shape and the spoon shape are typical debris flow valley states that are favorable for the formation and activity of debris flow. Most instances of this kind of watershed have three sections of debris flow formation, circulation, and accumulation, which is a relatively well-developed debris flow valley. A total of 40 valley-type debris flow gullies are investigated in this paper, accounting for 76% of the total number of investigations. The characteristics of the watershed are a well-developed debris flow gully with complete formation, circulation, and accumulation sections. In addition, due to tectonic movement, earthquakes, rainfall, and other factors, the ditch collapses and landslides continue, and the loose material source continues to increase. The rainfall intensity that can trigger a debris flow in western Sichuan is 30 mm in 1 h or 10 mm in 10 min (Wang, 2008). When the rain comes, the investigated debris flow ditch in the middle and upper reaches is likely to cause a blocking effect, and a large debris flow will break out.
4.6 Numerical simulation analysis
Figures 7, 8 show the results of the numerical simulation of mud depth and flow velocity. Among the 53 ditches investigated in this paper, 44 were distributed along the banks of the Niri River and the Sunshui River, five were along the banks of the Anning River, and four were along the banks of the Dadu River. A total of 41 ditches could interact with the Chengdu–Kunming Railway during a debris flow disaster, and 39 ditches are analyzed by high-definition images in the form of open line or open line bridges. This information and data were analyzed to determine the impact of a debris flow outbreak on the safe operation of the Chengdu–Kunming Railway. Finally, the corresponding disaster prevention and mitigation suggestions were proposed, as shown in Table 6.
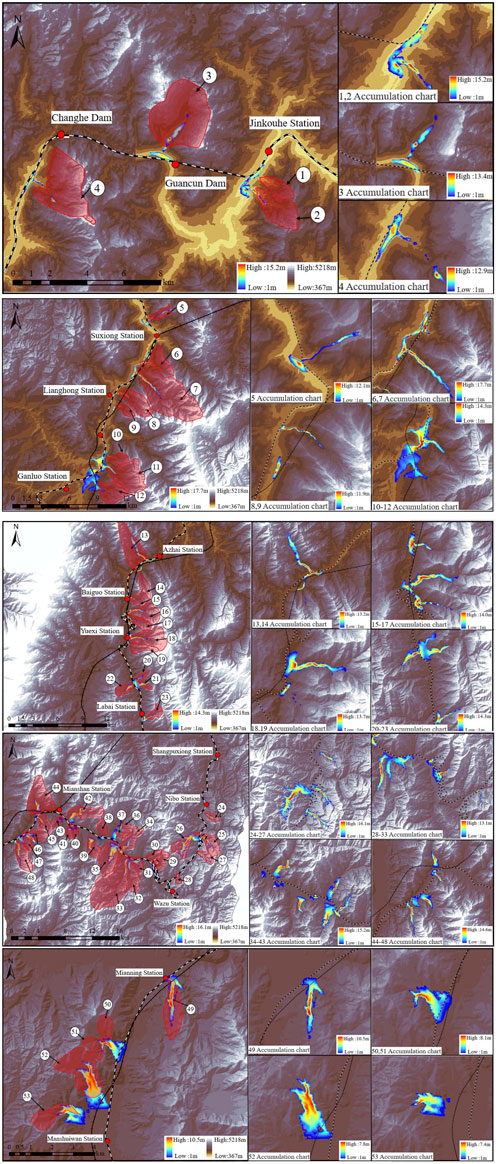
Figure 7. Simulation results of debris flow in the Emei to Mianning section of the Chengdu–Kunming Railway (mud depth).
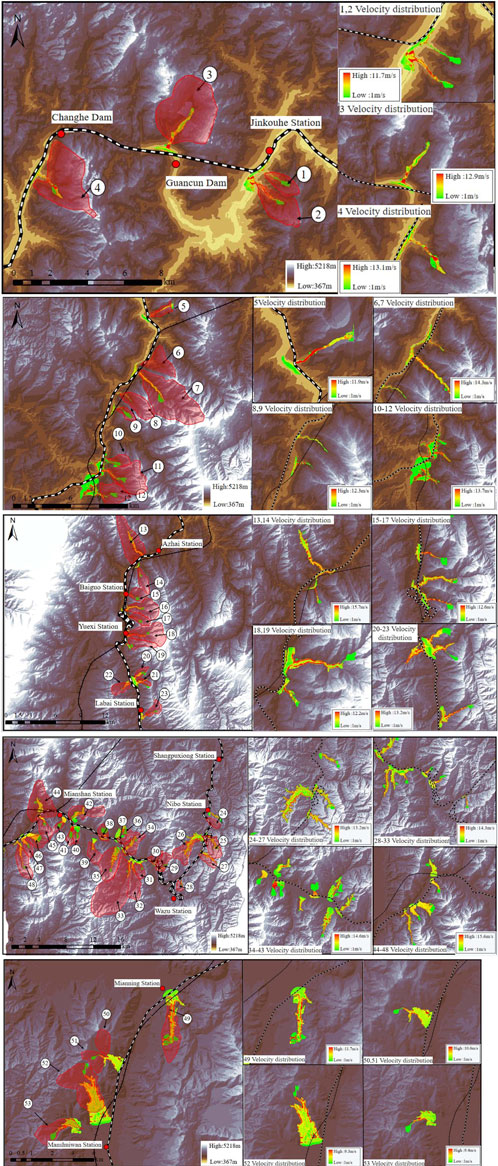
Figure 8. Simulation results of debris flow in the Emei to Mianning section of the Chengdu–Kunming Railway (flow velocity).

Table 6. Summary of simulation results and suggestions for disaster prevention and mitigation.
4.7 Effect of debris flow control
Two high-risk debris flow channels were selected from different locations of the study area to study the prevention and control effect of the management measures, and engineering prevention and control measures were added. The predicted simulation of the prevention and control effect was carried out by MassFlow software, and the simulation results were compared with the movement characteristics of the debris flow without engineering prevention and control measures to analyze the effect of the engineering measures, as shown in Figures 9, 10. The existing classification of debris flow intensity is mainly based on the size of mud depth or the product of mud depth and flow velocity. Tang proposed a risk division of debris flow based on the flow velocity and mud depth of the debris flow in 1994 (Tang et al., 2012). A quantitative risk evaluation study of key debris flows in the Longxi River basin, Longchi Town, Dujiangyan, in 2014 (Chang and Tang, 2014) used the relationship between mud depth and the product of mud depth and velocity as the basis for classification. The relationship between mud depth and velocity product was used as the basis for classifying the intensity of 12 key debris flows in the study area. Wang also used the same method to classify the risk of mudslides in the Minjiang River sub-basin caused by continuous heavy rainfall in Mianjiao Town, Wenchuan, in 2013, and their calculation results provided a reliable reference for the engineering treatment work and the risk range classification (Wang et al., 2022). Therefore, this paper also adopts the relationship between mud depth and flow velocity product as the grading basis for determining the debris flow hazard in the study area. The debris flow intensity in the study area is classified according to Table 7 with reference to the debris flow intensity classification standard.
(1) Shengli Village debris flow control
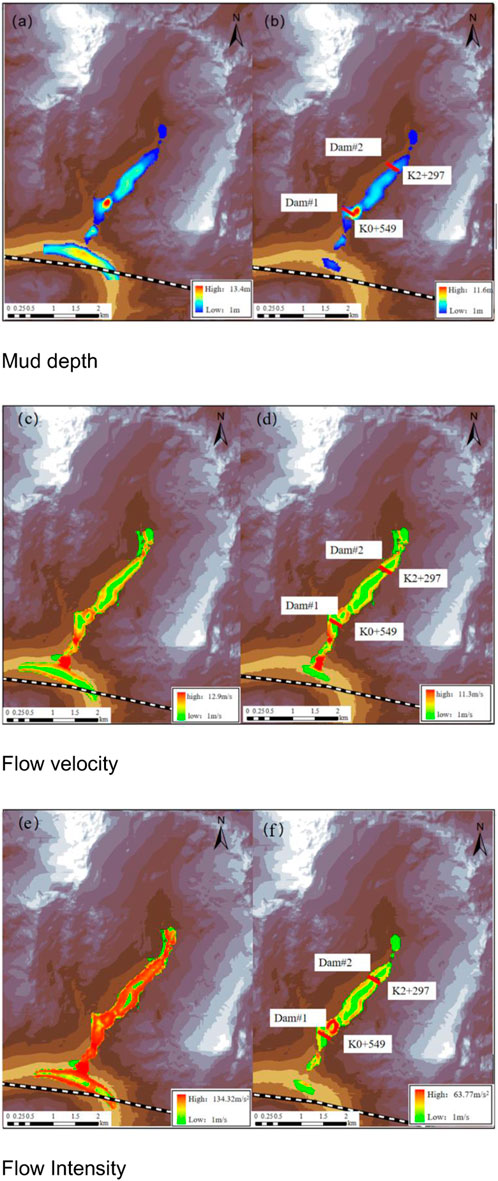
Figure 9. Predicted effect of debris flow control project in Shengli Village. (A) Pre-control debris flow depth. (B) Post-control debris flow depth. (C) Pre-control debris flow velocity. (D) Post-control debris flow velocity. (E) Pre-control debris flow intensity. (F) Post-control debris flow intensity.
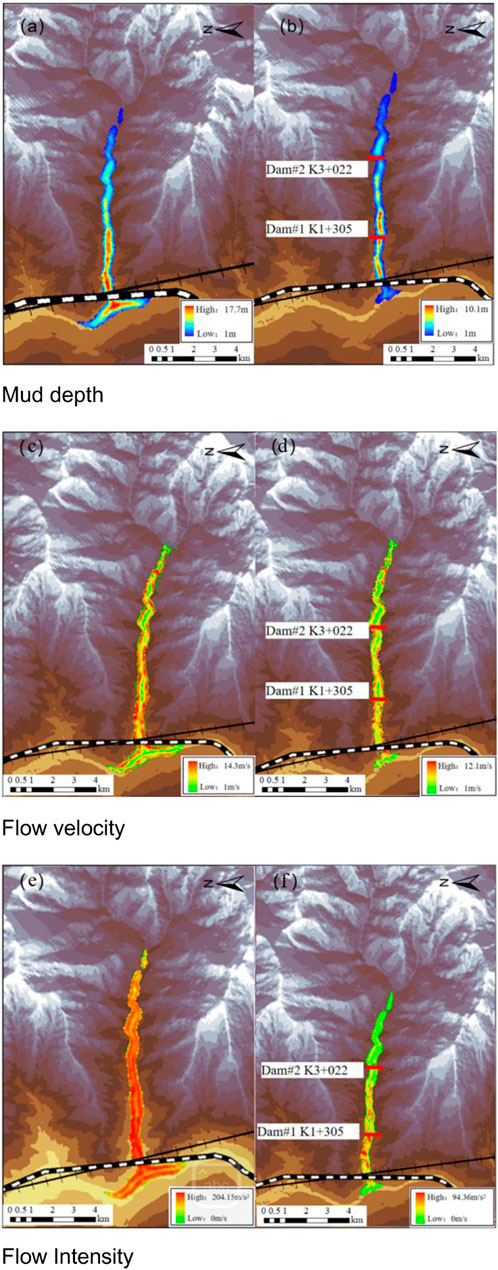
Figure 10. Predicted effect of debris flow prevention and control project in Sudala Gully. (A) Pre-control debris flow depth. (B) Post-control debris flow depth. (C) Pre-control debris flow velocity. (D) Post-control debris flow velocity. (E) Pre-control debris flow intensity. (F) Post-control debris flow intensity.

Table 7. Classification of the debris flow intensity level.
The predicted effect of the debris flow control project in Shengli Village is shown in Figure 9 and Table 8.
(2) Sudala Gully debris flow control
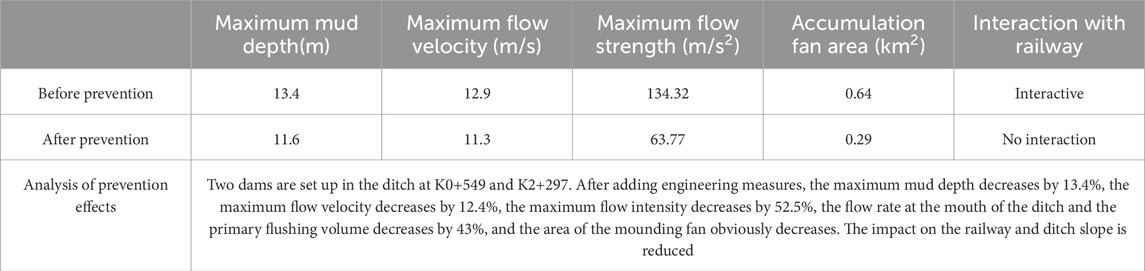
Table 8. Comparison of debris flow characteristic values before and after control projects in Shengli Village.
The predicted effect of the debris flow control project in the Sudala Gully is shown in Figure 10 and Table 9.
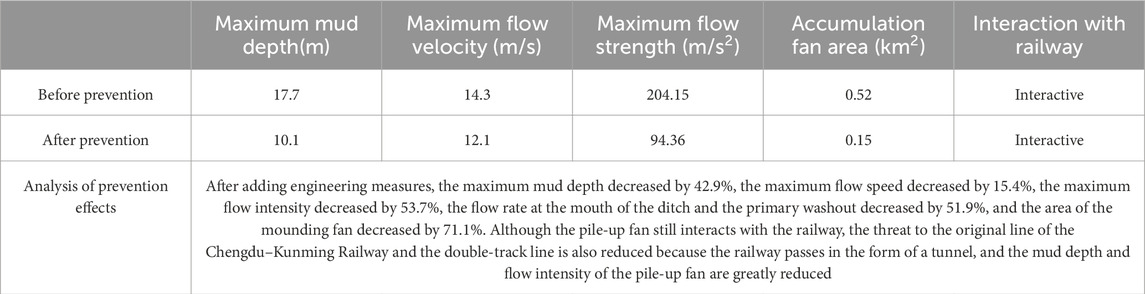
Table 9. Comparison of debris flow characteristic values before and after control projects in Sudala Gully.
5 Conclusion
The article takes 53 debris flow ditches along the section of the Chengdu–Kunming Railway from Emei to Mianning as the study object. The regional geological environment along the line, the type of debris flow hazard, distribution law, valley type, ditch characteristics, potential source volume, and other important disaster-causing factors were studied. The collected data were combined with numerical simulation methods to numerically simulate the high-risk debris flow ditch and obtain the characteristic values of debris flow movement and the accumulation characteristics of wash-out materials. The main conclusions of the study are as follows.
(1) There are serious debris flow hazards along the railway lines in the study area, which are a certain threat to the safe operation of the railway, mainly due to the integrated effects of topography, geological structure, neotectonic movement, stratigraphic lithology, rainfall conditions, and human engineering and economic activities. Among these factors, frequent earthquakes facilitate the development of debris flows. The debris flows in the study area have a temporal distribution of disaster clusters, mostly from June to August in the rainy season; a spatial distribution of segmentation, with the distribution density gradually increasing from Emei to Mianning; and a relative dispersion of debris flow disaster sections, related to the geological environment and channel characteristics.
(2) Combined with the field survey data and high-precision DEM model, the characteristics of a debris flow channel in the study area were analyzed in detail. The length of the main ditch is generally between 2 km and 8 km, accounting for 92% of the total amount of debris flow gully investigated, and only a few of the main gully length of debris flow exceeds 10 km. There are 13 debris flow ditches with a watershed area larger than 10 km2, and most of them are between 2.0 km2 and 9.0 km2. The longitudinal slope drop of all the ditches in the study area is greater than 50‰, of which 72% of the total number of ditches surveyed are between 50‰ and 300‰, and all of them are between 150‰ and 300‰, and there are 15 ditches with longitudinal slope drop greater than 300‰. There are 31 debris flow ditches with total storage capacity higher than 200×104 m3 of loose material, accounting for 58% of the total number of surveys, of which the highest storage capacity is approximately 488×104 m3.
(3) All the debris flows were quantitatively scored for susceptibility based on ditch characteristics by combining relevant research data, high-definition satellite images, and the latest debris flow survey specifications. The debris flow capacity was further derived based on the quantitative scores, and the debris flow movement characteristics were simulated based on the capacity. Among them, 40 ditches would be a threat to the Chengdu–Kunming Railway in the event of a debris flow disaster, 33 ditches are along the Niri River and Sunshui River, four ditches are along the banks of the Anning River, and three ditches are along the banks of the Dadu River.
(4) The accumulation characteristics of high-risk debris flow gully in the study area were analyzed, and the railway passage form of debris flow gully entrance was determined based on high-definition satellite images. The damage forms of erosion on the Chengdu–Kunming Railway were further discussed, and corresponding disaster prevention and reduction measures were proposed according to different damage forms. The prevention and reduction effects of prevention and control projects were verified by numerical simulation to provide a reference for local disaster prevention and reduction.
(5) It was found that including barrier measures could effectively control the destructive nature of debris flow hazards, with the control effect of mud depth ranging from 13.2% to 44.2% and flow velocity ranging from 12.4% to 22.9%. These effects are due to the siltation of washout material behind the barrier dam and the flow velocity magnitude related to topographic factors. The control effect of maximum mud depth and maximum flow velocity is low because of the siltation behind the grill dam, and the flow velocity magnitude is generally related to topographic factors. However, the control effect of debris flow intensity is 51.9%–63.1%, the reduction of accumulation fan area is 59.6%–79.4%, and the reduction of primary washout volume is 37.4%–62.7%, which is a significant decrease. Therefore, the barrier measures have a good control effect on the destructive effect of debris flow washout and can provide a reference for the local government’s disaster prevention and mitigation work.
Data availability statement
The original contributions presented in the study are included in the article/Supplementary Material; further inquiries can be directed to the corresponding author.
Author contributions
EQ: writing–original draft. TY: Funding acquisition, Investigation, writing–review and editing. ZY: investigation and writing–review and editing. LT: writing–review and editing. HB: investigation and writing–review and editing. CY: investigation and writing–review and editing. ZP: software and writing–review and editing. BW: writing–review and editing. CZ: writing–review and editing. MQ: software and writing–review and editing. JL: software and writing–review and editing.
Funding
The author(s) declare that financial support was received for the research, authorship, and/or publication of this article. This research was supported by the State Key Laboratory of Geohazard Prevention and Geo-environment Protection (SKLGP 2021K017) and the Sichuan Expressway Construction and Development Group Limited science and technology projects project task book (2022-cg-ky-3).
Conflict of interest
Authors ZY, LT, CY, and ZP were employed by Sichuan Mianjiu Expressway Co., Ltd. Author HB was employed by Sichuan Expressway Construction and Development Group Co., Ltd. Author CZ was employed by the Sichuan Institute of Geological Engineering Investigation Group Co., Ltd.
The remaining authors declare that the research was conducted in the absence of any commercial or financial relationships that could be construed as a potential conflict of interest.
Publisher’s note
All claims expressed in this article are solely those of the authors and do not necessarily represent those of their affiliated organizations, or those of the publisher, the editors, and the reviewers. Any product that may be evaluated in this article, or claim that may be made by its manufacturer, is not guaranteed or endorsed by the publisher.
References
Chang, M., and Tang, C. (2014). Remote sensing dynamic evolution of debris flow sources in Longchi Town.
Chen, L., Yu, B., Huang, H., Liu, J. K., Li, Y. L., and Gao, B. (2021). Characteristics of debris flow source evolution in Tianmo Gully, Tibet. Geol. Bull. China 40 (12), 2089–2097.
Choi, S. K., Kwon, T. H., Lee, S. R., and Park, J. Y. (2019). Roles of barrier location for effective debris flow mitigation: assessment using DAN3D. Assoc. Environ. Eng. Geol. special Publ. 28. doi:10.25676/11124/173124
Ciccarese, G., Mulas, M., and Corsini, A. (2021). Combining spatial modelling and regionalization of rainfall thresholds for debris flows hazard mapping in the Emilia-Romagna Apennines (Italy). Landslides 18 (11), 3513–3529. doi:10.1007/s10346-021-01739-w
Denlinger, R. P., and Iverson, R. M. (2004). Granular avalanches across irregular three-dimensional terrain: 1. Theory and computation. J. Geophys. Res. Earth Surf. 109 (F1). doi:10.1029/2003jf000085
Frodella, W., Salvatici, T., Pazzi, V., Morelli, S., and Fanti, R. (2017). GB-InSAR monitoring of slope deformations in a mountainous area affected by debris flow events. Nat. Hazards Earth Syst. Sci. 17 (10), 1779–1793. doi:10.5194/nhess-17-1779-2017
Geng, J. D. (2010). Evaluation of the risk of debris flow in Lerigou, mining area of Ganluo County. Master's thesis. Chengdu (China): Southwest Jiaotong University. Available at: https://kns.cnki.net/KCMS/detail/detail.aspx?dbname=CMFD2010&filename=2010122107.nh.
Gerundo, C., Speranza, G., Pignalosa, A., Pugliese, F., and De Paola, F. (2022). A methodological approach to assess nature-based solutions’ effectiveness in flood hazard reduction: the case study of gudbrandsdalen valley. Environ. Sci. Proc. 21 (1), 29. doi:10.3390/environsciproc2022021029
Glade, T. (2005). Linking debris-flow hazard assessments with geomorphology. Geomorphology 66 (1-4), 189–213. doi:10.1016/j.geomorph.2004.09.023
Guo, N. (2015). Characteristics and management measures of Bai nai Ba gou debris flow in coronation county. South-North Water Divers. Water Conservancy Sci. Technol. (05), 968–972. doi:10.13476/j.cnki.nsbdqk.2015.05.031
Horton, A. J., Hales, T. C., Ouyang, C., and Fan, X. (2019). Identifying post-earthquake debris flow hazard using Massflow. Eng. Geol. 258, 105134. doi:10.1016/j.enggeo.2019.05.011
Hungr, O., Leroueil, S., and Picarelli, L. (2012). Varnes classification of landslide types, an update, Landslides and engineered slopes: protecting society through improved understanding. London: Taylor and Francis Group, 47–58.
Huntley, D., Rotheram, D., Bobrowsky, P., Lintern, G., MacLeod, R., and Brillon, C. (2020). “InSAR investigation of sackung-like features and debris flows in the vicinity of Hawkesbury Island and Hartley Bay, British Columbia, Canada,” in Slope stability 2020 (Perth: 2020 International Symposium on Slope Stability in Open Pit Mining and Civil Engineering), 207–226.
Hürlimann, M., Rickenmann, D., Medina, V., and Bateman, A. (2008). Evaluation of approaches to calculate debris-flow parameters for hazard assessment. Eng. Geol. 102 (3-4), 152–163. doi:10.1016/j.enggeo.2008.03.012
Iannacone, J. P., Quan Luna, B., and Corsini, A. (2013). Forward simulation and sensitivity analysis of run-out scenarios using MassMov2D at the Trafoi rockslide (South Tyrol, Italy). Georisk Assess. Manag. Risk Eng. Syst. Geohazards 7 (4), 240–249. doi:10.1080/17499518.2013.773816
Iverson, R. M. (1997). The physics of debris flows. Rev. Geophys. 35 (3), 245–296. doi:10.1029/97rg00426
Iverson, R. M., Logan, M., and Denlinger, R. P. (2004). Granular avalanches across irregular three-dimensional terrain: 2. Experimental tests. J. Geophys. Res. Earth Surf. 109 (F1). doi:10.1029/2003jf000084
Jakob, M., Mark, E., McDougall, S., Friele, P., Lau, C. A., and Bale, S. (2020). Regional debris-flow and debris-flood frequency–magnitude relationships. Earth Surf. Process. Landforms 45 (12), 2954–2964. doi:10.1002/esp.4942
Jing, C. M. (2010). Evaluation of debris flow hazard in Chipu ditch, Ganluo county master's thesis. Chengdu, China: Southwest Jiaotong University. Available at: https://kns.cnki.net/KCMS/detail/detail.aspx?dbname=CMFD2010&filename=2010122402.nh.
Johnson, A. M. (1970). Mobilization of debris flows. Zeitschrift fur Geomorphologie (Annals of geomorphology). Supplement 9, 168–186.
Lan, H. X., Zhou, C. H., and Wang, X. B. (2007). A literature review on debrisflow constitutive model and its dynamic simulation. J. Eng. Geol. 15 (3), 314–321. doi:10.1007/978-3-540-72108-6_3
Lee, D. H., Lee, S. R., and Park, J. Y. (2019). Numerical simulation of debris flow behavior at Mt. Umyeon using the DAN3D model. J. Korean Soc. Hazard Mitig. 19 (3), 195–202. doi:10.9798/kosham.2019.19.3.195
Li, D. (1990). Integrated control projects of debris flow at Yangjing gully, Mianning county, Sichuan province. Mt. Res. 8 (01), 67–69. doi:10.16089/j.cnki.1008-2786.1990.01.013
Li, X., Lin, J., Hu, G., and Zhao, W. (2021). Remote sensing-based extraction of pre- and post-earthquake debris flow source areas in typical mountain basins in southwest China: an example of Shuzheng Village basin. Remote Sens. Technol. Appl. 36 (3), 638–648. doi:10.11873/j.issn.1004-0323.2021.3.0638
Li, Y., Gan, B. R., and Wang, X. K. (2020). Formation mechanism of Group flash flood/debris flow disasters in Ganluo county, sichuan province in 2019. Bull. Soil Water Conservation 40 (06), 281–287. doi:10.13961/j.cnki.stbctb
Liu, T. J., Sun, S. Q., Zhao, Z., and Zhang, X. (2020). Massflow model-based evaluation on effect of engineering treatment of debris flow in Lengzigou Gully. Water Resour. Hydropower Technol. (10), 195–201. doi:10.13928/j.cnki.wrahe.2020.10.024
Mikos, M., and Bezak, N. (2022). Debris flow modelling using RAMMS model in the alpine environment with focus on the model parameters and main characteristics. Front. Water-Related Nat. Disasters Mt. Area 8, 6. doi:10.3389/feart.2020.605061
Mu, C. L., Pei, X. J., and Pei, Z. (2016). Study on the basic features for debris flows along Lugu to xichang section of chengdu-kunming railway. J. Undergr. Space Eng. (03), 845–851.
Ouyang, C. J., He, S., Xu, Q., Luo, Y., and Zhang, W. (2013). A MacCormack-TVD finite difference method to simulate the mass flow in mountainous terrain with variable computational domain. Comput. and Geosciences 52, 1–10. doi:10.1016/j.cageo.2012.08.024
Ouyang, C. J., Zhao, W., He, S. M., Wang, D. P., Zhou, S., An, H. C., et al. (2017). Numerical modeling and dynamic analysis of the 2017 Xinmo landslide in Maoxian County, China. J. Mt. Sci. 14 (9), 1701–1711. doi:10.1007/s11629-017-4613-7
Qiao, J. P., Huang, D., and Yang, Z. J. (2012). Statistical method on dynamic reserve of debris flow's source materials in meizoseismal area of Wenchuan earthquake region. Chin. J. Geol. Hazard Control 23 (2), 1–6. doi:10.16031/j.cnki.issn.1003-8035.2012.02.011
Qiu, E. X., and Wang, B. (2022). Study on the movement characteristics and predicted prevention effect of debris flow in Zile Valley, Ganluo, Sichuan. J. Disaster Prev. Mitig. Eng. doi:10.13409/j.cnki.jdpme.20220616003
Quan Luna, B., Blahut, J., van Asch, T., van Westen, C., and Kappes, M. (2016). ASCHFLOW-A dynamic landslide run-out model for medium scale hazard analysis. Geoenvironmental disasters 3 (1), 29–17. doi:10.1186/s40677-016-0064-7
Reichenbach, P., Rossi, M., Malamud, B. D., Mihir, M., and Guzzetti, F. (2018). A review of statistically-based landslide susceptibility models. Earth-science Rev. 180, 60–91. doi:10.1016/j.earscirev.2018.03.001
Savage, S. B., and Hutter, K. (1989). The motion of a finite mass of granular material down a rough incline. J. fluid Mech. 199, 177–215. doi:10.1017/s0022112089000340
Savage, S. B., and Hutter, K. (1991). The dynamics of avalanches of granular materials from initiation to runout. Part I: analysis. Acta Mech. 86 (1-4), 201–223. doi:10.1007/bf01175958
Sun, X. F. (2013). Study on the development pattern of debris flow and risk evaluation of Chengdu-Kunming Railway Section K178-K728. Master's thesis. Chengdu (China): Southwest Jiaotong University. Available at: https://kns.cnki.net/KCMS/detail/detail.aspx?dbname=CMFD201302&filename=1013250692.nh.
Sun, X. F., Bai, Z. Y., and Li, D. L. (2012). Control action of geological structure on development law of debris flow at ebian-dechang section of chengdu-kunming railway. Subgr. Eng. (4), 213–216.
Takahashi, T. (1980). Debris flow on prismatic open channel. J. Hydraulics Div. 106 (3), 381–396. doi:10.1061/jyceaj.0005381
Tang, C., Zhu, J., Chang, M., Ding, J., and Qi, X. (2012). An empirical–statistical model for predicting debris-flow runout zones in the Wenchuan earthquake area. Quat. Int. 250, 63–73. doi:10.1016/j.quaint.2010.11.020
Wang, X. F. (2008). Risk assessment of debris flows and PreventionCountermeasure study for section from luding to detuo of Dadu River. Master's thesis. Chengdu (China): Chengdu University of Technology.
Wang, Z. L., Chang, M., Liu, P. Y., and Xu, L. (2022). Hazard assessment of typical gully debris flow in Anning river: a case study at the Lengzi gully. Chin. J. Geol. Hazards Prev. (03), 31–38. doi:10.16031/j.cnki.issn.1003-8035.2022.03-04
Yi, Y., Xu, X., Xu, G., and Gao, H. (2023). Landslide detection using time-series InSAR method along the kangding-batang section of shanghai-nyalam road. Remote Sens. 15 (5), 1452. doi:10.3390/rs15051452
Zhang, L., Xu, L., Li, Y., Su, N., Yan, Z., and Ding, K. (2023). Prediction of the gully debris flow peak discharge prediction in strong earthquake area. J. Civ. Environ. Eng.45(2), 81–88. doi:10.11835/j.issn.2096-6717.2022.009
Zhang, Y. Y., Yuan, Y. D., and Gu, C. Z. (2020). Review of evaluation methods for debris flow resource reserves in areas affected by earthquakes. Mt. Res. 38 (3), 394–401. doi:10.16089/j.cnki.1008-2786.000519
Keywords: Chengdu–Kunming Railway, debris flow, numerical simulation, disaster prevention and mitigation, development characteristics and hazard
Citation: Qiu E, Ye T, Yang Z, Tian L, Bai H, Yang C, Peng Z, Wang B, Zhong C, Qu M and Liu J (2024) Development characteristics and hazard analysis of debris flow along the Emei to Mianning section of the Chengdu–Kunming Railway. Front. Earth Sci. 12:1473444. doi: 10.3389/feart.2024.1473444
Received: 31 July 2024; Accepted: 30 August 2024;
Published: 18 October 2024.
Edited by:
Yunhui Zhang, Southwest Jiaotong University, ChinaReviewed by:
Guoyang Liu, Shenyang University of Technology, ChinaChunjiang Zou, Brunel University London, United Kingdom
Di Wu, Xi’an University of Science and Technology, China
Copyright © 2024 Qiu, Ye, Yang, Tian, Bai, Yang, Peng, Wang, Zhong, Qu and Liu. This is an open-access article distributed under the terms of the Creative Commons Attribution License (CC BY). The use, distribution or reproduction in other forums is permitted, provided the original author(s) and the copyright owner(s) are credited and that the original publication in this journal is cited, in accordance with accepted academic practice. No use, distribution or reproduction is permitted which does not comply with these terms.
*Correspondence: Liyong Tian, dGlhbmxpeW9uZzEyMzQ1QDE2My5jb20=