 Yi Xin1,2,3
 Wei Duan
 Peiqiang Zhao
- 1Tarim Oilfield Company, PetroChina, Korla, China
- 2R&D Center for Ultra-Deep Complex Reservoir Exploration and Development, China National Petroleum Corporation, Korla, China
- 3Engineering Research Center for Ultra-Deep Complex Reservoir Exploration and Development, Xinjiang Uygur Autonomous Region, Korla, China
- 4Beijing Key Laboratory of Earth Prospecting and Information Technology, China University of Petroleum, Beijing, China
Introduction: With the continuous development of exploration and development, tight sandstone reservoirs have become an essential field of oil and gas exploration. The tight sandstone reservoirs are characterized by complex lithology, poor pore structure, and strong heterogeneity, which bring great difficulties to formation evaluation by well logs. Especially, the accuracy of the Archie formula for calculating the water saturation of tight sandstone reservoirs containing fractures is not high, saturation evaluation faces greater challenges. Therefore, how to calculate the saturation of tight sandstone reservoirs more accurately is an urgent problem to be solved.
Methods: In this paper, the tight sandstone reservoirs of the Jurassic Ahe Formation in the Tarim Basin were taken as the research area. A saturation model that combines the effects of shale and fractures was proposed. Specifically, if the shale content is more than 20%, the Indonesian formula is used to calculate the saturation. If the shale content is less than 20%, the dual porosity model is adopted. Based on the rock resistivity and nuclear magnetic resonance (NMR) experiment results, the porosity and T2 logarithmic mean values are selected as influencing factors to calculate the key parameters of the dual porosity model.
Results and Discussion: The saturation of tight sandstone reservoirs in the Jurassic Ahe Formation of the Tarim Basin is calculated through the method proposed in this paper. The case study shows that the accuracy of the proposed method is higher than that of the Archie model. The method proposed in this paper demonstrates excellent adaptability in the quantitative evaluation of saturation for tight sandstone reservoirs.
1 Introduction
Tight sandstones generally refer to sandstones with a permeability of less than 0.1 mD and a porosity of less than 10% (Gao and Li, 2016). With the continuous development of exploration and development, tight sandstone reservoirs have become an essential field of oil and gas exploration (Dai et al., 2012; Zou et al., 2012). Tight sandstone reservoirs are characterized by tight lithology, complex pore structure and firm heterogeneity (Rezaee et al., 2012; Desbbois et al., 2011; Lai et al., 2015). As a result, the accuracy of the Archie formula for calculating the water saturation of tight sandstone reservoirs is not high (Li et al., 2020; Hu et al., 2017; Feng et al., 2023). In addition, the Archie formula is not applicable to formations with high shale content (Zhang et al., 2023; Zhao et al., 2023; Vincent and wladyslaw, 2015). Therefore, how to calculate the saturation of tight sandstone reservoirs more accurately is an urgent problem to be solved.
Shale has a significant influence on the reservoir performance of tight sandstone reservoirs. When the reservoirs contain shale, the reservoirs’ resistivity will be reduced, and the accuracy of the traditional method for calculating saturation will also decrease (Feng et al., 2021). There are many saturation models involving the influence of shale. The Simandoux formula (Simandoux, 1963) and the Indonesia formula (Leveaux and Poupon, 1971) apply to shale sandstones. With the development of the dual layer theory, the W-S model (Waxman and Smits, 1968) was developed for shaly sandstones or low-resistivity reservoirs. Clavier et al. (1984) proposed that clay water and free water in argillaceous sandstone conduct electricity in parallel, and they proposed the D-W model. Silva and Bassiouni (1986) investigated the influence of matrix and pore structure on shaly sandstone and proposed the S-B model. Given the internal sedimentary structure characteristics of thin interbedded sandstone and mudstone, Zhang et al. (2015) regarded the reservoir as a layered medium, and established a saturation calculation model of thin interbedded sandstone and mudstone.
The matrix porosity and permeability of tight sandstone reservoirs are low, and fractures are good channels and reservoir spaces for oil and gas migration (Luo, 2010; Zeng et al., 2013). Fractures affect the accurate calculation of tight sandstone saturation (Liu et al., 2018; Liao et al., 2024). The reservoir space of tight sandstone includes matrix pores and fractures. Aguilera and Aguilera (2003) considered the effects of matrix pores, fractures, and caves on the electrical conductivity of carbonate rocks and proposed the triple porosity model. Zhang (2010) established the saturation calculation model for fractured reservoirs based on the triple porosity model. Tang et al. (2018) calculated the saturation of Dabie Area, specifically when the fracture porosity is less than 0.055%, the equation based on conductive pore water is used for calculation. When the fracture porosity is more than 0.055%, the equation based on the theory of dual porosity media is deployed. Wang et al. (2022) established the tight sandstone saturation model using the fracture and matrix pore parallel conductivity model and digital core.
Additionally, the selection of the Archie parameters m and n is essential for saturation calculation. Many scholars have improved the accuracy of the Archie formula by adjusting the values of m and n. (Zhang and Shi, 2005; Yan et al., 2015; Xiao et al., 2013; Luo et al., 2014; Jiang, 2018; Li et al., 2020; Li et al., 2012; Wang et al., 2005; Zhang et al., 2006). In previous studies, there is a lack of a more comprehensive saturation model that combines the effects of shale and fractures. Additionally, the model parameters of tight sandstone are affected by pore structure (Li et al., 2020), and accurate calculation methods of the key parameters are difficult to establish. Therefore, the saturation calculation of tight sandstone needs to be further studied.
In this paper, the tight sandstone reservoirs of the Jurassic Ahe Formation in Tarim Basin were taken as the research area. This paper proposed a saturation model that combines the effects of shale and fractures. Specifically, when the shale content is more than 20%, the Indonesian formula is used to calculate the saturation. When the shale content is less than 20%, the dual porosity model of the matrix pore and fracture pore is adopted. The application to the tight sandstone reservoirs in Tarim Oilfield shows that the saturation calculation method proposed in this paper has less minor interpretation errors than the traditional calculation method. The saturation calculation method proposed in this paper improves the accuracy of saturation evaluation.
2 Geological setting
Kuqa Depression is a geological formation located in the northern Tarim Basin, which is adjacent to the Tianshan fold belt in the north. Tectonic units and location of Dibei gas field in Kuqa Depression are shown in Figure 1. Kuqa Depression is classified as a Mesozoic-Cenozoic foreland basin and is comprised of four thrust belts and three sags. The Northern Monocline, Kela, Yiqikelike, and Qiulitage thrust belts make up the four structural belts. The Baicheng, Yangxin, and Wushi sags are the main negative tectonic units (Zhao et al., 2022). The study area of this research is situated in the middle of the Yiqikelike thrust belt, specifically focusing on the DB 5 well as the primary research object.
The primary gas-bearing interval in the Dibei gas field is the Lower Jurassic Ahe Formation (Shi et al., 2018; Shi et al., 2024), which consists of braided river delta plain surface deposits characterized by low compositional maturity. The lithology of the Ahe Formation primarily comprises gravel, coarse sandstone, and medium sandstone. The sandstone reservoirs in this formation have an average thickness between 250 and 300 m. Dibei gas field is a typical tight sandstone gas reservoir, with the porosity of the Ahe Formation between 3.0% and 9.0%, with an average porosity of 5.94%. The permeability is between 0.1mD and 5.0mD, with an average air permeability of 0.818mD. According to the data from the drilling core, micro casting thin section, and scanning electron microscope, the tight sandstone reservoirs of Jurassic Ahe Formation in Tarim Basin are mainly pore-type reservoirs and pore-fracture-type reservoirs. The main reservoir space of pore reservoirs is matrix pores, such as argillaceous micropores and intergranular dissolved pores (see Figure 2).
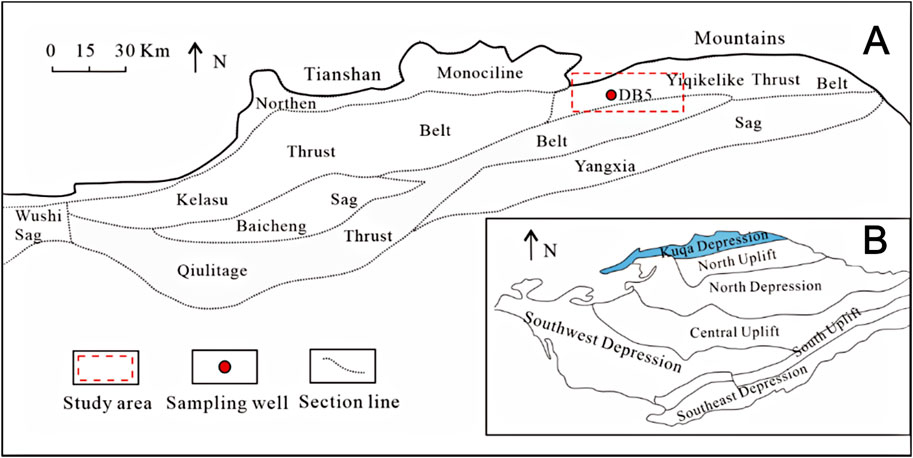
Figure 1. Tectonic units and location of Dibei gas field in Kuqa Depression. (A) Location of Kuqa Depression. (B) Sample well and structural outline of Dibei gas field in Kuqa Depression. (modified from Zhao et al., 2022).
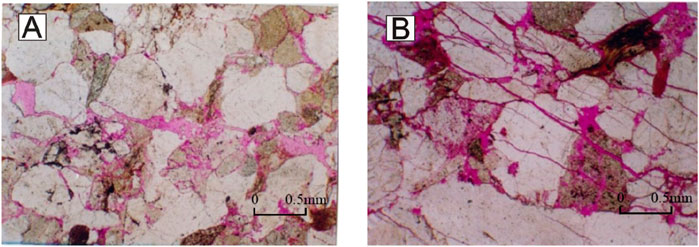
Figure 2. Reservoir space types of Jurassic Ahe Formation in Dibei area. (A) Shale micropores, a small amount of intragranular dissolved pores. (B) Structural fractures, potassium feldspar intragranular dissolved pores, matrix micropores.
The core observation results show that the fractures in the Ahe Formation are generally developed which are mainly high-angle structural fractures in the open or semi-closed state (Figure 3). Silicon and carbonate minerals can be seen in some fractures and corrosion traces of fillers can also be seen. The main reservoir space of a fracture-pore reservoir is matrix pore, and matrix rock is cut by various fractures with different occurrences. While providing part of the reservoir space, fractures mainly play the role of connecting matrix rocks and improving reservoir permeability.
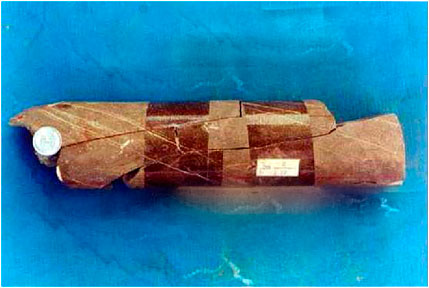
Figure 3. Characteristics of core fractures of Jurassic Ahe Formation in the Dibei area.
3 Method for calculating saturation in tight sandstones
3.1 Dual porosity model
Aguilera and Aguilera (2003) published rigorous equations for dual porosity systems that were shown to be valid for all combinations of matrix and fractures or matrix and nonconnected pores. The model used in this paper is a combination of matrix and fractures, the model is composed of a rock skeleton, matrix pores, and fractures. The pore structure of rock determines the conductive path of rock, suppose the additional shale conductivity is not considered (core experiments of reservoirs in multiple research blocks show that the cation exchange capacity is minimal and can be ignored). In that case, the conductivity of matrix pores and fractured water is the same, but the conductive paths are different. Therefore, the rock is conductive in parallel through the matrix pore network and the fracture network. The model of the dual porosity reservoirs is shown in Figure 4, the matrix pores and fractures constitute a very complex fracture-pore system. Matrix porosity is the ratio of matrix pore volume to total volume which is calcuiated using Equation 1.
where ϕb is the matrix porosity (%); Vb is the volume of matrix pores (cm3); V is the total volume of the composite system (cm3).
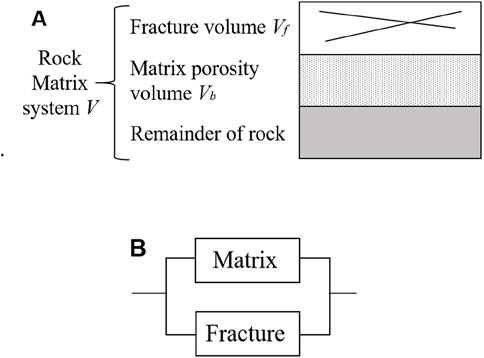
Figure 4. Schematic display of dual-porosity model. (A) Structure of rock dual porosity model. (B) Conductive path of rock dual porosity model (modified from Aguilera and Aguilera, 2004).
Rock fracture porosity is the ratio of matrix pore volume to total volume which is calculated using Equation 2.
where ϕf is the fracture porosity (%); Vf is the volume of fracture (cm3).
Total porosity of rock is calculated by Equation 3.
where ϕ is the total porosity (%).
3.2 Calculation method of saturation
According to the theory of dual porosity medium, the pore space of a tight sandstone reservoir is divided into matrix pore space and fracture pore space. According to the definition of water saturation, the total water saturation can be expressed as Equation 4.
where ϕb is the matrix porosity (%); Swb is the matrix water saturation (%); ϕf is fracture porosity (%); Swf is fracture water saturation (%).
Under the background of fractures and non-connected pores, the physical properties of the matrix of the reservoir are relatively uniform. Therefore, when calculating the matrix pore saturation, we use the classical Archie formula (Archie, 1942), and the Archie formula is shown in Equation 5.
where Rw is the formation water resistivity (
According to the permeability characteristics of the dual porosity, Tang et al. (2018) and Wang (2020) calculated the water saturation of fracture using Equation 6.
where Rxo is the resistivity of the flushing zone (
Shale is dispersedly filled in the intergranular pore space of sandstone, which is conductive in parallel with the water of formation. When the reservoir contains shale, the resistivity of the reservoir will decrease, and the accuracy of the traditional method for calculating saturation will also decrease. There are many saturation models involving the influence of shale. The Indonesian formula is a famous formula in formation evaluation by well logs, as shown in Equation 7.
where Vsh is the shale content (%); Rsh is the resistivity of the shale (
The research area belongs to fractured tight sandstone reservoirs. Fractures developed in rocks enhance the productivity of oil and gas reservoirs but also complicate the evaluation of oil and gas saturation. When calculating the oil and gas saturation of fractured tight sandstone reservoirs, factors such as physical properties, fractures, and lithology should be considered. For such reservoirs, this paper proposes a saturation evaluation method considering pore types and shale content (Figure 5). Specifically, when the shale content exceeds 20%, the Indonesian formula is used to calculate saturation. If the shale content is less than 20%, the dual porosity model is used to calculate saturation.
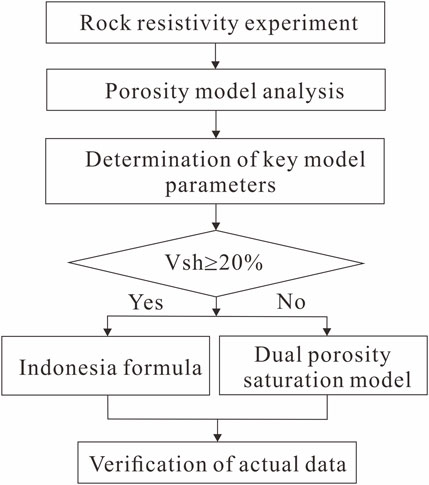
Figure 5. The calculation process of saturation.
4 Parameters of the dual porosity model
4.1 Porosity
Usually, intersection processing of multiple well logging methods is used to obtain accurate total porosity of the reservoirs. Compared with other well-logging methods, density and compensated neutron log responses are less affected by the heterogeneity of fractured reservoirs (Yong and Zhang, 1986). Therefore, we use the intersection of density and neutron logs to obtain the total porosity of the reservoir. The specific method is shown in Equations 8–10.
where
Acoustic logging data basically do not reflect the fracture porosity but mainly reflect the matrix porosity of the rocks. The matrix porosity of the reservoirs is calculated by the acoustic volume model. The calculation formula is shown in Equation 11.
where
In reservoir evaluation, imaging logging, and dual lateral logging data are usually used to calculate fracture porosity (Zhao et al., 2012). In this paper, the fractures are picked manually based on the intuitive interpretation of FMI (Formation Micro Scanner Image), and the electrical imaging data are calibrated using the optical scanning imaging data of the cores. Finally, the fracture parameters, such as fracture porosity, were calculated (Chen and Tan, 2003; Lai et al., 2015).
4.2 Determination of model parameters
Accurate model parameters mb and nb are the key to the quantitative evaluation of saturation. The porosity and the microscopic pore structure of the reservoirs affect the parameters of models (Ding et al., 2017). Capillary pressure measurement and nuclear magnetic resonance (NMR) measurement are the main methods to describe the microscopic pore structure of the reservoirs. In this paper, the standard NMR T2 spectrum is selected to characterize the microscopic pore structure. Rock electrical and nuclear magnetic resonance experiments were carried out on 10 tight sandstone samples from Ahe Formation. The mb value and nb value of each core are obtained by rock electricity experiment, and the NMR T2 spectrum of each core is obtained by the nuclear magnetic resonance experiment. Figure 6 shows the standard T2 spectra of six tight sandstone samples. Six rock samples are saturated with NaCl solution, and the resistivity of NaCl solution is 0.138
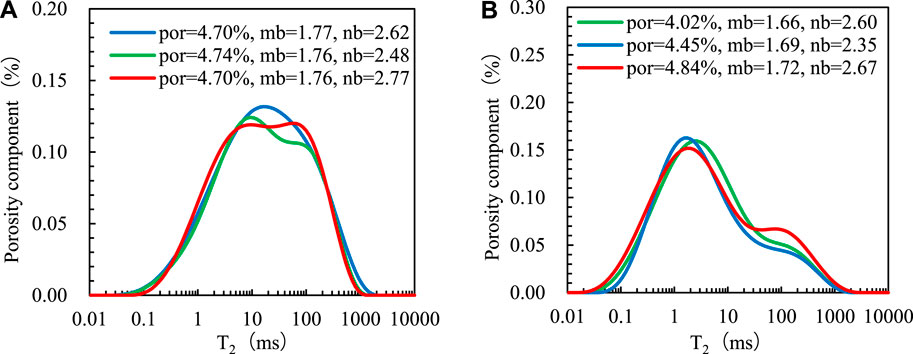
Figure 6. Standard T2 distribution of different rock samples. (A) The effect of pore structure on model parameters. (B) The effect of porosity on model parameters.
On the basis of determining the factors affecting the electrical properties of tight sandstone, it is necessary to determine the response relationship between the parameters and pore structure so as to provide a basis for the accurate calculation of saturation. Through the above analysis, it can be concluded that porosity and pore structure have a significant influence on the model parameters of rocks. The logarithmic mean of the NMR T2 spectrum is usually used to describe the variation in the reservoir’s microscopic pore structure (Zhang and Shi, 2005; Guo et al., 2022). The larger the logarithmic mean value of T2 (T2lm), the larger the pore size of the reservoirs. And the smaller the T2lm, the smaller the pore size of the reservoirs. Figure 7A shows the relationship between mb value and porosity ϕ of core analysis. It can be seen from the Figure that the mb value and the porosity present a power function relationship, and the mb value increases with the increases of porosity ϕ. Figure 7B shows the relationship between the mb value of the core analysis and the T2lm values. The statistical results show that the mb value first increases with the increase of the T2lm value, and then the mb value decreases with the increase of the T2lm value.
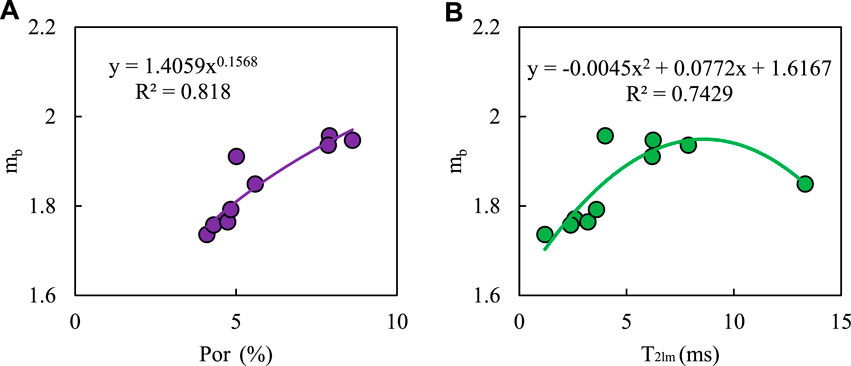
Figure 7. Analysis of influencing factors of mb values. (A) Relationship between mb value and porosity. (B) Relationship between mb value and T2 logarithmic mean value.
Figure 8A shows the relationship between the nb value of core analysis and porosity ϕ. The value of nb increases with the increase of the porosity ϕ and presents a power function relationship. Figure 8B shows the relationship between the nb value of the core analysis and the T2lm value. The statistical results show that as the T2lm value increases, the nb value decreases firstly, and then increases.

Figure 8. Analysis of influencing factors of nb value. (A) The relationship between the value of nb value and porosity. (B) The relationship between the value of nb and the T2 logarithmic mean value.
The experimental results show that the correlation between model parameters and any single factor is not particularly high. To reduce the error of single actor regression calculation, mb and nb values are calculated using the multi-factor fitting regression method. Multifactor regression considers the complex interaction between multiple parameters and reflects the actual properties of rocks more accurately. According to the results of the rock resistivity and nuclear magnetic resonance (NMR) experiment, porosity and T2 logarithmic mean value are selected as influencing factors, and the calculation model of mb value and nb value is established by using multiple regression methods. The model is shown in Equations 12, 13.
where mb and nb are the rock electrical parameters of the matrix; ϕb is the porosity of the matrix (%); T2lm is the logarithmic mean of T2 (ms).
Figure 9 shows the calculation results of the model. The mb and nb values calculated by the multiple linear regression method have a reasonable correlation with the m and n values measured by the experiment. The coefficient of determination for the mb value is 0.8377, and for the nb value is 0.7041, indicating that the calculation accuracy of this method is high, and porosity and pore structure are important factors affecting the model parameters of rocks.
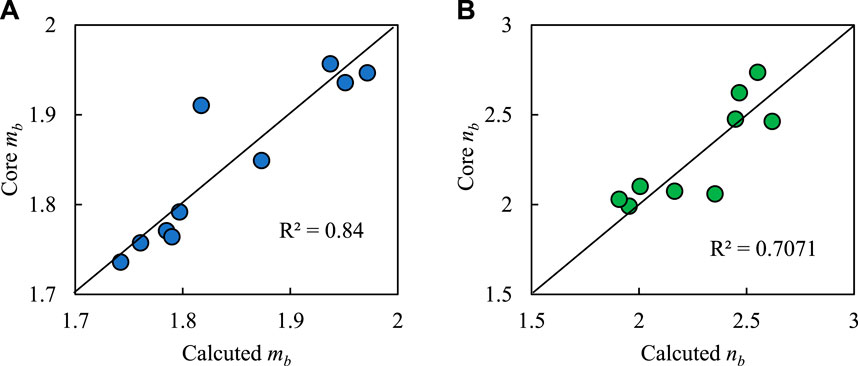
Figure 9. Cross plots of measured rock electrical parameter values and calculated rock electrical parameter values. (A) Cross plots of core analysis mb and calculated mb value. (B) Cross plots of core analysis nb and calculated nb values.
In order to obtain electrical parameters for fractures, Tang et al. (2018) and Wang (2020) assume that the rock is a regular hexahedron with side length l, a diagonal fracture with angle β and width df passes through the rock, and a regular hexahedron hole with side length c develops inside the rock. According to the theory, the formula for calculating the parameters of fractured rock is shown in Equation 14.
where df is the fracture width (mm); β is the fracture angle (dega). Substituted into Equations 5, 6, the matrix saturation and fracture saturation are calculated, and the total water saturation of the reservoir is calculated by Equation 4.
For the nf, there is still no method to determine it. We assume it is equal to nb in this paper.
5 Results of saturation calculation
The saturation calculation method proposed in this paper was used to quantitatively evaluate the reservoir saturation of the Jurassic Ahe Formation in Tarim Basin. The reservoir space types in the study area are mainly muddy micropores, intra-granular dissolved pores, intergranular dissolved pores, and micro-fractures, and the development degree of primary pores is low. Taking well DB5 as an example, the average core porosity is 5.67%, and the permeability is 0.52 × 10⁻³ μm2. The Ahe Formation is a typical tight sandstone reservoir. Figures 10, 11 show the saturation calculation results. The sixth track is the processing result of the imaging logging. The seventh track is the fracture characteristic curves, which were calculated by using the imaging logging data. Fracture characteristic curves include fracture width, fracture length, and fracture porosity. The eighth track is the mb value of multi-factor regression calculation and the mb value of core analysis, and the ninth track is the nb value of multi-factor regression calculation and the nb value of core analysis. The mb and nb calculated by this method agree well with the mb and nb obtained by core analysis. The 10th track is the water saturation calculated by the Archie model, and the 11th track is the saturation calculated by the tight sandstone saturation calculation method proposed in this paper. As can be seen from Figures 10, 11, the water saturation calculated by the traditional Archie formula and the method proposed in this paper is in good agreement with the core analysis value.

Figure 10. Saturation calculation results of the upper section of Ahe Formation in DB 5 Well, Dibei Gas Reservoir, Tarim Basin.
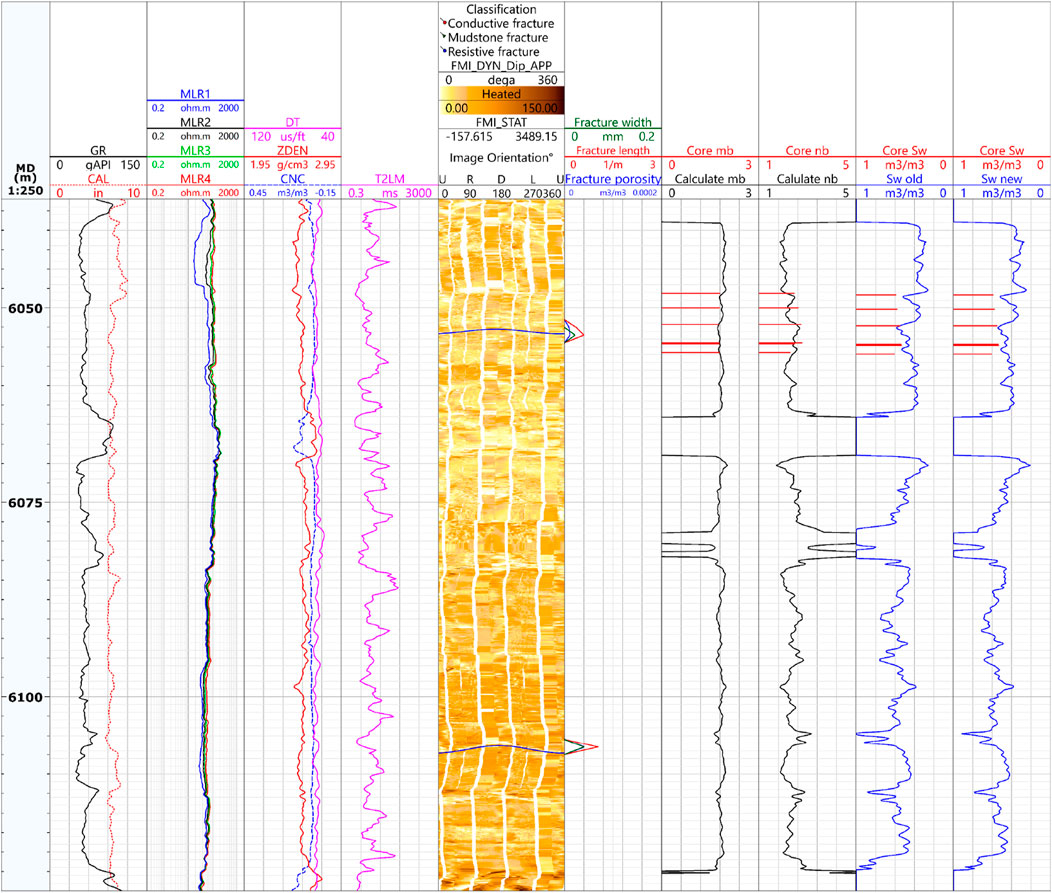
Figure 11. Saturation calculation results of the lower section of Ahe Formation in DB 5 Well, Dibei Gas Reservoir, Tarim Basin.
In order to test the accuracy of the saturation calculation method more intuitively, we evaluate the accuracy of the saturation calculation by calculating the absolute error and the relative error. As can be seen from Table 1, the average relative error of saturation calculated by the traditional Archie formula is 5.88%. In comparison, the average relative error of the saturation calculation method proposed in this paper is 3.55%, which reduces the average relative error by 2.33%. Similarly, the average absolute error calculated by the traditional Archie formula is 9.87%. The average absolute error of the saturation calculation method proposed in this paper is only 6.11%, and the accuracy is improved by 3.76%. The results show that the saturation calculation method proposed in this paper meets the error requirement of reserve calculation and has higher accuracy than the traditional method.
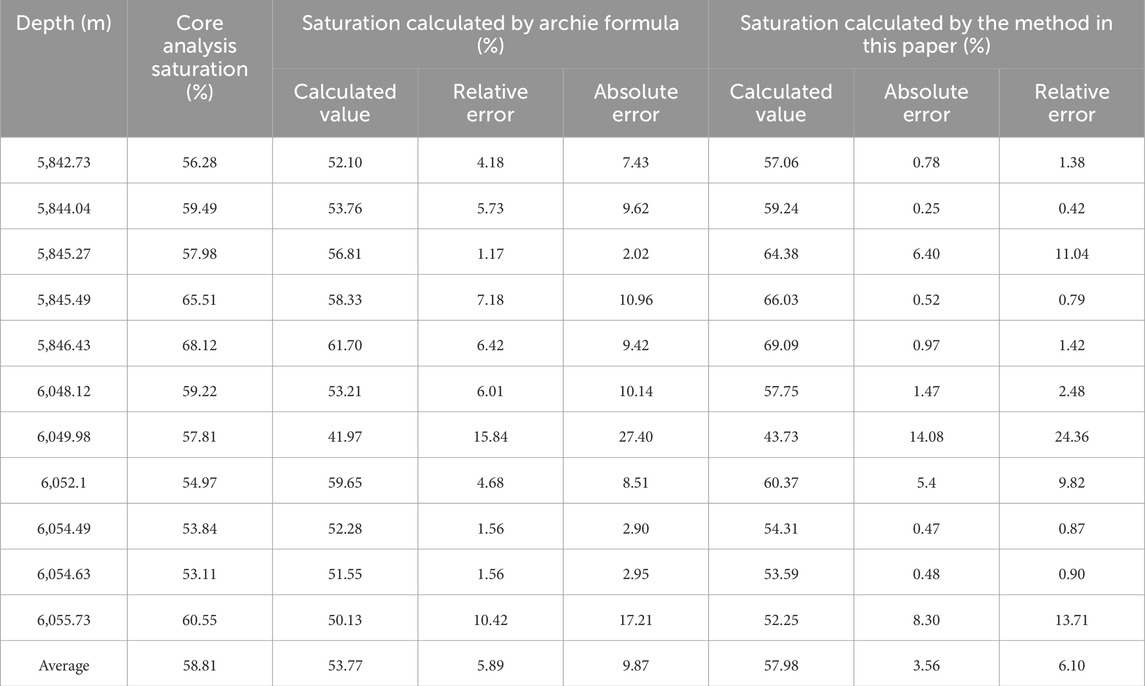
Table 1. Comparative analysis table of saturation calculation error of Well Dibei 5 in Dibei Gas reservoir, Tarim Basin.
6 Discussion
Tight sandstone reservoirs are characterized by complex pore structure, high shale content, and developed fractures, but the Archie formula is applicable to pure sandstone reservoirs with favorable physical properties, and the accuracy of the Archie formula for calculating the water saturation of tight sandstone reservoirs is not high (Feng et al., 2023; Zhou et al., 2019). Different from the Archie formula, this paper adopts the dual porosity model for saturation calculation. The properties of the reservoir are influenced by its pore structure, and a precise understanding of the pore structure of the rock is the prerequisite for obtaining accurate saturation (Zhang, 2010). The fracture-matrix dual porosity model divides the rock pore system into two components: fracture porosity and matrix porosity. The fracture-matrix dual porosity model can independently consider the contribution of fracture and matrix porosity to the saturation, thus its calculation accuracy is high. In this paper, the precise parameters of the saturation model are determined by conducting the rock electricity and NMR experiments, further enhancing the calculation accuracy of the saturation model. The saturation calculation method proposed in this paper takes into account the multiple influences of lithology, physical properties, pore structure, and fractures on electrical properties. However, the Archie model merely considers the effects of physical properties and oil content on electrical properties (Hu et al., 2017). Therefore, the saturation calculated by this method is highly consistent with that of coring analysis and has high accuracy in the quantitative evaluation of hydrocarbon properties of tight sandstone reservoirs. Finally, when applying the saturation calculation method, it is necessary to carry out matching rock electricity and NMR measurement experiments to establish accurate model parameters.
7 Conclusion
(1) Tight sandstone reservoirs are characterized by complex pore structure, high shale content, and developed fractures, which render the evaluation of saturation challenging. To address this issue, a method for calculating saturation in tight sandstone reservoirs is developed, comprehensively taking into account the influence of fractures, lithology, and other factors. If the shale content exceeds 20%, saturation is calculated using the Indonesian formula. Otherwise, the saturation is calculated using the double porosity model.
(2) The pore structure of rock constitutes one of the most crucial factors influencing the parameters of the saturation model. Based on the results of the rock resistivity and NMR experiments, porosity and the logarithmic mean value of T2 are chosen as input factors for calculating model parameters. Finally, the calculation model of mb value and nb value is established by the multiple regression method.
(3) The processing outcomes of logging data for tight sandstone reveal that the saturation calculation method proposed in this paper exhibits high precision in the saturation assessment of tight sandstone reservoirs. In contrast to the Archie model, this method considers the influences of lithology, pore structure, and fractures. Hence, the saturation evaluation results are more in line with the actual conditions of the reservoirs. The method proposed in this paper demonstrates excellent adaptability in the quantitative evaluation of saturation for tight sandstone reservoirs, and the saturation model suitable for other reservoirs will be further studied in the future.
Data availability statement
The datasets presented in this article are not readily available because exploratory research. Requests to access the datasets should be directed to PZ, cHF6aGFvQGN1cC5lZHUuY24=.
Author contributions
YX: Conceptualization, Data curation, Formal Analysis, Investigation, Methodology, Software, Validation, Writing–original draft, Writing–review and editing. WD: Data curation, Formal Analysis, Methodology, Software, Validation, Writing–original draft, Writing–review and editing. CH: Validation, Writing–review and editing. KB: Validation, Writing–review and editing. XZ: Validation, Writing–review and editing. YA: Validation, Writing–review and editing. PZ: Supervision, Validation, Writing–review and editing.
Funding
The author(s) declare that no financial support was received for the research, authorship, and/or publication of this article.
Acknowledgments
The authors wish to appreciate the support provided by Tarim Oilfield Company and Beijing Key Laboratory of Earth Prospecting and Information Technology. The authors would also like to ackonwlege the editorial department and the reviewers for their comments on this paper.
Conflict of interest
Authors YX, CH, KB, XZ, and YA were employed by Tarim Oilfield Company and China National Petroleum Corporation.
The remaining authors declare that the research was conducted in the absence of any commercial or financial relationships that could be construed as a potential conflict of interest.
Publisher’s note
All claims expressed in this article are solely those of the authors and do not necessarily represent those of their affiliated organizations, or those of the publisher, the editors and the reviewers. Any product that may be evaluated in this article, or claim that may be made by its manufacturer, is not guaranteed or endorsed by the publisher.
References
Aguilera, M. S., and Aguilera, R. (2003). Improved models for petrophysical analysis of dual porosity reservoirs. Petrophysics - SPWLA J. Form. Eval. Reserv. Descr. 44 (January), 21–35.
Aguilera, R. F., and Aguilera, R. (2004). A triple porosity model for petrophysical analysis of naturally fractured reservoirs. Petrophysics - SPWLA J. Form. Eval. Reserv. Descr. 45 (March), 157–166.
Archie, G. E. (1942). The electrical resistivity log as an aid in determining some reservoir characteristics. Trans. Aime 146 (01), 54–62. doi:10.2118/942054-G
Chen, Y., and Tan, M. J. (2003). Fracture detection and identification dsing logging techniques. Well logging Technol. 27 (S1), 11–14. doi:10.16489/j.issn.1004-1338.2003.s1.004
Clavier, C., Coates, G., and Dumanoir, J. (1984). Theoretical and experimental bases for the dual-water model for interpretation of shaly sands. Soc. Petroleum Eng. J. 24 (02), 153–168. doi:10.2118/6859-pa
Dai, J., Ni, Y., and Wu, X. (2012). Tight gas in China and its significance in exploration and exploitation. Petroleum Explor. Dev. 39 (3), 277–284. doi:10.1016/s1876-3804(12)60043-3
Desbois, G., Urai, J. L., Kukla, P. A., Konstanty, J., and Baerle, C. (2011). High-resolution 3D fabric and porosity model in a tight gas sandstone reservoir: a new approach to investigate microstructures from mm-to nm-scale combining argon beam cross-sectioning and SEM imaging. J. Petroleum Sci. Eng. 78, 243–257. doi:10.1016/j.petrol.2011.06.004
Ding, Y. J., Chai, X. Y., Shao, W. Z., Li, J. G., Han, Y., and Li, Q. H. (2017). Key parameters of water saturation based on concentration of T, spectrum distribution. Well Logging Technol. 41 (04), 405–411. doi:10.16489/j.issn.1004-1338.2017.04.005
Feng, S., Xie, R., Radwan, A. E., Wang, Y., Zhou, W., and Cai, W. (2023). Accurate determination of water saturation in tight sandstone gas reservoirs based on optimized Gaussian process regression. Mar. Petroleum Geol. 150, 106149. doi:10.1016/j.marpetgeo.2023.106149
Feng, S., Xie, R., Zhou, W., Yin, S., Chen, J., Zhang, M., et al. (2021). The new interpretation of the geological origin about differentiation phenomenon of resistivity in the tight sandstone reservoir. Arabian J. Geosciences 14 (20), 2074. doi:10.1007/s12517-021-08451-y
Gao, H., and Li, H. A. (2016). Pore structure characterization, permeability evaluation and enhanced gas recovery techniques of tight gas sandstones. J. Nat. Gas Sci. Eng. 28, 536–547. doi:10.1016/j.jngse.2015.12.018
Guo, Y., Pan, B., Zhang, L., Lei, J., Fan, Y., Ruhan, A., et al. (2022). A study on water saturation predictions in igneous reservoirs based on the relationship between the transverse relaxation time and the resistivity index. J. Petroleum Sci. Eng. 208, 109519. doi:10.1016/j.petrol.2021.109519
Hu, S. F., Zhou, C. C., Li, X., Li, C. L., and Zhang, S. Q. (2017). A tight sandstone trapezoidal pore oil saturation model. Petroleum Explor. Dev. 44 (5), 876–886. doi:10.1016/s1876-3804(17)30099-x
Jiang, H. (2018). Experimental study of the conductivity model for tight oil rock in the Jurassic Systen of Sichuan Basin. Beijing: China University of Petroleum. [dissertation/master's thesis]. [China (Beijing)].
Lai, J., Wang, G. W., Sun, S. M., Jiang, C., Zhou, L., Zheng, X. H., et al. (2015). Research advances in logging recognition and evaluation method of fractures in tight sandstone reservoirs. Prog. Geophys. (in Chinese) 30 (4), 1712–1724. doi:10.6038/pg20150426
Leveaux, J., and Poupon, A. (1971). Evaluation of water saturation in shaly formations. The Log Analyst 12 (04), 3–8.
Li, X., Li, C. L., Li, B., Liu, X. F., and Yuan, C. (2020). Response laws of electrical property and saturation evaluation method of tight sandstone. Petroleum Exploration and Development 47 (1), 202–212. doi:10.11698/PED.2020.01.20
Li, X., Zhao, W. Z., Zhou, C. C., Wang, T. S., and Li, C. L. (2012). Dual-porosity saturation model of low-porosity and low-permeability clastic reservoirs. Petroleum Exploration and Development 39 (01), 88–98. doi:10.1016/s1876-3804(12)60019-6
Liao, Q. Z., Wang, B., Chen, X., and Tan, P. (2024). Reservoir stimulation for unconventional oil and gas resources: recent advances and future perspectives. Advances in Geo-Energy Research 13 (1), 7–9. doi:10.46690/ager.2024.07.02
Liu, Z. Y., Zhang, C. G., Tang, J., and Xiao, C. G. (2018). Influence of fracture on rock resistivity and its application in saturation calculation. Lithologic Reservoirs 30 (02), 120–128. doi:10.12108/yxyqc.20180213
Luo, Q. (2010). Core observation and description of tight sandstone fractured reservoir an example from Wen ming zhai tight sandstone. Xinjiang Petroleum Geology (in Chinese) 31 (3), 229–231. doi:10.3724/SP.J.1077.2010.01195
Luo, S. C., Cheng, Z. G., Zhou, J. Y., Xi, H., and Wang, C. S. (2014). Research on saturation index n of tight sandstone reservoir. Journal of Southwest Petroleum University Science and Technology Edition 36 (04), 116–122. doi:10.11885/j.issn.1674-5086.2013.10.10.01.html
Rezaee, R., Saeedi, A., and Clennell, B. (2012). Tight gas sands permeability estimation from mercury injection capillary pressure and nuclear magnetic resonance data. Journal of Petroleum Science and Engineering 88–89, 92–99. doi:10.1016/j.petrol.2011.12.014
Shi, H., Luo, X. R., Lei, G. L., Wei, H. X., Zhang, L. Q., Zhang, L. K., et al. (2018). Effects of early oil emplacement on reservoir quality and gas migration in the Lower Jurassic tight sand reservoirs of Dibei gas field, Kuqa Depression, western China. Journal of Natural Gas Science and Engineering 50, 250–258. doi:10.1016/j.jngse.2017.12.004
Shi, P. Y., Shi, P. D., Bie, K., Han, C., Ni, X. W., Mao, Z. Q., et al. (2024). Prediction of permeability in a tight sandstone reservoir using a gated network stacking model driven by data and physical models. Frontiers in Earth Science 12. doi:10.3389/feart.2024.1364515
Silva, P. L., and Bassiouni, Z. (1986). Statistical evaluation of the S-b conductivity model for water-bearing shaly formations. The log analyst 27 (3), 9–19.
Simandoux, P. (1963). Dielectric measurements on porous media, application to the measurements of water saturation: study of behavior of argillaceous formations. Revue de L’ Institut Francais du Petrole. 18 (S1), 193–215.
Tang, J., Xin, Y., Cai, D. Y., and Zhang, C. G. (2018). A method of calculating saturation for tight sandstone reservoirs: a case of tight sandstone reservoir in Dabie area of Kuqa depression in Tarim Basin of NW China. Open Journal of Yangtze Oil and Gas 03, 21–35. doi:10.4236/ojogas.2018.31003
Vincent, M., and Wladyslaw, A. (2015). Calculation of water saturation in low resistivity gas reservoirs and pay-zones of the Cretaceous Grudja Formation, onshore Mozambique basin. Marine and Petroleum Geology 67 (11), 249–261. doi:10.1016/j.marpetgeo.2015.05.016
Wang, L., Sun, B. D., Shen, A. X., and Wan, J. B. (2005). On application of rock electricity parameters of shaly sand reservoir with low-porosity and permeability, permeability, × field. Well Logging Technology 29 (02), 91–94+184. doi:10.16489/j.issn.1004-1338.2005.02.001
Wang, Q. (2020). Study on saturation model and water cut evaluation method of tight sandstone. China University of Geosciences. [dissertation/master's thesis]. [China(Beijing)].
Wang, Q., Tan, M. J., Xiao, C. W., Wang, S. Y., Han, C., and Zhang, L. T. (2022). Pore-scale electrical numerical simulation and new saturation model of fractured tight sandstone. AAPG Bulletin 106 (7), 1479–1497. doi:10.1306/04132220165
Waxman, M. H., and Smits, L. J. M. (1968). Electrical conductivities in oil-bearing shaly sands. Society of Petroleum Engineers Journal 8 (02), 107–122. doi:10.2118/1863-A
Xiao, L., Zou, C. C., Mao, Z. Q., Shi, Y. J., Liu, X. P., Jin, Y., et al. (2013). Estimation of water saturation from nuclear magnetic resonance (NMR) and conventional logs in low permeability sandstone reservoirs. Journal of Petroleum Science and Engineering 108 (August), 40–51. doi:10.1016/j.petrol.2013.05.009
Yan, J. P., Wen, D. N., Li, Z. Z., Gen, B., Liang, Q., and He, X. (2015). The influence of low permeable sandstone pore structure on rock electrical parameters and its applications. Natural Gas Geoscience 26 (12), 2227–2233. doi:10.11764/j.issn.1672-1926.2015.12.2227
Yong, S. H., and Zhang, C. M. (1986). Logging data processing and comprehensive interpretation. Beijing: China University of Petroleum Press.
Zeng, L. B., Su, H., Tang, X. M., Peng, Y. M., and Lei, G. (2013). Fractured tight sandstone oil and gas reservoirs: a new play type in the Dongpu depression. Bohai Bay basin, China. AAPG Bulletin 97 (3), 363–377. doi:10.1306/09121212057
Zhang, H. M. (2010). Saturation interpretation model study on fractured reservoirs. East China: China University of Petroleum. [dissertation/master's thesis]. [China(Qingdao)].
Zhang, J. Y., Liu, H. H., Liu, W., J. Sun, M., and Zhao, J. P. (2015). Thin sand and mudstone interbed saturation model based on a dual mudstone indicator. Petroleum Drilling Techniques 43 (02), 59–62. doi:10.11911/syztjs.201502011
Zhang, L. H., Zhou, C. C., Liu, G. Q., Xiu, L. J., Li, C. X., and Liu, Z. H. (2006). Influence of pore structures on electric properties and well logging evaluation in low porosity and permeability reservoirs. Petroleum Exploration and Development 33 (06), 671–676. doi:10.3321/j.issn:1000-0747.2006.06.006
Zhang, M. L., and Shi, Y. J. (2005). On archie’s electrical parameters of sandstone reservoir with complicated pore structures. Well Logging Technology 29 (01), 21-23+28–12. doi:10.16489/j.issn.1004-1338.2005.05.016
Zhang, X., Li, Q. P., Li, L. X., Fan, Q., and Geng, J. H. (2023). Combination of sonic wave velocity, density and electrical resistivity for joint estimation of gas-hydrate reservoir parameters and their uncertainties. Advances in Geo-Energy Research 10 (2), 133–140. doi:10.46690/ager.2023.11.07
Zhao, G. J., Li, X. Q., Liu, M. C., Dong, C. Y., Chen, D. Y., and Zhang, J. (2022). Reservoir characteristics of tight sandstone and sweet spot prediction of Dibei gas field in eastern Kuqa depression, northwest China. Energies 15 (9), 3135. doi:10.3390/en15093135
Zhao, H., Shi, X., and SiMa, L. Q. (2012). Study on porosity exponent, saturation and fracture porosity for fractured reservoirs. Progress in Geophysics. (in Chinese) 27 (6), 2639–2645. doi:10.6038/j.issn.1004-2903.2012.06.043
Zhao, P. Q., Wang, Y. T., Li, G. R., Hu, C., Xie, J. R., Duan, W., et al. (2023). Joint inversion of saturation and qv in low-permeability sandstones using spontaneous potential and resistivity logs. Petrophysics 64, 741–752. doi:10.30632/PJV64N5-2023a8
Zhou, X. Q., Zhang, C., Zhang, Z. S., Zhang, R. F., Zhu, L. Q., and Zhang, C. M. (2019). A saturation evaluation method in tight gas sandstones based on diagenetic facies. Marine and Petroleum Geology 107, 310–325. doi:10.1016/j.marpetgeo.2019.05.022
Keywords: tight sandstone, dual porosity model, resistivity logs, water saturation calculation, rock resistivity experiment, nuclear magnetic resonance (NMR) experiment
Citation: Xin Y, Duan W, Han C, Bie K, Zhao X, Ai Y and Zhao P (2024) A method for calculating saturation in tight sandstone reservoirs based on the dual porosity model. Front. Earth Sci. 12:1484021. doi: 10.3389/feart.2024.1484021
Received: 21 August 2024; Accepted: 07 October 2024;
Published: 18 October 2024.
Edited by:
Huaimin Dong, Chang’an University, ChinaReviewed by:
Xin Nie, Yangtze University, ChinaSheng-Qing Li, China University of Petroleum (East China), China
Copyright © 2024 Xin, Duan, Han, Bie, Zhao, Ai and Zhao. This is an open-access article distributed under the terms of the Creative Commons Attribution License (CC BY). The use, distribution or reproduction in other forums is permitted, provided the original author(s) and the copyright owner(s) are credited and that the original publication in this journal is cited, in accordance with accepted academic practice. No use, distribution or reproduction is permitted which does not comply with these terms.
*Correspondence: Peiqiang Zhao, cHF6aGFvQGN1cC5lZHUuY24=