 Yu Qi*
 Dan Li
 Wei Tang
- CNOOC Research Institute Ltd., Beijing, China
The development of high-accuracy seismic prediction technology, capable of mitigating the influence of coal events and accurately inverting key reservoir parameters, is critical for enhancing the exploration and development of tight gas reservoirs in coal-bearing strata. Block L, located on the eastern edge of the Ordos Basin, serves as a case study. This area, where tight sandstone gas deposits are widespread in the Upper Paleozoic, is characterized by coal seams that complicate seismic interpretation. The available drilling data show that the tight gas layers in the Taiyuan and Benxi Formations are well-developed and serve as the primary hydrocarbon source rocks. However, the low-density, low-velocity coal seams create strong wave impedance contrasts, which significantly affect the neighboring tight sandstone gas layers and present substantial challenges for seismic prediction. To address this issue, we employ wavelet decomposition and reconstruction techniques to eliminate coal seam interference and high-resolution waveform simulation technology for seismic prediction of thin reservoirs. This approach circumvents the limitations of using a single impedance parameter to differentiate between sand–mudstone and limestone–coal interfaces. Step-by-step inversion and gradual stripping techniques are applied to remove the influences of coal seam and limestone, thereby facilitating accurate identification of sandstone distribution. Drilling data confirm the reliability and effectiveness of this reservoir prediction method for coal-bearing strata. Based on successful applications in the eastern Ordos Basin, this workflow demonstrates broad applicability and offers significant guidance for exploring similar reservoirs, given the parallel reservoir characteristics and the foundational technological approach.
1 Introduction
Our study focuses on Block L, situated on the northeastern margin of the Ordos Basin, where the stratigraphic structure is representative of the region. The primary stratigraphic units in this area include the Carboniferous Benxi Formation and the Permian Taiyuan, Shanxi, Shihezi, and Shiqianfeng formations. Drilling data indicate widespread tight sandstone gas in the Upper Paleozoic strata, with the Benxi and Taiyuan formations identified as the main hydrocarbon source rocks. Multiple coal seam sets, prevalent in the region, provide substantial material for the large-scale gas supply to the tight sandstone gas reservoirs. The Benxi and Taiyuan formations are critical exploration and development targets in the eastern Ordos Basin (Lan et al., 2010). The Benxi Formation represents a sea–land transitional delta-shore shallow sea coal-bearing sedimentary sequence, with the 8+9 # coal seam at the top. The Taiyuan Formation, deposited on top of the Benxi Formation, is defined by the 8+9 # coal seam as its lower boundary and consists of delta-shore shallow sea deposits. Both formations primarily comprise carbonate rock, sandstone, mudstone, and coal seams. The tight sandstone gas layers, located adjacent to coal seams, form tight gas reservoirs that efficiently accumulate natural gas due to the source–reservoir pressure difference. The thickness of individual sandstone layers in both the Benxi and Taiyuan formations ranges from 2 to 10 m, with an average thickness of approximately 5 m. However, there are three key challenges for reservoir prediction in this area. First, the thick loess layer covering the surface, combined with surface and geological constraints, limits seismic resolution. The dominant seismic frequency near the target layers is 30 Hz, with an effective frequency bandwidth of 5–55 Hz and an average seismic velocity of 4,500 m/s. The minimum distinguishable thickness, constrained by the resolution limit of λ/4 (where λ is the wavelength of the seismic wavelet), is approximately 38 m, which exceeds the thickness of the sandstone reservoir. Additionally, due to the low density and velocity characteristics of coal seams, a strong impedance contrast is created, causing significant interference in the seismic response of the tight sandstone near the coal seam. This results in challenges in accurately predicting the reservoir from seismic data as the strong reflection from the coal seam dominates the signal. Furthermore, the small difference in the acoustic impedance between sandstone and mudstone hinders effective impedance inversion for predicting the spatial distribution of sandstone bodies.
To address the issue of strong coal seam reflections obstructing reservoir prediction, numerous studies have been conducted. By applying wavelet decomposition and matching pursuit techniques to attenuate the strong reflection, researchers have developed effective methods in prediction of coal-bearing strata reservoirs, achieving promising results. Zhang et al. (2012) explored the use of multi-wavelet decomposition and reconstruction in stripping strong shielding. Sarkar et al. (2024) applied this approach to enhance reservoir prediction accuracy and analyzed the use of partial frequency wavelet techniques to mitigate the impact of the coal seam. Wang (2010) proposed a multi-channel matching pursuit algorithm to address the influence of coal seam reflections on seismic profile continuity. Qiao (2018) used drilling data to correlate coal seam thickness and amplitude attributes and applied wavelet and waveform decomposition methods to eliminate coal seam interference in seismic data. He et al. (2019) introduced a well-controlled matching pursuit technique to eliminate strong coal seam reflections based on seismic constraints. Overall, these approaches showed that impedance inversion results align well with drilled sandstone thickness.
However, in our study area, post-stack impedance inversion, which relies solely on decoal seismic data, fails to meet the accuracy requirements in prediction of predicting thin sandstone reservoirs. To enhance the resolution of inversion results, several advanced methods, including model-based inversion, waveform inversion, and other sophisticated inversion techniques (Russell and Hampson, 1991; Hampson et al., 2001; ten Kroode et al., 2013; Chen and Chen, 2019), are widely used. Drawing inspiration from model-based inversion, we developed a deterministic model using well interpolation techniques. When integrated with seismic impedance inversion, this approach accurately aligns high-frequency components with the well interpolation results. Although this approach significantly improves resolution, it remains highly sensitive to the initial model, leading to multiple possible solutions in model-based inversion (Gelderblom and Leguijt, 2010; De Figueiredo et al., 2014; Virieux et al., 2014). Chen and Chen. (2019) demonstrated that waveform inversion can overcome the limitations caused by seismic vertical resolution and more accurately predict thin sandstone reservoirs affected by coal seam shielding. Wang et al. (2021) utilized seismic waveform inversion and simulation techniques to minimize interference from thin coal seams and successfully predicted oil and gas reservoirs.
This study proposes a high-resolution waveform indication simulation technology for predicting reservoirs using coal removal data. This methodology has broad applicability for predicting tight sandstone gas reservoirs influenced by coal seams. Initially, wavelet decomposition and reconstruction, based on the well seismic combination methodology, are applied to eliminate coal seam interference. Next, the high-resolution waveform indication simulation technology is implemented. The accuracy of this reservoir prediction technology is validated using drilled wells. The approach holds significant reference and promotional value and provides crucial guidance for natural gas exploration, particularly in tight sandstone gas fields with coal seams. In contrast to traditional methods that rely solely on impedance parameters or gamma curves, the proposed workflow integrates wavelet decomposition and reconstruction to mitigate coal seam interference. This is followed by high-resolution waveform indication simulation, which refines reservoir prediction by leveraging the lateral continuity and consistency of seismic waveforms. The technology delivers higher resolution and greater reliability than conventional techniques, especially in areas with complex lithologies and strong coal seam reflections.
2 Methods
2.1 Strong reflection attenuation of the coal seam based on the wavelet decomposition and reconstruction
The Benxi and Taiyuan formations are complex lithologic targets in the study area, dominated by coal seams, limestone, sandstone, and mudstone. Coal seams exhibit low density and high acoustic time differences, contrasting sharply with the impedance of surrounding rocks. They are characterized by low-frequency, continuous, strong reflections on seismic profiles (Figure 1). Figure 1 illustrates the seismic profile for inline 917 in the eastern Ordos Basin, with Xline ranging from 1,120 to 2,280 and the target area spanning 1,000–1,200 ms. The strong reflections from coal seams make it challenging to predict sandstone reservoirs based solely on original seismic data.
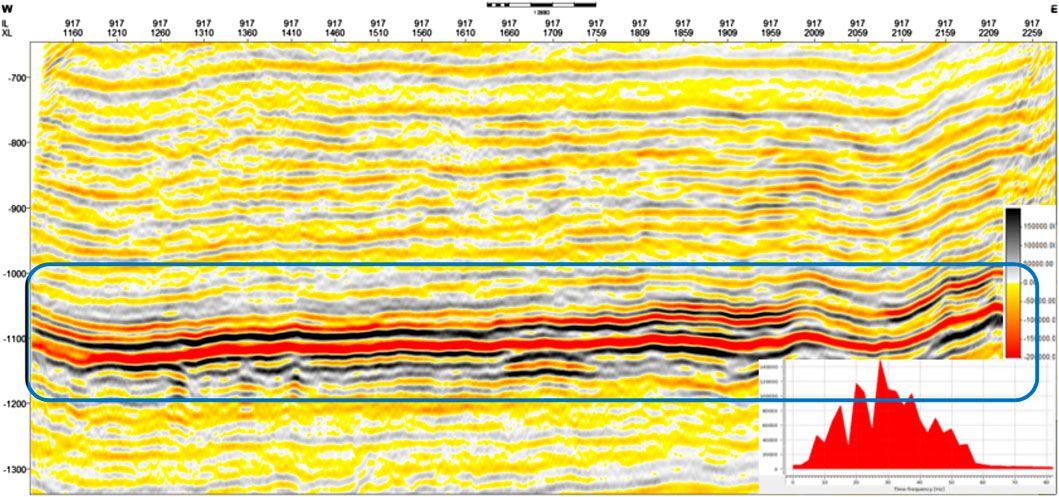
Figure 1. Seismic reflection characteristic of the research area, the eastern part of the Ordos Basin. The Xline range spans from 1,120 to 2,280, and the inline is 917. The target area, in the range of 1,000–1,200 ms, is shown in blue. The strong reflections of the coal seams are obvious in the middle of the marked part, which may influence the seismic prediction of the thin sandstone reservoirs in the target area.
Seismic signals are processed using wavelet decomposition and reconstruction, segmenting them into sub-wavelets based on the amplitude, frequency, and other attributes. These sub-wavelets are filtered, optimized, and reconstructed to enhance geological and petroleum indicators, thereby aiding in reservoir prediction and characterization.
This study utilizes wavelet decomposition and reconstruction based on the matching pursuit algorithm. This iterative optimization algorithm, proposed by Mallat and Zhang (1993), is widely applied in sub-seismic signal analysis.
The matching pursuit algorithm decomposes the synthetic signal into a linear expression of time–frequency atoms from an over-complete atom library. Given a time–frequency atom library D and parameter set
where
Because
To minimize the residual signal
where
The same method is used to continue the approximation toward
Residual signal
Decomposition is repeated until the residual energy falls below a predefined threshold, which depends on the actual seismic data. Once this threshold is met, the whole decomposition process is complete, and we can obtain Equation 6
Using the selected optimal atom to reconstruct the signal, the reconstructed seismic signal is derived. This reconstruction is achieved by decomposing the signal into five sub-wavelets with varying frequencies (Figure 2).
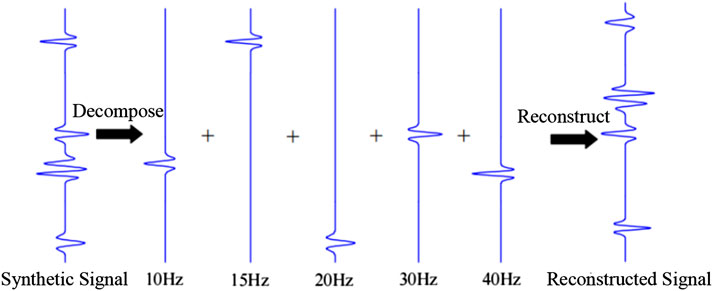
Figure 2. Decomposition and reconstruction sketch map of a seismic wavelet. The synthetic signal is first decomposed into five sub-signals with frequencies of 10, 15, 20, 30, and 40 Hz and then reconstructed into the final new signal for later application with the selected optimal atom based on the matching pursuit algorithm.
This technique has demonstrated significant success in predicting sandstone within coal-bearing strata. By subtracting the coal seam’s strong reflection from the original seismic data, we isolate the data without coal seam interference. Comparing the wavelet decomposition results with the actual seismic data (Figure 3), it is evident that the effective information of the reservoir, previously obscured by the coal seam, is restored. The processed seismic profile removes the coal seam’s strong reflection, highlighting the sand body’s clear reflection, reasonable lateral variation, and a natural waveform without distortion.
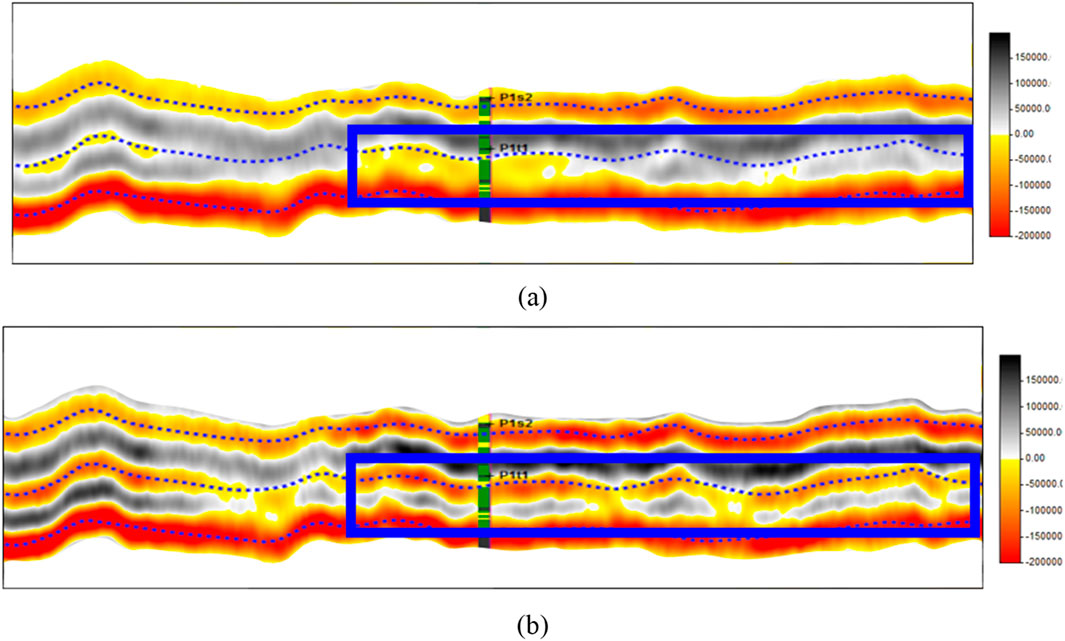
Figure 3. Seismic profiles of Taiyuan Formation (A) before and (B) after wavelet decomposition. The strong reflection event in the seismic profile of the coal seam has been eliminated, and the sand body, shown in blue, is more obvious after the wavelet decomposition technology. The new seismic data are meaningful for further thin sandstone reservoir predictions.
2.2 High-resolution waveform indication inversion
Traditional geostatistical inversion characterizes spatial variation by analyzing a limited set of samples and estimating high-frequency components for prediction points. Seismic data are matched to forward gathers of simulation results to integrate information across the seismic frequency band. However, geostatistical methods are influenced by sample distribution, and simulation accuracy requires uniform well distribution (Gu et al., 2016; Liu et al., 2020; Liu et al., 2023b; Qi et al., 2024). Additionally, variogram statistics, particularly the range determination, often fail to capture sedimentary facies variations within reservoir spaces, leading to poorly defined geological patterns and highly random simulation results. Seismic waveform inversion builds on traditional geostatistics by incorporating both waveform similarity and spatial distance to select statistical samples. Samples are sorted based on structural consistency, and inversion results reflect constraints imposed by sedimentary facies belts (Liu et al., 2023a), aligning more closely with depositional laws and spatial characteristics. The workflow for waveform inversion is as follows (Figure 4): ①A chronostratigraphic framework model is established based on seismic interpretation horizons. ②Predicted seismic waveforms are compared with those from wells within the chronostratigraphic framework. Wells with the most similar waveforms are selected as analogs, and their logging curves help construct an initial impedance model. ③The vertical impedance characteristics of sample wells are analyzed, and high-frequency components are filtered out using frequency division methods. Sample comparisons highlight common structural features, preserving deterministic frequency band elements. ④Using seismic mid-frequency impedance as a reference, the initial model’s high-frequency components are optimized within a Bayesian framework. ⑤Through iterative random simulations, the stochastic solutions’ mid-frequency components are aligned with seismic data, while deterministic structural elements are maintained. ⑥The final simulation results are obtained.
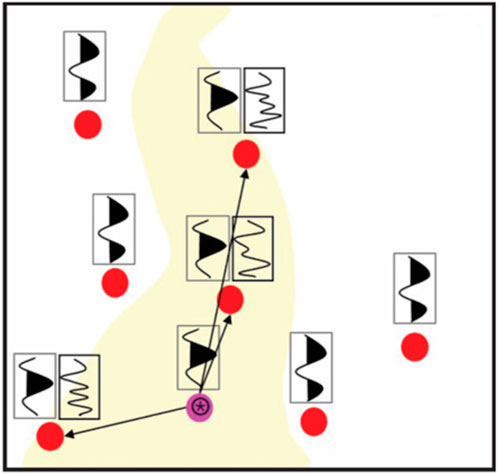
Figure 4. Samples were selectively chosen based on the similarity of seismic waveforms. Similar waveforms are connected based on the consistency of sample structure characteristics. The samples are sorted according to the distribution distance.
3 Results
Seismic waveforms reflect the geological body’s comprehensive response, including vertical lithological combinations, lateral variations, and changes in the reservoir spatial structure (ten Kroode et al., 2013; Aleardi et al., 2018).
Seismic forward modeling demonstrates that although thin layers may not be discernible in the longitudinal direction of seismic data, they still affect the lateral waveform trend. When reservoir structures are similar, seismic waveforms can exhibit similar patterns. Therefore, lateral variations in seismic waveforms are used to characterize spatial changes in reservoir structures, rather than traditional variation functions (Figure 5), where the upper figure shows the lithology model and the lower figure presents the seismic simulation. Using A-30 and A-33 wells as examples, a filtered gamma curve reveals that the correlation is frequency-dependent. The correlation coefficient for frequency ranges is as follows: 0–1,000 Hz, 20.2%; 0–800 Hz, 22.8%; 0–600 Hz, 26.9%; 0–400 Hz, 45.9%; 0–200 Hz, 76.8%; and 0–100 Hz, 95.6%. Analysis of waveform indication samples shows that the frequency band for reservoir structure similarity is broader than that of the seismic waveform. The waveform indication simulation technology utilizes a frequency division strategy, progressively enhancing resolution from low–intermediate-frequency deterministic inversion to high-frequency stochastic inversion. This process is validated by starting random simulation only when the inversion frequency exceeds the specified high cut-off frequency (Figure 6).
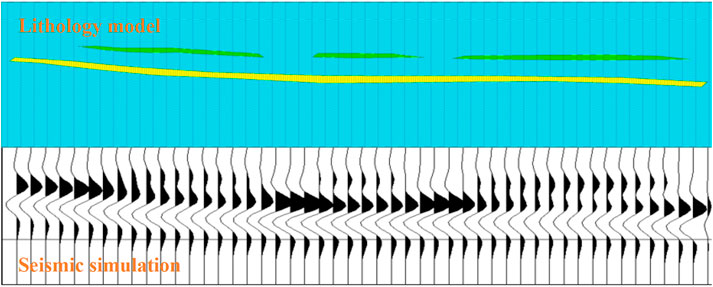
Figure 5. Seismic forward modeling of the thin sandstone reservoir. The velocity and density of the sandstone are 3,500 m/s and 2,375 kg/m3, respectively, and the velocity and density of the mudstone are 2,500 m/s and 2,184 kg/m3, respectively. The seismic wavelet is the Ricker wavelet of 40 Hz. The upper figure is the lithology model, and the lower part corresponds to the seismic simulation results. The basic lithology model interfaces are characterized in the seismic profile.
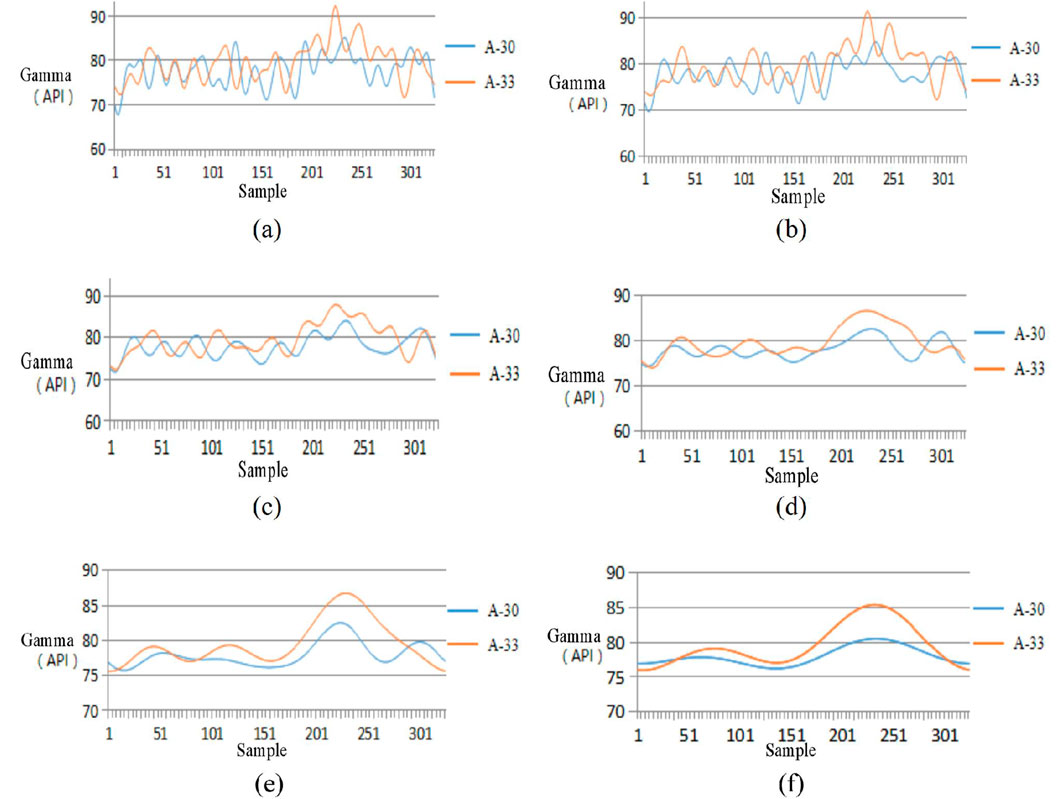
Figure 6. Analysis of the correlation coefficient between the natural gamma curve of well A-30 and the natural gamma curve of well A-33 at frequency bands of (A) 0–1,000 Hz, (B) 0–800 Hz, (C) 0–600 Hz, (D) 0–400 Hz, (E) 0–200 Hz, and (F) 0–100 Hz. The correlation coefficient of 0–1,000 Hz is approximately 20.2%, that of 0–800 Hz is approximately 22.8%, that of 0–600 Hz is approximately 26.9%, that of 0–400 Hz is approximately 45.9%, that of 0–200 Hz is approximately 76.8%, and that of 0–100 Hz is approximately 95.6%.
The seismic waveform’s simulation of the lateral variation drives the characteristics of high-frequency logging data, enabling high-resolution inversion. In the longitudinal direction, the inversion aligns with high-frequency logging data, yielding high longitudinal resolution. In the transverse direction, it follows seismic waveform variations, achieving high lateral resolution. These results confirm the high precision of the inversion process. By using lateral seismic waveform variations, the simulation eliminates the need for spatial domain interpolation via variogram-based methods, realizing automatic facies-controlled inversion. This approach overcomes the subjectivity inherent in traditional facies-controlled inversion, which requires pre-defined sedimentary facies (Zhao et al., 2007). The seismic waveform indication simulation algorithm, based on Markov Chain Monte Carlo stochastic simulation, performs seismic prior finite sample simulation involving two critical inversion parameters: effective sample number and optimal cut-off frequency. These parameters, along with well decoalization, are detailed further in the following section.
3.1 Well decoalization
Based on the wavelet decomposition and reconstruction techniques described above, the coal seam reflection data can be obtained. To ensure consistency between well and seismic data during inversion, a well decoal process is required. Drilling data statistics indicate that both coal seams and sandstones in the study area exhibit low GR values, whereas mudstone displays high GR values. However, the GR attribute alone is insufficient to distinguish between coal seams and sandstone. By interpreting well lithology, the GR value for coal seams can be adjusted to match the mudstone GR value, thus generating a reservoir-sensitive logging curve. This allows for the application of waveform indication simulation inversion (Figure 7).
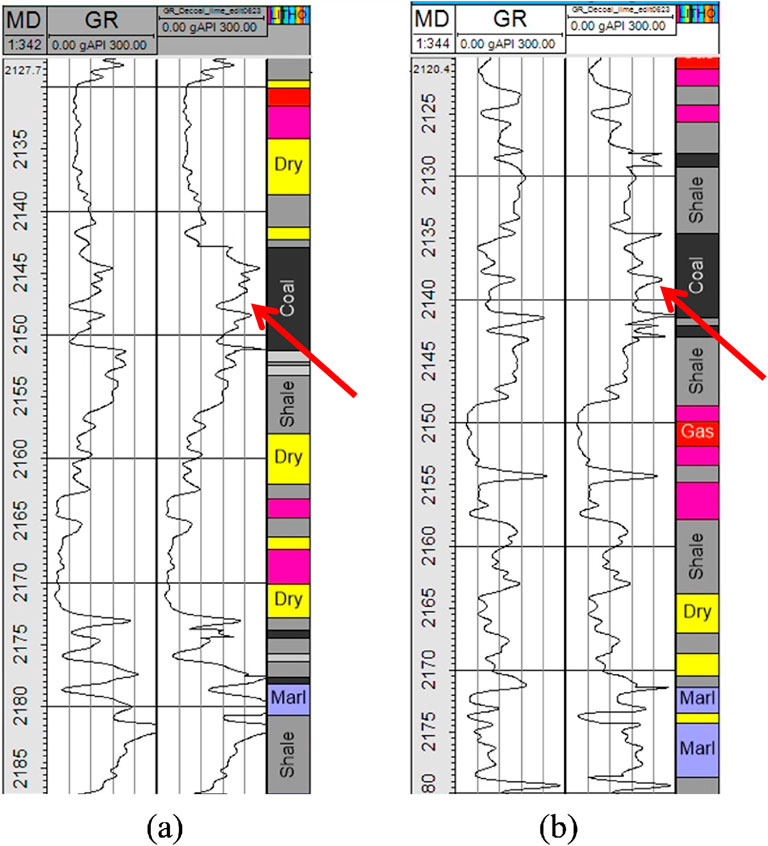
Figure 7. Comparison of GR curves before (left part) and after (right part) the well decoalization process at the location of (A) well A and (B) well B. The red arrows indicate the main coal seam parts. It is obvious that the coal seam has totally different GR properties of the sandstone layers (yellow lithology), which can easily distinguish the coal seam and sandstone layers.
3.2 Number of valid samples
The number of effective samples primarily reflects the impact of seismic waveform spatial variation on reservoirs and is a key parameter for optimizing samples in seismic waveform indication simulation. This number is closely linked to the spatial variation of reservoirs, encapsulating both lateral variation and vertical structural complexity (Sambridge and Drijkoningen, 1992; Sokolov et al., 2021; Yang, 2018).
Seismic waveform indication simulation achieves cross-well prediction by calculating the common structure of valid samples. Increasing the number of samples improves the accuracy of this common structure, thereby enhancing the correlation index.
However, once the number of valid samples exceeds a certain threshold, further increases do not significantly affect the correlation. In Markov chain Monte Carlo stochastic simulations, the sample weight is determined based on waveform similarity (primary) and the distance between the prediction points (secondary).
As the number of effective samples increases, the proportion of samples with lower waveform similarity also increases, causing the difference between reservoirs to increase and reducing the weight that influences prediction outcomes. Fewer samples are required to enhance the prediction accuracy. Based on data characteristics and statistical results from the study area, the correlation stabilizes when the number of effective samples reaches 8, at which point the inversion quality also becomes stable (Figure 8).
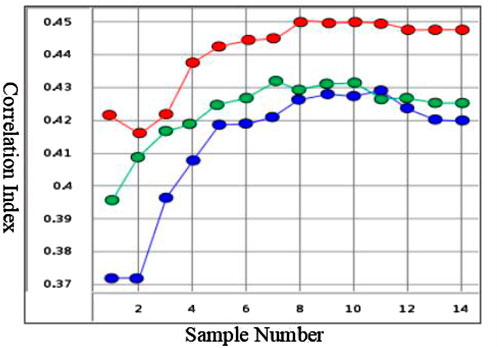
Figure 8. Analysis of simulated sample number of seismic waveform indication in the study area. When the sample number is 8, the correlation reaches the limited value, and the inversion quality tends to be stable.
3.3 Best cut-off frequency
The seismic waveform indication simulation is a statistical method characterized by “low-frequency determination and high-frequency randomness” (Zhang et al., 2018). The low-frequency component is primarily influenced by the seismic frequency band, while high-frequency variability results from random simulation, with increased randomness at higher frequencies. Therefore, selecting an optimal cut-off frequency is essential (Figure 9). Figure 10 presents the optimal cut-off frequency analysis for the waveform indication simulation in our study area. The analysis shows that most curves exhibit inflection points at approximately 200 Hz. Prior to this point, the correlation index decreases gradually and then stabilizes thereafter. Thus, 200 Hz is identified as the optimal cut-off frequency.
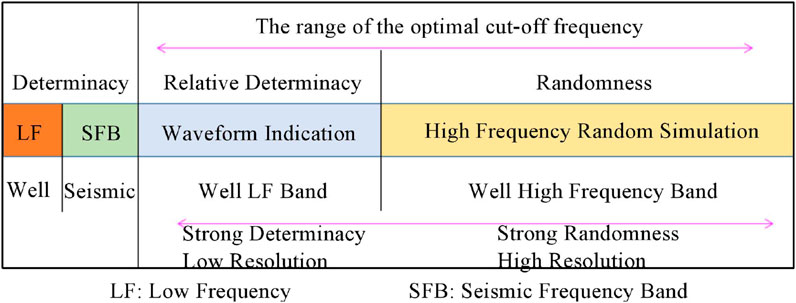
Figure 9. Analysis of the analog frequency component of seismic waveform indication. The comparisons of the well and seismic frequency bands for relative determinacy and randomness are shown obviously for later analysis.
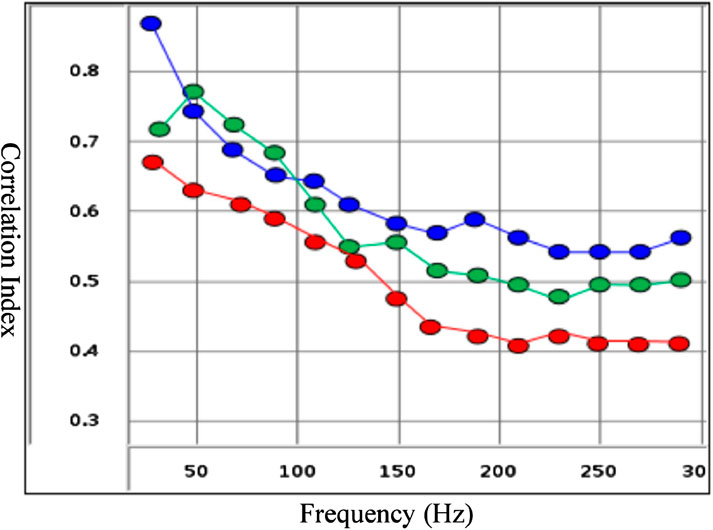
Figure 10. Quality control chart of the optimal cut-off frequency for waveform indication simulation. When the frequency is approximately 200 Hz, most of the curves have inflection points. The correlation index gradually decreases before the inflection point (the optimal cutoff frequency), and then it tends to be stable after the cutoff frequency.
3.4 Application effect
The waveform indication simulation technology addresses limitations in identifying sandstone and mudstone when using only a single-wave impedance parameter, as well as distinguishing between limestone and coal seams with a single gamma curve. Coal seams typically exhibit lower densities and P-wave velocities, resulting in a P-wave impedance generally below 7,000 g/cm³ × m/s, while limestone displays higher densities and P-wave velocities, with impedance values exceeding 14,800 g/cm³ × m/s. These contrasts in P-wave impedance enable clear differentiation between coal seams and limestone. Seismic waveform-guided inversion, supported by gamma-ray logs, is employed to effectively characterize sandstone and shale, allowing precise delineation of coal seams, limestone, and shale to identify tight sandstone formations. Using step-by-step inversion and gradual stripping techniques, the influence of coal seams and limestone is isolated, enabling accurate sandstone distribution identification and reliable seismic predictions, even under coal seam shielding and complex lithologic conditions. Figure 11 presents the waveform indication inversion profile for the Tai 2 section, where black indicates coal layers in wells L-1 and L-2, red denotes gas layers, yellow represents dry layers, and gray signifies shale. The profile aligns well with actual drilling data, demonstrating high resolution, reasonable lateral variability, and accurate reservoir prediction. The process effectively mitigates strong coal seam effects, facilitating tight gas layer prediction, as shown in Figure 11. According to the inversion results, Well L-1 was drilled with 23.6 m of the gas layer encountered in the Taiyuan and Benxi Formations, exhibiting a full gas logging curve. This well has recently commenced production, achieving an industrial daily output of 1.46 × 10⁴ m³, further validating the accuracy of this reservoir prediction technology. Subsequently, 16 boreholes have been drilled in the block, with sand body prediction accuracy rates of 76.47% for the Taiyuan Formation and 81.25% for the Benxi Formation. This methodology shows potential for wider application in the development of tight gas reservoirs similar to those in the Ordos Basin.
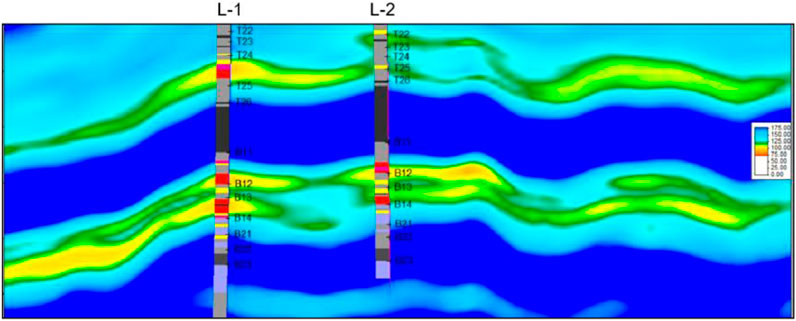
Figure 11. Seismic meme inversion profile of the Tai 2 Segment. The prediction results correspond well with the actual well data for different lithology facies, which can be further applied for the thin sandstone tight gas exploration.
4 Discussion
The proposed technology offers improved accuracy and resolution for tight gas reservoirs influenced by coal seams, enhancing the exploration and development efficiency. Waveform indication simulation is widely used for thin sandstones with strong coal seam events (Nelson et al., 2012; Chisholm et al., 2015; Babikir et al., 2022) and has been applied in regions such as Eastern India (Choudhury and Dutta, 2016; Sarkar and Mandal, 2018), the United States (Harris and Varela, 2014; Batzle and Wang, 2019), and Canada (Margrave and Lines, 2006; Harris and Calvert, 2015). However, our proposed approach combines wavelet decomposition and seismic waveform indication simulation with multi-parameter testing, offering higher accuracy. Unlike traditional methods, this combination effectively eliminates the strong seismic influence of coal seams, yielding more precise predictions for thin sandstone reservoirs. The proposed workflow is highly applicable to similar reservoirs and thin sandstone strata affected by coal seams, enabling more accurate seismic predictions by removing coal seam interference. Due to data limitations, we have only applied this technology to the Ordos Basin, but with additional data, it can be extended to other similar reservoirs.
5 Conclusion
The study of coal measure reservoirs in the L gas field of the Ordos Basin has led to the development of effective reservoir prediction techniques for coal measure strata. These techniques address challenges in reservoir prediction, enhance well location deployment, and improve thin-sand-body prediction. The key findings are as follows: (1) wavelet decomposition and reconstruction technology effectively removes coal seam shielding effects, restoring the reflection signal from sandstone. (2) Seismic waveform indication simulation is a significant innovation over traditional geostatistical inversion, using lateral seismic waveform variation to characterize changes in reservoir spatial structure instead of variation functions. This method aligns with the “phase control” concept and overcomes the limitations of geostatistical inversion, significantly improving the resolution and prediction accuracy. (3) The number of effective samples and the optimal cut-off frequency are fundamental parameters in waveform indication simulations, directly influencing inversion accuracy. This method significantly enhances the resolution and precision of seismic reservoir predictions, which, in turn, improves well location selection and optimization in tight gas fields. Although wavelet decomposition and reconstruction have demonstrated considerable promise in reducing coal seam interference for thin reservoir prediction, there are inherent limitations. The variability in coal seams and other lithologies introduces uncertainties that cannot be entirely resolved by signal processing alone. Additionally, the algorithm’s sensitivity to the choice of wavelets and decomposition levels necessitates careful calibration for optimal results. Furthermore, the quality of input seismic data is critical; even sophisticated processing techniques cannot compensate for poor-quality data.
Data availability statement
The original contributions presented in the study are included in the article/supplementary material; further inquiries can be directed to the corresponding author.
Author contributions
YQ: data curation, funding acquisition, investigation, methodology, resources, software, validation, writing–original draft, and writing–review and editing. KW: data curation, funding acquisition, investigation, methodology, and writing–original draft. QL: investigation, methodology, software, and writing–review and editing. XZ: data curation, methodology, and writing–review and editing. BW: data curation, writing–original draft, and writing–review and editing. DL: data curation, investigation, methodology, and writing–original draft. WT: methodology and writing–review and editing.
Funding
The author(s) declare that financial support was received for the research, authorship, and/or publication of this article. This work was financially supported by the technology project of China National Offshore Oil Corporation, titled “Reservoir Formation Conditions and Exploration Key Technologies for Bauxite and Ordovician in the Eastern Margin of the Ordos Basin” (KJZH-2023-2104). The funder was not involved in the study design, collection, analysis, interpretation of data, the writing of this article, or the decision to submit it for publication.
Conflict of interest
Authors YQ, KW, QL, XZ, BW, DL, and WT were employed by CNOOC Research Institute Ltd.
Publisher’s note
All claims expressed in this article are solely those of the authors and do not necessarily represent those of their affiliated organizations, or those of the publisher, the editors and the reviewers. Any product that may be evaluated in this article, or claim that may be made by its manufacturer, is not guaranteed or endorsed by the publisher.
References
Aleardi, M., Ciabarri, F., and Gukov, T. (2018). A two-step inversion approach for seismic-reservoir characterization and a comparison with a single-loop Markov-chain Monte Carlo algorithm. Geophysics 83, R227–R244. doi:10.1190/geo2017-0387.1
Babikir, I., Salim, A. M. A., Hermana, M., Abdul Latiff, A. H., and Al-Masgari, A. A. S. (2022). Characterizing the subsea Pleistocene fluvial system of the Sunda Shelf, offshore Malaysia, using multiattribute corendering and self-organizing maps. Interpretation 10, T291–T304. doi:10.1190/INT-2021-0005.1
Batzle, M. L., and Wang, Z. (2019). Waveform inversion and its application to coal seam evaluation. Geophys. Prospect. 67, 129–145.
Chen, Y. H., and Chen, J. (2019). The application of seismic meme inversion to thin sand distribution prediction under coal shield. Geophys. Geochem. Explor. 43, 1254–1261. doi:10.11720/wtyht.2019.1325
Chisholm, A. S. B., Hossack, R. C. G. B., and Hughes, C. E. S. E. (2015). Modeling seismic wave propagation in layered sandstone and coal system. J. Geophys. Res. Solid Earth 120, 2903–2918.
Choudhury, A., and Dutta, P. (2016). Geophysical investigations for coal seam characterization in Eastern India. J. Earth Syst. Sci. 125, 859–872.
De Figueiredo, L. P., Santos, M., Roisenberg, M., Neto, G. S., and Figueiredo, W. (2014). Bayesian framework to wavelet estimation and linearized acoustic inversion. IEEE Geosci. Remote Sens. Lett. 11, 2130–2134. doi:10.1109/LGRS.2014.2321516
Gelderblom, P., and Leguijt, J. (2010). Geological constraints in model-based seismic inversion. Seg. Tech. Program Expand. Admin, 2825–2829. doi:10.1190/1.3513430
Gu, W., Xu, M., Wang, D. H., Zheng, H., Zhang, X., Zhang, D. J., et al. (2016). Application of seismic motion inversion technology in thin reservoir prediction: a case study of the thin sandstone gas reservoirs in the B area of Junggar Basin. Nat. Gas. Geosci. 27, 2064–2069. doi:10.11764/j.issn.1672-1926.2016.11.2064
Hampson, D. P., Schuelke, J. S., and Quirein, J. A. (2001). Use of multiattribute transforms to predict log properties from seismic data. Geophysics 66, 220–236. doi:10.1190/1.1444899
Harris, J. B., and Varela, A. (2014). Seismic modeling of thin coal seams and sandstone interlayers: applications in the Appalachian Basin. J. Appl. Geophys. 102, 112–120.
Harris, J. R., and Calvert, A. J. (2015). Application of seismic imaging techniques to gas reservoir characterization in Canada. Can. J. Earth Sci. 52, 749–761.
He, F., Weng, B., Han, G., Ding, J. C., and Tian, Y. X. (2019). A seismic constraint-based technology for elimination of strong coal seam reflection via well-control and matching pursuit. China Offshore Oil Gas. 31, 61–66. doi:10.11935/j.issn.1673-1506.2019.01.007
Lan, C. L., Zhang, Y. Z., Zhang, J. F., Yang, M. H., and Wang, J. X. (2010). Reservoir characteristics and controlling factors of Taiyuan Formation in shenmu gas field. J. Xi’an Petrol. Univ. Nat. Sci. Ed. 25, 7–11.
Liu, X. Y., Chen, X. H., Cheng, J. W., Zhou, L., Chen, L., Li, C., et al. (2023a). Simulation of complex geological architectures based on multistage generative adversarial networks integrating with attention mechanism and spectral normalization. IEEE Trans. Geosci. Remote Sens. 61, 1–15. doi:10.1109/TGRS.2023.3294493
Liu, X. Y., Chen, X. H., Li, J. Y., Zhou, X., and Chen, Y. (2020). Facies identification based on multikernel relevance vector machine. IEEE Trans. Geosci. Remote Sens. 58, 7269–7282. doi:10.1109/TGRS.2020.2981687
Liu, X. Y., Zhou, H. L., Guo, K. K., Li, C., Zu, S., and Wu, L. (2023b). Quantitative characterization of shale gas reservoir properties based on BiLSTM with attention mechanism. Geosci. Front. 14, 101567. doi:10.1016/j.gsf.2023.101567
Mallat, S. G., and Zhang, Z. (1993). Matching pursuits with time-frequency dictionaries. IEEE Trans. Signal Process. 41, 3397–3415. doi:10.1109/78.258082
Margrave, G. F., and Lines, L. R. (2006). Seismic monitoring of gas reservoirs: a case study from Western Canada. Geophysics 71, A47–A52.
Nelson, P. A., Batzle, R. J., and Yoon, H. M. I. B. (2012). Seismic response of thin coal seams: implications for exploration. Geophys. Prospect. 60, 265–276.
Qi, Y., Wu, K., Wang, B., Zheng, X., Li, W., and Li, D. (2024). Lithofacies identification of deep coalbed methane reservoir based on high-resolution seismic inversion. Front. Earth Sci. 12. doi:10.3389/feart.2024.1440729
Qiao, Z. L. (2018). The method to remove coal seam’s influence on oil reservoir prediction: a case from the Binchang area. Mar. Geol. Front. 34, 66–71. doi:10.16028/j.1009-2722.2018.11010
Russell, B., and Hampson, D. (1991). A comparison of post-stack seismic inversion methods. 61st SEG annual international meeting: SEG Expanded Admin, 876–878.
Sambridge, M., and Drijkoningen, G. (1992). Genetic algorithms in seismic waveform inversion. Geophys. J. Int. 109, 323–342. doi:10.1111/j.1365-246X.1992.tb00100.x
Sarkar, M., Mondal, U., Pal, U., and Nandi, D. (2024). Image deraining via multi-level decomposition and empirical wavelet transform. Multimed. Tools Appl. 83, 76107–76129. doi:10.1007/s11042-024-18468-6
Sarkar, S., and Mandal, D. (2018). Seismic response analysis of coal seams in the Eastern India coalfields. Geophys. J. Int. 213, 1401–1415.
Sokolov, A., Schulte, B., Shalaby, H., and van der Molen, M. (2021). Seismic inversion for reservoir characterization. Appl. Tech. Integr. Oil Gas. Reserv. Char. 329-351, 329–351. doi:10.1016/b978-0-12-817236-0.00013-3
ten Kroode, F., Bergler, S., Corsten, C., de Maag, J. W., Strijbos, F., and Tijhof, H. (2013). Broadband seismic data — the importance of low frequencies. Geophysics 78, WA3–WA14. doi:10.1190/geo2012-0294.1
Virieux, J., Asnaashari, A., Brossier, R., Métivier, L., Ribodetti, A., and Zhou, W. (2014). An introduction to full waveform inversion. Geophys. Ref. Ser. doi:10.1190/1.9781560803027.entry6
Wang, H. Y., Zhou, X. L., and Hu, W. (2021). Prediction of coal-bearing strata reservoir in the Pingbei slope zone of the Xihu Depression. Geophys. Prospect. Petrol. 60, 595–603. doi:10.3969/j.issn.1000-1441.2021.04.008
Wang, Y. H. (2010). Multichannel matching pursuit for seismic trace decomposition. Geophysics 75, V61–V66. doi:10.1190/1.3462015
Yang, W. (2018). Well-seismic combined reservoir predicting method based on the waveform indication inversion and its application. Daqing Petrol. Geol. Dev. 37, 137–144. doi:10.19597/j.issn.1000-3754.201710014
Zhang, J. H., Liu, Z., Liu, B. Y., Zhu, B. H., and Feng, D. Y. (2012). Analysis and identification of weak reflectors under strong shielding layer. Spec. Oil Gas. Reserv. 19, 23–26.
Zhang, X., Zhang, B. J., and Liang, H. (2018). The application of prestack inversion based on seismic waveform indaicator to the prediction of compact and thin oil-bearing sand layer. Geophys. Geochem. Explor. 42, 545–554. doi:10.11720/wtyht.2018.1050
Keywords: seismic prediction, tight gas reservoir, coal seam, wavelet decomposition and reconstruction, waveform simulation technology
Citation: Qi Y, Wu K, Li Q, Zheng X, Wang B, Li D and Tang W (2025) Seismic prediction technology for thin reservoirs of tight gas in coal measure strata: a case study of Block L in the eastern margin of the Ordos Basin. Front. Earth Sci. 12:1487487. doi: 10.3389/feart.2024.1487487
Received: 28 August 2024; Accepted: 12 December 2024;
Published: 07 January 2025.
Edited by:
Xingye Liu, Chengdu University of Technology, ChinaReviewed by:
Suzhen Shi, China University of Mining and Technology, Beijing, ChinaJiwei Cheng, Research Institute of Petroleum Exploration and Development (RIPED), China
Copyright © 2025 Qi, Wu, Li, Zheng, Wang, Li and Tang. This is an open-access article distributed under the terms of the Creative Commons Attribution License (CC BY). The use, distribution or reproduction in other forums is permitted, provided the original author(s) and the copyright owner(s) are credited and that the original publication in this journal is cited, in accordance with accepted academic practice. No use, distribution or reproduction is permitted which does not comply with these terms.
*Correspondence: Yu Qi, cWl5dUBjbm9vYy5jb20uY24=