 Jinyan Huang
 Xingrong Liu1*
 Jinxia Zhang
- 1Institute of Geological and Natural Disaster Prevention and Control, Gansu Academy of Sciences, Lanzhou, China
- 2College of Water Conservancy and Hydropower Engineering, Gansu Agricultural University, Lanzhou, China
The design of check dam openings for debris flow control has been identified as a longstanding challenge, with no definitive solution yet identified. In this study, a quantitative analysis of the control efficacy of check dams with varying opening rates is presented. Field investigation data of 67 check dams located in Wenxian County, Gansu Province, were utilized to gain a preliminary understanding of their running state and damage situation. Building upon this, five check dams with opening rates ranging from 2.1% to 10.4% were designed and subjected to testing. Parameters including volumetric water content, pore water pressure, deposit morphology, and particle size distribution were analyzed to investigate the effect of varying opening rates on debris flow control. The results showed that: 1) As the opening rate of the check dams increased, the peaks of volumetric water content and pore water pressure behind the dam first decreased and then stabilized. When the opening rate was increased to 6.3% or higher, these parameters reached stable values. 2) Check dams with different opening rates all demonstrated good effects in retaining the coarse and sluicing the fine, resulting in the average particle size behind dams was coarsened by 2.65 times. This coarsening was primarily attributed to an increase in the proportion of retained particles within the 2–5 mm size range. 3) An optimal opening range of 4.2%–6.3% was identified for effective debris flow control. Compared with other dams, Dam II with opening rate 4.2% exhibited superior performance in mitigating flow energy and intercepting coarse particles, but it imposed stringent strength-related requirements.
1 Introduction
Debris flows are among the most common geological phenomena in China’s mountainous regions and are characterized by sudden outbreaks, brief duration, and a strong destructive power (Cui, 1999; Deng et al., 2021; Wei et al., 2024). According to the United States Geological Survey (Hübl et al., 2009; Di et al., 2008), debris flows can be classified into soil-driven and water-driven flows based on the dynamics of their genesis, where the latter have a low frequency of outbreak and are difficult to identify. This is a weak link in research on debris flow-induced disasters (Takahashi, 2007; Hübl et al., 2003; Choi et al., 2018; Iverson et al., 2010). Debris flow control works can be used to regulate the scale of the damage caused by them. Gravity dams are the major structure used to this end and can be divided into closed-type and open-type according to their structure (Armanini et al., 2005; Fei and Shu, 2006). Closed-type dams exhibit poor permeability and are prone to silting, which affects their regulatory function, and can even amplify the scale of debris flow due to their failure. Open-type dams are a complementary optimization of closed-type dams in which discharge culverts are drilled into the dam to intercept coarse particles and discharge fine ones, and to separate water from rock to significantly extend their service life (Zhou et al., 2020; Sun et al., 2021; Ruan et al., 2021). Open-type dams are thus a popular subject of research on debris flow prevention (Shima et al., 2016; Wendeler and Volkwein, 2015; Lin et al., 2017). Choi et al. (2018), conducted a series of flume tests to prove that slit dams can mitigate the energy of debris flow. Dong et al. (2022) found that adding discharge culvert (open-type dams) does not significantly reduce the strength of the dam but can mitigate the destructive effect of debris flows on it.
Studies have mainly focused on the interaction between the diameter of the opening and the size of particles in debris flows (Jeong and Lee, 2019; Rossi and Armanini, 2019). However, only a small number of studies have considered how the opening ratio can mitigate silting of dams and debris flow transfer Zhou et al. (2020) and Rossi and Armanini (2019) have shown that excessively low opening ratios result in poor dam permeability making the dam susceptible to clogging and failure. They emphasize that a balance between the regulatory effects of the dam and its safety should be sought in engineering design, highlighting that a reasonable opening ratio is critical for the preventative efficacy of check dams. Conversely, excessively high opening ratios cannot yield the desired check effects, and affect the safety of the dam. In an exploration of the regulatory effects of the opening ratio on the dynamics of water and soil in debris flow Jia et al. (2011), found that the flow variation through a dam with an opening ratio of 2.2% was about twice that of a dam with an opening ratio of 6.6%. Jeong and Lee (2019), Wang and Huang (2013), and Hu et al. (2020) qualitatively investigated the response relationship between the slit size Iverson et al., 2010 of the dam and the impact force of debris flow, concluding that the slit size significantly influences the velocity of debris flow and silting.
In summary, the design of the opening of the check dam primarily relies on the empirical settings. Relatively little quantitative research has been devoted to the laws of the response of the parameters of water and soil behind dams to their opening ratios. To scientifically guide the design of the opening of dams in projects to block debris flows, it is essential to quantitatively investigate the relationship of material and energy regulation between the opening ratio of the check dam and debris flows.
The goal of this research is to determine when the opening ratio of the check dam is optimal for debris flow prevention. Field investigation and indoor flume tests were conducted. By controlling the debris flows through check dams with varying opening ratios, parameters such as particle size distribution, pore water pressure, volumetric water content, and volume of sediment behind the check dams were investigated to comprehensively evaluate their regulatory performance. The regulatory effect of check dams on the particle composition of debris flows was studied using the law of variation in particle gradation behind dams with varying opening ratios. By analyzing the variance in parameters of water and soil behind dams with different opening ratios, the regulatory effect of check dams on the conversion of debris flow energy was explored.
2 Field investigation
2.1 Overview of the research area
Gansu Province is in northwest China at the junction of the Loess Plateau, the Qinghai–Tibet Plateau, and the Inner Mongolia Plateau, and has complex and diverse geological conditions. Wen County in Longnan City is in southeast Gansu Province (Figure 1). It is a zone of intersection between the westward extension of the western Qinling Mountains and the eastward extension of the Minshan Mountain range. The terrain is steep, the geological structure is well developed, seismic activity is frequent, the ravines are vertical and horizontal, and high mountain valleys are interspersed and distributed. Landslides and collapses are prevalent in the gullies, and loose materials are abundant. The region is located south of 33° North latitude and belongs to the marginal zone of the subtropics. The average annual precipitation in the area in the last decade was 513.2 mm/year, with abundant rainfall that provided favorable conditions for the formation of debris flows. There are a total of 256 large and small gullies for debris flows in the county, with a developmental density of 0.051 gullies/km2. Debris flows mostly occur from June to September each year and are all induced by rainfall (Zhou et al., 2022; Zhu et al., 2024; Yu et al., 2016; Xie et al., 2019). They occur suddenly and with great momentum, pose a direct threat to important facilities, such as the towns, villages, and trunk lines for traffic in the area, and severely affect the normal life and order of production of the locals (Cui et al., 2015; Wang et al., 2024). To reduce the damage caused by them, interception dams and drainage ditches have been built in many basins, and have helped prevent major disasters.
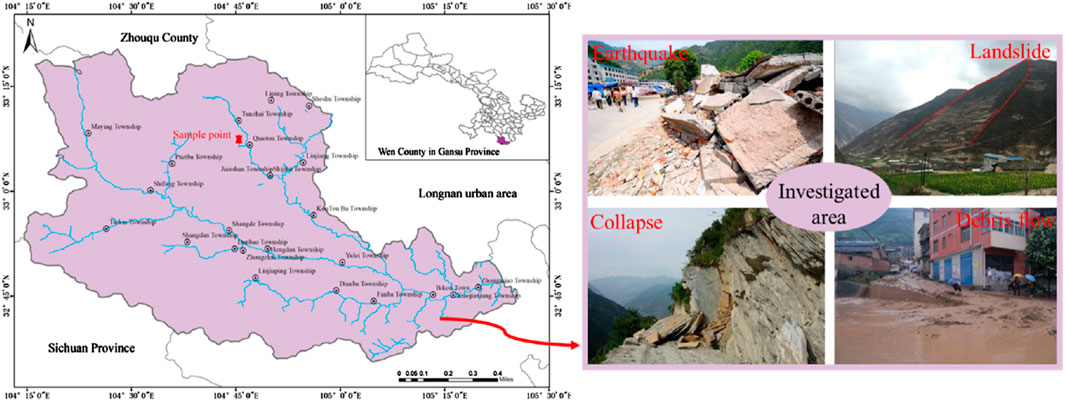
Figure 1. Geographical location of the study area.
2.2 Survey results
We surveyed and collected data on 67 check dams installed in 24 representative debris flow gullies in Wenxian County, Gansu Province (Figure 2). The results are shown in Table 1. The forms of damage to the check dams included overall rush destruction, and damage to the auxiliary dams, their overflow holes, and their shoulders and foundation. A comparison of closed and permeable check dams showed that the rate of rush destruction of closed dams was 24% and their rate of silting (the check dams had been silted up) was 83%, while the rate of rush destruction of permeable dams was only 6% and their rate of silting was 57%. This shows that installing drainage culverts can help regulate the composition of debris flows, extend the silting time of the storage capacity of check dams, and improve their service life. We also found during our investigation that check dams with higher opening rates still had empty reservoirs after more than 10 years of operation, which means that prevention and treatment had not had a significant effect. Therefore, a higher opening rate was not necessarily better for preventing silting behind the dam. A comparison of the status of operation of silted and non-silted check dams showed that the rate of damage to the former was 48%, while that to the lat ter was less than 5%. This shows that once the storage capacity of the check dams had been silted up, the probability of damage to them increased. This is because, on the one hand, the water level in front of the dam had increased to lift debris flows and increase the area of contact between them, and the overflow holes and dam shoulders to enhance erosion and destruction. On the other hand, the increased energy of debris flows increased impact-induced damage to the foundation or the revetment downstream once the debris flows had overflowed from the dam.
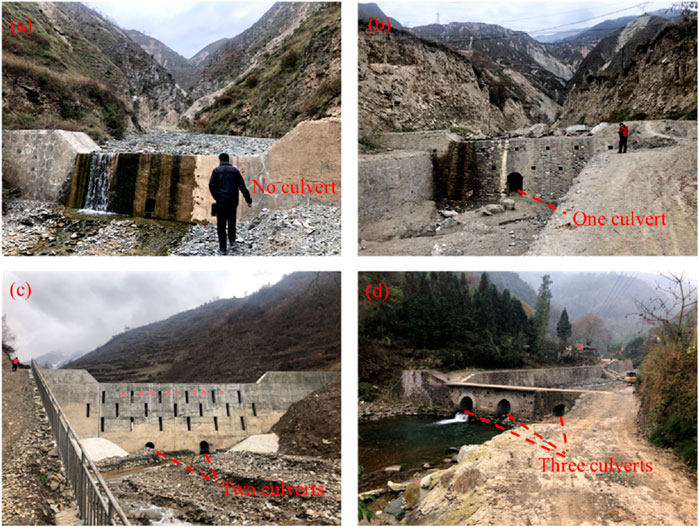
Figure 2. Retaining dams with different opening rates, including those with no culvert, one culvert, two culvert, three culverts.
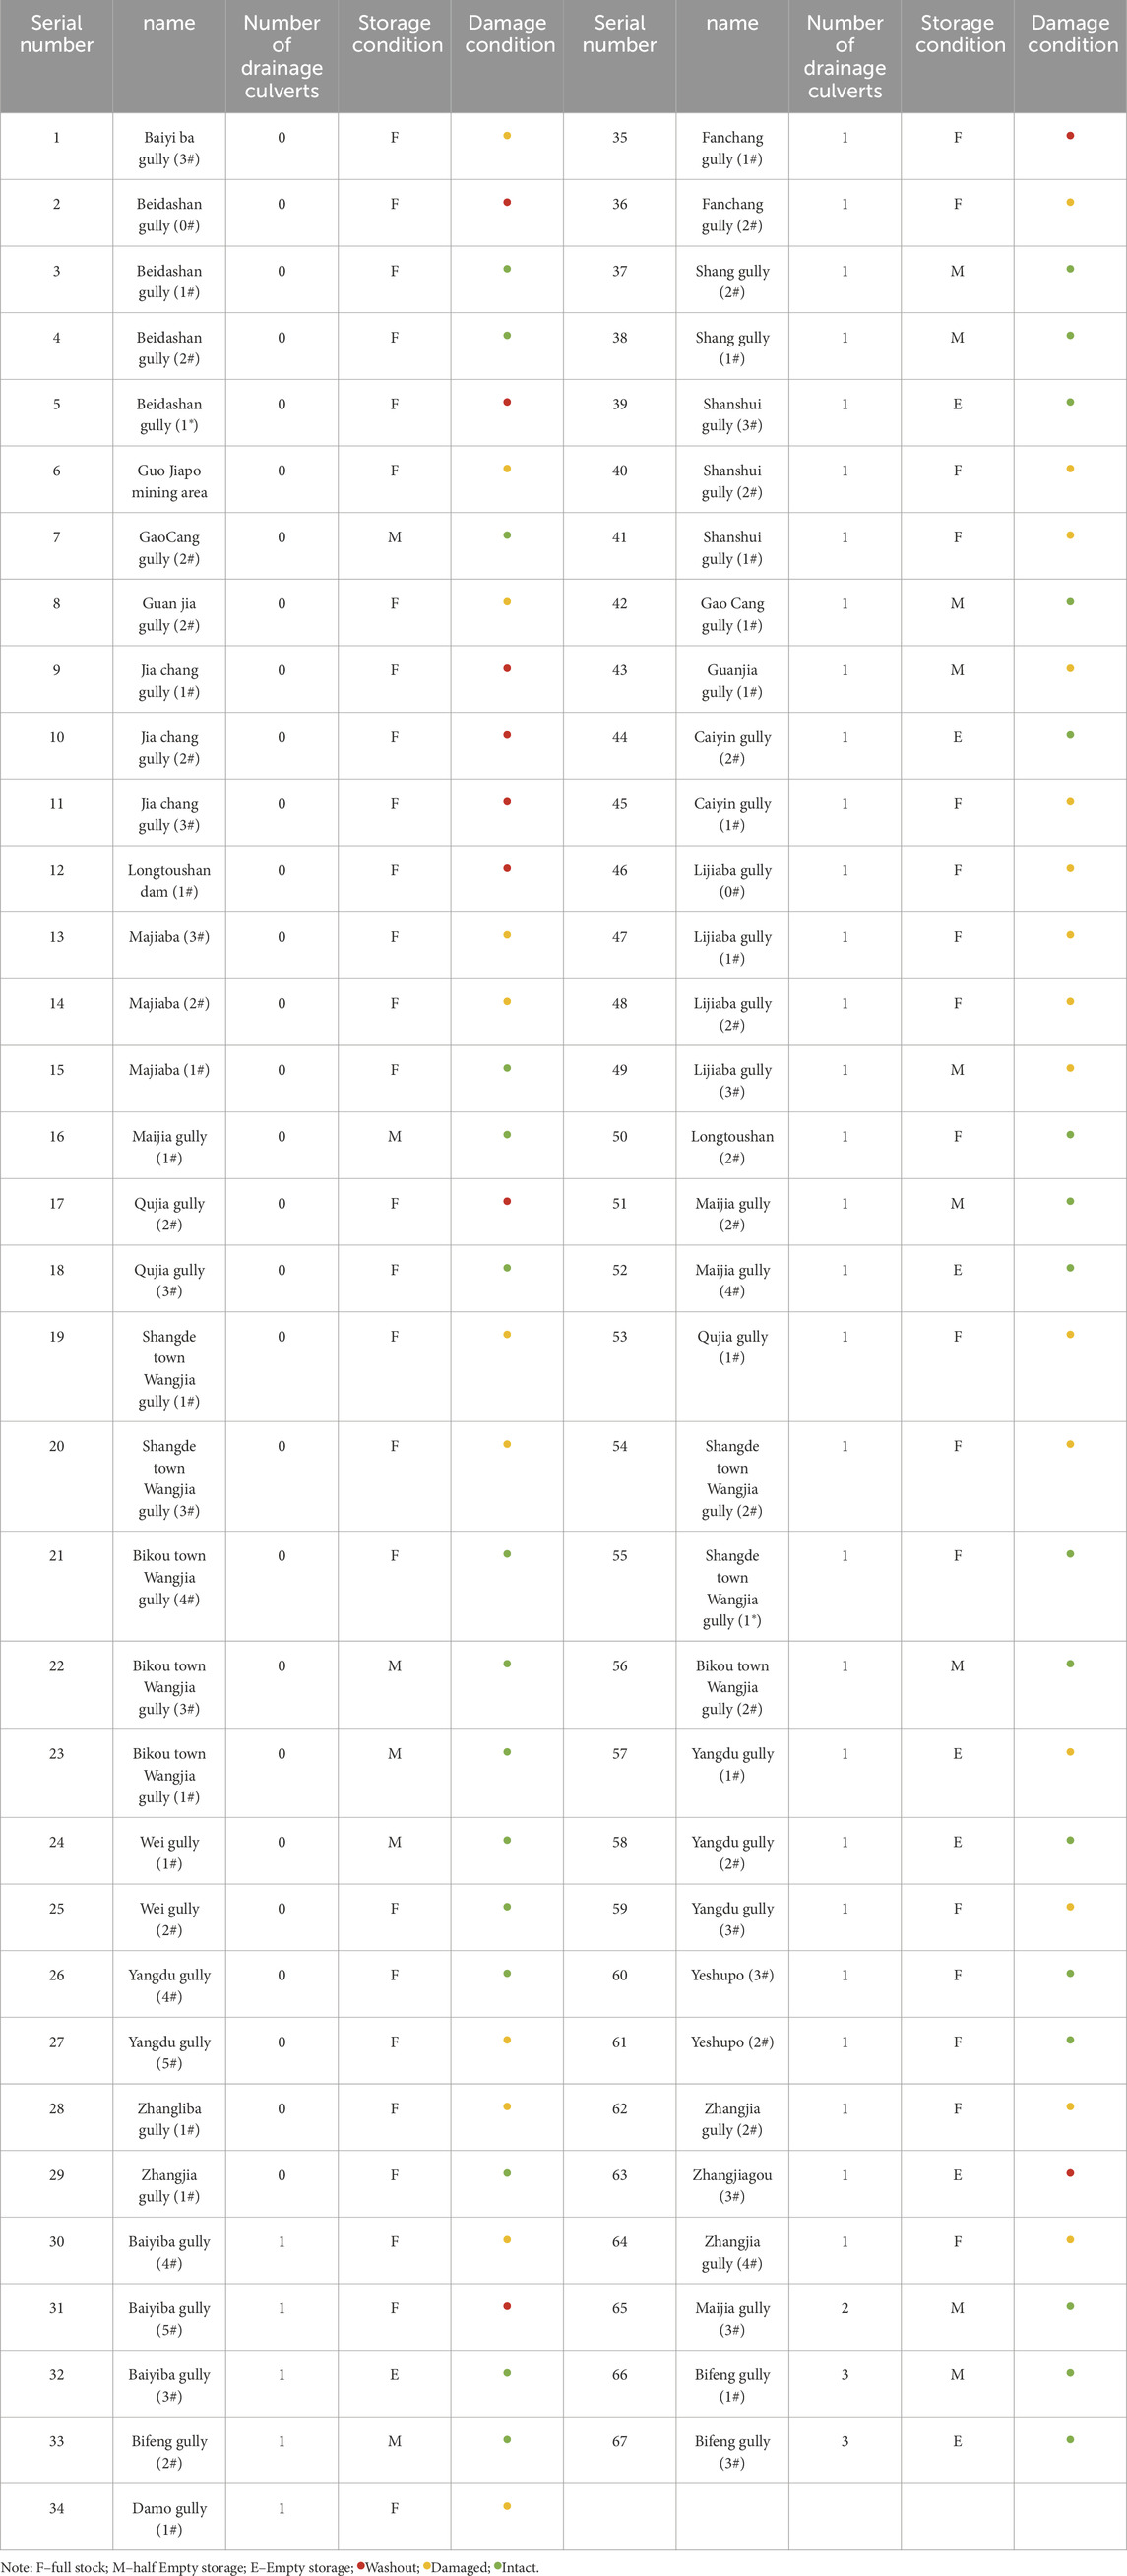
Table 1. Investigation information of barrier dams.
3 Experimental schemes
Our field survey revealed that check dams with different opening rates had different effects in terms of controlling debris flow. To investigate the internal control mechanism and identify the optimal opening rate, we designed five check dams with different opening rates for flume tests of the debris flows, The experimental plan is shown in Table 2. Soil samples for the tests were taken from 100 m behind check dam No. 3 in the Beishan Gully of Wencheng County in Longnan City, Gansu Province, with geographical coordinates of 32°50′49.5″N–104°45′32.9″E (Figure 1).
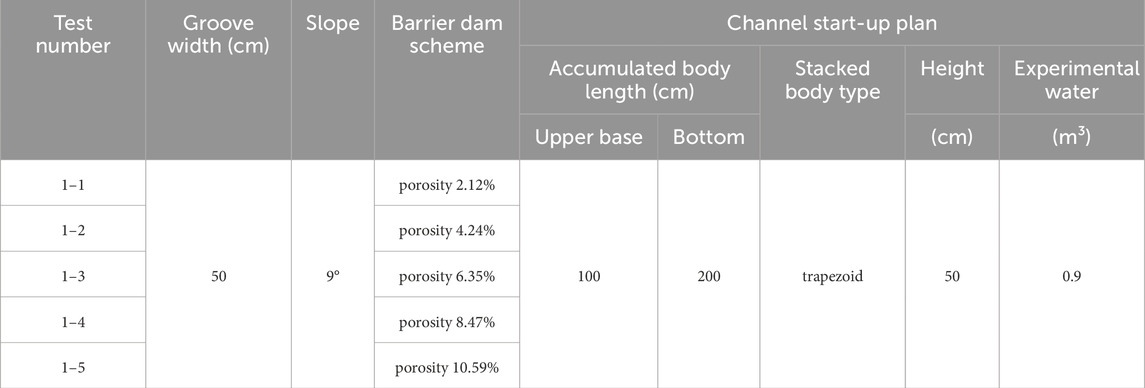
Table 2. Model test conditions.
3.1 Experimental apparatus
The tests were carried out in the landslide and debris flow laboratory of the Institute of Geological Natural Disaster Prevention of the Gansu Academy of Sciences. The experimental setup is shown in Figure 3 and mainly included brackets, water tanks, flumes, areas of deposition, sedimentation pools, and data acquisition systems. The flume was 6,500 mm long, 500 mm wide, and 800 mm high. The bottom was made of stainless steel and the sides were made of transparent organic glass. The contact surface was smooth, because of which the influence of boundary effects on the results could be ignored.

Figure 3. Test setup. (A) Three-dimensional drawing. (B) Actual photo.
The range of flume gradients was 0°–40°. The gradient of the gully in which the sampling point was located was approximately 9° and was used as the flume gradient in the tests. After removing particles larger than 10 cm, the gully deposit was simplified into a trapezoid with the dimensions shown in Figure 3A. The total mass of the deposit was 250 kg, and its density was 1.68 g/cm3. According to a preliminary test, 0.9 m3 of water discharge at a time could ensure that the deposit in the ditch was completely activated to form debris flows.
3.2 Instrument arrangement
Figure 4 shows that the body of the dam was placed 2,500 mm from the outlet. The area between the water tank and the dam was the zone of flow of clean water to ensure that it could smoothly flush through the body of the dam. The check dam was set at 5,200 mm from the outlet to ensure that the soil and water were fully mixed to form the debris flow before encountering the check dam. Sensors to detect the pore water pressure and volumetric water content were installed behind the dam to monitor changes in them during the check of debris flow. Two sensors were arranged in each group at distances of 4,650 mm (Location 1) and 4,950 mm (Location 2) from the outlet. In addition, an HD camera was arranged on each of the upper parts of the check dam, the side face of the water tank, and the opposite side of the test platform to fully observe the phenomena.
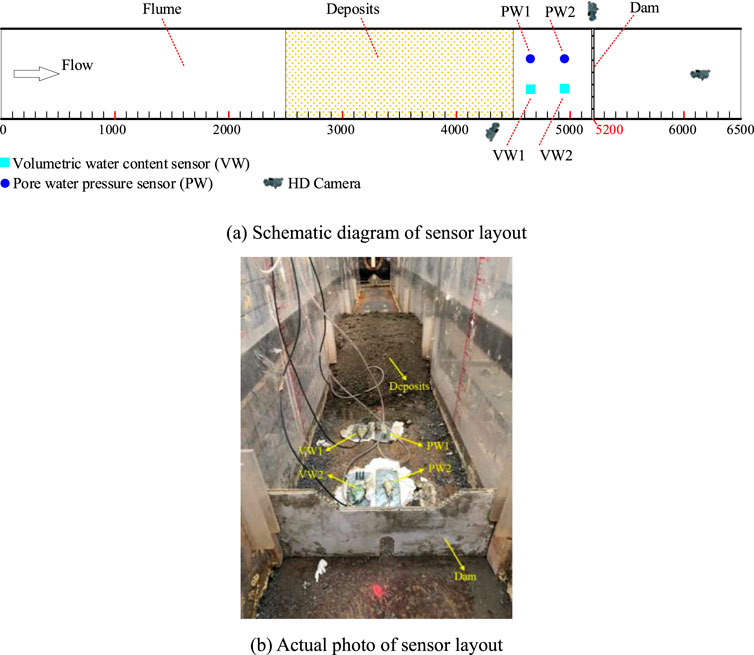
Figure 4. Sensor layout. (A) Schematic diagram of sensor layout. (B) Actual photo of sensor layout.
3.3 Design of check dam
Adjacent check dams are usually far apart in practice, and thus rarely protect one another. Most check dams in a gully operate independently. Therefore, we used a single dam form and changed only the number of drainage holes in the check dam (to change the rate of its opening) to simulate its protective effect to determine the optimal range of its opening rate. Figure 5 shows that we designed five types of dams. The height of each drainage hole was 65 mm, its width was 30 mm, and the radius of the arc was 15 mm. The rates of the opening of Dams I to V were 2.1%, 4.2%, 6.3%, 8.4%, and 10.5%, respectively.
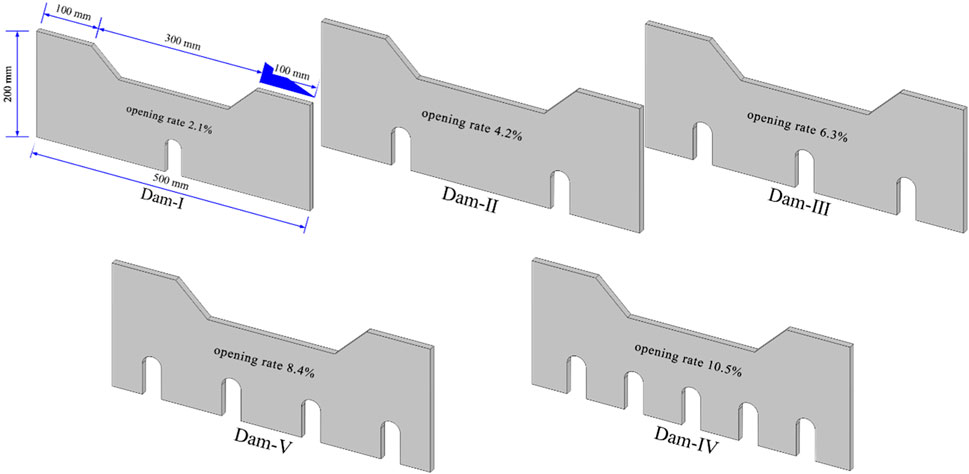
Figure 5. Check dam types.
4 Test phenomena
Figure 6 shows that the interaction between the debris flow formed by loose deposits scoured in the gully channel and the downstream check dam was intense. The debris flow underwent roughly the same three evolutionary stages under different opening ratios: the stages of debris flow through the dam, the growth of debris flow, and the decline in it. We consider dam V as an example, as shown in Figures 6A–E. The first stage involved debris flow through the dam and lasted for 4 s. The debris flow formed by the upstream collapse arrived rapidly at the check dam and flowed through the drainage holes, that is, the flow-through capacity of the drainage holes was adequate to accommodate the debris flow. The second stage involved the growth of the debris flow and lasted for 10–13 s. In this stage, loose materials from upstream continued to join the debris flow. The latter continued to increase in volume, was blocked by the dam, and eventually had a larger volume than the flow-through capacity of the drainage holes of the dam. The water level behind the dam rose continuously, and the peak rate of debris flow was obtained (Figure 6F). Fine particles moved downstream over the spillway with the debris flow while coarse particles accumulated rapidly behind the dam. The third stage featured the decline in debris flow, as shown in Figures 6G–I, and lasted for 46–60 s. As the opening ratio increased, the duration of this stage first increased and then decreased. This stage was the longest for dam III (opening ratio, 6.3%), at 60 s. As the upstream inflow weakened, the content deposited behind the dam tended to stabilize and slowly drained through the drainage holes.
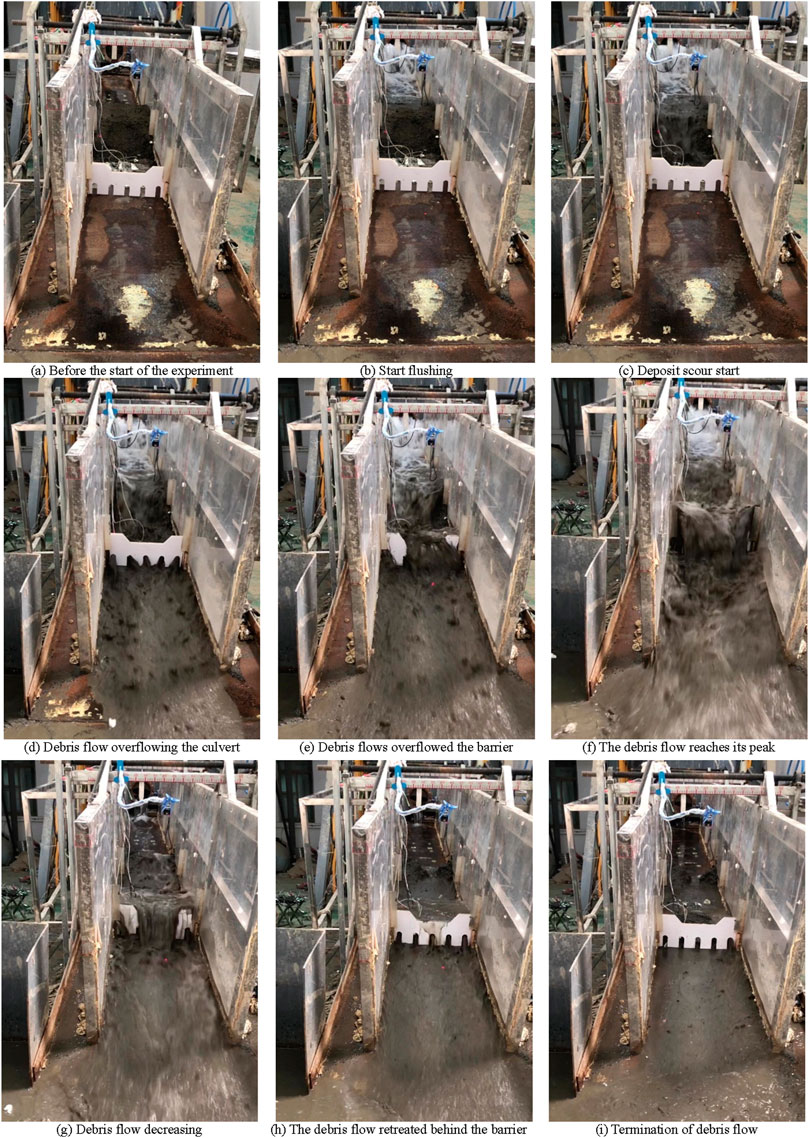
Figure 6. The whole process of the Dam-V test. (A) Before the start of the experiment. (B) Start flushing. (C) Deposit scour start. (D) Debris flow overflowing the culvert. (E) Debris flows overflowed the barrier. (F) The debris flow reaches its peak. (G) Debris flow decreasing. (H) The debris flow retreated behind the barrier. (I) Termination of debris flow.
After the test, we observed solid substances in front of and behind the check dam. Most coarse particles had been intercepted by the check dam to form a body of deposit behind it, while fine particles and sandy slurry had flowed through the dam downstream. This indicates that the check dam was able to separate water from stones in the debris flow and change its material composition. In addition, the morphology of the bodies of deposit behind dams with different opening ratios varied, indicating that the opening ratio of the check dam was an important factor influencing its regulation of debris flow.
5 Experimental results and analysis
To further analyze the interaction between the debris flows and different types of dams, we analyzed changes in the volumetric water content and pore water pressure at different locations behind the dam to indirectly determine the process whereby the check dam regulated the energy of the debris flows. We examined the laws of changes in the quality and particle composition of sedimentary materials behind dams with different opening rates to determine their ability to regulate debris flows.
5.1 Volumetric water content
Figure 7 shows the curve of variations in the volumetric water content at different locations behind the dam under the action of debris flow. It exhibited an overall “single-peak” pattern of variation, that is, it increased rapidly to its maximum value after the formation of debris flow and then decreased rapidly to a relatively stable value. The final volumetric water contents after the stabilization of debris flow for dams I–V were 45.5%, 45.6%, 43%, 32.9%, and 32.9%, respectively, showing an overall trend of a gradual decrease with an increase in the opening rate. When the opening rate was 6.3%, the final volumetric water content did not change.
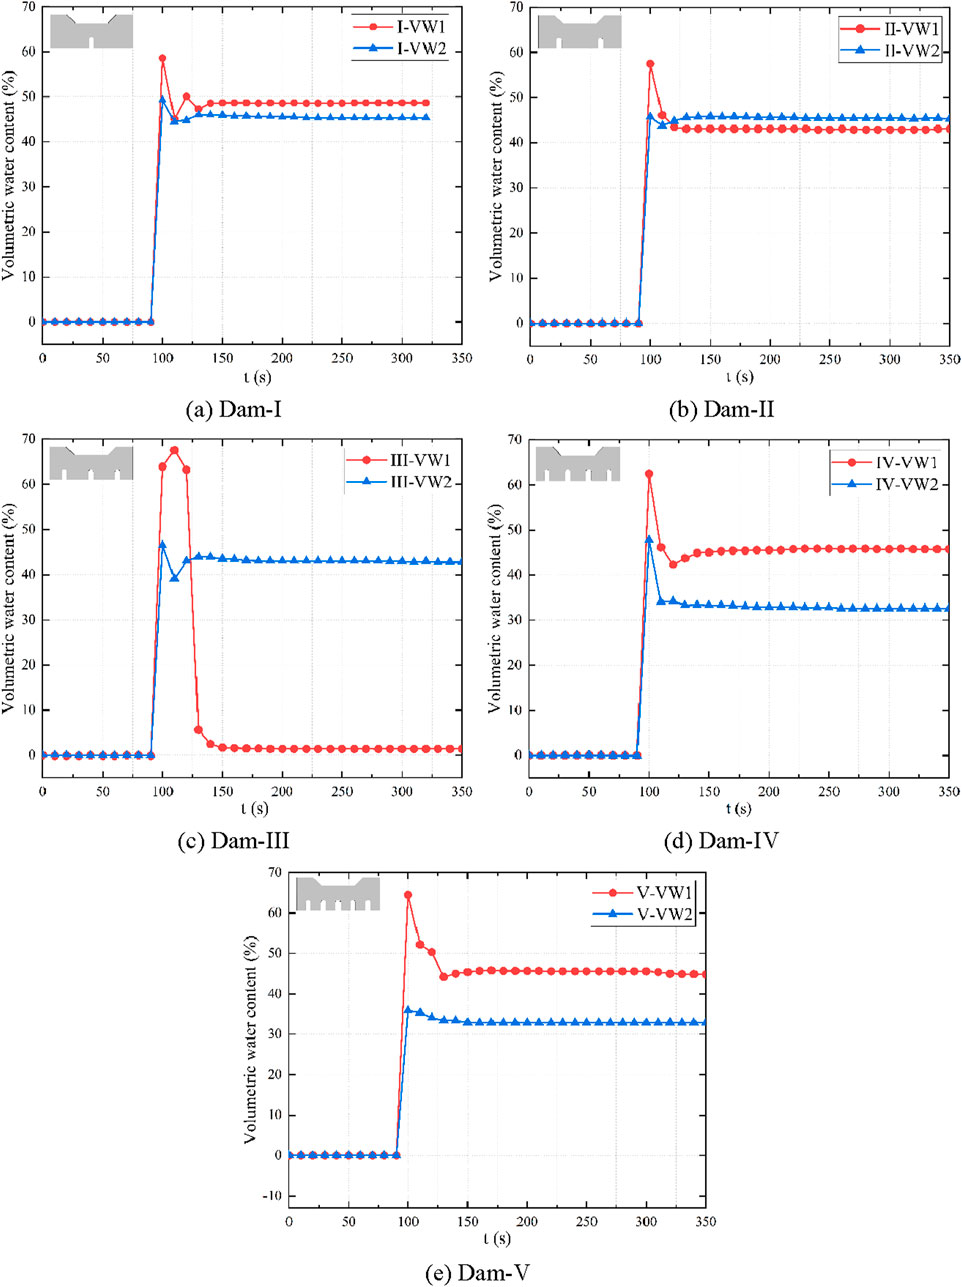
Figure 7. Changes in pore water pressure. (A) Dam-I. (B) Dam-II. (C) Dam-III. (D) Dam-IV. (E) Dam-V.
5.2 Pore water pressure
Figure 8 shows the curves of variations in the pore water pressure over time. They can be divided into three stages: stages of stability, rapid increase, and recession. The curves exhibited an overall “single-peak” pattern. That is, after reaching the peak, the pore water pressure began to decrease slowly and then tended to stabilize. Because location 1 first encountered the debris flow, PW1 generally occurred earlier than PW2. Under the impact of the head of the debris flow, the value of PW1 fluctuated to a greater extent than that of PW2. Because the conditions of the formation of debris flow and the slope of the flume remained constant during the test, the initial energy of the debris flow was fixed. The pore water pressure attained its peak after 43 s for dams I–IV. For dam V, which had a higher permeability than the other dams, the pore water pressure reached its peak after 40 s. The peak values of PW2 for dams I and II were 2.42 kPa and 2.39 kPa, respectively, and the drop in these values was not significant. The peak value of PW2 of dam III dropped sharply to 1.52 kPa, a decrease of 36.4%. The peak values of PW2 of dams IV and V were 1.52 kPa and 1.58 kPa, respectively, nearly identical to that of dam III. This indicates that as the opening rate of the dams increased, the efficiency of debris flow passing through the check dams improved, the effective area of contact between the debris flow and the check dam decreased, and the pore water pressure therefore decreased accordingly. However, the pore water pressure behind the dam did not exhibit a simple trend of decrease. When the opening rate was 6.3%, the pore water pressure did not change significantly, which is similar to the law of change in the volumetric water content.
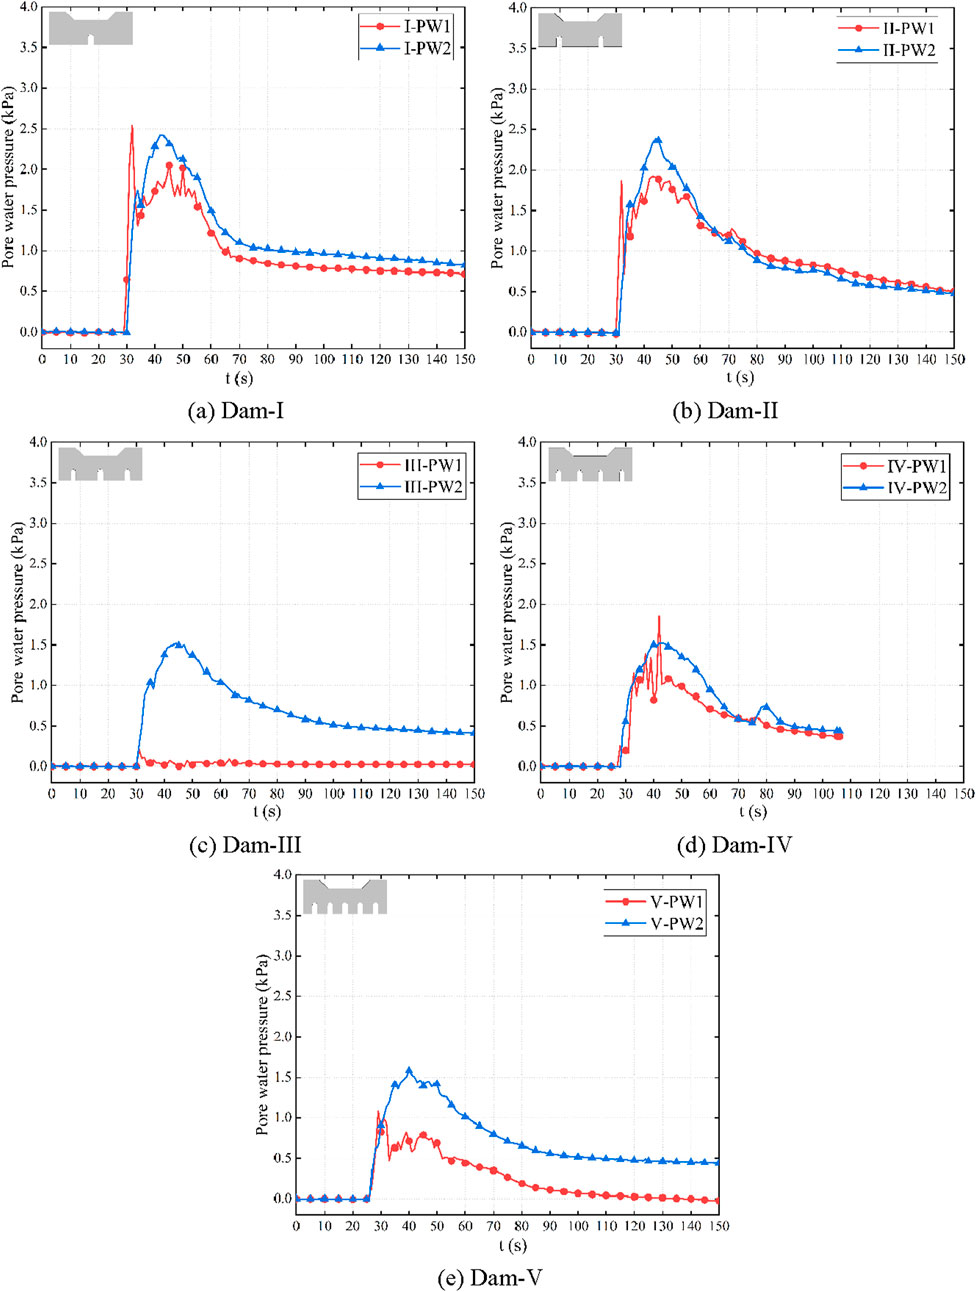
Figure 8. Changes in volume moisture content. (A) Dam-I. (B) Dam-II. (C) Dam-III. (D) Dam-IV. (E) Dam-V.
5.3 Deposit morphology
Once the experiment had been completed and the debris flow in the flume had completely stopped running, we considered the check dam as the x-axis and the gully bed along the longitudinal direction as the y-axis to measure the morphology of the deposits behind the check dam. We used vertical and horizontal spacings of 50 mm to insert a steel ruler into the deposits behind the dam to measure the depth of mud (Figure 9) and used this information to generate a 3D graph of the deposits (Figure 10). It clearly and intuitively showed the morphology of the deposit when debris flows passed through the different types of check dams.
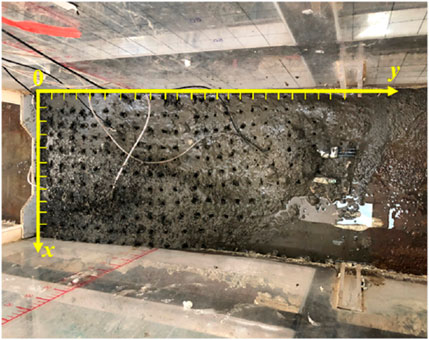
Figure 9. The schematic diagram for measuring the depth of sediment level.
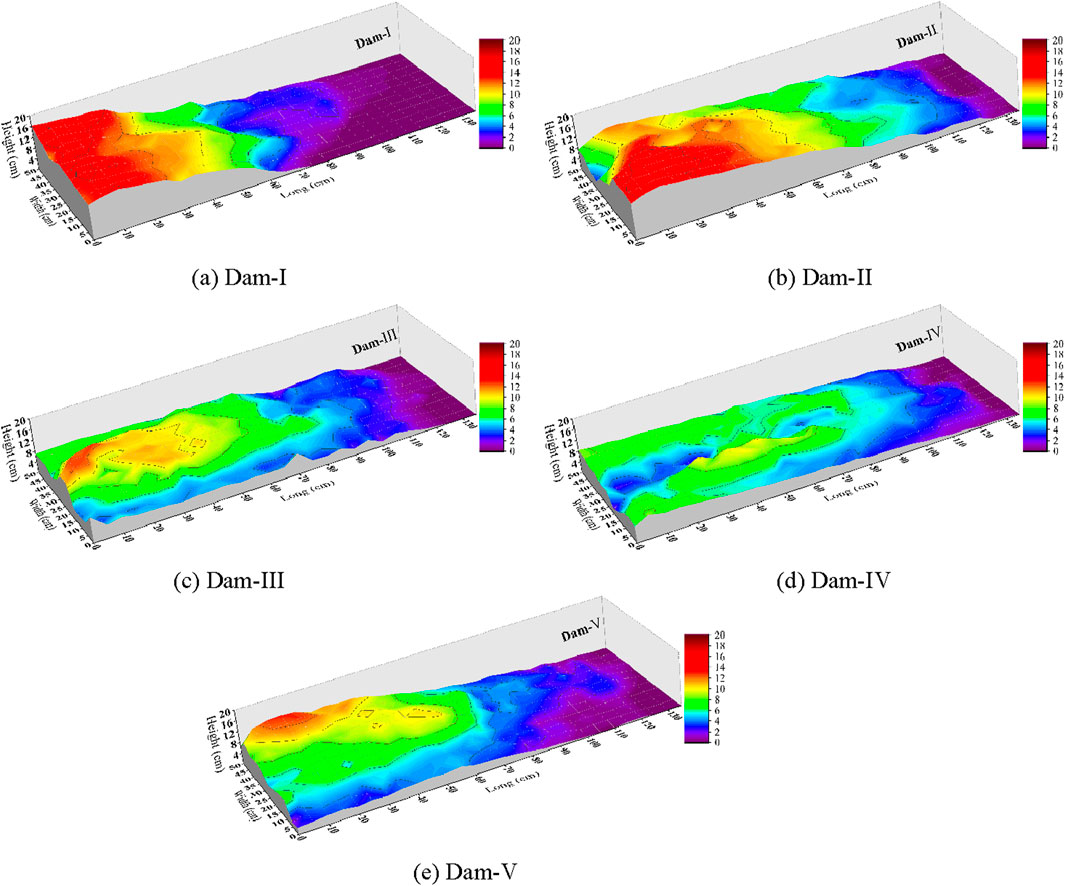
Figure 10. Deposit morphology behind the dam. (A) Dam-I. (B) Dam-II. (C) Dam-III. (D) Dam-IV. (E) Dam-V.
Figure 10 shows that owing to the low porosity of dams I and II, the deposit behind these dams was significantly higher than those behind the other types of dams. The deposit was particularly high within 60 cm behind the dam, with maximum heights of 16.3 cm and 15.7 cm for dams I and II, respectively (Figures 10A, B). The height of the deposit then decreased rapidly. For dams III–V, which had relatively large pores, the morphology of the deposit behind the dam was relatively gentle, with maximum heights of 12.9, 10.3, and 13 cm, respectively. This indicates that when the opening rate of the check dam was 6.3%, the morphology of the deposit behind it tended to be gentle. Continually increasing the opening rate had little effect on the maximum height of the deposit behind the dam.
The volume of the sedimentation body behind the dam is obtained by 2D volume integration of the sedimentation shape surface behind the dam, as shown in Figure 11. The sedimentation volume of Dam-I and Dam-II is close to each other, while the sedimentation volume of Dam-III decreases rapidly and then slowly. When the opening rate is greater than 8%, the sedimentation volume behind the dam remains unchanged, indicating that a good effect of water-sediment separation has been achieved. Further increasing the opening rate has little effect on improving water-sediment separation. But it may affect the structural strength of the dam.
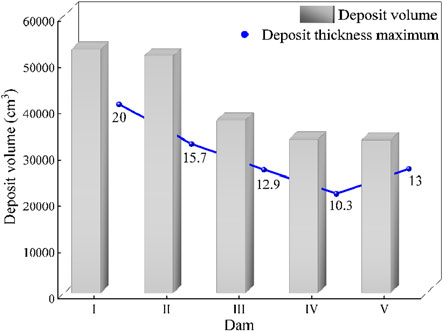
Figure 11. Dry mass of deposits and Changing amplitude.
5.4 Particle size distribution of deposits behind the dam
Retaining the coarse and sluicing the fine is an important function of the check dam. Intercepting large particulate material can reduce the kinetic energy of debris flows and mitigate their destructive power while draining fine particulate material to downstream reduces the burden on the storage capacity of the check dam and improves its efficiency. By comparing and analyzing the particle size distribution of the original soil samples and deposits behind the dam, we quantitatively assessed the effects of the interception of coarse particles and draining of fine particles by the check dam. We dried the original soil samples and deposits behind the dam and then used 500 g of each for a sieve analysis test to obtain the accumulated grading curves of the deposits behind different types of dams, as shown in Figure 12. Compared with those of the original soil samples, the grading curves of samples from different types of dams shifted to the right. That is, the overall particle size became coarser, and this verifies the interception of coarse particles and the draining of fine particles by the check dam.
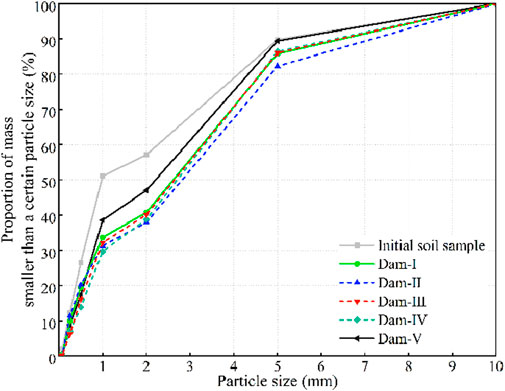
Figure 12. Accumulated grading curve of deposits.
The Lagrange interpolation method was used to determine the median particle diameter d50 of deposits to characterize their degree of coarsening (Cui et al., 2015; Wang et al., 2024), as shown in Table 3. There was no significant linear relationship between the degree of coarsening of the deposits behind the dam and its opening rate. The maximum value of d50 of dam II was 2.82 mm, about 2.9 times that of the initial soil sample, while dam V exhibited a more significant extent of reduction, with its value of d50 decreasing to 2.21 mm. This shows that simply increasing the opening rate of the dam did not maximize its interception of coarse particles. The results showed that there was an optimal interval in this regard. The average value of d50 in the test was 2.60 mm in the range of opening rates of 2.1%–10.5%. These deposits behind the dam were coarser than the initial soil sample by about 2.65 times.

Table 3. Median particle diameter of deposits behind each dam.
In addition, the particle size distribution of the deposits behind the check dams with different opening rates was not the same. To analyze this trend for different types of dams, we plotted curves of the particle size distribution of deposits behind the dams as shown in Figure 13. All the soil samples exhibited a law of bimodal distribution. Under varying opening rate conditions, the particle size distribution of the deposits behind the dam changes from 0.5–1 mm to 2–5 mm, with more than 40% falling in this range. Dam IV had the highest concentration of 48%, followed by Dam III with 46%. Figure 12 shows that the value of d50 of the deposits behind the dam increased when the ratio of particles with sizes in the range of 2–5 mm increased.
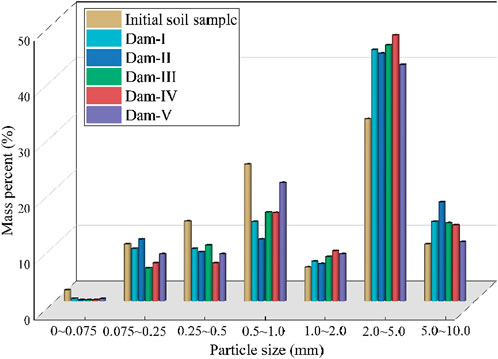
Figure 13. Particle size distribution of deposits.
6 Discussion
The opening ratio is a key measure influencing the regulatory effect of check dams on debris flows (Bai et al., 2014; Liu et al., 2020). It can efficiently change the dynamic water–soil relationship and the composition of solid materials of debris flows, thereby reducing their destructive power on downstream structures and ensuring disaster prevention. We discuss the impacts of check dams with different opening ratios on the energy and material composition of debris flows, and then comprehensively evaluate their regulatory effect.
6.1 Relationship between check dams with different opening ratios and energy of debris flow
The conditions used to trigger debris flow were the same in all our experiments. The slope of all channel beds was 9° and the locations of the check dams were fixed. The results show that it took 2 s for the debris flow to reach the front of the dam, indicating that its initial velocity was the same in each case, i.e., all the debris flows had equal initial energy. As shown in Equation 1, the initial energy was converted into dissipation energy generated during the interaction between the debris flow and the check dam, according to the principle of energy dissipation (Gao et al., 2022), and constituted the final energy that continued to move downstream:
where E0 is the initial energy of the debris flow (J), E′ is the dissipation energy generated during its interaction with the check dam (J), and E1 is the final energy of the debris flow after overflowing past the check dam (J).
Because the initial energy E0 was constant, the energy output by the debris flow downstream was the minimum when the dissipation energy was the maximum, that is, the check dam was able to optimally regulate the energy of the debris flow. We can thus assess the regulatory effects of different check dams by comparing the dissipation energy generated by them. However, due to constraints imposed by different types of debris flow, the shape of the check dam, and the characteristics of the material, no accurate means of measuring the dissipation energy is currently available. Some researchers have defined the ratio of the pore water pressure behind the dam to its normal stress (Hübl et al., 2003; Tian et al., 2017) during the interaction between it and the debris flow as the liquefaction coefficient. This can be indirectly used to characterize the magnitude of the dissipation energy. The liquefaction coefficient is calculated as follows in Equation 2:
where L is the liquefaction coefficient (%); σw is the pore water pressure behind the dam (kPa); σt is the normal stress behind the dam (kPa), ρ0 is the initial density (g/cm3); h is the height of mud behind the dam, and is taken as its maximum accumulated height (cm); g is the gravitational acceleration (m/s2); and θ is the slope of the channel bed, which was set to 9° in this paper.
By comparing the liquefaction coefficients of check dams with different opening ratios, their regulatory effects on the energy of the debris flow can be quantitatively evaluated. The curve of the relationship between check dams with different opening ratios and their liquefaction coefficients is plotted in Figure 14. It is evident from it that the liquefaction coefficient of Dam II was the highest, 91.6%. That is, the interaction between this check dam and the internal debris flow was the most intense, generated the maximum dissipation energy and had the best effect in terms of energy dissipation on the debris flow. This may also be why the quality of the body of deposit behind dam II was the highest and its particles were the coarsest: A large number of solid particles in the debris flow collided and rubbed behind the dam, and finally the energy was completely dissipated causing the deposit to tend towards stillness. Following this, as the opening ratio increased, the liquefaction coefficient decreased rapidly, the effect of dissipation in the energy of the debris flow due to the check dam weakened, the debris flow developed better penetrability, and thus the maximum height of deposition behind the dam decreased significantly compared with that in case of dam II (Figure 10).
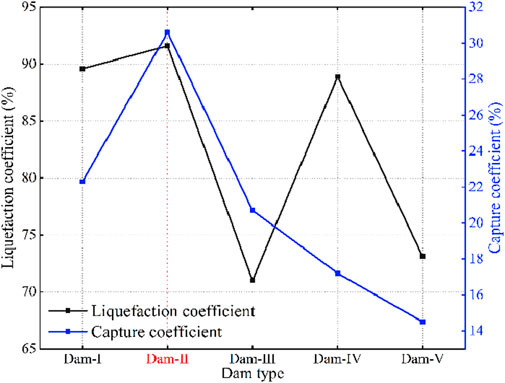
Figure 14. Liquefaction coefficient and capture coefficient.
6.2 Relationship between check dams with different opening ratios and their regulatory effect on solid material in debris flow
A core function of check dams is to retain solids in the debris flow. The capture coefficient is commonly used to quantitatively evaluate their effects on solids in the debris flow (Hübl et al., 2003):
where T is the capture coefficient (%), M0 is the total mass of solid matter in the debris flow (kg), and Mi is the mass of solid matter in the debris flow that is retained by the check dam (kg).
In our experiments, the body of the deposit in the flume was scoured and entrained into the debris flow by the incoming water. Some of the solid matter was transported downstream over the check dam along with the debris flow, while the remainder was captured by the check dam to form the deposit behind it. Therefore, the capture coefficient under different conditions of the dam was calculated by using Equation 3, and the curve of the relationship between the capture coefficient and the opening ratio of the dam was plotted, as shown in Figure 14. It shows that the curve exhibited an overall “single-peak” trend of change. The capture coefficient was the maximum at 30.6% for dam II, in which case the effect of retaining solid materials was the best. Subsequently, the capture coefficient continued to decrease as the opening ratio increased.
6.3 Overall evaluation of regulatory effects of debris flow by check dams with different opening ratios
The regulatory effects of check dams on debris flows are mainly related to two aspects: regulating energy and solid matter (Lin et al., 2017). Moreover, the safety of check dams is also an indispensable factor in prolonging their service life (De Haas et al., 2015). A balance must be achieved between reducing the energy of debris flow and the removal of solid matter from it, and the safety of the dam during the construction of check dams (Chen et al., 2015). Figure 14 shows that better results were obtained when the coefficient of capture of the check dam was greater than its liquefaction coefficient. Because the benefits brought about by such retention could compensate for some of the damage to the check dam caused by the impact of debris flows, it is suitable to set an opening ratio in the range of 4.2%–6.3%, as shown in Figure 14. At the same time, the opening ratio of check dams should be reasonably selected according to the specific conditions of debris flow on-site.
For example, if local debris flows have a high frequency of occurrence and there is a large number of loose deposits in the ditch, dam II (opening ratio, 4.2%) is the most appropriate choice for regulating the energy and materials of debris flows. But this imposes stringent requirements on the strength of the dam, the service life of which can be extended by building groups of check dams. If local debris flows have a low frequency of occurrence, dam III (opening ratio, 6.3%) is the best choice. While ensuring minor damage to the dam itself such that it has a longer service life, this choice can help retain solids from the debris flow.
7 Conclusion
In this paper, five check dams with different opening ratios (ranging from 2.1% to 10.4%) were designed and tested based on field investigation data. Changes law of volumetric water content, pore water pressure, deposit morphology, and particle size distribution were analyzed to explore the control effect of check dams on the debris flow from the perspective of matter and energy. The following conclusions can be drawn:
(1) As the opening ratio of the check dam increased, the volumetric water content and peak pore water pressure of the body of deposits behind the dam exhibited a trend of first decreasing and then stabilizing. When the opening ratio increased to 6.3%, the parameters of the soil and water reached stable values, indicating that further increasing the opening ratio had little influence on the parameters of debris flow.
(2) Check dams with different opening ratios all had a good effect in terms of retaining the coarse and sluicing the fine. The average particle size of the deposits behind the dam was coarsened by 2.65 times, mainly by increasing the ratio of particles in the range of sizes of 2–5 mm. Of the five types of dams considered, dam II (opening ratio, 4.2%) yielded the maximum degree of coarsening.
(3) The range of opening ratios of 4.2%–6.3% was the optimum interval for controlling debris flow. Dam II (opening ratio, 4.2%) yielded the best control effects in terms of both the energy and the material of the debris flow.
Many factors influence the layout of openings in check dams. Quantitative parameters such as the slopes of different channels, maximum particle size, and unit weight of debris flow materials should be considered in future research to further refine the open holes in check dams and enhance their performance. Opening discharge culverts are also weak points in the design of check dams that can lead to their failure (Chen et al., 2017). Therefore, researchers should also consider protecting the open holes in check dams. Their shape can be optimized to this end, and flexible materials should be used in their manufacture to minimize the damage sustained by check dams due to impact with debris flow.
Data availability statement
The original contributions presented in the study are included in the article/supplementary material, further inquiries can be directed to the corresponding author.
Author contributions
JH: Writing–original draft, Writing–review and editing. XL: Funding acquisition, Writing–original draft, Writing–review and editing. ZZ: Methodology, Writing–review and editing. JZ: Resources, Writing–review and editing. YM: Formal Analysis, Writing–review and editing. QL: Methodology, Writing–review and editing. YW: Methodology, Writing–review and editing. YA: Writing–review and editing, Supervision, Validation, Investigation.
Funding
The author(s) declare that financial support was received for the research, authorship, and/or publication of this article. This research was financially supported by the Second Tibetan Plateau Scientific Expedition and Research Program (2019QZKK0902), Major Science and Technology Project of Gansu Province (23ZDFA009); Gansu Academy of Sciences Key Research and Development Project (2023ZDYF-03), and Major Special Project of Gansu Academy of Sciences (2024ZDZX-02).
Conflict of interest
The authors declare that the research was conducted in the absence of any commercial or financial relationships that could be construed as a potential conflict of interest.
Publisher’s note
All claims expressed in this article are solely those of the authors and do not necessarily represent those of their affiliated organizations, or those of the publisher, the editors and the reviewers. Any product that may be evaluated in this article, or claim that may be made by its manufacturer, is not guaranteed or endorsed by the publisher.
References
Armanini, A., Dellagiacoma, F., and Ferrari, L. (2005). “From the check dam to the development of functional check dams,” in Fluvial hydraulics of mountain regions (Berlin, Heidelberg: Springer Berlin Heidelberg), 331–344.
Bai, S. B., Wang, J., Thiebes, B., Cheng, C., and Chang, Z. Y. (2014). Susceptibility assessments of the Wenchuan earthquake-triggered landslides in Longnan using logistic regression. Environ. earth Sci. 71 (2), 731–743. doi:10.1007/s12665-013-2475-z
Chen, J., Chen, X., Zhao, W., Yu, X., and Wang, X. (2017). Experimental study on the characteristics of a debris-flow drainage channel with an energy dissipation structure. Bull. Eng. Geol. Environ. 76, 341–351. doi:10.1007/s10064-016-0860-z
Chen, X., Cui, P., You, Y., and Chen, J. (2015). Engineering measures for debris flow hazard mitigation in the Wenchuan earthquake area. Eng. Geol. 194, 73–85. doi:10.1016/j.enggeo.2014.10.002
Choi, S. K., Lee, J. M., and Kwon, T. H. (2018). Effect of slit-type barrier on characteristics of water-dominant debris flows: small-scale physical modeling. Landslides 15 (1), 111–122. doi:10.1007/s10346-017-0853-4
Cui, P. (1999). Impact of debris flow on river cannel in the upper reaches of the Yangtse river. Intern. J. Sediment Res. 14, 201–203.
Cui, P., Zeng, C., and Lei, Y. (2015). Experimental analysis on the impact force of viscous debris flow. Earth Surf. Process. Landforms 40 (12), 1644–1655. doi:10.1002/esp.3744
De Haas, T., Braat, L., Leuven, J. R. F. W., Lokhorst, I. R., and Kleinhans, M. G. (2015). Effects of debris flow composition on runout, depositional mechanisms, and deposit morphology in laboratory experiments. J. Geophys. Res. Earth Surf. 120 (9), 1949–1972. doi:10.1002/2015jf003525
Deng, Z., Liu, J., Guo, L., Li, J., Li, J., and Jia, Y. (2021). Pure risk premium rating of debris flows based on a dynamic run-out model: a case study in Anzhou, China. Nat. Hazards 106, 235–253. doi:10.1007/s11069-020-04459-x
Di, B. F., Chen, N. S., Cui, P., Li, Z., He, Y., and Gao, Y. (2008). GIS-based risk analysis of debris flow: an application in Sichuan, southwest China. Int. J. Sediment Res. 23 (2), 138–148. doi:10.1016/s1001-6279(08)60013-x
Dong, Y. G., Liu, X. R., Feng, L. T., Wang, X. H., and Zhang, L. J. (2022). Regulation performance of debris flow blocking dam's drainage culvert based on flume tests. Sci. Technol. Eng. 22 (05), 1794–1802. (in Chinese).
Fei, X. J., and Shu, A. P. (2006). Debris flow kinematic mechanism and disaster prevention. Beijing: Tsinghua University Press. (in Chinese).
Gao, J., Shi, X., Li, L., Zhou, Z., and Wang, J. (2022). Assessment of landslide susceptibility using different machine learning methods in longnan city, China. Sustainability 14 (24), 16716. doi:10.3390/su142416716
Hu, H., Zhou, G. G., Song, D., Cui, K. F. E., Huang, Y., Choi, C. E., et al. (2020). Effect of slit size on the impact load against debris-flow mitigation dams. Eng. Geol. 274, 105764. doi:10.1016/j.enggeo.2020.105764
Hübl, J., Holzinger, G., and Wehrmann, H. (2003). Entwicklung von Grundlagen zurDimensionierung kronenoffener Bauwerke für die Geschiebebewirtschaftung in Wildbächen. Band 2, 29–57.
Hübl, J., Suda, J., Proske, D., Kaitna, R., and Scheidl, C. (2009). “Debris flow impact estimation,” in Proceedings of the 11th international symposium on water management and hydraulic engineering (Ohrid, Macedonia: University od Ss Cyril and Methodius, Faculty of Civil Engineering, Skopje, Macedonia), 1, 1–5.
Iverson, R. M., Logan, M., LaHusen, R. G., and Berti, M. (2010). The perfect debris flow Aggregated results from 28 large-scale experiments. J. Geophys. Res. Earth Surf. 115 (F3). doi:10.1029/2009jf001514
Jeong, S., and Lee, K. (2019). Analysis of the impact force of debris flows on a check dam by using a coupled Eulerian-Lagrangian (CEL) method. Comput. Geotechnics 116, 103214. doi:10.1016/j.compgeo.2019.103214
Jia, S., Cui, P., Chen, X., Huang, K., and Li, Q. (2011). Experimental study on regulating performance of debris flow check and transport by sand bar. Chin. J. Rock Mech. Eng. 30 (11), 2338–2345. (in Chinese).
Lin, X., Huo, M., Zhou, J. W., Cao, T., Yang, F. R., and Zhou, H. W. (2017). An experimental study on controlling post-earthquake debris flows using slit dams. Environ. Earth Sci. 76 (22), 780. doi:10.1007/s12665-017-7140-5
Liu, X. R., Zhou, Z. Q., Dong, Y. G., Wu, W. J., and Wei, W. H. (2020). Analysis of damage to debris flow check dams and optimization strategies—a case study of wudu district, longnan city. J. Mt. Sci. 38 (03), 473–482. doi:10.16089/j.cnki.1008-2786.000526
Rossi, G., and Armanini, A. (2019). Impact force of a surge of water and sediments mixtures against slit check dams. Sci. Total Environ. 683, 351–359. doi:10.1016/j.scitotenv.2019.05.124
Ruan, H., Chen, H., Li, Y., and Chen, J. (2021). Study on the downcutting rate of a debris flow dam based on grain-size distribution. Geomorphology 391, 107891. doi:10.1016/j.geomorph.2021.107891
Shima, J., Moriyama, H., Kokuryo, H., Ishikawa, N., and Mizuyama, T. (2016). Prevention and mitigation of debris flow hazards by using steel open-type sabo dams. Int. J. Eros. Control Eng. 9 (3), 135–144. doi:10.13101/ijece.9.135
Sun, H., You, Y., Liu, J., Zhang, G., Feng, T., and Wang, D. (2021). Experimental study on discharge process regulation to debris flow with open-type check dams. Landslides 18, 967–978. doi:10.1007/s10346-020-01535-y
Takahashi, T. (2007). Debris flow: mechanics, prediction and countermeasures. London, United Kingdom: Taylor and Francis. doi:10.1201/9780203946282
Tian, F., Zhang, J., Ran, Y. H., Liu, J., and Liu, S. (2017). Assessment of debris flow disaster hazard and influence factors in Longnan district. J. Catastrophol 32, 197–203.
Wang, B., Zhao, Z. H., Huang, X., Gu, G., Du, X. h., and Yang, Y. (2024). Developmental characteristics of loess mudflow and correlation analysis with influencing factors. Front. Earth Sci. 12, 1373126. doi:10.3389/feart.2024.1373126
Wang, X., and Huang, Z. (2013). Dynamic response analysis of debris flow retaining dam under impact load. Chin. J. Geol. Hazards Control 24 (04), 61–65. (in Chinese).
Wei, Y., Qiu, H., Liu, Z., Huangfu, W., Zhu, Y., Liu, Y., et al. (2024). Refined and dynamic susceptibility assessment of landslides using InSAR and machine learning models. Geosci. Front. 15 (6), 101890. doi:10.1016/j.gsf.2024.101890
Wendeler, C., and Volkwein, A. (2015). Laboratory tests for the optimization of mesh size for flexible debris-flow barriers. Nat. Hazards and Earth Syst. Sci. 15 (12), 2597–2604. doi:10.5194/nhess-15-2597-2015
Xie, X. P., Wei, F. Q., Wang, X. J., and Yang, H. J. (2019). Regulation effect of herringbone water-sediment separation structure on the substance and energy properties of debris flow. Adv. Eng. Sci. 51 (5), 49–59. (in Chinese).
Yu, X., Chen, X., Zhao, W., Chen, J. G., and Li, Y. (2016). Study on the influence of discharge hole opening parameters on the stress field of dam body. J. Disaster Prev. Reduct. Eng. 36 (06), 1015–1025. (in Chinese).
Zhou, W., Liu, J., You, Y., Sun, H., and Jiao, L. (2020). Experimental investigation of blocking and discharge regulation function of window-frame dam in viscous debris flow control. Geomatics, Nat. Hazards Risk 11 (1), 1505–1527. doi:10.1080/19475705.2020.1803995
Zhou, W., Qiu, H., Wang, L., Pei, Y., Tang, B., Ma, S., et al. (2022). Combining rainfall-induced shallow landslides and subsequent debris flows for hazard chain prediction. CATENA 213, 106199. doi:10.1016/j.catena.2022.106199
Keywords: debris flow, check dam, opening rate, soil and water parameters, control effect
Citation: Huang J, Liu X, Zhang Z, Zhang J, Ma Y, Li Q, Wang Y and An Y (2024) Experimental investigation into effects of material and energy regulation of debris flow by using check dams with different porosities. Front. Earth Sci. 12:1499995. doi: 10.3389/feart.2024.1499995
Received: 22 September 2024; Accepted: 15 November 2024;
Published: 09 December 2024.
Edited by:
Haijun Qiu, Northwest University, ChinaReviewed by:
Yue Xiao Ying, Chinese Academy of Sciences, ChinaHeping Shu, Gansu Agricultural University, China
Copyright © 2024 Huang, Liu, Zhang, Zhang, Ma, Li, Wang and An. This is an open-access article distributed under the terms of the Creative Commons Attribution License (CC BY). The use, distribution or reproduction in other forums is permitted, provided the original author(s) and the copyright owner(s) are credited and that the original publication in this journal is cited, in accordance with accepted academic practice. No use, distribution or reproduction is permitted which does not comply with these terms.
*Correspondence: Liu Xingrong, bGl1eGluZ3JvbmcyMDI0QDE2My5jb20=