 Guanghui Jiang
 Jintao Wang1
 Jinhao Wen
 Xingzong Liu
- 1School of Hydraulic and Civil Engineering, Ludong University, Yantai, China
- 2School of Civil Engineering, Qingdao University of Technology, Qingdao, China
- 3Shandong Engineering Research Center for Mine Gas Disaster Prevention and Control, The First Exploration Team of Shandong Coalfield Geologic Bureau, Qingdao, China
- 4Institute of Construction Engineering Technology, Changzhou Vocational Institute of Engineering, Changzhou, Jiangsu, China
- 5Wuxi RL Precision Machinery Co., Ltd., Wuxi, China
- 6School of Law, Central University of Finance and Economics, Beijing, China
The stability of the surrounding rock under high temperature is pivotal to the efficient and safe production of high-temperature fluidized mining engineering. To investigate the stability of rocks under high temperature, this paper takes the roof sandstone of Tongxin coal mine, examining changes in its physical parameters such as mass, dimensions, wave velocity, porosity, and permeability after treatment at various temperatures (20–700°C). The results showed that parameters like mass and wave velocity decreased with increasing temperature, while dimensions, porosity, fracture density, and permeability increased. The patterns of change in these physical properties with temperature exhibit a high degree of consistency. Additionally, composition analysis and thermal analysis were conducted to understand the physical and chemical changes occurred in sandstone. Scanning electron microscopy was used to observe microstructural changes in the sandstone. After analysis, the evolution of the internal structure of Tongxin sandstone with heat treatment is categorized into three stages. (1) stable change Stage (20–450°C, 650–700°C): Dominated by dehydration and thermal stress, where pore and fracture structures develop slowly; (2) rapid change stage (450–550°C, 600–650°C): Dominated by the kaolinite dehydroxylation, leading to increased porosity but decreased average pore size; (3) intense change stage (550–600°C): Dominated by the quartz phase transitions, where the thermal stress generated by quartz phase transitions causes dramatic alterations in the internal structure of the sandstone. Furthermore, a correlation model between wave velocity and permeability of sandstone at high temperatures was established based on the interrelationship of these physical properties, providing a new method for real-time monitoring of permeability under high-temperature conditions.
1 Introduction
In recent years, efforts to overcome technical challenges posed by traditional mining methods for solid mineral resources have led to the continuous development of in situ modification mining technology. The stability of surrounding rocks under high temperature in mining technologies, such as underground coal gasification and in situ oil shale mining, is crucial for efficient and safe production (Bhutto et al., 2013; Kang et al., 2020). Moreover, deep geological disposal techniques for high-level radioactive waste require extremely high stability from the surrounding rocks under high temperature (Wang et al., 2018). Therefore, it is crucial to study the evolution of the internal structure and various physical-mechanical properties of rocks under the influence of high temperatures.
In recent years, the mechanical behavior of sandstone under high-temperature conditions has been the subject of extensive scholarly investigation. A subset of researchers has concentrated on the temperature-dependent variations in the physical properties of sandstone, including mass, density, porosity, permeability, and P-wave velocity (Tian et al., 2012; Liu and Xu, 2015; Jiang et al., 2021). Their studies indicate that with increasing temperature, there is a reduction in mass, density, and P-wave velocity, whereas porosity and permeability exhibit an increase. Furthermore, the thermal physical properties of sandstone, such as specific heat capacity, thermal conductivity, thermal expansion coefficient, and thermal diffusivity, have also been explored, contributing to a deeper understanding of sandstone’s behavior under thermal stress (Sun et al., 2016; Dong et al., 2022). Further investigations have been conducted by other scholars into the mechanical properties of sandstone with temperature. Lu et al. determined that high temperatures reduce the tensile strength of sandstone, and discovered a similar trend between tensile strength and longitudinal wave speed with temperature (Lu et al., 2017). Li et al. focused on the dynamic mechanical properties of coal-bearing sandstone, determining 500°C as the critical threshold temperature for these properties, a phenomenon attributed to the thermal decomposition of kaolinite (Li et al., 2016; Li et al., 2017). Jin et al. examined the variations in mechanical properties such as elastic modulus, Poisson’s ratio, internal friction angle, cohesion, uniaxial compressive strength, and peak strength strain with temperature (Jin et al., 2024). Current research demonstrates that the rate of change in the physical and mechanical properties of sandstone varies markedly across different temperature stages. This variation is attributed to the distinct factors influencing the rock’s internal structure at each stage. Jing et al. and Zhang et al. identified moisture loss, thermal expansion of mineral grains, mineral decomposition, and dehydrogenation reactions as the primary factors affecting the internal structure and physical-mechanical properties of sandstone under thermal conditions (Zhang et al., 2016; Jing et al., 2021). Zheng et al. and Chen et al. investigated the effects of heating rates, revealing that rapid heating induces thermal stress due to temperature gradients, which significantly impacts the internal structural changes of the rock (Chen et al., 2017; Zheng et al., 2024).
Furthermore, advanced techniques such as Scanning Electron Microscopy (SEM), Computed Tomography (CT), and Nuclear Magnetic Resonance (NMR) have been extensively utilized in the field of high-temperature rock mechanics (Wu et al., 2020; Xiao et al., 2021; Wu et al., 2022; Zhang W. Q. et al., 2022; Wu et al., 2024; Xiao et al., 2024; Zhang et al., 2024). These methodologies facilitate a more intuitive and detailed observation of the surface and internal structural evolution of rocks subjected to heating, further revealing the evolution mechanism of the internal structure of rocks after heating.
In addition, there are many studies on the laws of the influence of temperature on the physical properties of other rocks such as granite, and these studies have all found that different rocks have threshold temperatures for physical property mutations (Zhang et al., 2016; Chen et al., 2017; Fan et al., 2017; Yang et al., 2017; Zhao et al., 2017a; Zhao et al., 2017b; Shang et al., 2019; Zhang Y. et al., 2022).
However, existing research on the effects of high temperatures on rocks primarily focuses on the changes in individual physical and mechanical properties. These studies often overlook the interrelationships between different properties and the relationship between these properties and their internal structure. The analysis of the evolution patterns and mechanisms of rock internal structures under high-temperature conditions remains insufficiently thorough and comprehensive. This study focuses on the roof sandstone of the Tongxin Coal Mine, measuring physical properties such as mass, dimensions, wave velocity, porosity, and permeability after exposure to various temperatures. By conducting a comprehensive analysis that integrates pyrolysis results and SEM observations, and by cross-validating these findings with changes in physical properties, this study provides more detailed insights into the evolution of sandstone’s internal structure with temperature. This study develops a model based on the correlation between various physical properties of sandstone and their relationship with its internal structure. The model directly links wave velocity to permeability. It enables real-time monitoring of permeability, which is typically challenging to measure, under high-temperature conditions through more easily obtainable wave velocity measurements. The research results offer a new method for analysing and monitoring the stability of surrounding rock in in situ high-temperature fluidized mining and other engineering projects.
2 Experimental materials and methods
2.1 Experimental materials
Coarse sandstone samples used in this research were sourced from the coal roof of the Tongxin Coal Mine in Datong, Shanxi. The samples, predominantly quartz, exhibited interlaced bedding and porous cementation. Quartz grain size varied between 0.1 mm and 1 mm, with a mean size of 0.5 mm. Prior to thermal treatment, the samples demonstrated a bulk density of 2.47 g/cm3, a porosity of 5.85%, a permeability of approximately 0.63 mD, and a longitudinal wave speed of around 4.83 km/s.
The content and linear expansion coefficient of various minerals in sandstone are detailed in Table 1.
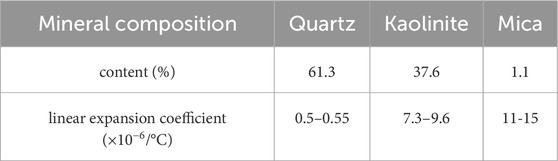
Table 1. The content and linear expansion coefficient of various component in sandstone.
2.2 Experimental equipment and procedure
This study undertook thermal analysis of the sandstone sample, measured several physical properties such as size, wave velocity, porosity and permeability, and carried out SEM microscopic observations. All experimental apparatuses are showed in Figure 1.

Figure 1. Tongxin sandstone specimens and all testing equipments.
Physical properties such as size, wave speed, and permeability were measured on the same cylindrical specimens (φ50*100) following thermal treatment at varying temperatures, thereby reducing data dispersion. Three cylindrical specimens were used. Thermal analysis was conducted using powdered samples, while porosity was measured with block samples, and SEM observations were made with square samples measuring 25*20*5.
Xi et al. discovered that during repeated heating of granite, acoustic emissions are minimal when the temperature is below the previous maximum heating temperature. However, when the temperature exceeds the previous maximum, acoustic emissions increase significantly (Xi et al., 1996). This phenomenon is known as the thermal Kaiser effect and has also been observed in other rock (Zuberek et al., 1998; Daoud et al., 2020). This indicates that in the process of cyclic heating of rocks, new cracks only form when the temperature surpasses the previous maximum.
Further research by Griffiths et al. found that although acoustic emissions occur during both heating and cooling phases of a heating-cooling cycle, thermal crack damage only occurs during heating. The acoustic emissions during cooling are mainly due to particle sliding and rearrangement, meaning that almost no new cracks form during cooling (Griffiths et al., 2018).
Based on these studies, it can be concluded that cyclic heating has a minimal impact on the internal structure of rocks. Therefore, this paper employs an experimental scheme of repeatedly heating the same batch of samples. This approach avoids the variability in experimental results due to sample differences and alleviates concerns about the impact of cyclic heating on the rocks.
To avoid interference between the measurement of different physical properties, the experimental process was designed as follows.
2.2.1 Size measurement
Size determination was performed using a micrometer with a precision of 0.001 mm, in conjunction with a comparator. Each specimen was measured at three distinct heights, approximately 120° apart, with the mean value taken. The diameter was measured at the top, middle, and bottom, with two vertical measurements taken at each point, resulting in a total of six measurements. The mean of these measurements was taken. High-temperature markers were utilized to denote measurement points, ensuring consistency in location and minimizing comparative errors.
2.2.2 Permeability measurement
Permeability was measured using the stable method, employing a custom-made CPPD-1 permeameter. Helium served as the permeating medium, with a confining pressure of 5 MPa and a permeability pressure difference of 1 MPa.
2.2.3 Wave speed measurement
The ZBL-U520 ultrasonic tester, designed for non-metals, was used to measure the ultrasonic wave speed of the sandstone. Axial Measurement: The wave velocity for each specimen was recorded five times to compute the average value. Circumferential Measurement: The wave velocity for each specimen was gauged at 10-degree intervals in a clockwise direction from the reference point, with the average value determined after five recordings.
2.2.4 Heat treatment
The X2.5-10 muffle furnace was used to heat the samples.
If the temperature increases too rapidly, the resulting temperature gradient can cause thermal stress, leading to crack formation. Some researchers have suggested that when heating sandstone and granite, maintaining a heating rate below 5°C/min can prevent thermal shock (Chen et al., 2017; Fan et al., 2017). By summarizing the heat treatment parameters from the references cited in this paper (see Table 2), it is observed that most existing studies use a heating rate below 10°C/min and maintain a holding time of at least 2 h. Therefore, this study adopts a heating rate of 5°C/min and a holding time of 4 h for the heat treatment process. Then naturally cool to room temperature.
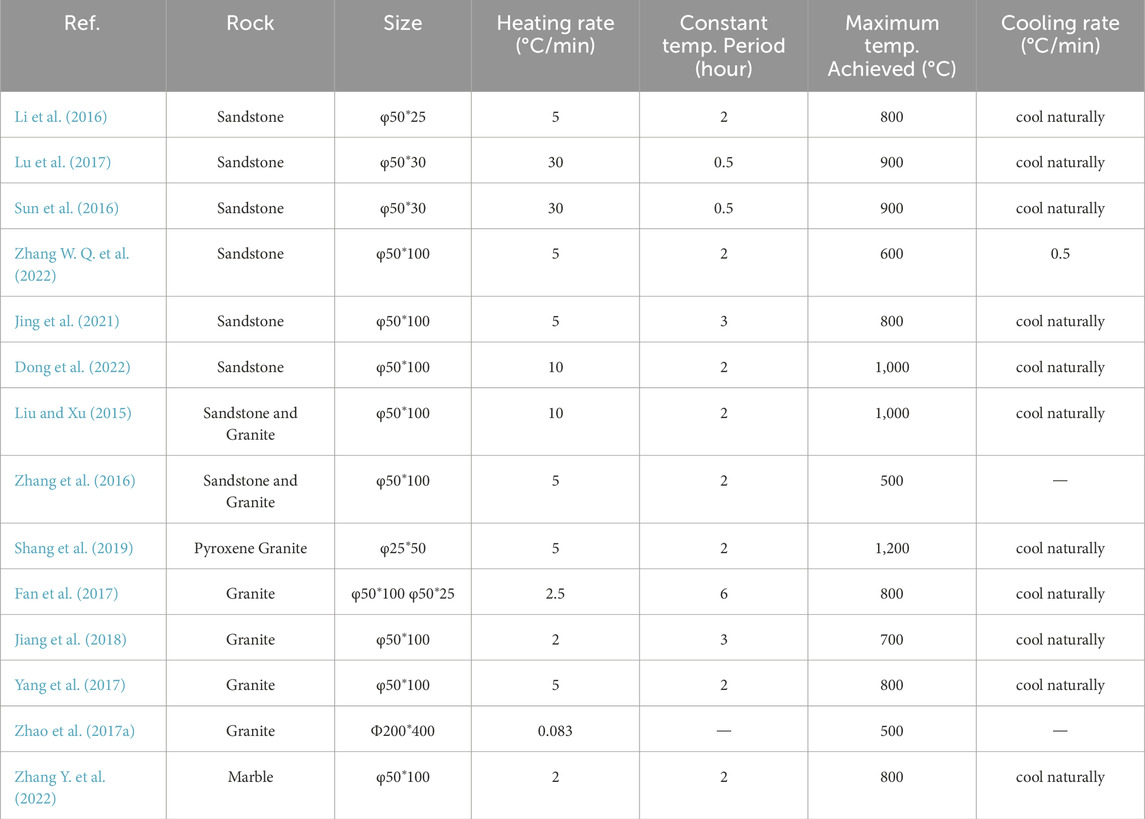
Table 2. Testing parameters of thermal treatment.
Steps (1) through (4) were repeated, with the heat treatment temperature ranging from 50°C to 700°C, at 50°C intervals (50, 100, 150, 200, 700°C), across a total of 14 groups.
2.2.5 Thermal analysis
Thermal analysis was conducted using the German Netzsch STA449C synchronous thermal analyzer, with a temperature range of 30°C–700°C, a heating rate of 10°C/min, and a nitrogen atmosphere.
2.2.6 Porosity measurement
Porosity was measured using the mercury intrusion method, employing the AutoPore Iv 9510 mercury intrusion porosimeter. The test pressure range spanned 0.5–33,000 psi. The heat treatment of the samples followed step (4).
2.2.7 Microstructure observation
The Shimadzu SEM digital hydraulic high-temperature fatigue testing system was used for microstructure observation. Specimen placement during each test was kept consistent to facilitate comparative observation of the same location pre and post-heat treatment. The heat treatment of the samples followed step (4).
3 Thermal analysis and pyrolysis process analysis of Tongxin sandstone
Figure 2 illustrates the thermal analysis curve of Tongxin sandstone, encompassing Thermogravimetric Analysis (TG), Differential Thermogravimetric Analysis (DTG), and Differential Scanning Calorimetry (DSC) curves. The figure reveals that the mass of Tongxin sandstone decreased with the increase of temperature. The thermal analysis curve for the sandstone can be distinctly segmented into three stages:
Stage 1 (50–450°C): The sandstone mass exhibits a slow rate of change in relation to temperature, with a decrease of 0.5%, representing 10% of the total mass loss throughout the heating procedure. The DTG value is nearly zero during this stage.
Stage 2 (450–650°C): The sandstone mass experiences a rapid decline, with a decrease of 3.43%, representing 70% of the total mass loss throughout the heating procedure.
Stage 3 (650–700°C): The rate of sandstone mass decrease decelerates, with a decrease of 1.39%, representing 20% of the total mass loss throughout the heating procedure. The cumulative water loss rate for the entire process is 4.87%.
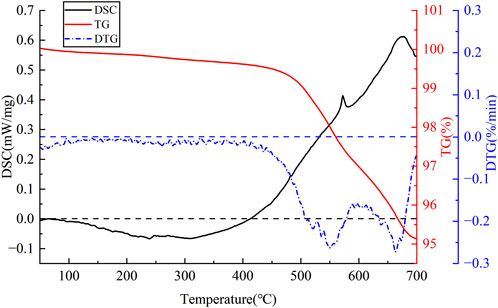
Figure 2. The thermogravimetric analysis (TG), differential thermogravimetric analysis (DT) and differential scanning calorimetry (DSC) curves of Tongxin Sandstone.
The DSC curve indicates that the sandstone undergoes an exothermic reaction during the first stage, primarily due to the dehydration reaction. The second stage is endothermic, predominantly resulting from the dehydroxylation reaction of kaolinite. A minor endothermic peak is also observed within the 550°C–600°C range, mainly attributed to the phase transition of quartz. The dehydroxylation reaction concludes in the third stage, and the DSC curve begins to descend.
By integrating the analysis results from Table 1 and the thermal analysis results from Figure 2, and referencing related literature, the pyrolysis process of the sandstone in this study is depicted as follows.
Stage 1 (25–110°C): In this stage, the adsorbed water on the surface of sandstone mineral particles or within the fractures progressively evaporates.
Stage 2 (110°C–470°C): In this stage, the internal structure of the sandstone remains relatively stable. Minor structural changes within the rock are induced by the thermal stress, a result of the differing linear expansion coefficients of various components. This effect persists throughout the entire heating process of the sandstone.
Stage 3 (470°C–650°C): In this stage, the dehydroxylation of kaolinite occurs. In the 470°C–540°C stage, kaolinite sheds its outer structural (OH¯), yet the crystal structure of kaolinite remains intact. As the temperature escalates to 540°C–650°C, the inner structural (OH¯), accounting for approximately one-fourth of the hydroxyl group, areis removed. This results in the disorganization of the aluminum-oxygen octahedral layer structure of kaolinite, leading to the formation of metakaolinite. Metakaolinite, in comparison to kaolinite, possesses a long-range disordered structure with enhanced activity and a damaged crystal structure (Cheng et al., 2012).
Within stage 3, at 573°C, quartz undergoes a phase transition, transforming from the β phase to the α phase. This transition triggers significant thermal stress, leading to drastic alterations in the internal structure of the sandstone (Jones et al., 1997).
Stage 4 (650°C–700°C): During this stage, the internal structure of the sandstone stabilizes once again, and the modifications in the internal structure of the rock are predominantly caused by thermal stress.
4 Analysis of the variation rules of physical properties with temperature
4.1 Variation rules of size with temperature
Figure 3 illustrates the variation in the volume, height and diameter of Tongxin sandstone in response to temperature changes. As depicted in Figure 3, all three size parameters of Tongxin sandstone - height, diameter, and volume - exhibit an increase with escalating heat treatment temperatures. The segmented rules of these three parameters follow a similar pattern: 50–450°C, the size increment is gradual with increasing temperature. Around 100°C, a volume shrinkage is observed due to dehydration, although the height, diameter, and volume continue to display a slow upward trend, attributable to thermal stress. As the temperature surpasses 450°C, the size increase accelerates due to the transformation of kaolinite to metakaolinite and the phase transition of quartz. Notably, the volume of quartz expands approximately 0.82% post-transition. Consequently, a particularly significant size increase is observed within the 550–600°C temperature range.
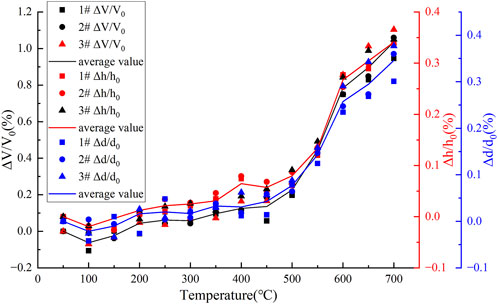
Figure 3. Variation curve of volume, height and diameter of Tongxin Sandstone with temperature.
4.2 Variation rule of porosity with temperature
Figure 4 represents the variance of porosity and its sequential growth rate in Tongxin sandstone in relation to temperature. The sequential growth rate can reflect short-term changes in data, making it easier to analyze changes in the internal structure of the rock. As Figure 4 indicates, the porosity of Tongxin sandstone escalates with increasing temperature. In the range of 50–450°C, the porosity increment is marginal, predominantly due to the release of adsorbed water and the thermal stress. The comparative analysis of pore size distribution, as illustrated in Figure 5, further confirms that the sandstone’s internal pore structure remains stable during this phase, with minor shifts in pore size distribution. Between 450 and 700°C, the porosity experiences a more rapid increase, largely attributed to the dehydroxylation reaction of kaolinite and the phase transition of quartz.
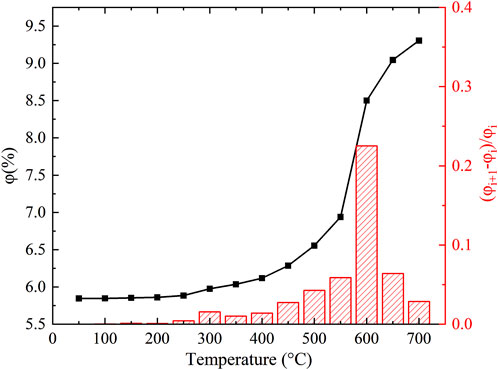
Figure 4. Variation curve of porosity and its sequential growth rate of Tongxin Sandstone with temperature.
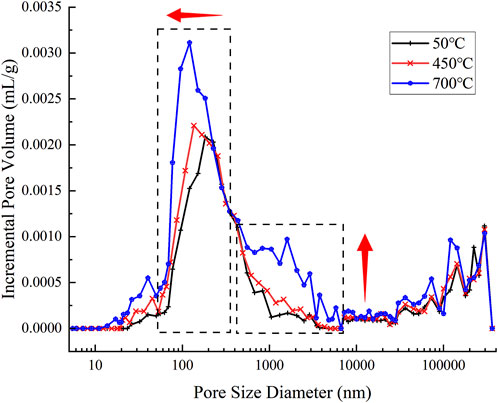
Figure 5. Pore diameter distribution of Tongxin Sandstone at 50, 450, 700°C.
Notably, a porosity surge is observed between 550 and 600°C, a consequence of the quartz phase transition, quartz particle volume expansion, and the structural adaptation of surrounding cementing materials under pressure, leading to irreversible deformation. As the temperature decreases, quartz particles contract, forming an expanded pore structure with the surrounding cementing materials, as illustrated in Figure 6.
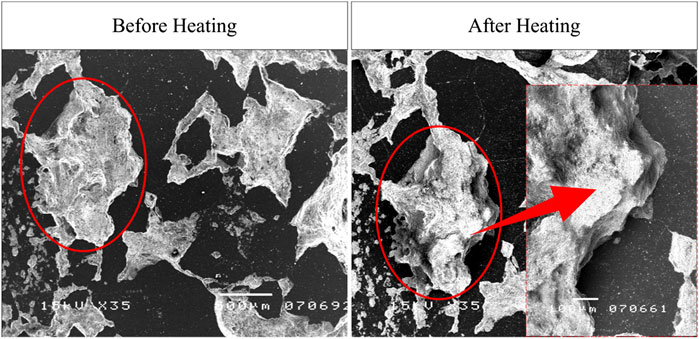
Figure 6. Comparison of scanning electron microscopy images of the same location on Tongxin Sandstone before and after heating.
From Figure 5, one can discern that the disparity between the pore size distribution curves at 450°C and 700°C is principally depicted within the two black dashed box sections of the figure. In the left section, the pore volume escalates due to the dehydroxylation of kaolinite, despite a decrease in the average pore size. This phenomenon arises as larger kaolinite cement clusters disperse into smaller metakaolinite cement clusters. Dong et al. corroborated this observation, noting that a substantial quantity of powdery particles emerges in the sandstone when the temperature ascends from 400°C to 600°C. SEM images further reveal a notable reduction in the particle size of clay minerals (Dong et al., 2022). In the right section, an increase in the number of pores within the 0.5–7 μm range is evident. This increase is attributed to the phase transition of quartz, where expansion under thermal stress gives rise to a new pore structure.
4.3 Variation rule of wave velocity with temperature
Figure 7 shows the change in wave velocity and its sequential growth rate with temperature for Tongxin sandstone. Figure 7 shows that the wave velocity of Tongxin sandstone decreases as the temperature increases. The curve of wave velocity with temperature can be divided into the following stages:
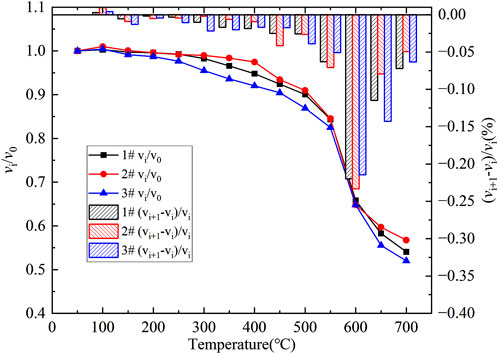
Figure 7. Wave velocity and its sequential growth rate of Tongxin Sandstone with temperature.
50–500°C: In this stage, the change in wave velocity is relatively slight. This is mainly because there is a lot of cement between the particles of Tongxin sandstone, which is easy to deform. The thermal stress formed by thermal expansion will not be too high, and the newly formed pores and cracks are few, having a small impact on wave velocity. Although kaolinite starts to dehydrogenate after 450–500°C, it does not start to form metakaolinite, and its layered structure is not damaged. According to the sequential growth rate of wave velocity, the rate of decrease in wave velocity does not change significantly.
500–700°C: During this phase, there is a rapid decline in wave velocity. This decline is attributed to the dehydroxylation of kaolinite and the quartz phase transition, both of which generate numerous new pores and cracks, precipitating the swift reduction in wave velocity.
In the range of 550–600°C, the wave velocity decreases sharply, indicating that there has been significant damage to the internal structure of the rock, forming a larger pore and crack structure. This is caused by the phase transition of quartz. The volume of quartz changes dramatically during the phase transition, causing a drastic change in the internal structure of the rock.
4.4 Variation rule of circumferential wave velocity anisotropy and crack density with temperature
Sandstone, a sedimentary rock, is generally regarded as a transversely isotropic material. However, the release of in situ stress induces cracks aligned with the in situ stress direction within the rock sample, leading to velocity anisotropy. Numerous parameters are available to quantify the anisotropy of circumferential wave velocity, including wave amplitude, the ratio of wave amplitude to average wave velocity, and standard deviation. In this study, the degree of circumferential wave velocity anisotropy is characterized by the ratio of the maximum to minimum circumferential P-wave velocity values, denoted as ζ.
Figure 8 illustrates the relationship between the anisotropy coefficient ζ and temperature. From 50°C to 500°C, ζ exhibits a gradual increase with minor fluctuations. A pronounced escalation in ζ is observed between 500°C and 600°C, followed by a plateau beyond 600°C.
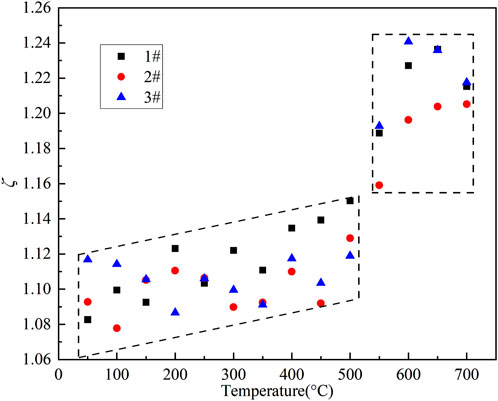
Figure 8. Variation rule of the anisotropy coefficient ζ of P-wave velocity of Tongxin Sandstone with temperature.
Jiang et al. found that the variable coefficient of circumferential P-wave velocity anisotropy changes with temperature in a manner consistent with the evolution of internal fracture structure in rocks. They believe that this variability coefficient is related to certain properties of the fractures (Jiang et al., 2018). The following involves a theoretical analysis to establish a theoretical model between crack density and the anisotropy coefficient of circumferential P-wave velocity.
In Thomsen’s model, the P-wave velocity in weakly anisotropic elastic media is (Thomsen, 1995).
where α0 is the P-wave velocity in the symmetry direction, θ is the angle between the wave front normal and the symmetry axis, ε and δ are the anisotropy parameter.
Then, according to Equation 2, the anisotropy parameter ε can be obtained as shown in Equation 3:
where
According to Equation 1, the anisotropy parameter ε can be represented by the anisotropy coefficient ζ defined in this article.
Assuming that the cracks are circular ellipsoids, perfectly aligned and sparsely distributed in a porous medium composed of isotropic grains, t the anisotropy parameter ε is given by
where Ks is the incompressibility of the solid grains, Kf is that of the fluid in the cracks, ν is the Poison’s ratio of the isotropic porous rock (without the cracks), E is its Young’s modulus, E* and ν* are the corresponding properties of the dry isotropic porous rock, ηc is the crack density. Dci is related to the following factors, as shown in Equation 6.
where K* is the incompressibility of the dry isotopic porous rock, φ is the total porosity (cracks plus pores, etc.), Ac is a function of ν*.
In the experiment of anisotropic wave velocity measurement, the testing environment is open. So, Kf = 0 and Dci = 1. After heat treatment, the rock samples are dry, so E = E* and ν = ν*.
Therefore, Equation 5 can be simplified as:
By combining Equations 4, 7, the crack density ηc can be expressed by the anisotropy coefficient ζ as shown in Equation 8:
This equation indicates that the internal crack density of dry rocks is related to the anisotropy coefficient of circumferential wave speed through a quadratic function relationship. By examining the circumferential wave speed measurements after thermal treatments at different temperatures, one can ascertain the rule governing the changes in internal crack density with temperature, as shown in Figure 9. The crack density notably increases between 450°C and 600°C, which corresponds to changes in pore size distribution and particle size due to the dehydroxylation reaction of kaolinite and the phase transition of quartz.
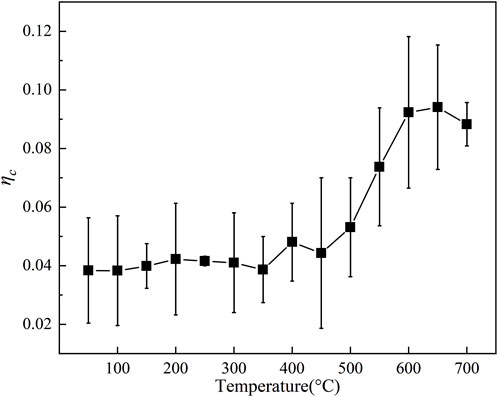
Figure 9. The change of crack density ηc of Tongxin Sandstone with temperature.
4.5 Variation rule of permeability with temperature
Figure 10 illustrates the fluctuation in permeability and its sequential growth rate with temperature for Tongxin sandstone. It is discernible from Figure 9 that the permeability of Tongxin sandstone undergoes five distinct stages as the temperature ascends:
Stage 1 (50–450°C): During this phase, the change in permeability with temperature is relatively minor, showing only slight variations. Based on the pyrolysis process analysis and porosity results, the sandstone’s internal structure is largely stable, with the creation of a few new pores due to the release of adsorbed water and thermal stress, leading to a minimal effect on permeability.
Stage 2 (450–500°C): This phase witnesses a rapid increase in permeability, implying a significant alteration in the sandstone’s internal structure. The thermal decomposition process analysis suggests that the permeability change in this phase is primarily due to the dehydroxylation of the kaolinite surface layer.
Stage 3 (500–550°C): In this phase, permeability decreases. The thermal decomposition process analysis indicates that kaolinite begins to dehydrogenate from the inner layer and forms metakaolinite. As discernible from Figure 5’s pore size distribution variation, the porosity increases due to the dehydroxylation reaction in this stage, but the quantity of large pores declines while the number of small pores augments. The impact of pore size alteration on permeability surpasses that of porosity change, resulting in an overall downward trend.
Stage 4 (550–600°C): In this phase, permeability rises with temperature, and the rate of increase is steep, indicating significant alterations in the sandstone’s internal makeup. This corresponds to the quartz phase transition during the thermal decomposition process. The quartz particles experience a dramatic expansion in volume, creating a multitude of pores between them and the surrounding clay minerals. Some quartz particles also exhibit cracks, leading to a sharp surge in permeability.
Stage 5 (600–700°C): In this phase, the permeability continues to ascend with temperature, but the rate of increase decelerates. From 600°C to 650°C, due to the continuation of the quartz phase transition, the sequential growth rate of permeability maintains a relatively high level. However, post 650°C, the quartz phase transition concludes, and the process of kaolinite transforming into metakaolinite essentially ends. The sandstone re-enters a relatively stable phase, the internal structural changes of the rock are minor, and the rate of permeability increase decelerates.
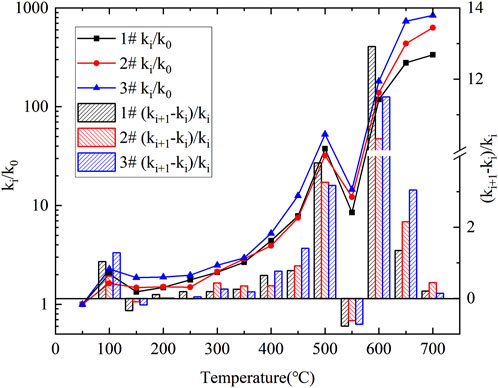
Figure 10. Permeability and its sequential growth rate of Tongxin Sandstone with temperature.
5 Discussion
5.1 Analysis of the correlation among various physical properties and development of the wave velocity-permeability model of sandstone
Sneider and King have pointed out that most of the physical properties of sandstone and conglomerate are related to the size of particles, the degree of rock consolidation, cementation, pore size, and the connectivity of the pores (Sneider et al., 1983). This reflects the connection between the various physical properties of rocks and their internal structure, i.e., the various physical properties of rocks are essentially different manifestations of their internal structure. This study investigates the variations in the physical properties (such as mass, size, porosity, wave velocity, crack decsity and permeability) of sandstone with temperature. Additionally, it systematically compares these variations with thermal analysis curve, as shown in Figure 11. The analysis discerns a consistency in the patterns of physical property changes with temperature, aligning with the segmented patterns of the thermal decomposition process. It indicates the existence of connections between the various physical properties of rocks. This means that the construction of correlation models between different physical properties can be enabled, allowing for the inference of a challenging-to-measure property through the measurement of an easily detectable one under high-temperature conditions.
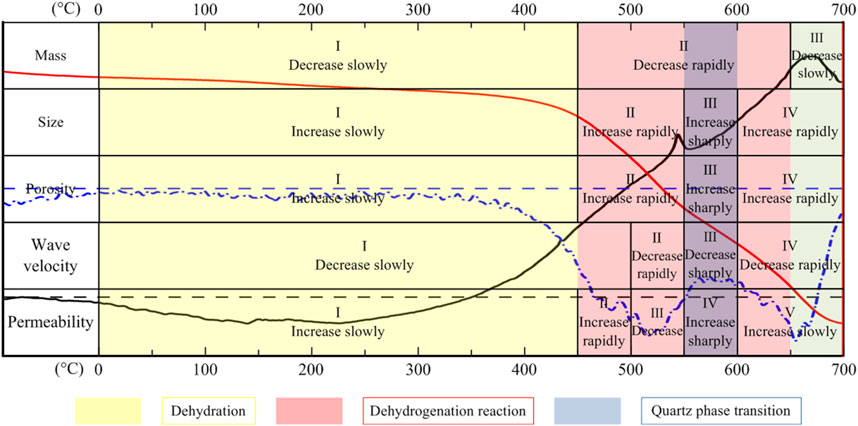
Figure 11. Comparison of changes in physical properties such as mass, dimensions, porosity, wave velocity and permeability of Tongxin Sandstone with temperature and thermal analysis curves.
At present, prevalent correlation models between different physical properties include the wave speed-porosity model and the porosity-permeability model (Mavko et al., 2020). Efforts have also been made to formulate a model that connects wave speed with permeability for granite (Jiang et al., 2018). Subsequent sections will compare experimental outcomes with these existing models, focusing on the interrelationships among wave velocity, porosity, and permeability, culminating in the proposal of a wave velocity-permeability model for sandstone subjected to high temperatures.
5.1.1 Wave velocity-porosity model
Extensive research has explored the correlation between wave velocity and porosity in sandstone. Empirical equations are commonly utilized models, that typically follow the pattern as shown in Equation 9 (Mavko et al., 2020):
where vp is longitudinal wave velocity, φ is porosity, α is clay content, A, B, C are constants.
The internal clay content of sandstone remains almost constant after thermal treatment. Thus, the velocity-porosity model in sandstone after undergoing various temperature treatments can be simplified to the following equation.
where C1 is a constant.
The relationship between the P-wave velocity and porosity of Tongxin sandstone after high-temperature treatment was fitted, and the fitting result is shown in Figure 12. Using the same rock samples for high-temperature treatment helped to avoid errors caused by sample differences, and the fitting curve closely matches the experimental results.
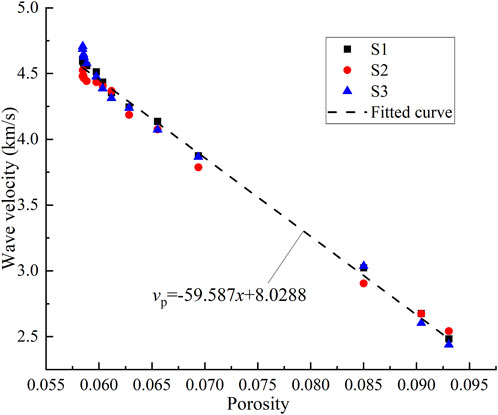
Figure 12. Test results and model fitting curve of wave velocity and porosity of Tongxin Sandstone with temperature.
5.1.2 Porosity-permeability model
The Kozeny-Carman equation is universally recognised as the quintessential model for correlating porosity and permeability. After extensive research by numerous scholars, the KC equation and its modified models suitable for different porous materials have been proposed (Xu and Yu, 2008). Currently, the prevailing KC equation used for materials such as sandstone is as shown in Equation 11 (Mavko and Nur, 1997):
where k is permeability, N is a geometric factor that accounts for the irregularities of pore shapes, φc is percolation porosity, which is of the order of 1–3%, d is the particle size.
Owing to the relatively low porosity of Tongxin sandstone, the above equation can be simplified to:
where M = Nd2, is a quantity related to the pore structure and particle size of the rock.
Assuming φc = 2%, the fitted results, as depicted in Figure 13, reveal a pronounced correlation between porosity and permeability. Notably, Figure 13 depicts that the porosity-permeability model displays two distinct stages: 50–500°C and 550–700°C. The slope of the fitted curve represents M, which is a parameter related to particle size. Comparing the slopes between the two curve segments indicates a decrease in the particle size of Tongxin sandstone between 500°C–550°C. This conclusion aligns with the previous analysis of temperature-dependent variations in the pore size distribution and permeability of Tongxin sandstone.
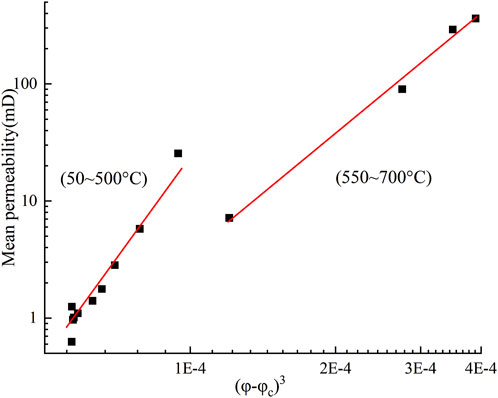
Figure 13. Test results and model fitting curve of porosity and permeability of Tongxin Sandstone with temperature (the fitting curve is divided into two segments: 50°C–550°C and 550°C–700°C due to changes in particle size).
5.1.3 Wave velocity-permeability model
A robust correlation exists between wave velocity and porosity, as well as between porosity and permeability, thereby suggesting an interrelation between wave velocity and permeability. Consequently, a model delineating the relationship between wave velocity and permeability in Tongxin sandstone after undergoing various temperature treatments can be established by combining Equations 10, 12:
where A1 and C2 are constants.
Based on Equation 13, fitting the experimental data of wave velocity and permeability for different samples allows for the determination of the corresponding A1, C2, and M values for each sample. The fitting results are presented in Figure 14 and Table 3. Due to the differences between the rock samples, the fitting curves are not identical; however, the experimental data of wave velocity and permeability at different temperatures for a single rock sample generally conform well to the newly constructed model.
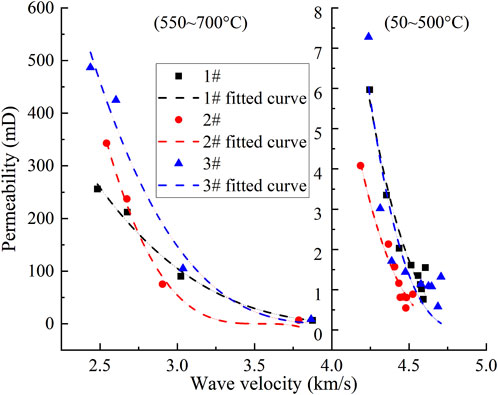
Figure 14. Test results and model fitting curve of wave velocity and permeability of Tongxin Sandstone at different temperatures (the fitting curve is divided into two segments: 50°C–550°C and 550°C–700°C due to changes in particle size).
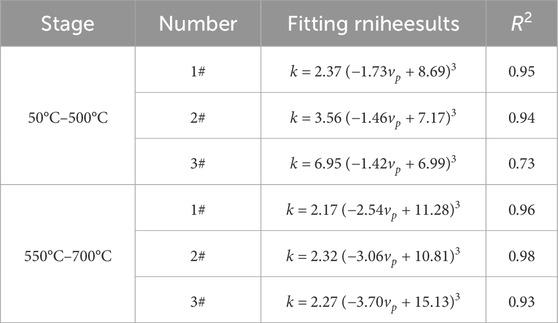
Table 3. Fitting curve equations for the wave velocity-permeability model of tongxin sandstone at different stages.
Based on the correlation models between various physical properties, in actual high-temperature engineering scenarios, we can facilitate the monitoring of physical quantities that are challenging to measure and cannot be measured in real-time (such as permeability) by observing simple, real-time measurable physical properties (such as wave speed). It is only necessary to collect rock samples in advance and fit the undetermined constants in Equation 13 through laboratory experimental results.
5.2 Analysis of the evolution and mechanism of internal structure in sandstone after heating
Given that the majority of a rock’s physical properties are tied to its internal structure, the evolution of this internal structure can be deduced from alterations in the rock’s physical properties following heat treatment. Coupling this with the microscopic findings from electron microscopy and the analysis of the rock’s pyrolysis process, the evolution of Tongxin sandstone’s internal structure during the heating process can be segmented into the following stages (illustrated in Figure 15):
(1) Stage 1 (50–450°C): This stage is characterized by minor modifications in the sandstone’s internal pore structure, the emergence of micro-cracks, and negligible changes in assorted physical properties. The primary influencers on the sandstone’s internal structure at this stage are the elimination of adsorbed water and thermal stress.
(2) Stage 2 (450–650°C): In this stage, micro-cracks persist in expanding, kaolinite’s dehydroxylation results in increased porosity, and the shrinkage of the cementing material’s particle size culminates in a reduction in average pore size. The dehydroxylation reaction of kaolinite predominantly affects the sandstone’s internal structure in this stage.
(3) Stage 3 (550–600°C): This stage witnesses the phase transformation of quartz inducing thermal stress, which significantly amplifies crack expansion. Owing to the pressure exerted by quartz particles on the cementing material, the sandstone’s internal structure undergoes radical transformations, and all physical properties display conspicuous anomalies. The primary factor affecting the sandstone’s internal structure in this stage is the thermal stress induced by quartz’s phase transformation.
(4) Stage 4 (650–700°C): At this stage, kaolinite’s dehydroxylation reaction concludes, and the sandstone’s internal structure begins to stabilize, with the alterations in various physical properties decelerating. Thermal stress remains the predominant factor influencing the sandstone’s internal structure in this stage.
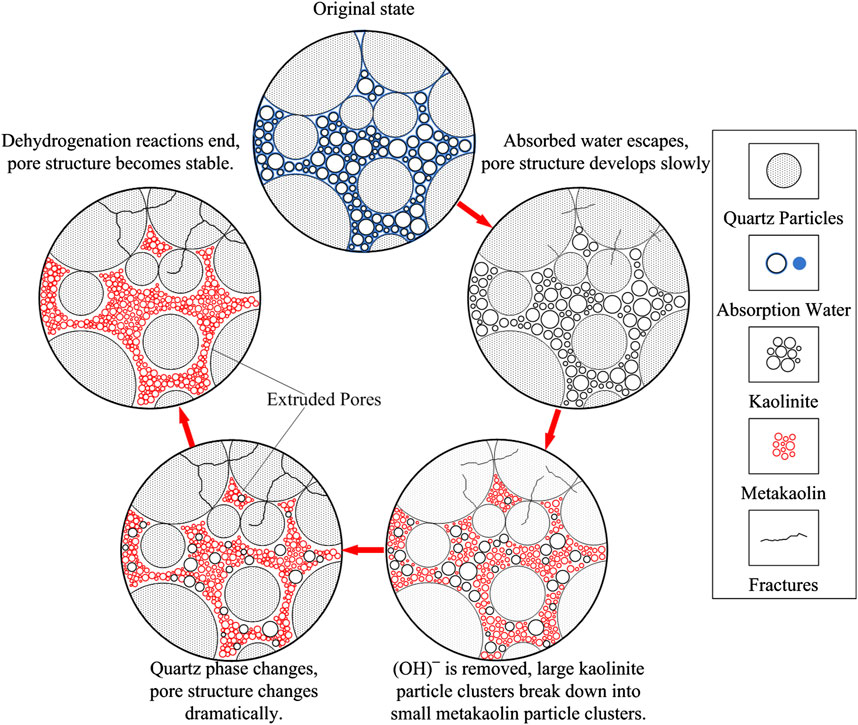
Figure 15. Schematic diagram of the evolution of the internal structure of Tongxin Sandstone after heat treatment.
6 Conclusion
This study conducts an experimental exploration into the evolution of physical attributes such as mass, size, wave velocity, porosity, and permeability of sandstone under elevated temperatures. Alongside thermal analysis, pyrolytic analysis, and SEM microscopic examination, the evolution of the sandstone’s internal structure during heating was analyzed. The following conclusions were drawn:
(1) Upon heating Tongxin sandstone, attributes like mass and wave velocity diminish with escalating temperature, whilst size and porosity inflate. Permeability generally inflates with temperature, with a minor decrease noted at 500–550°C.
(2) The analysis of the pyrolysis process is essential for understanding the evolution and causation of the internal structure of rocks during heating. Changes in the rock’s physical properties with temperature are associated with its pyrolysis process, with the dehydroxylation of kaolinite and the phase transformation of quartz causing significant changes in these properties. Furthermore, the differing thermal expansion coefficients of minerals generate thermal stress throughout the heating process, leading to continuous changes in the rock’s internal structure. Consequently, understanding the thermal stability of the various mineral components in rocks and analyzing the thermal decomposition process of rocks can roughly yield the evolutionary characteristics of the rock’s internal structure and qualitatively predict the changing patterns and threshold temperatures of various physical parameters.
(3) There is a correlation between the various physical properties of sandstone. The physical properties of a rock are essentially different manifestations of its internal structure; hence, the patterns of change in physical properties of sandstone such as size, wave speed, porosity, and permeability with temperature are similar to the patterns of change in the rock’s internal structure with temperature. Due to the interconnection between various physical properties, it is possible to establish a correlation model. Then, monitoring one physical property can be achieved by measuring another under high-temperature conditions.
(4) By analyzing the evolution of various physical properties of rocks at high temperatures and conducting comparative validation, more detailed insights into the evolution of the internal structure of rocks can be obtained. By inverting various physical properties and deducing the crack density from the anisotropy coefficient of circumferential wave speed, and in conjunction with the results of electron microscopy observations and pore size distribution analysis, the internal structural evolution process of the Tongxin sandstone after heat treatment was classified into the following: a stable change phase (50–450°C), a rapid change phase (450–550°C, 600–700°C), and an intense change phase (550–600°C). Based on the analysis of the pyrolysis results, it can be inferred that the stable change phase is governed by dehydration and thermal stress, the rapid change phase is governed by the dehydroxylation reaction of kaolinite, and the drastic change phase is governed by the phase transformation of quartz.
Data availability statement
The original contributions presented in the study are included in the article/supplementary material, further inquiries can be directed to the corresponding author.
Author contributions
GJ: Writing–original draft, Writing–review and editing. JtW: Writing–original draft, Writing–review and editing. JhW: Writing–review and editing. XL: Writing–review and editing. BY: Writing–review and editing. YW: Writing–review and editing.
Funding
The author(s) declare that financial support was received for the research, authorship, and/or publication of this article. This research is funded by the Natural Science Foundation of Shandong Province, grant number ZR2020QE110, the National Natural Science Foundation of China, grant number 52104089, the National Natural Science Foundation of China, grant number 52204140, the Open Fund of Shandong Engineering Research Center for Mine Gas Disaster Prevention and Control, grant number 2022-005, the Science and Technology Project of Changzhou, grant number CE20235011, the QingLan Project, grant number 30320190222002, the Changzhou Longcheng Talent Program - Young Science and Technology Talent Lifting Project, grant number 30520190722002.
Conflict of interest
Author BY was employed by Ltd.
The remaining authors declare that the research was conducted in the absence of any commercial or financial relationships that could be construed as a potential conflict of interest.
Generative AI statement
The author(s) declare that no Generative AI was used in the creation of this manuscript.
Publisher’s note
All claims expressed in this article are solely those of the authors and do not necessarily represent those of their affiliated organizations, or those of the publisher, the editors and the reviewers. Any product that may be evaluated in this article, or claim that may be made by its manufacturer, is not guaranteed or endorsed by the publisher.
References
Bhutto, A. W., Bazmi, A. A., and Zahedi, G. (2013). Underground coal gasification: from fundamentals to applications. Prog. Energy Combust. Sci. 39 (1), 189–214. doi:10.1016/j.pecs.2012.09.004
Chen, S. W., Yang, C. H., and Wang, G. B. (2017). Evolution of thermal damage and permeability of Beishan granite. Appl. Therm. Eng. 110, 1533–1542. doi:10.1016/j.applthermaleng.2016.09.075
Cheng, H. F., Liu, Q. F., Yang, J., Ma, S. J., and Frost, R. L. (2012). The thermal behavior of kaolinite intercalation complexes-A review. Thermochim. Acta 545, 1–13. doi:10.1016/j.tca.2012.04.005
Daoud, A., Browning, J., Meredith, P. G., and Mitchell, T. M. (2020). Microstructural controls on thermal crack damage and the presence of a temperature-memory effect during cyclic thermal stressing of rocks. Geophys. Res. Lett. 47 (19). doi:10.1029/2020gl088693
Dong, Z., Chen, Y. P., Wang, X. G., Kong, L. F., Wang, L. G., Li, X. N., et al. (2022). Evaluation of thermophysical and mechanical properties of sandstone due to high-temperature. Materials 15 (23), 8692. doi:10.3390/ma15238692
Fan, L. F., Wu, Z. J., Wan, Z., and Gao, J. W. (2017). Experimental investigation of thermal effects on dynamic behavior of granite. Appl. Therm. Eng. 125, 94–103. doi:10.1016/j.applthermaleng.2017.07.007
Griffiths, L., Lengliné, O., Heap, M. J., Baud, P., and Schmittbuhl, J. (2018). Thermal cracking in westerly granite monitored using direct wave velocity, coda wave interferometry, and acoustic emissions. J. Geophys. Research-Solid Earth 123 (3), 2246–2261. doi:10.1002/2017jb015191
Jiang, G. H., Zuo, J. P., Li, L. Y., Ma, T., and Wei, X. (2018). The evolution of cracks in maluanshan granite subjected to different temperature processing. Rock Mech. Rock Eng. 51 (6), 1683–1695. doi:10.1007/s00603-018-1403-7
Jiang, H. P., Jiang, A. N., and Zhang, F. R. (2021). Experimental investigation on the evolution of damage and seepage characteristics for red sandstone under thermal-mechanical coupling conditions. Environ. Earth Sci. 80 (24), 816. doi:10.1007/s12665-021-10121-x
Jin, J., Liu, J. D., Chen, W. X., Li, G. P., Cheng, W., Zhang, X. W., et al. (2024). The impact of high temperature on mechanical properties and behaviors of sandstone. Front. Earth Sci. 12, 12. doi:10.3389/feart.2024.1322495
Jing, X. D., Sun, Q., Jia, H. L., Ge, Z. L., and Wang, T. (2021). Influence of high-temperature thermal cycles on the pore structure of red sandstone. Bull. Eng. Geol. Environ. 80 (10), 7817–7830. doi:10.1007/s10064-021-02389-x
Jones, C., Keaney, G., Meredith, P. G., and Murrell, S. A. F. (1997). Acoustic emission and fluid permeability measurements on thermally cracked rocks. Phys. Chem. Earth 22 (1-2), 13–17. doi:10.1016/S0079-1946(97)00071-2
Kang, Z. Q., Zhao, Y. S., and Yang, D. (2020). Review of oil shale in-situ conversion technology. Appl. Energy 269, 115121. doi:10.1016/j.apenergy.2020.115121
Li, M., Mao, X. B., Cao, L. L., Pu, H., and Lu, A. H. (2017). Influence of heating rate on the dynamic mechanical performance of coal measure rocks. Int. J. Geomechanics 17 (8), 12. doi:10.1061/(asce)gm.1943-5622.0000888
Li, M., Mao, X. B., Cao, L. L., Pu, H., Mao, R. R., and Lu, A. H. (2016). Effects of thermal treatment on the dynamic mechanical properties of coal measures sandstone. Rock Mech. Rock Eng. 49 (9), 3525–3539. doi:10.1007/s00603-016-0981-5
Liu, S., and Xu, J. Y. (2015). An experimental study on the physico-mechanical properties of two post-high-temperature rocks. Eng. Geol. 185, 63–70. doi:10.1016/j.enggeo.2014.11.013
Lu, C., Sun, Q., Zhang, W. Q., Geng, J. S., Qi, Y. M., and Lu, L. L. (2017). The effect of high temperature on tensile strength of sandstone. Appl. Therm. Eng. 111, 573–579. doi:10.1016/j.applthermaleng.2016.09.151
Mavko, G., Mukerji, T., and Dvorkin, J. (2020). The rock physics handbook. United Kingdom: Cambridge University Press.
Mavko, G., and Nur, A. (1997). The effect of a percolation threshold in the Kozeny-Carman relation. Geophysics 62 (5), 1480–1482. doi:10.1190/1.1444251
Shang, X. J., Zhang, Z. Z., Xu, X. L., Liu, T. T., and Xing, Y. (2019). Mineral composition, pore structure, and mechanical characteristics of pyroxene granite exposed to heat treatments. Minerals 9 (9), 553. doi:10.3390/min9090553
Sneider, R. M., King, H. R., Hawkes, H. E., and Thomas, B. D. (1983). Methods for detection and characterization of reservoir rock, deep basin Gas area, western Canada. J. Petroleum Technol. 35 (09), 1725–1734. doi:10.2118/10072-PA
Sun, Q., Lü, C., Cao, L. W., Li, W. C., Geng, J. S., and Zhang, W. Q. (2016). Thermal properties of sandstone after treatment at high temperature. Int. J. Rock Mech. Min. Sci. 85, 60–66. doi:10.1016/j.ijrmms.2016.03.006
Thomsen, L. (1995). Elastic anisotropy due to aligned cracks in porous rock. Geophys. Prospect. 43 (6), 805–829. doi:10.1111/j.1365-2478.1995.tb00282.x
Tian, H., Kempka, T., Xu, N. X., and Ziegler, M. (2012). Physical properties of sandstones after high temperature treatment. Rock Mech. Rock Eng. 45 (6), 1113–1117. doi:10.1007/s00603-012-0228-z
Wang, J., Chen, L., Su, R., and Zhao, X. G. (2018). The Beishan underground research laboratory for geological disposal of high-level radioactive waste in China: planning, site selection, site characterization and in situ tests. J. Rock Mech. Geotechnical Eng. 10 (3), 411–435. doi:10.1016/j.jrmge.2018.03.002
Wu, J. Y., Jing, H. W., Gao, Y., Meng, Q. B., Yin, Q., and Du, Y. (2022). Effects of carbon nanotube dosage and aggregate size distribution on mechanical property and microstructure of cemented rockfill. Cem. and Concr. Compos. 127, 104408. doi:10.1016/j.cemconcomp.2022.104408
Wu, J. Y., Jing, H. W., Yin, Q., Yu, L. Y., Meng, B., and Li, S. C. (2020). Strength prediction model considering material, ultrasonic and stress of cemented waste rock backfill for recycling gangue. J. Clean. Prod. 276, 123189. doi:10.1016/j.jclepro.2020.123189
Wu, J. Y., Wong, H. S., Zhang, H., Yin, Q., Jing, H. W., and Ma, D. (2024). Improvement of cemented rockfill by premixing low-alkalinity activator and fly ash for recycling gangue and partially replacing cement. Cem. and Concr. Compos. 145, 105345. doi:10.1016/j.cemconcomp.2023.105345
Xi, D., Cheng, J., and Huang, J. (1996). The application of acoustic emission in the study of ancient temperature of rock. J. China Univ. Sci. Technol. (01), 97–101.
Xiao, W. J., Yu, G., Li, H. T., Zhang, D. M., Li, S. J., Yu, B. C., et al. (2021). Thermal cracking characteristics and mechanism of sandstone after high-temperature treatment. Fatigue and Fract. Eng. Mater. and Struct. 44 (11), 3169–3185. doi:10.1111/ffe.13575
Xiao, W. J., Zhang, D. M., Li, S. J., and Wu, M. Y. (2024). Microstructural and thermal properties of coal measure sandstone subjected to high temperatures. J. Rock Mech. Geotechnical Eng. 16 (8), 2909–2921. doi:10.1016/j.jrmge.2023.11.007
Xu, P., and Yu, B. (2008). Developing a new form of permeability and Kozeny–Carman constant for homogeneous porous media by means of fractal geometry. Adv. Water Resour. 31 (1), 74–81. doi:10.1016/j.advwatres.2007.06.003
Yang, S. Q., Ranjith, P. G., Jing, H. W., Tian, W. L., and Ju, Y. (2017). An experimental investigation on thermal damage and failure mechanical behavior of granite after exposure to different high temperature treatments. Geothermics 65, 180–197. doi:10.1016/j.geothermics.2016.09.008
Zhang, C., Wang, F. Z., Hu, L. B., Jiang, F., and Huang, G. Q. (2024). Experimental investigation on the mechanical behavior and fracture mechanism of sandstone after heat treatment. Bull. Eng. Geol. Environ. 83 (6), 220. doi:10.1007/s10064-024-03717-7
Zhang, W. Q., Sun, Q., Hao, S. Q., Geng, J. S., and Lv, C. (2016). Experimental study on the variation of physical and mechanical properties of rock after high temperature treatment. Appl. Therm. Eng. 98, 1297–1304. doi:10.1016/j.applthermaleng.2016.01.010
Zhang, W. Q., Wang, Z. Q., Du, Y., Zhang, S. T., Shi, Z. J., and Li, F. J. (2022). Effect of high temperature on pore characteristics, yield stress, and deformation property of sandstone. Bull. Eng. Geol. Environ. 81 (1), 43. doi:10.1007/s10064-021-02522-w
Zhang Y., Y., Ta, X., and Qin, S. B. (2022). Effect of heat treatment on physico-mechanical behaviour of a natural building stone: laizhou dolomite marble. J. Build. Eng. 47, 103885. doi:10.1016/j.jobe.2021.103885
Zhao, Y. S., Feng, Z. J., Zhao, Y., and Wan, Z. J. (2017a). Experimental investigation on thermal cracking, permeability under HTHP and application for geothermal mining of HDR. Energy 132, 305–314. doi:10.1016/j.energy.2017.05.093
Zhao, Y. S., Wan, Z. J., Feng, Z. J., Xu, Z. H., and Liang, W. G. (2017b). Evolution of mechanical properties of granite at high temperature and high pressure. Geomechanics Geophys. Geo-Energy Geo-Resources 3 (2), 199–210. doi:10.1007/s40948-017-0052-8
Zheng, Y. D., Zhang, L. Y., Wu, P., Guo, X. Q., Li, M., Zhu, F. Q., et al. (2024). Physical and mechanical properties and damage mechanism of sandstone at high temperatures. Appl. Sciences-Basel 14 (1), 444. doi:10.3390/app14010444
Keywords: high temperature, sandstone, internal structure, dehydroxylation, quartz phase transition
Citation: Jiang G, Wang J, Wen J, Liu X, Yu B and Wang Y (2024) Evolution of the internal structure and physical properties of Tongxin sandstone under high temperature. Front. Earth Sci. 12:1502647. doi: 10.3389/feart.2024.1502647
Received: 02 October 2024; Accepted: 28 November 2024;
Published: 16 December 2024.
Edited by:
Jiangyu Wu, China University of Mining and Technology, ChinaReviewed by:
Yuanyuan He, Wuhan Textile University, ChinaXiaolong Zhou, Qingdao Agricultural University, China
Copyright © 2024 Jiang, Wang, Wen, Liu, Yu and Wang. This is an open-access article distributed under the terms of the Creative Commons Attribution License (CC BY). The use, distribution or reproduction in other forums is permitted, provided the original author(s) and the copyright owner(s) are credited and that the original publication in this journal is cited, in accordance with accepted academic practice. No use, distribution or reproduction is permitted which does not comply with these terms.
*Correspondence: Guanghui Jiang, amdoQGxkdS5lZHUuY24=