 Xin Yang
 Bo Kang1
- 1China Zhenhua Oil Co., Ltd., Beijing, China
- 2Chengdu Northern Petroleum Exploration and Development Technology Co. Ltd., Chengdu, Sichuan, China
- 3State Key Laboratory of Oil and Gas Reservoir Geology and Exploitation, Southwest Petroleum University, Chengdu, Sichuan, China
Permeability is a fundamental property of porous media that governs the ability of a pore network to facilitate fluid flow through its pore spaces. However, the permeability test results are highly influenced by the type of fluid used during the measurements. This study investigates the influence of different fluids on permeability, excluding fluid-solid interactions. Permeability measurements were conducted on 30 clay-free Fontainebleau sandstones and 30 clay-free Y sandstones using kerosene and N2, with Klinkenberg-corrected gas permeability determined for comparison. Scanning electron microscopy (SEM) was employed to examine the presence of liquid films and particle migration within pore throats. The results consistently showed lower oil permeability compared to gas permeability across all samples. SEM analysis revealed that liquid films on rock surfaces and particle migration within pore throats contributed to the permeability disparity between liquid and gas in Fontainebleau sandstone. In contrast, the lower hydrophilicity of Y sandstone resulted in a negligible presence of liquid films, with particle migration being the primary factor for reduced liquid permeability. Furthermore, a more pronounced slip effect was observed in Y sandstone compared to Fontainebleau sandstone, attributed to its finer pore throats. These findings underscore the critical roles of liquid films, particle migration, and pore throat characteristics in determining permeability and highlight the relationship between the slip factor and permeability in porous media.
1 Introduction
Permeability is a crucial parameter in hydraulic engineering, geotechnical engineering, and petroleum engineering, representing the fluid flow ability in a porous media. Permeability is typically regarded as an intrinsic property of rock, influenced by pore characteristics like porosity, pore throat shape, and pore size distribution, and is considered independent of fluid properties. (Tanikawa and Shimamoto, 2009; Zhang et al., 2021). However, multiple studies have demonstrated that rock permeability values can significantly differ based on the testing fluid, whether it’s distilled water, brine, or naphtha (e.g., Heid et al., 1950; Mirzaei-Paiaman et al., 2019; Kim and Makhnenko, 2020; Wang et al., 2023; Wang et al., 2024). Exploring changes in permeability based on fluid properties is crucial for fields such as groundwater remediation (Ji et al., 2008), enhancing oil and gas recovery (Bikkina et al., 2016), and geological CO2 storage (Bakhshian et al., 2020).
Significant disparities between gas and liquid permeabilities have been documented in several studies. Notably, liquid permeability is consistently lower than that measured by gas across various rock types, including concrete formations, tight sandstones, shales, sedimentary rocks, and carbonate rocks. (Zhou et al., 2017; Gaus et al., 2019; Duan et al., 2020; Zhang et al., 2020; Duan et al., 2021; Sun et al., 2023). Klinkenberg (1941) proposed that the primary difference between apparent gas permeability and liquid permeability in porous media arises from the slip effect during gas movement within pore channels. The equation kg = k∞ (1 + b/pave) was employed to adjust the apparent gas permeability kg, using the reciprocal of the average gas pressure pave and he Klinkenberg-corrected gas permeability k∞ during flow through porous media. Sampath and Keighin (1982) formulated the expression for b in terms of the capillary radius rb, average pore pressure pa, and the gas’s mean free path γ. This is given by b = 4cλpa/rb, where c is a constant value, recommended to be 1. Beyond the slip effect, multiple factors contribute to the differences between gas and liquid permeability. Chen et al. (2016) observed a marked distinction between the Klinkenberg-corrected gas permeability k∞ and water permeability kw in Fontainebleau sandstones. The discrepancy could be attributed to the development of a liquid film and the migration of fine particles. Besides the effect of fluid type on permeability, water-sensitive clay minerals present in rocks can also impact water permeability readings across different saturation levels (Aksu et al., 2015; Golsanami et al., 2022; Huang et al., 2022; Mehraban et al., 2022; Al-Khdheeawi et al., 2023; Zhou et al., 2023; Luo et al., 2023). These discrepancies can be traced back to the expansion and reduction of clays when water saturation changes. Such dynamics can alter the pore structure, subsequently influencing the fluid’s passage through the pores. Heid et al. (1950) and Wang et al. (2019) both observed a persistent decrease in permeability in clay-rich rocks following water measurements, pointing to interactions between water and clay as the cause (e.g., Heid et al., 1950; Ibrahim et al., 2017; Wang et al., 2019; Duan et al., 2020). Zhang et al. (2024) investigated the permeability and its evolution in fracture-hosted hydrate-bearing sediments under shear, revealing that permeability initially decreases and then increases with changes in hydrate saturation, and they also analyzed the impact of sediment compressibility and fractures on permeability.
While numerous studies have examined how different fluids affect measured permeability, there’s a limited exploration of the cumulative effects of unique fluid mediums on the variations between Klinkenberg-corrected gas permeability and fluid permeability. Hence, our research will primarily concentrate on the role of gas slippage in permeability, setting aside clay influences, and delve into the effects of fine migration and liquid film formation on permeability.
2 Experiments
2.1 Samples and fluid properties
We selected 30 Fontainebleau sandstones from the Ile de region in France (Figure 1A), and sourced 30 Y sandstones from drillings in Chengdu, Sichuan Basin, PRC (Figure 1B) to measure permeability. All samples were cut to roughly 2.5 cm in diameter and 5.0 cm in length. The porosity for Fontainebleau sandstones ranges between 3.80% and 13.52%, while for Y sandstones, it lies between 5.56% and 31.23%. Our X-ray diffraction (XRD) tests indicated that both sets of samples are devoid of clay minerals. This absence of clay minerals reduces the potential for clay-induced alterations in permeability. As a result, these samples are particularly well-suited for a focused study on the effects of fluids on permeability. Fontainebleau sandstones primarily consist of a single mineral component, being made up of nearly 98% natural quartz grains, and exhibit a wide spectrum of porosity distribution (Bernabé et al., 2011). Table 1 details the specific physical properties of the 30 Fontainebleau sandstone samples employed in our experiment.
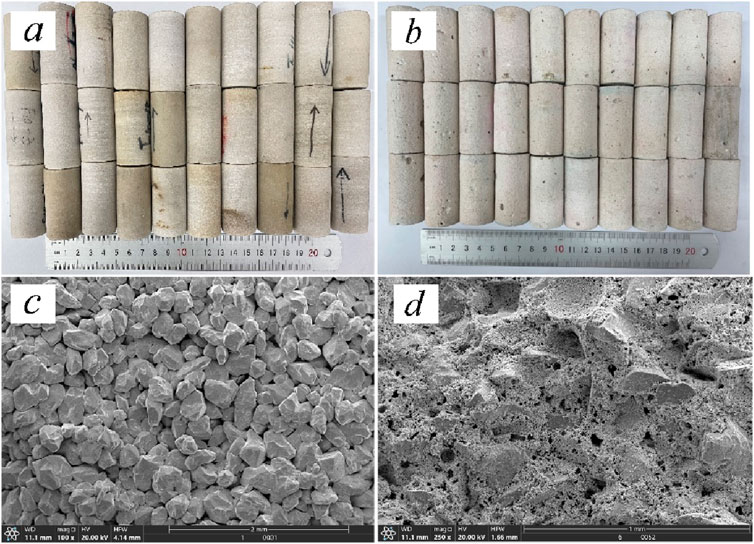
Figure 1. Images of outcrops: (A) Fontainebleau sandstones and (B) Y sandstones. SEM (scanning electron microscope) visuals: (C) for Fontainebleau sandstones and (D) for Y sandstones.
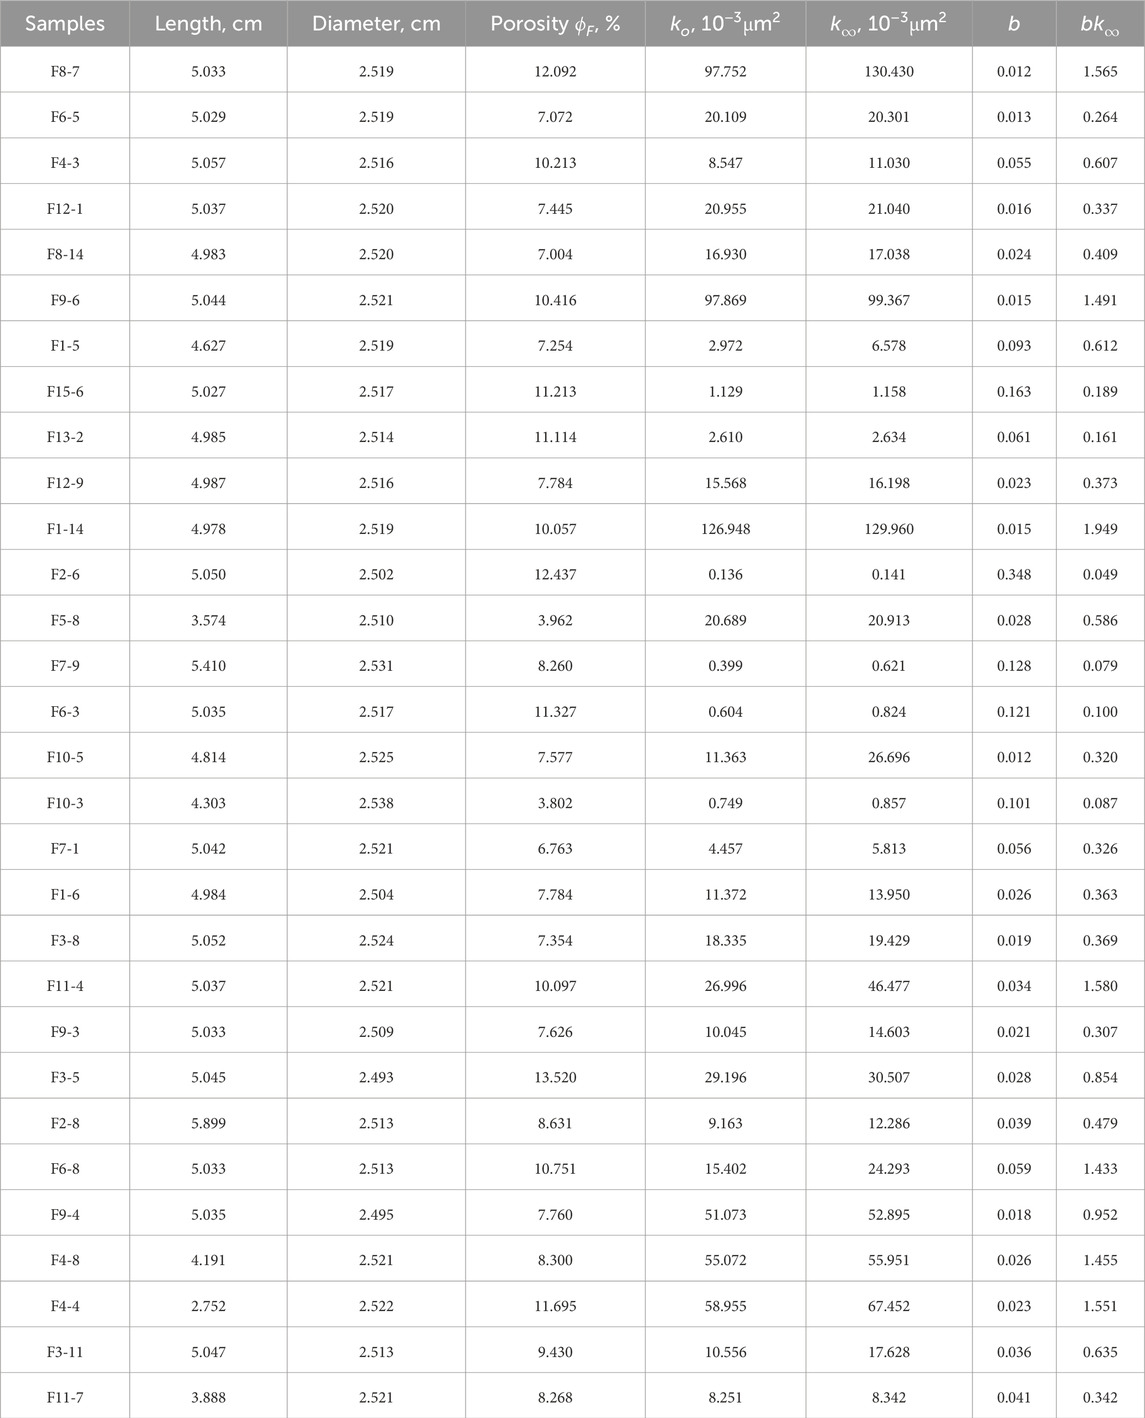
Table 1. Physical properties and permeability measurements for different fluids in Fontainebleau sandstones.
The microstructures of these two sandstones were examined using a scanning electron microscope. Fontainebleau sandstone predominantly consists of quartz, with an average grain size ranging between 200 and 250 μm (refer to Figure 1C). The samples exhibit consistent sorting and broad variations in both porosity and permeability distributions. Both the SEM observations and petrophysical findings align well with previously published datasets (Bourbie and Zinszner, 1985; Chen et al., 2016.). The petrophysical attributes of the 30 Y sandstone samples are detailed in Table 2. SEM images of the Y sandstones, presented in Figure 1D, reveal quartz (53.6%) and calcite (41.8%) as the dominant minerals in the Y sandstone. The internal structure of the Y sandstones was porous, characterized by sharply defined quartz particles and aggregates of micritic calcite crystals filling the interstices between the quartz grains. Circular solution pores were also evident.
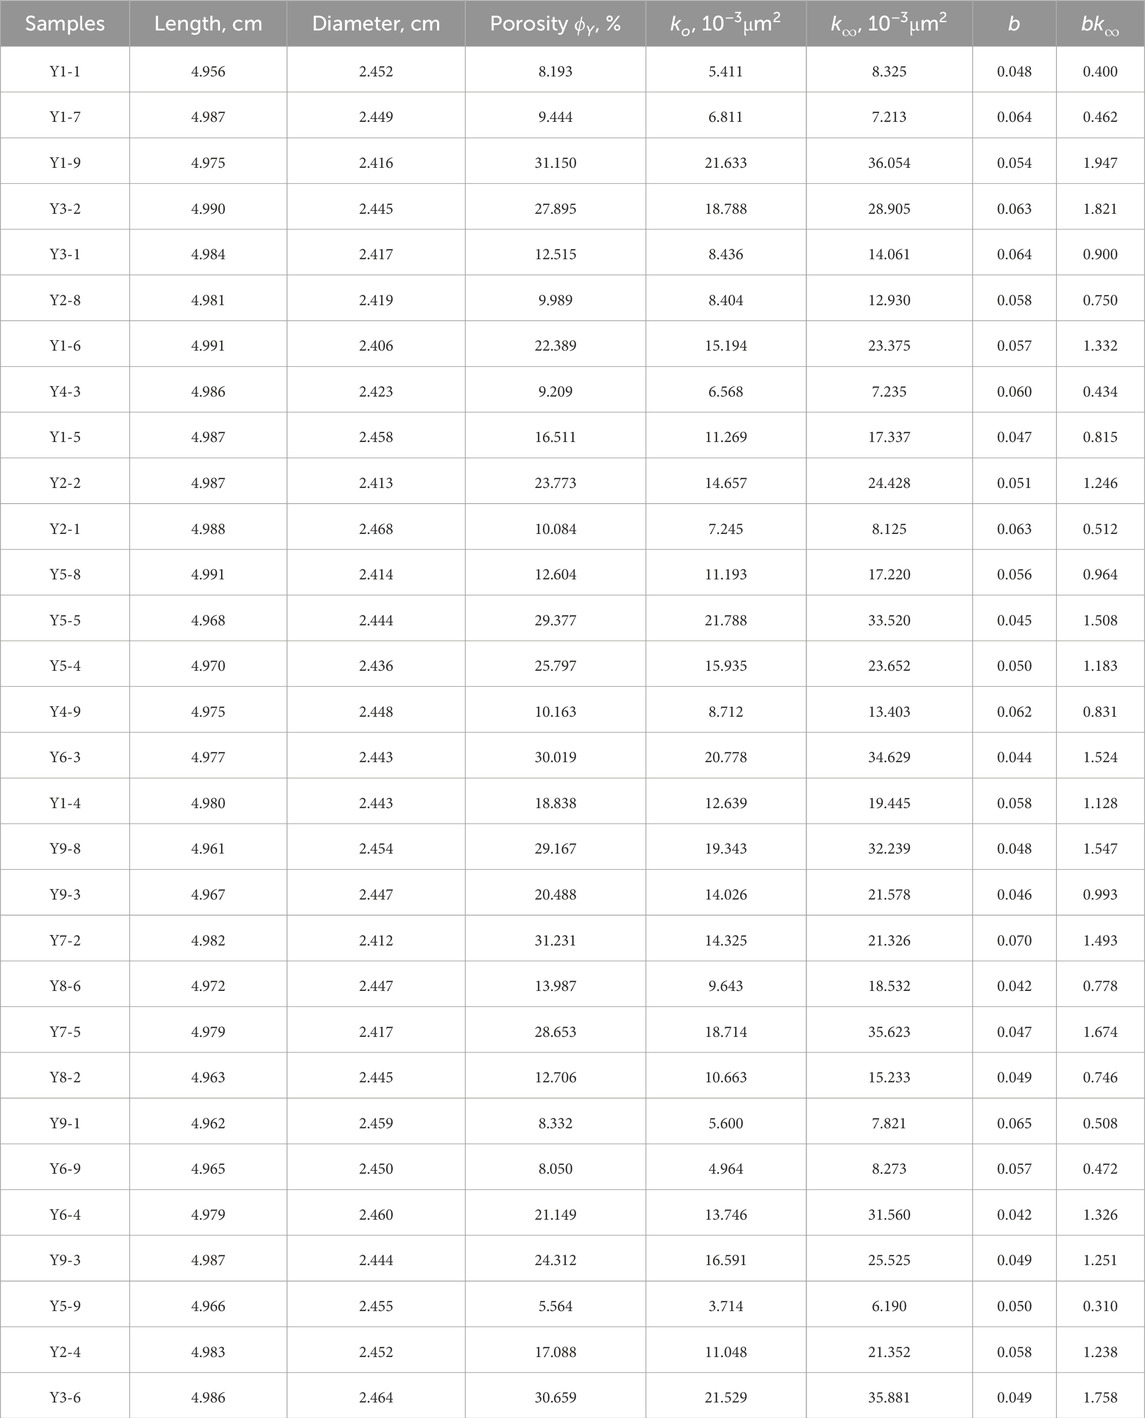
Table 2. Physical properties and permeability measurements for different fluids in Y sandstones.
Nitrogen is commonly adopted for gas apparent permeability measurements due to its stable physicochemical properties and non-interactive nature with the pore surface (Tanikawa and Shimamoto, 2009). In our research, we employed two fluids, N2 and kerosene, to gauge the permeability of the sandstones under study. We used high-purity nitrogen (with a purity of ≥99.2%) that has a viscosity of 0.0178 × 10⁻³ Pa∙s at 19°C, for measuring the gas apparent permeability of the rock samples. For assessing oil permeability, we utilized kerosene, which has a density of 0.819 kg/m3 and a viscosity of 1.22 × 10⁻³ Pa∙s at 19°C.
2.2 Experimental setup
Figure 2 provides a schematic representation of the permeability testing apparatus. This configuration includes a core holder, a confining pressure pump, a high-pressure nitrogen tank, a high-pressure ISCO pump, and a pressure transducer. For measuring gas permeability, the high-pressure nitrogen tank, core holder, and soap bubble meter were linked to the gas flowmeter, as depicted in cylinder I. Meanwhile, for liquid permeability assessments, the high-pressure ISCO pump, kerosene containers, and core holder were connected to the fluid flowmeter, illustrated in cylinder II.
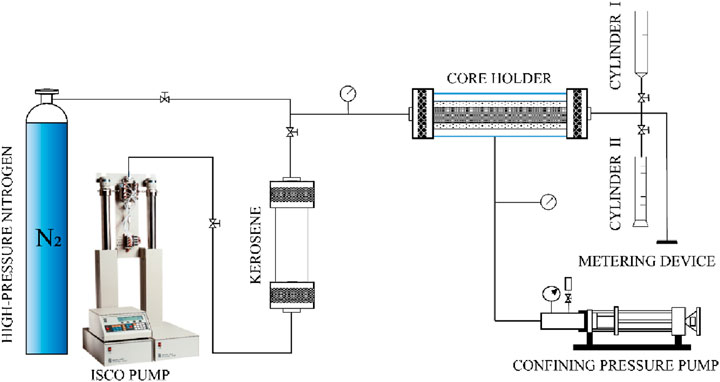
Figure 2. Experimental setup for gas and liquid permeability measurements.
2.3 Experimental procedure
Below is a detailed overview of the procedures and results from measuring the gas and kerosene permeability of the core samples.
2.3.1 Gas permeability measurement
The core samples were subjected to a drying process at 105°C for a duration of 24 h inside an oven. This step was crucial to eliminate the “in-situ” fluids present within the pore network. Subsequent to this, a leakage test was executed with the downstream pressure exposed to the ambient atmosphere. Gas permeability, denoted as kg, was ascertained using five distinct average pressures, labeled as pave. Throughout this measurement, the confining pressure was consistently held at 2.5 MPa.
2.3.2 Oil (kerosene) permeability measurement
Following the gas permeability assessments, we proceeded with the oil permeability measurements. All samples were thoroughly saturated with kerosene, leveraging both a vacuum pump and a high-pressure loading apparatus. To ensure that the samples were completely saturated with kerosene, we adopted the subsequent procedures:
(1) Place the core sample into the core holder and initiate a vacuum in the system. Continue this for over 2 h or until there’s no detectable pressure drops in the system.
(2) Disconnect the vacuum pump and connect the core holder to the liquid pump, which should be filled with degassed kerosene. Inject the liquid at a consistent pressure of 20 MPa for a duration of 24 h.
(3) Stop the liquid pumping once stable pressure readings are achieved. Remove the sample from the core holder and weigh it to ensure its fully saturated. (Ensuring that the saturation level for all samples exceeds 99.99%).
(4) Place the sample back into the core holder and set a confining pressure of 2.5 MPa.
(5) Inject kerosene at a steady flow rate until an equilibrium state is reached.
2.4 Permeability evaluation
The internal compressed flow rate is adjusted to the volumetric flow rate at atmospheric pressure p0 (Pa). Consequently, the gas permeability kg (×1018 μm2) can be calculated as following:
where A is the cross-sectional area of the sample (m2); Q0 is the volume of gas measured per unit time (m3/s); L is the length of the sample (m); μg is gas viscosity at an average pressure of (p1 + p2)/2 (Pa·s); p1 and p2 are the upstream pressure and downstream pressure, respectively (Pa).
k∞ can be determined by plotting kg against 1/pave using the relation kg = k∞ (1 + b/pave). In this relation, k∞ represents the y-intercept when extrapolating to the kg axis, and the slope of the line is represented by bk∞. Owing to the significant permeability of the samples, the kerosene permeability, ko can be derived using Darcy’s law.
3 Results
k∞ and ko values for both Fontainebleau and Y sandstones are detailed in Tables 1, 2, respectively. For Fontainebleau sandstones, the Klinkenberg-corrected gas permeability k∞ ranges from 0.14 × 10⁻³μm2 to 130.43 × 10⁻³μm2. Meanwhile, ko varies between 0.14 × 10⁻³μm2 and 126.95 × 10⁻³μm2. For Y sandstones, the Klinkenberg-corrected gas permeability ranges from 6.19 × 10⁻³μm2 to 36.05 × 10⁻³μm2, whereas the kerosene permeability varies between 3.71 × 10⁻³μm2 and 21.79 × 10⁻³μm2.
4 Discussion
The relationship between k∞ and the kerosene permeability ko is depicted on logarithmic coordinates in Figure 3. For both Fontainebleau and Y sandstones, it was observed that ko was consistently lower than k∞. Water permeability kw was measured on the identical Fontainebleau sample suite by Chen et al. (2016). For each sample, the observed correlation was kw < ko < k∞.
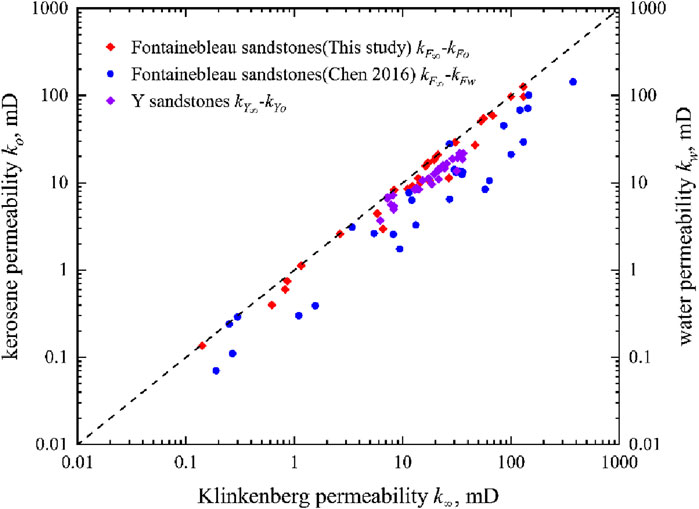
Figure 3. Relationship among ko, kw, k∞. The black diagonal line indicates where ko(kw) is equal to k∞. In this study, red diamonds depict the relationship between the Klinkenberg-corrected gas permeability kF∞ and kerosene permeability kFo of Fontainebleau sandstones. Purple diamonds show the relationship between the Klinkenberg-corrected gas permeability kY∞ and kerosene permeability kYo of Y sandstones. Meanwhile, blue circles illustrate the correlation between water permeability kFw and Klinkenberg-corrected gas permeability kF∞.
Previous research has indicated that water permeability values can be several orders of magnitude lower than slip-corrected permeability (Wang et al., 2019). The authors ascribed these disparities to pore blockages caused by water-sensitive clays or interactions between water and clay. A similar correlation was noted in this study, even though the analyzed samples had a negligible presence of clay minerals. To explore the potential reasons for the diminished oil permeability in the examined sandstone samples relative to the apparent gas permeability, we conducted SEM analysis on the samples post-kerosene flooding. The comparison of the SEM images before the experiment (Figure 4A) reveals that after the liquid permeability test, a fluid film formed on the surface of the rock particles (Figure 4B). Concurrently, quartz surface particles were detached (Figure 4C), blocking the pore throat space (Figure 4D) and significantly reducing the effective flow paths and resulting in lower permeability. From the SEM analysis, we infer that the formation of irregular particles from damaged surfaces, combined with the migration of fines at high flow rates, might be the reason for the reduced oil permeability relative to the apparent gas permeability in the evaluated sandstone samples.
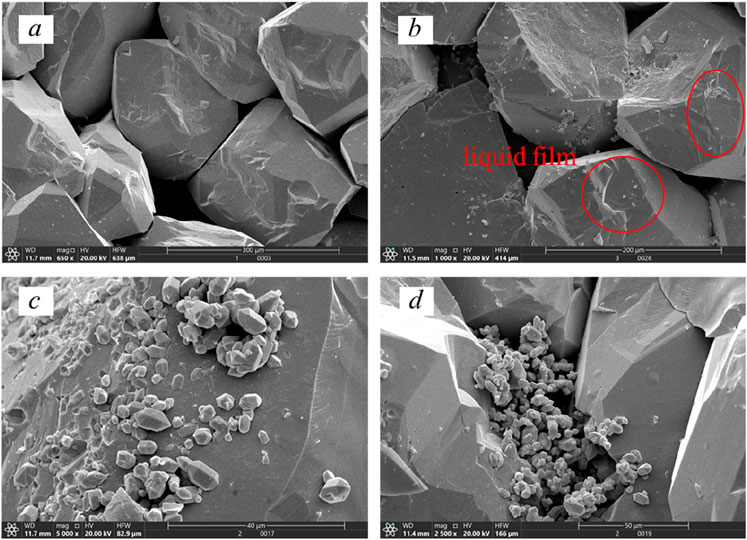
Figure 4. SEM images of Fontainebleau sandstones post-kerosene flooding reveal: (A) Prior to the experiment, neither water film formation nor migration was observed; (B) The formation of a liquid film on quartz particle surfaces; (C) A fractured quartz surface; (D) Pore throat obstructions resulting from fine particle migration.
Fontainebleau sandstones are notably characterized by a strong water-wet nature (Montaron and Han, 2009; Jiang et al., 2011; Al-Yaseri et al., 2022; Al-Yaseri et al., 2023). Even in “as-received” conditions, thin water films tend to form on the pore surfaces. Although the samples are subjected to vacuuming and subsequent oil flooding, the inherent stability of the quartz surface might limit the degree and efficacy of wettability alteration from water-wet to oil-wet. As a result, the water permeability of Fontainebleau sandstones could be less than that of kerosene permeability, largely due to this wettability.
Similar to Fontainebleau samples, the ko values of Y sandstones are also less than the slip-corrected permeability k∞ (Figure 3), exhibiting a linear relationship described by ko = 0.61k∞. SEM images of a Y sandstone, taken post-kerosene flooding, reveal fractured surfaces resulting from the flooding (as illustrated in Figure 5A). Interestingly, the images also depict the migration of calcite particles. This phenomenon could be attributed to the inherent fragility of calcite compared to quartz when subjected to the high viscous forces during kerosene flooding. Figure 5C also reveals the blockage of pore throats, which could potentially hinder liquid permeability. In contrast to the Fontainebleau sandstones, Y sandstones display no visible water film. Additionally, the reduced pore throat size in Y sandstones substantially limits the effective flow path for kerosene, resulting in a more pronounced decrease in permeability.
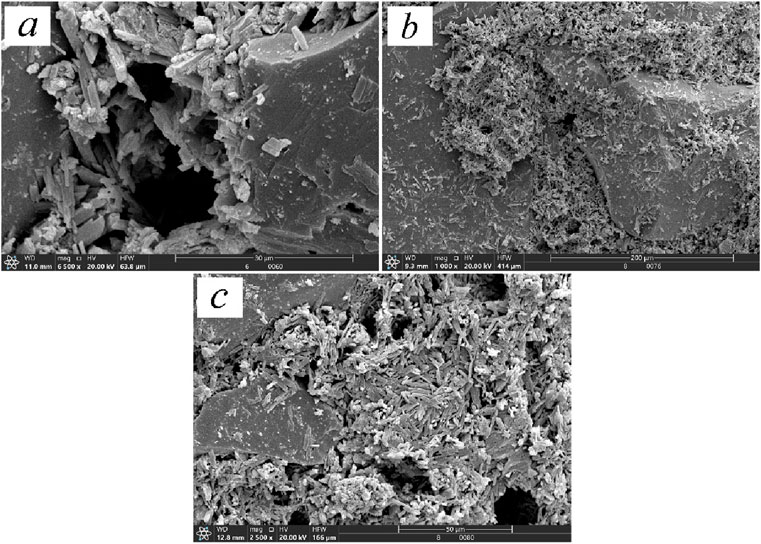
Figure 5. SEM images of Y sandstones post-kerosene flooding depict: (A) Fractured quartz surfaces; (B) Migration of calcite particles; (C) Pore throat obstructions due to accumulated calcite particles.
Interestingly, the discrepancies between kerosene permeability and slip-corrected permeability values are notably smaller for Fontainebleau sandstones compared to Y sandstones. Based on Chen et al. (2016), the correlation between the slip factor b and k∞/ϕ is calculated using Equation 2, as shown below:
where β and m are fitting parameters. Heid et al. (1950) characterized the index m as a metric for the complexity and uniformity of a pore system. An ideal cylindrical capillary bundle model is associated with a value of 0.5. By fitting the experimental data using the above equation (Figure 6), the expressions for different sandstones are obtained and summarized in Table 3. The index m value for Fontainebleau sandstone samples closely approached 0.5, suggesting a more uniform pore distribution than in Y sandstones. This uniformity is likely due to the pronounced quartz content in Fontainebleau sandstones, which contributes to enhanced grain sorting.
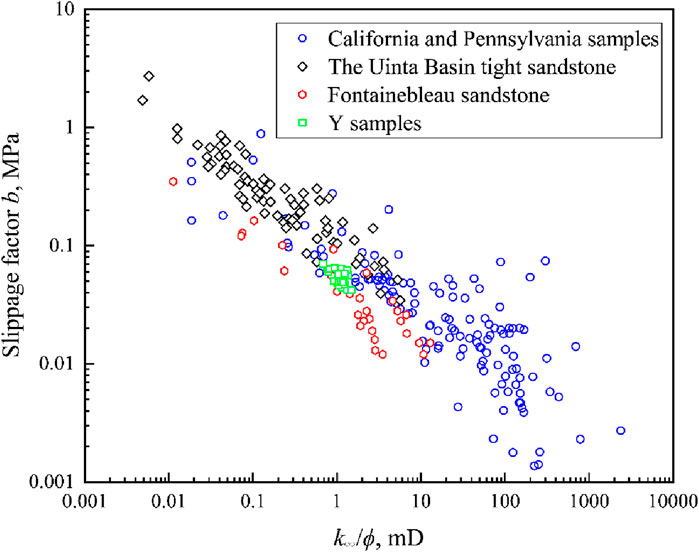
Figure 6. Relationship between slippage factor b and k∞/ϕ.
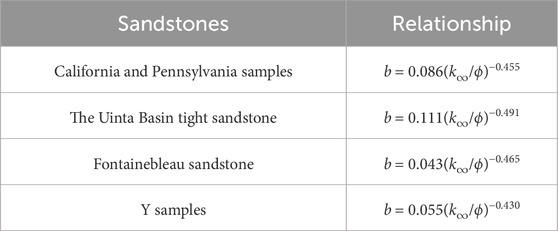
Table 3. Table of the relationship between b and k∞/ϕ in various types of sandstones.
The correlation distinctly indicates that as k∞/ϕ increases, b decreases. Given that our experimental data suggests Y sandstones have a larger porosity and smaller permeability, the slippage effect for Y sandstones is more pronounced as Equation 1 (Sampath and Keighin, 1982). As a result, the disparity between ko and the k∞ is expected to be greater.
5 Conclusion
In this study, we assessed the permeability of 30 Fontainebleau samples and 30 Y samples utilizing nitrogen and kerosene as the medium. Our findings can be summarized as follows:
(1) In both Fontainebleau and Y sandstones, the Kerosene permeability ko was smaller than the Klinkenberg-corrected gas permeability k. Specifically, for Fontainebleau sandstones, where ko is 0.88 times k∞, while for Y sandstones, ko is 0.61 times k∞.
(2) The presence of liquid films on rock surfaces and particle migration within pore throats contribute to the permeability disparity between liquid and gas.
(3) The correlation between the slippage factor b and k∞/ϕ for both Fontainebleau sandstones and Y sandstones have a somewhat good fit, which accords with previous data.
(4) When compared to Y sandstones, the kerosene permeability ko in Fontainebleau sandstones was more aligned with the Klinkenberg-corrected gas permeability k∞. This is because the slippage effect was more pronounced in Y sandstones.
Data availability statement
The original contributions presented in the study are included in the article/supplementary material, further inquiries can be directed to the corresponding authors.
Author contributions
XY: Conceptualization, Data curation, Formal Analysis, Investigation, Methodology, Project administration, Resources, Writing–original draft, Writing–review and editing. BK: Data curation, Resources, Validation, Writing–original draft. BX: Data curation, Methodology, Writing–original draft. HW: Writing–review and editing. CZ: Conceptualization, Formal Analysis, Writing–review and editing. KJ: Investigation, Writing–review and editing. XL: Formal Analysis, Methodology, Resources, Validation, Writing–original draft.
Funding
The author(s) declare that financial support was received for the research, authorship, and/or publication of this article. This work was supported by the Youth Program of National Natural Science Foundation of China (41902157), the Joint Fund of the National Natural Science Foundation of China (U1562217).
Conflict of interest
Authors XY, BK, and HW were employed by China Zhenhua Oil Co., Ltd. Authors XY, BX, HW, CZ, and KJ were employed by Chengdu Northern Petroleum Exploration and Development Technology Co. Ltd.
The remaining author declares that the research was conducted in the absence of any commercial or financial relationships that could be construed as a potential conflict of interest.
Generative AI statement
The author(s) declare that no Generative AI was used in the creation of this manuscript.
Publisher’s note
All claims expressed in this article are solely those of the authors and do not necessarily represent those of their affiliated organizations, or those of the publisher, the editors and the reviewers. Any product that may be evaluated in this article, or claim that may be made by its manufacturer, is not guaranteed or endorsed by the publisher.
References
Aksu, I., Bazilevskaya, E., and Karpyn, Z. T. (2015). Swelling of clay minerals in unconsolidated porous media and its impact on permeability. GeoResJ 7, 1–13. doi:10.1016/j.grj.2015.02.003
Al-Khdheeawi, E. A., Mahdi, D. S., Yuan, Y., and Iglauer, S. (2023). Influence of clay content on CO2-rock interaction and mineral-trapping capacity of sandstone reservoirs. Energies 16 (8), 3489. doi:10.3390/en16083489
Al-Yaseri, A., Esteban, L., Giwelli, A., Abdel-Azeim, S., Sarout, J., and Sarmadivaleh, M. (2023). Impact of wettability on storage and recovery of hydrogen gas in the lesueur sandstone formation (Southwest hub project, Western Australia). Int. J. Hydrogen Energy. 48, 23581–23593. doi:10.1016/j.ijhydene.2023.03.131
Al-Yaseri, A., Esteban, L., Giwelli, A., Sarout, J., Lebedev, M., and Sarmadivaleh, M. (2022). Initial and residual trapping of hydrogen and nitrogen in Fontainebleau sandstone using nuclear magnetic resonance core flooding. Int. J. Hydrogen Energy 47 (53), 22482–22494. doi:10.1016/j.ijhydene.2022.05.059
Bakhshian, S., Rabbani, H. S., Hosseini, S. A., and Shokri, N. (2020). New insights into complex interactions between heterogeneity and wettability influencing two-phase flow in porous media. Geophys. Res. Lett. 47, e2020GL088187. doi:10.1029/2020GL088187
Bernabé, Y., Zamora, M., Li, M., Maineult, A., and Tang, Y. B. (2011). Pore connectivity, permeability, and electrical formation factor: a new model and comparison to experimental data. J. Geophys. Res. Solid Earth 116 (B11). doi:10.1029/2011JB008543
Bikkina, P., Wan, J., Kim, Y., Kneafsey, T. J., and Tokunaga, T. K. (2016). Influence of wettability and permeability heterogeneity on miscible CO2 flooding efficiency. Fuel 166, 219–226. doi:10.1016/j.fuel.2015.10.090
Bourbie, T., and Zinszner, B. (1985). Hydraulic and acoustic properties as a function of porosity in Fontainebleau sandstone. J. Geophys. Res. Solid Earth 90 (B13), 11524–11532. doi:10.1029/JB090iB13p11524
Chen, M., Li, M., Wang, Y., Zhao, J. Z., and Xiao, W. L. (2016). The permeability of fontainebleau sandstone to gases and liquids. Pet. Sci. Technol. 34 (9), 845–852. doi:10.1080/10916466.2016.1172087
Duan, Q., Chen, J., and Yang, X. (2020). A comparison of gas and water permeability in clay-bearing fault and reservoir rocks: experimental results and evolution mechanisms. J. Geophys. Res. Solid Earth 125 (7), e2019JB018278. doi:10.1029/2019jb018278
Duan, Z., Skoczylas, F., Wang, C., and Talandier, J. (2021). Hydric cycle impacts on COx argillite permeability and young’s modulus. Rock Mech. Rock Eng. 54, 1129–1147. doi:10.1007/s00603-020-02258-1
Gaus, G., Amann-Hildenbrand, A., Krooss, B. M., and Fink, R. (2019). Gas permeability tests on core plugs from unconventional reservoir rocks under controlled stress: a comparison of different transient methods. J. Nat. Gas. Sci. Eng. 65, 224–236. doi:10.1016/j.jngse.2019.03.003
Golsanami, N., Jayasuriya, M. N., Yan, W., Fernando, S. G., Liu, X., Cui, L., et al. (2022). Characterizing clay textures and their impact on the reservoir using deep learning and Lattice-Boltzmann simulation applied to SEM images. Energy 240, 122599. doi:10.1016/j.energy.2021.122599
Heid, J. G., McMahon, J. J., Nielsen, R. F., and Yuster, S. T. (1950). “Study of the permeability of rocks to homogeneous fluids,” in Drilling and production practice (American Petroleum Institute).
Huang, R., Lei, Q., Chen, J., Weng, D., Wang, X., and Liang, H. (2022). Gas content prediction model of water-sensitive shale based on gas–water miscible competitive adsorption. Pet. Sci. Technol. 42, 1841–1863. doi:10.1080/10916466.2022.2149799
Ibrahim, D. S., Sami, N. A., and Balasubramanian, N. (2017). Effect of barite and gas oil drilling fluid additives on the reservoir rock characteristics. J. Pet. Explor. Prod. Technol. 7, 281–292. doi:10.1007/s13202-016-0258-2
Ji, S. H., Lee, H. B., Yeo, I. W., and Lee, K. K. (2008). Effect of nonlinear flow on DNAPL migration in a rough-walled fracture. Water Res. Res. 44 (11). doi:10.1029/2007WR006712
Jiang, L., Sun, J., Liu, X., and Wang, H. (2011). Study of different factors affecting the electrical properties of natural gas reservoir rocks based on digital cores. J. Geophys. Eng. 8 (2), 366–371. doi:10.1088/1742-2132/8/2/021
Kim, K., and Makhnenko, R. Y. (2020). Coupling between poromechanical behavior and fluid flow in tight rock. Transp. Porous Media 135, 487–512. doi:10.1007/s11242-020-01484-z
Klinkenberg, L. J. (1941). “The permeability of porous media to liquids and gases,” in Drilling and production practice, 200–213.
Luo, X., Jiang, G., and Yang, L. (2023). Experimental investigation of formation damage during drilling of ultradeep fractured carbonate reservoir. Geomech. Energy Environ. 33, 100437. doi:10.1016/j.gete.2023.100437
Mehraban, M. F., Farzaneh, S. A., Sohrabi, M., and Sisson, A. (2022). Fluid-fluid interactions inducing additional oil recovery during low salinity water injection in inefficacious presence of clay minerals. Fuel 308, 121922. doi:10.1016/j.fuel.2021.121922
Mirzaei-Paiaman, A., Saboorian-Jooybari, H., Chen, Z., and Ostadhassan, M. (2019). New technique of True Effective Mobility (TEM-Function) in dynamic rock typing: reduction of uncertainties in relative permeability data for reservoir simulation. J. Pet. Sci. Eng. 179, 210–227. doi:10.1016/j.petrol.2019.04.044
Montaron, B., and Han, M. (2009). “A connectivity model for the electrical conductivity of sandstone rocks,” in SPWLA Annual Logging Symposium (SPWLA-2009). Available at: https://www.researchgate.net/publication/290855651_A_CONNECTIVITY_MODEL_FOR_THE_ELECTRICAL_CONDUCTIVITY_OF_SANDSTONE_ROCKS
Sampath, K., and Keighin, C. W. (1982). Factors affecting gas slippage in tight sandstones of cretaceous age in the Uinta basin. J. Pet. Technol. 34 (11), 2715–2720. doi:10.2118/9872-PA
Sun, B. J., Li, X. F., Wang, Z. Y., Ma, B. J., and He, H. K. (2023). Laboratory investigation of the effect of the pore pressure on argillaceous siltstone permeability. Eng. Geol. 317, 107067. doi:10.1016/j.enggeo.2023.107067
Tanikawa, W., and Shimamoto, T. (2009). Comparison of Klinkenberg-corrected gas permeability and water permeability in sedimentary rocks. Int. J. Rock Mech. Min. Sci. 46 (2), 229–238. doi:10.1016/j.ijrmms.2008.03.004
Wang, L., Xue, Y., Cao, Z., Wu, X. J., Dang, F. N., and Liu, R. (2023). Mechanical properties of high-temperature granite under liquid nitrogen cooling. Geofluids 2023, 1–23. doi:10.1155/2023/3819799
Wang, W., Ke, L., and Gu, Y. (2024). A strain-controlled finite strain model for CRD consolidation of saturated clays considering non-linear compression and permeability relationships. Water 16 (19), 2858. doi:10.3390/W16192858
Wang, Z., Qiu, Y., Guo, P., Du, J., Liu, H., Hu, Y., et al. (2019). Experimental investigation of the damage mechanisms of drilling mud in fractured tight gas reservoir. J. Energy Resour. Technol. 141 (9). doi:10.1115/1.4043247
Zhang, D., Ranjith, P. G., Perera, M. S. A., and Zhang, C. P. (2020). Influences of test method and loading history on permeability of tight reservoir rocks. Energy 195, 116902. doi:10.1016/j.energy.2020.116902
Zhang, H., Abderrahmane, H., Al Kobaisi, M., and Sassi, M. (2021). Pore-scale characterization and pnm simulations of multiphase flow in carbonate rocks. Energies 14 (21), 6897. doi:10.3390/en14216897
Zhang, K., Wang, L., Liu, Z., Li, G., Ma, S., Liu, Z., et al. (2024). Experimental study of permeability characteristics of fracture-hosted hydrate-bearing clay sediments under triaxial shear. Geoenergy Sci. Eng. 241, 213183. doi:10.1016/J.GEOEN.2024.213183
Zhou, C., Ren, F., Wang, Z., Chen, W., and Wang, W. (2017). Why permeability to water is anomalously lower than that to many other fluids for cement-based material? Cem. Concr. Res. 100, 373–384. doi:10.1016/j.cemconres.2017.08.002
Keywords: Klinkenberg-corrected gas permeability, kerosene, liquid film, fine migration, slippage factor
Citation: Yang X, Kang B, Xu B, Wang H, Zhou C, Jiang K and Li X (2025) Experimental study of rock permeability in different fluid media: a case study of two clay-free sandstones. Front. Earth Sci. 12:1512685. doi: 10.3389/feart.2024.1512685
Received: 17 October 2024; Accepted: 18 December 2024;
Published: 07 January 2025.
Edited by:
Shuang Zheng, Aramco Services Company, United StatesReviewed by:
Ting Zhao, Yan’an University, ChinaJiajing Chang, China University of Petroleum, Beijing, China
Copyright © 2025 Yang, Kang, Xu, Wang, Zhou, Jiang and Li. This is an open-access article distributed under the terms of the Creative Commons Attribution License (CC BY). The use, distribution or reproduction in other forums is permitted, provided the original author(s) and the copyright owner(s) are credited and that the original publication in this journal is cited, in accordance with accepted academic practice. No use, distribution or reproduction is permitted which does not comply with these terms.
*Correspondence: Xin Yang, eHdsbHlhbmdAMTYzLmNvbQ==; Xingfu Li, MjIxNTU0MTFAcXEuY29t