 Fangbo Hu1,2
 Junjie Ren3,4,5*
- 1School of Emergency Management Science and Engineering, University of Chinese Academy of Sciences, Beijing, China
- 2National Institute of Natural Hazards, Ministry of Emergency Management of China (MEMC), Beijing, China
- 3School of Earth Sciences and Resources, China University of Geosciences, Beijing, China
- 4Key Laboratory of Compound and Chained Natural Hazards Dynamics, MEMC, Beijing, China
- 5Key Laboratory of Intraplate Volcanoes and Earthquakes (China University of Geosciences, Beijing), Ministry of Education, Beijing, China
Large strike-slip earthquakes are generally characterized by long surface rupture zones and relatively concentrated displacement distribution. The displacements on main seismogenic faults have been well studied and assessed by numerous empirical relations. Detailed mapping of the deformation zone of strike-slip earthquakes in the past decades indicates that distributed ruptures beyond the main faults have controlled the width of surface deformation zones and influenced the distribution of damages and earthquake-induced geological disasters. Therefore, the displacement hazard assessment from distributed surface rupture along strike-slip faults is urgent for disaster prevention and mitigation and the seismic safety of linear engineering. The Tibetan Plateau is marked by a series of strike-slip faults accompanied by lateral extrusion of material due to the Cenozoic collision of the Indian and Eurasian plates. In this study, we collected the surface rupture data of five strike-slip earthquakes in the Tibetan Plateau during the past decades, including the 1997 Mani (
1 Introduction
Large strike-slip earthquakes are marked generally by long surface ruptures and relatively narrow deformation zones (Xu et al., 2006; Choi et al., 2018; Antoine et al., 2022; Nurminen et al., 2022). The displacement on a strike-slip fault is always estimated by empirical relations between magnitude and coseismic displacement based on surface rupture measurements of large earthquake cases (Wells and Coppersmith, 1994; Cheng et al., 2020; Shaw, 2023). However, detailed mapping of surface ruptures of recent strike-slip earthquakes demonstrates that the coseismic displacement of surface ruptures occurs on the main fault plane and associated secondary structures (e.g., Antoine et al., 2022; Liu-Zeng et al., 2024). The displacement on the secondary structures is commonly accommodated by the distributed ruptures in a wide zone (Figure 1). In some cases, the role of distributed displacement is more than that on the main fault (Antoine et al., 2022; Liu-Zeng et al., 2024). This type of distributed displacement caused a wider surface rupture zone and affected the distribution of coseismic damages and earthquake-triggered geological hazards. It is urgent to assess the distributed displacement hazard of strike-slip faults for seismic safety of large linear engineering and seismic disaster prevention and mitigation.
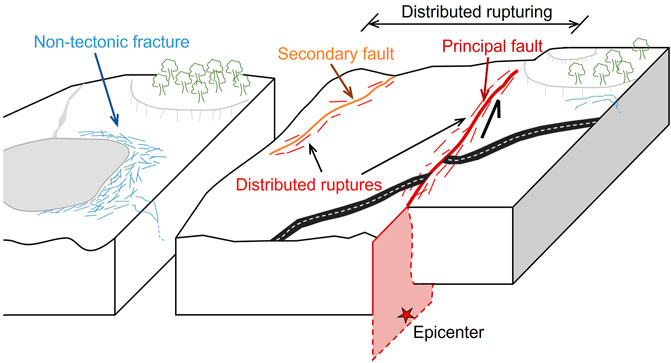
Figure 1. Schematic diagram of surface rupture patterns caused by a large strike-slip earthquake.
Increasing studies in the past 20 years have been conducted on evaluating the displacement from active strike-slip faults (Lee and Trifunac, 1995; Peter, 2010; Inoue et al., 2020; Nurminen et al., 2020; Visage et al., 2023). A Probabilistic fault displacement hazard analysis (PFDHA) framework was first proposed based on permanent fault displacements and the classical probabilistic seismic hazard analysis was applied to assess the seismic risk of the Yucca Mountain nuclear waste disposal project in the United States (Youngs et al., 2003). When more attention focused on the distribution of surface displacement, six types of regression curves were used to fit the coseismic surface slip distribution of historical earthquakes and the spatial distribution pattern of surface displacement of large earthquakes along their seismogenic fault strike were explored (Wesnousky, 2006; Wesnousky, 2008). Since many related studies had been carried out in America, researchers tried to conduct similar method in other regions, using the actual seismic data in Japan with the PFDHA method to establish a surface-rupturing fault displacement prediction model which is applicable to Japan (Takao et al., 2013). But these studies do not consider the effect of distributed ruptures on the spatial distribution of coseismic displacement along a strike-slip fault. A unified method for calculating on-fault and off-fault displacement was presented based on fault sections with different geometry and structures. The off-fault displacement is similar to distributed displacement and may include some deformation that does not generate surface ruptures (Antoine et al., 2022). In addition, the distribution curve of coseismic displacements perpendicular to the fault strike is inconsistent with the specific coseismic offset data of large earthquakes (Petersen et al., 2011). Further work tried to mainly focus on distributed ruptures, the distance from the main fault was taken into account in a probability model to predict the displacement distribution of distributed rupture crossing the fault traces using surface rupture data from five strike-slip earthquakes in northern America. These five earthquakes span a range of magnitudes between
In western China, the increasing seismic potential of many strike-slip faults poses a high risk of the displacement of linear engineers across active faults. Especially the 2022 Menyuan earthquake (
In the Tibetan Plateau, several large earthquakes along large strike-slip faults have been well studied, and associated detailed surface ruptures have been mapped (Figure 2) (Li et al., 2012; Ren and Zhang, 2019; Yuan et al., 2021; Ren et al., 2022; Li et al., 2023; Liu-Zeng et al., 2024), providing an opportunity to construct the model of displacement hazard of distributed ruptures from strike-slip faults in China. In this study, we collected the recent surface rupture data of five strike-slip earthquakes in the Tibetan Plateau and built the probability model to predict the displacement hazard of distributed rupture crossing the fault trace when a certain magnitude occurs. This study not only proposes a workflow for the probabilistic displacement hazard of distributed ruptures from strike-slip faults but also supports the seismic hazard assessment of linear engineering crossing strike-slip faults in the Tibetan Plateau.
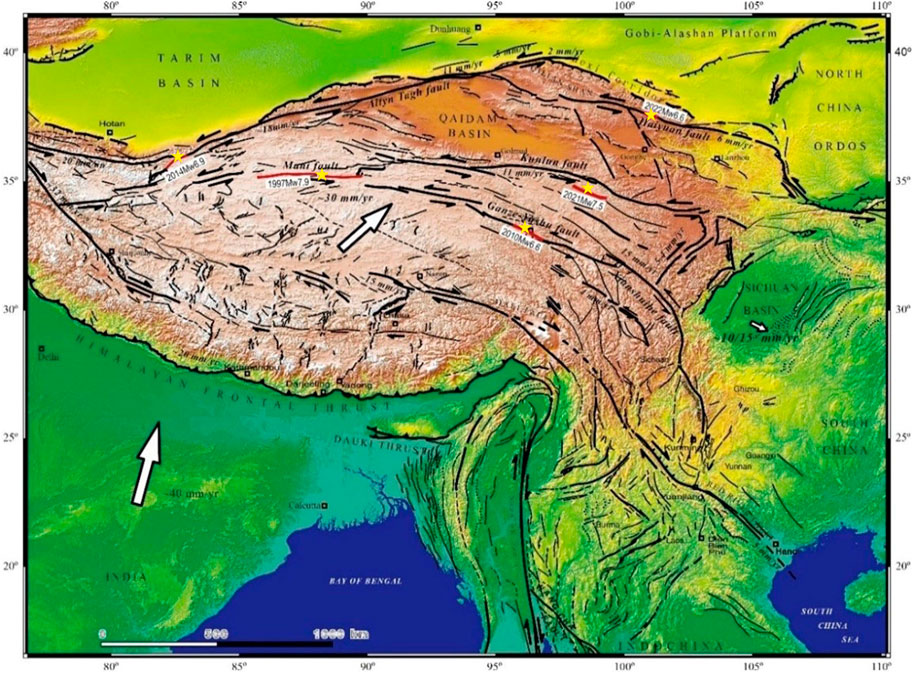
Figure 2. Active faults of the Tibetan Plateau and the recent well-studied surface-rupturing strike-slip earthquakes. Adapted from Tapponnier et al. (2001). Yellow stars represent the epicenters of the five earthquakes used in this study. Red lines show the surface rupture zones of the five earthquakes used in this study.
2 Tectonic setting of the Tibetan plateau
The Tibetan Plateau, controlled by the Cenozoic Indian-Eurasian collision, forms the most intense area of tectonic activity in China. Accompanied by the uplift of the plateau, the material began to the outward extrusion and produced many large strike-slip faults, such as the Kunlun, Altyn Tagh, Haiyuan, Ganze-Yushu-Xianshuihe faults (Molnar and Tapponnier, 1978; Xu et al., 2005; Ren et al., 2013). These faults undergo the late Quaternary slip rate of ∼5–10 mm/yr and have ruptured in serval large earthquakes in the past 20 years (Kirby et al., 2007; Ren et al., 2013; Yao et al., 2019).
We choose five strike-slip earthquakes in the northern Tibetan Plateau: the 1997 Mani (
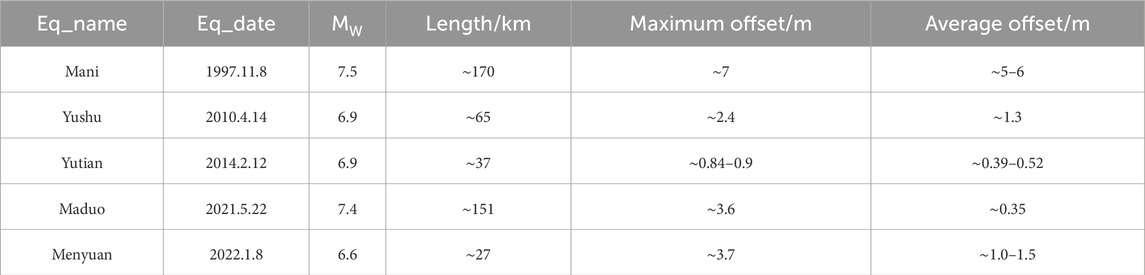
Table 1. The basic characteristic information of the five earthquakes in our study.
The 1997 Mani earthquake ruptured the left-lateral Mani fault, a possible westernmost segment of the Kunlun fault (Shan et al., 2006; Ren and Zhang, 2019). This earthquake occurred in November 1997 when the temperature was below freezing point and the epicentral area was covered by permafrost. The rupture zone of the Baixue Lake section is located in the lacustrine plain and passes through a series of large-scale ice water alluvial fans, and the Chaoyang-Shuangduan Lake section created a fault-plug pond formed by seismic steep ridges blocking the flow of melting ice and snow (Ren and Zhang, 2019).
The 2010 Yushu earthquake occurred on the Yushu segment of the Ganz-Yushu fault (Li et al., 2012; Sun et al., 2012). Located in the alpine region at a high altitude, Longbao Lake and the surrounding water were frozen during this earthquake, leading to a unique surface rupture trace in such frozen regions: ice cracks. The ice fissure zone is distributed in a planar shape and large scale, accompanied by sand liquefaction, showing a normal component dipping the Longbao Lake (Sun et al., 2012).
The 2014 Yutian earthquake mainly ruptured the left-lateral strike-slip Altyn Tagh fault (ATF) system with normal-slip (Li et al., 2016; Yuan et al., 2021). The earthquake vibrations near the Xiaoerkule Lake caused the instability of the diluvial fan, and the landslide and graben system formed after the slide of the salty lake’s shoreline due to gravity, which belongs to the associated shallow deformation. This earthquake was located in the inner flow area of the Tibetan Plateau, in the middle of the rupture zone a thick loose sedimentary cover was formed based on the lake, which would magnify the seismic rupture in the shallow surface and enlarge the surface rupture width (Yuan et al., 2021).
The 2021 Maduo earthquake mainly ruptured the left-lateral strike-slip fault with a partly normal slip, the southeastern branch of the Kunlun fault zone, the Jiangcuo fault (Ren et al., 2022). This earthquake ruptured across a long-range area with complex landform, including many valleys, lakes, wetlands, grasslands, mountains and some sand dunes, etc (Pan et al., 2021; Ren et al., 2022). In the rupture section across Mustan Bridge, north of Huanghe Township and the valley of Yellow River, as the rupture zone is mainly distributed along the valley, a large number of tensile fractures parallel to the river channel are formed due to slope instability, accompanied by sandblasting water and sand liquefaction (Liu-Zeng et al., 2024).
The 2022 Menyuan earthquake mainly ruptured the left-lateral strike-slip fault with a slight thrust component, the middle segment of Qilian-Haiyuan fault (Xue et al., 2022; Li et al., 2023). This earthquake happened in winter when the Liuhuanggou River was frozen, causing the ice river surface and flood plain to break in the nature of thrust with the phenomenon of tension cracks on the bank slope and slope slide under the effect of gravity from slope instability on the right bank of the river, which may amplify the actual left-lateral offsets (Li et al., 2023).
With the continuous development of western China, a large number of pipeline projects have been built or are being built in the Tibetan Plateau region. The damages of strike-slip faulting can be found in these five earthquakes selected in this study: Maduo earthquake caused the serious collapse of Mustan Bridge as part of the Gongyu Expressway, which is a major traffic route (Ren et al., 2022); The dislocation of the Lanzhou-Urumqi High-speed Railway’s Daliang Tunnel caused by Menyuan earthquake directly disrupted the traffic in this section for up to 18 months (Li et al., 2023); Yushu earthquake caused serious damage to the national and provincial trunk roads and transportation infrastructure in the Yushu area, with an affected area of 20,000 square kilometers (Li et al., 2012). Therefore, predicting the distribution of surface rupture caused by strike-slip earthquakes in the Tibetan Plateau region can help maintain the safety of transportation arteries in the region and provide reference for avoidance locations for transportation arteries currently being built or planned to be built in the region, in order to reduce potential damage in the future.
3 The rupture displacement probability model
Rodriguez Padilla and Oskin (2023) proposed a mathematical approach to estimate fault displacement based on data from detailed surface-ruptures strike-slip earthquakes:
Equation 1 shows the probability per unit area of finding a distributed rupture that accommodates a displacement that exceeds a displacement threshold at a given distance from the principal fault. The equation is produced by the joint probability of two parts: the former
In which
With reference to the inverse power law used in Equation 2, we try to analyze the relationship between the displacement measurements and the distance to the principal fault trace:
In which
To deeply understand the meanings of above parameters, we put them back in actual situation to help with this. The parameter
By comparing several distribution functions, it is found that the population of displacement measurements can be better described by exponential distributions, and the distribution can be described as follows:
Combining Equations 3, 4 yields:
This equation is a probability density function (PDF) of displacement measurements with distance
Since the model focuses on the displacements on the distributed ruptures which do not tend to be of large value, the evaluation limits the threshold
Combining Equations 2, 7 yields the final model:
This model is presented to calculate the probability per unit area of finding a distributed rupture that accommodates a displacement that exceeds a displacement threshold at a given distance from the principal fault (Rodriguez Padilla and Oskin, 2023). This probability model can quantify the displacement hazard of surface ruptures and estimate the expected displacement distribution caused by strike-slip faults, to provide reference data for the design, evaluation, and maintenance of engineering structures and lifelines located near or across strike-slip faults.
The entire probability model involves the calculation of multiple unknown parameters, which will all influence the final results. Therefore, after clarifying the model-building process, a brief analysis of the characteristics of each parameter is needed, and then the expected results of the theoretical model should be summarized as a reference for further research.
The origin rupture density
For the magnitude dependence of parameter
where parameters a and b are regression coefficients derived from the best fit of the data using the least square method, and all fitted data used are strike-slip earthquakes. When
According to the definition, the values of the exponents
The reasonable outputs of theoretical model should also be summarized after the analysis of the characteristics of each parameter. The reasonable results obtained after the establishment of the theoretical model are consistent. The rupture density curve from the fit of Equation 2 shows a downward trend, with certain fluctuations at the end; The scatter-fitting curve of displacement measurements from Equation 3 also showed a downward trend, and the scatters concentrated around the best fitting curve with a little isolated from the entirety.
Then comes to the final model output by Equation 8, it can be seen from the curve that the theoretical
In this study, we introduce the approach of Rodriguez Padilla and Oskin (2023) to the surface rupture dataset of large strike-slip earthquakes in the Tibetan Plateau and then build the displacement probability distribution model. By analyzing the model building process and output results of the theoretical model, we can summarize the reasonable results of the theoretical model and use it as a reference to guide the subsequent model-building work in China.
4 Data preprocessing
Detailed analysis of the surface rupture dataset indicates that the coseismic surface rupture zone of a large strike-slip earthquake consists primarily of principal ruptures along the main fault and secondary ruptures caused by the secondary fault or fault branch (Figure 1). In addition, minor fractures occurred outside of the main fault zone. These fractures are related to non-tectonic factors such as landslides, and gravity instability under seismic ground motion (Liu-Zeng et al., 2024). These minor fractures are generally located in the local environment and are not directly produced by fault displacement. Therefore, we should remove these minor fractures, and only tectonic ruptures are involved in our analysis.
After preliminary sorting of the five original earthquake data (map documents and statistical tables of displacement measurements at the rupture), it is found that the original data will record the surface rupture traces with event particularity caused by the earthquake itself due to structural characteristics and some other causes (Li et al., 2012; Li et al., 2016; Ren and Zhang, 2019; Pan et al., 2021; Xue et al., 2022). Since the model is expected to be applied to a wide range of the Tibetan Plateau, to reduce the impact of non-tectonic factors (such as seismic motion) on the model results, we formulate criteria for the screening of the original data combined with the rupture characteristics of the five typical earthquakes on the Tibetan Plateau, hoping to get more consistent data to obtain a more uniform result and model.
For the convenience of data storage and search, we store all the data in a standardized format after data filtering. After comparing the data processing methods of standardized empirical databases that have been generated in recent years (e.g., Ancheta et al., 2013; Chiou et al., 2008; Nurminen et al., 2022), we chose to refer to the Fault Displacement Hazards Initiative (FDHI) database hosted and maintained by the Natural Hazards Risk and Resilience Research Center at the University of California, Los Angeles, to conduct standardized processing of surface rupture data form these five earthquakes in China (Sarmiento, 2021). The buildup of the model in this study mainly needs two parts of data: surface rupture maps and surface rupture displacement measurement, which are sorted into ESRI Shapefile (*.SHP format) and table form, respectively, after standardized processing.
Based on the original data collected from these five earthquakes, we first screened the surface rupture traces based on the following four criteria (Figure 3):
(1) Through image comparison, the rupture traces around the water body are generally interpreted as resulting from the instability of the water body under seismic ground motion. These ruptures strike along the boundary of the water body and do not have a similar strike to the main fault. Such fractures are removed.
(2) The ruptures associated with landsliding of a local topography that deviate significantly from the orientation of the main fault were eliminated. These ruptures are generally distributed around a landslide and do not have a uniform direction.
(3) Remove the rupture traces originating from surface deformation in complex structural areas, such as large stepovers, the tips of a strike-slip fault, and so on.
(4) Previous studies indicate that the tectonic-related coseismic deformation generated by a strike-slip fault is generally not distributed in the area too far away from the principal fault (Xu et al., 2006; Sun et al., 2012; Antoine et al., 2022.) Combining the original rupture traces of these five typical earthquakes, we opted to retain the rupture traces within 1 km from the principal fault and exclude those located beyond this distance.
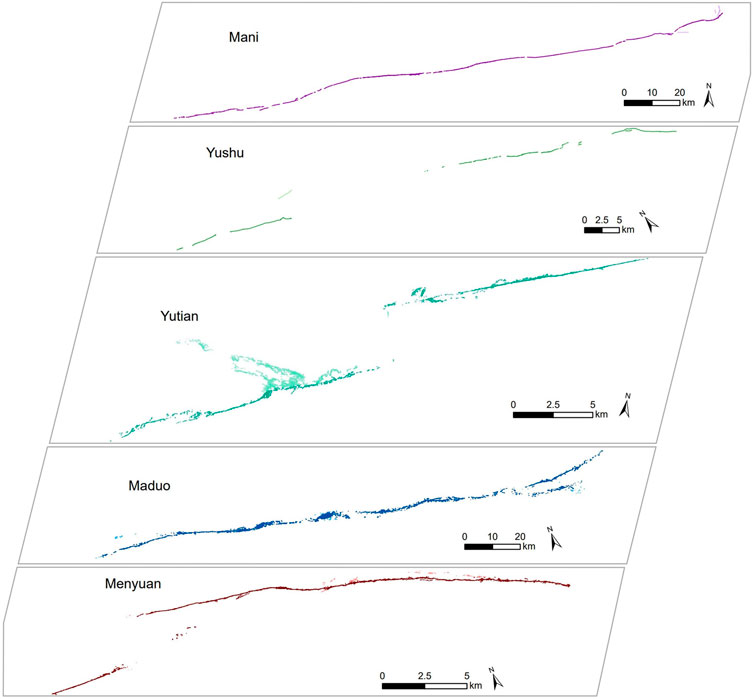
Figure 3. The mapped surface rupture traces of the Mani, Yushu, Yutian, Maduo, and Menyuan earthquakes. The traces in a light color are non-tectonic fractures, and the traces in a dark color are principal and secondary ruptures used in this study. The surface rupture data of Mani earthquake are from Ren and Zhang (2019). The data of Yushu earthquake are from Li et al. (2012), Sun et al. (2012). The data of Yutian earthquake are from Yuan et al. (2021). The data of Maduo earthquake are from Liu-Zeng et al. (2024), Pan et al. (2021), Ren et al. (2022), and the Menyuan data are from Li et al. (2023).
After completing the standardized filtering of the original surface rupture traces maps, the displacement measurements located on the removed rupture traces are also deleted to ensure the uniformity of the data used. Then we unified the format of surface rupture displacement measurements according to that of FDHI (Sarmiento, 2021). Currently, the displacement measurements for each earthquake as recorded by various scholars are typically documented and reported separately in the original data, including horizontal slip and vertical component (e.g., Li et al., 2012; Li et al., 2016; Pan et al., 2021; Li et al., 2023). It is important to note that we focus on the horizontal slip of a strike-slip rupture and the influence of other factors causing vertical slip in a local area is not considered in this study. Therefore, all original displacement measurements should be classified before calculation and organized into a uniform representation of net horizontal slip.
After all original data have been preprocessed, we conduct the following work such as quantifying the fracture density and describing the variation in displacement measurements at the fracture point with the distance from the main fault. We integrated the FDHI database’s definitions of principal rupture and the location of principal faults in each seismic event, and consequently, a simplified principal rupture trace was delineated (Figure 4). A singular, continuous fault trace was defined along the densely distributed and consistent principal ruptures. This approach can enhance the convenience of data processing in the subsequent model development by utilizing a limited number of rupture trace lines.
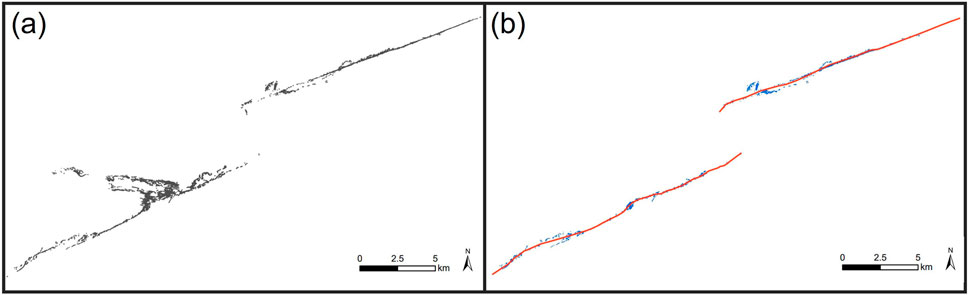
Figure 4. Preprocessing of the surface ruptures of the Yutian earthquake. (A) The original surface ruptures from high-resolution imagery and field observations. (B) The non-tectonic factures are removed after data preprocessing, and the main fault is highlighted in red.
5 Results of rupture-displacement probability model
After pre-processing of the original surface rupture data of these five earthquakes, we built our model based on these data. Firstly, the spatial distribution of surface rupture density is studied based on Equation 2. When all the rupture traces have been separated into segments at a 1 m interval, we calculated the smallest distance from each segment to the principal rupture trace, and fit the attenuation of surface rupture density for each earthquake based on these data (Figure 5).
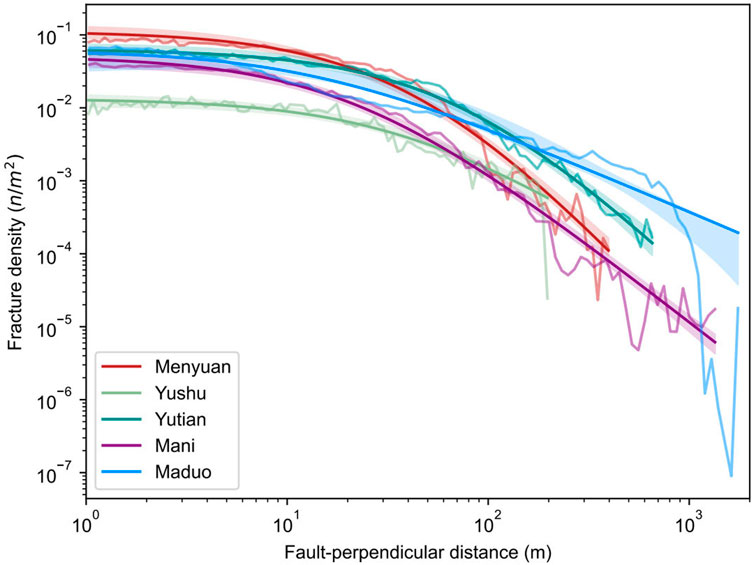
Figure 5. Rupture density distribution for the Mani, Yushu, Yutian, Maduo, and Menyuan earthquakes.
When the surface rupture density distribution for each earthquake has been obtained, we fit each decay with an affine-invariant ensemble sampler for Markov chain Monte Carlo (Goodman and Weare, 2010; Foreman-Mackey et al., 2013), setting the prior ranges of the values of the three unknown parameters in Equation 2 to estimate the maximum-likelihood values by using the actual surface rupture data of each earthquake (Table 2).
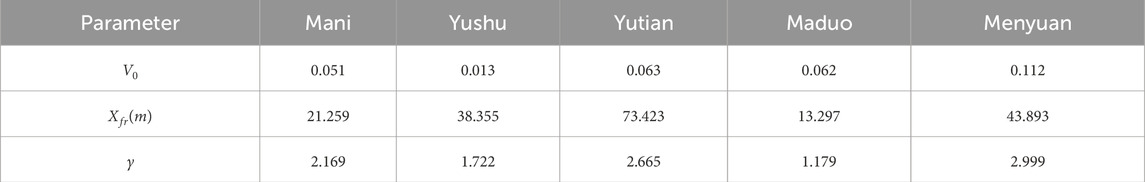
Table 2. Distribution of best-fit parameters for each event in Equation 2.
We follow a similar method to estimate the attenuation of displacement distribution with the fault-perpendicular distance in Equation 3: With the smallest distance of each displacement measurement point to the principal rupture trace calculated, we calculate the attenuation of the surface rupture displacement measurements for each earthquake (Figure 6).
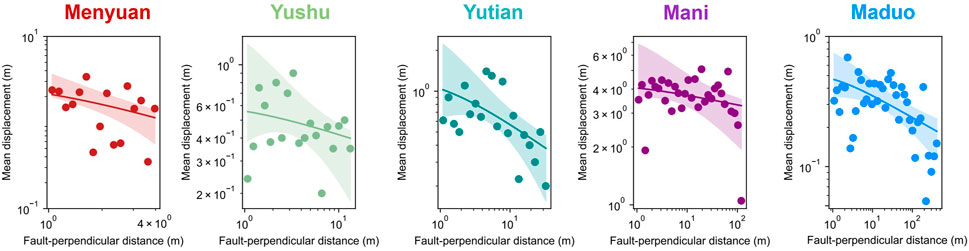
Figure 6. Distribution of displacement measurements for the Mani, Yushu, Yutian, Maduo, and Menyuan earthquakes.
When the decay of displacement measurements with fault-perpendicular distance for each earthquake has been obtained, we set the prior ranges of the values of the two unknown parameters in Equation 3 to estimate the maximum-likelihood values by using the actual surface rupture data of each earthquake (Table 3). Then, we build the probability model for each of the five earthquakes after obtaining the parameters for the final model (Figure 7).
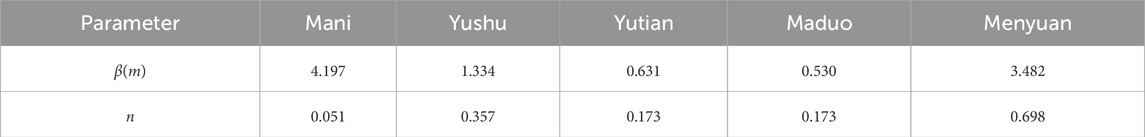
Table 3. Distribution of best-fit parameters for each event in Equation 3.
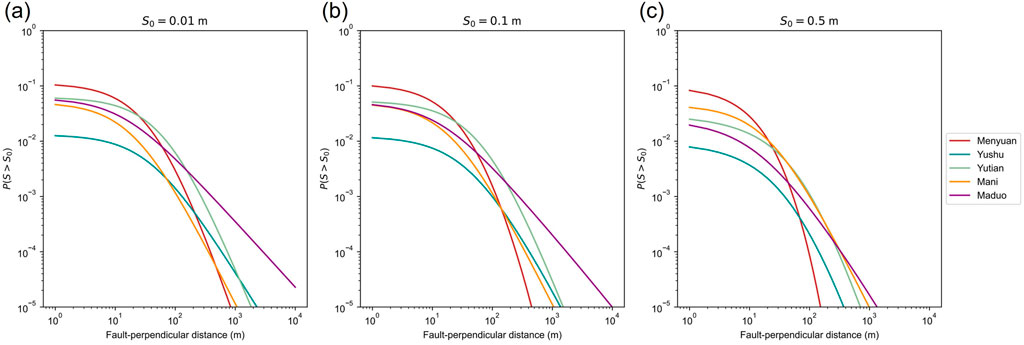
Figure 7. Curves representing the probability per square meter of finding a rupture hosting a displacement that exceeds threshold
As the individual models are built, we fit the parameters of the general model based on all the surface rupture data from these five earthquakes according to the above method (Table 4). About the value of
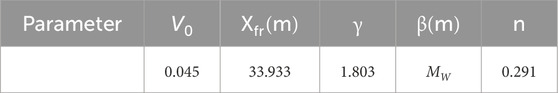
Table 4. Distribution of best-fit parameters for general model in Equation 8.
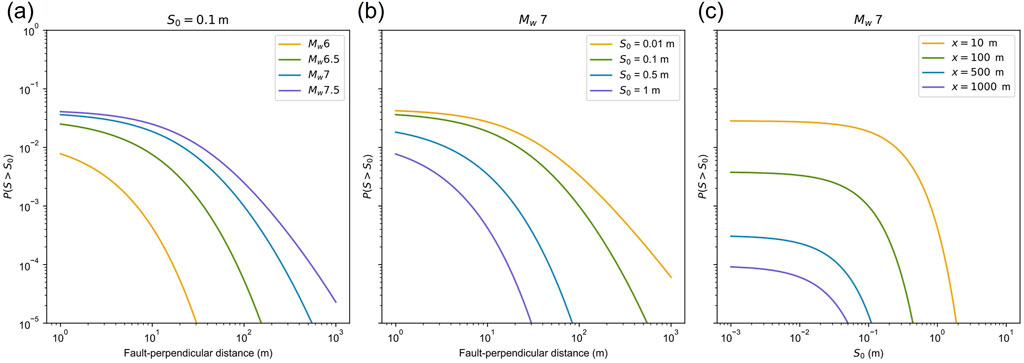
Figure 8. Curves showing the probability per unit area of finding a rupture accommodating a displacement that exceeds threshold
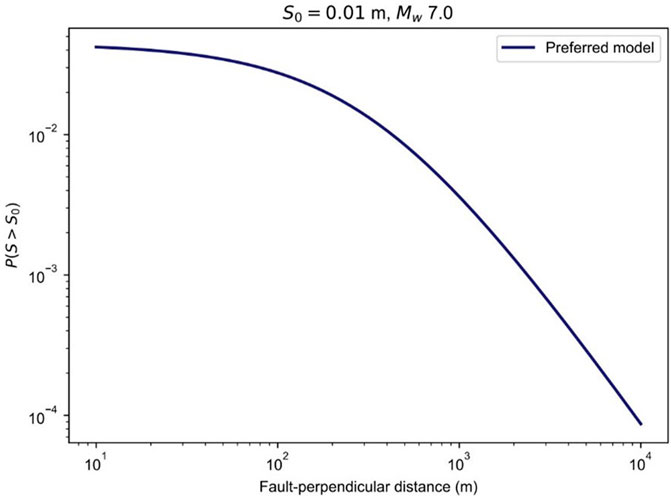
Figure 9. The general probabilistic fault displacement hazard analysis model expressing the probability of finding a rupture accommodating a displacement that exceeds threshold
6 Discussion
6.1 The effect of the data preprocessing on the model
As mentioned above, the original data of surface ruptures from field observations and high-revolutionary imagery include a large number of fractures related to non-tectonic factors. These non-tectonic fractures are distributed along a local environment and are not directly related to fault slip during the earthquake. Therefore, it is hard to be assessed by a general model. We compare the model result using the data before and after data preprocessing to address the role of data filtering.
The effect of the data-preprocessing work can be reflected in some results during the establishment of the general model. Before and after data filtering, the best-fitting rupture density attenuation for each of the five earthquakes demonstrates a downward trend, which aligns with expectations. Although the curves derived from the original data generally follow this downward trend, they exhibit several peaks and abrupt increases and decreases towards the end. Compared to the original data, these peaks correspond to fracture traces far from the principal fault, where surface fractures at these distal locations are predominantly influenced by local complicated structures, stopovers, or seismic vibrations similar to the Yutian earthquake (Yuan et al., 2021). The comparative results indicate that the filter of the original surface rupture traces of the five earthquakes based on established criteria can, to some extent, remove the discrepancies in peak distributions at the end of the rupture density attenuation curve arising from individual variations (Figure 10). The differences in distribution are primarily reflected in the number of peaks and their respective locations.
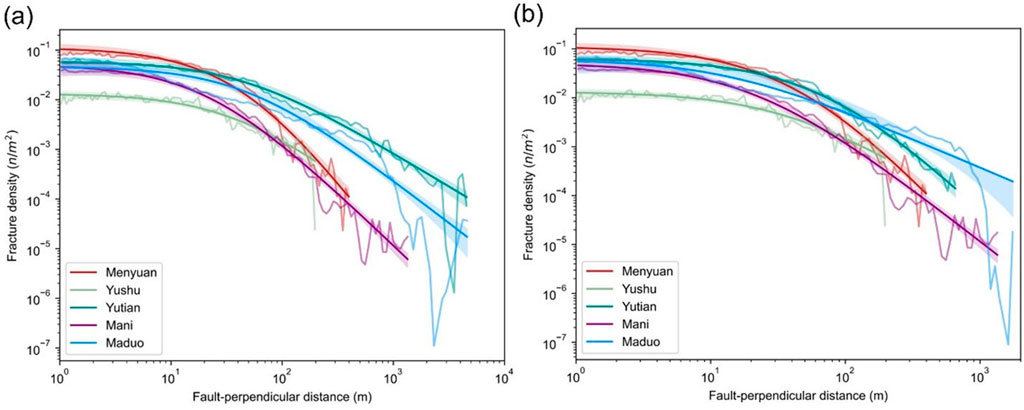
Figure 10. Comparison of rupture density before and after the data screening. (A) Before data screening. (B) After data screening.
Similar to the rupture density distribution, the best-fitting attenuation of displacement values also exhibits a decreasing trend, consistent with our expectation that surface rupture displacement values diminish with increasing distance from the principal fault. However, the distribution of the original actual displacement values markedly differs from that of the best-fitting case. The measurement and collection of original data primarily stem from field investigations, which can introduce measurement deviations. For instance, in the case of the Yushu earthquake, the displacement measurements show a small proximal value and a larger distal value, resulting in a lack of an obvious downward trend in the overall distribution (Figure 11). Consequently, the best-fitting situation approaches a horizontal line. The comparative results indicate that the selected displacement values, based on the established screening criteria, are generally too small near the principal fault or excessively large at greater distances. This suggests that the removal of these outliers can enhance the best-fitting results to some extent.
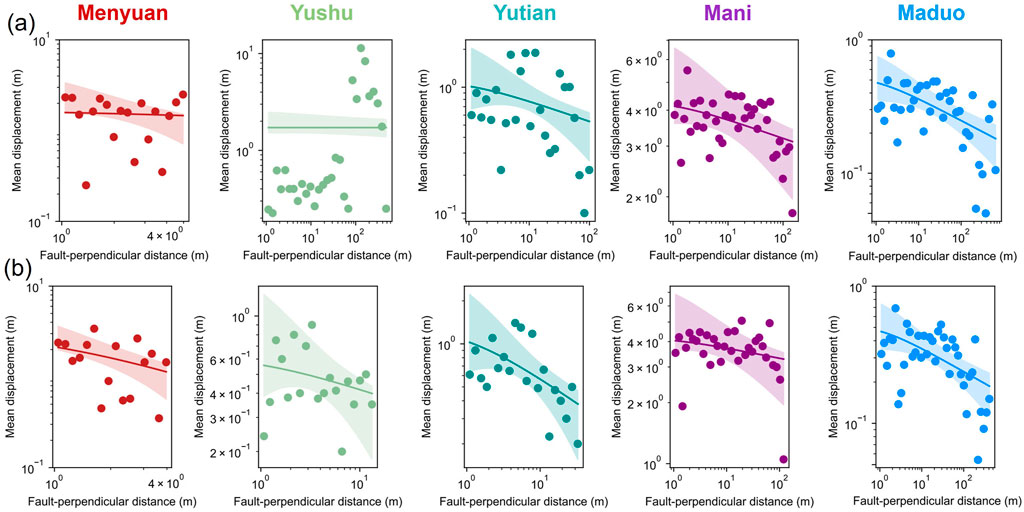
Figure 11. Comparison of the attenuation of the displacement distribution before and after the data screening. (A) Before data screening. (B) After data screening.
The comparative results demonstrate that screening the original seismic data according to established standards can improve the data quality. Upon completion of the screening process, the data consistency is initially enhanced through the organization of data formats, thereby increasing the efficiency of follow-up search and use. This enhancement is subsequently reflected in the model establishment, which exhibits more reasonable and consistent parameters and results, collectively validating the effectiveness of data filtering.
It should be pointed out here that the fitting curves of displacement values of Yutian, Yushu and Menyuan earthquakes were still not very good compared with that of Maduo and Mani earthquakes after the completion of data filtering, with the best-fitting curves tended to be horizontal which don’t show the ideal downward trend (Figure 11). Combined with the establishment principles of Formula 3 and the analysis of the distribution characteristics of displacement values of the ideal curves, the displacement values in the original seismic data will have the most intuitive impact on the fitting situation: Since the original seismic datasets we used were all from the field investigation and measurement work of different experts and scholars, the specific measurement and sorting methods involved were different, and such differences could not be completely eliminated by our current work; Besides, the original datasets of these three earthquakes includes fewer displacement values, for which the removal of several values may cause more obvious impact on the best-fitting curve. Considering the above two characteristics of every original seismic dataset, we only to some extent improved the quality of the results after the completion of data filtering, improving the best-fitting curve from basically being horizontal to decay with a relatively slow decline trend.
Therefore, the data filtering work established in our study can improve the quality of the original seismic data to a certain extent, but the differences existing in the field investigation and measurement process of the original data cannot be completely removed through this work, and will finally remain in the best-fitting curve after filtering: Usually the most intuitive manifestation is that the displacement values are not completely in line with our prediction of the theoretical value, resulting in the attenuation trend of the best-fitting curve is too small. Our data filtering is mainly established to obtain relatively uniform datasets under certain criterion to make the results of theoretical model more consistent. For the specific situation of Yutian, Yushu and Menyuan earthquakes, the quality of the data is improved as much as possible on the basis of the above differences in the process of data-collection.
6.2 The general model
After the establishment of the general model, we provide a Jupyter Notebook that allows users to put a displacement threshold
We preprocessed raw data from five earthquakes to enhance data standardization and established a general probability model of the surface rupture displacement distribution of strike-slip earthquakes. The magnitudes of these five earthquakes range from Mw 6.6 to 7.5, covering a wide range of probable magnitudes of large strike-slip earthquakes, which lets our model fairly representative. The final model can be applicable for this magnitude range. If a large strike-slip fault with a potential of earthquake larger than Mw 7.5, the applicability of this model is unknown. Maybe more data from larger earthquakes like the 2001 Mw 7.8 Kunlunshan earthquake needs to be added to our database. In addition, the five earthquakes in this study are from the Tibetan Plateau. The general model could be applied in other regions with caution.
This study assumes that only horizontal displacement occurs on the strike-slip fault, without considering the effect of fault dip changes on surface rupture. Many factors may influence the distribution characteristics of surface ruptures on strike-slip faults: (1) variations in fault dip angles can affect the distribution of surface ruptures; (2) complicated fault geometry such as fault bend, and stepover may enhance the width of deformation zone (Visage et al., 2023); (3) the near-surface properties of covers above the fault tip, such as overburden thickness, geological characteristics, and consolidation, may influence the rupture pattern on the surface (Nurminen et al., 2020).
These factors may have influenced the surface ruptures of the five earthquakes used in this study. In the Yutian earthquake, the thicker loose sedimentary cover around the lake amplified the seismic rupture and rupture width at shallow depths (Yuan et al., 2021). In the Maduo earthquake, an extremely wide deformation zone in the epicentral region was probably related to a stepover covered by the sand layer in the upper reach of the Yellow River (Ren et al., 2022; Liu-Zeng et al., 2024). In future work, we will consider more factors in the establishment of a model and improve the applicability of the general model.
7 Conclusion
Based on a systematic analysis of surface ruptures from the five strike-slip earthquakes in the Tibetan Plateau in the past decades, we construct a general probabilistic model for displacement hazards associated with distributed ruptures from strike-slip faults. The following conclusions can be drawn:
(1) This study summarizes a workflow for building localized models of displacement hazard for active faults based on surface ruptures from large earthquake cases (Figure 12).
(2) Data preprocessing of the original surface rupture data is essential to enhancing the reliability of the general model. We set criteria to screen the original data to improve the consistency of our model’s results to mainly make our model focused on the tectonic influence from strike-slip faults. We can add more actual seismic data and other possible factors in our future work to extend our research.
(3) The general probability model can be used to predict displacement hazard for distributed ruptures from surface-rupturing strike-slip faults with an earthquake potential of
(4) Current work has several limitations. Our model mainly focuses on the structural influence on the characteristics of surface ruptures for strike-slip faults with other factors removed during the data filtering, the range of our model’s application will be limited. When applied to the events with other factors, the rationality of the results should be assessed. Besides, with the magnitudes of the five earthquakes ranging from Mw 6.6 to 7.5, when applied out of such range the rationality of the results should be assessed.
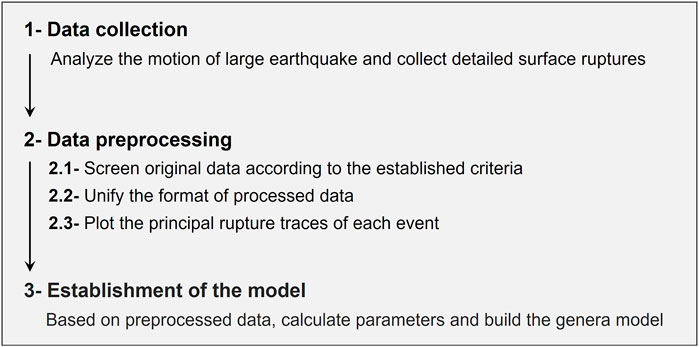
Figure 12. Overall workflow of the buildup of the model.
Data availability statement
The original contributions presented in the study are included in the article/supplementary material, further inquiries can be directed to the corresponding author.
Author contributions
FH: Data curation, Methodology, Software, Visualization, Writing–original draft. JR: Conceptualization, Funding acquisition, Supervision, Writing–review and editing.
Funding
The author(s) declare that financial support was received for the research, authorship, and/or publication of this article. This work was jointly supported by the National Natural Science Foundation of China (U2139201, 41941016).
Acknowledgments
We thank Zhikun JR, Zhaode Yuan, Kang Li, and Xinzhe Sun for the data collection of surface ruptures of large earthquakes. Special thanks are sent to Jia Cheng for useful discussions on the displacement hazard model.
Conflict of interest
The authors declare that the research was conducted in the absence of any commercial or financial relationships that could be construed as a potential conflict of interest.
Generative AI statement
The author(s) declare that no Generative AI was used in the creation of this manuscript.
Publisher’s note
All claims expressed in this article are solely those of the authors and do not necessarily represent those of their affiliated organizations, or those of the publisher, the editors and the reviewers. Any product that may be evaluated in this article, or claim that may be made by its manufacturer, is not guaranteed or endorsed by the publisher.
References
Ancheta, T. D., Darragh, R. B., Stewart, J. P., Seyhan, E., Silva, W. J., Chiou, B. S. J., et al. (2013). PEER NGA-west2 database. PEER Rep.
Antoine, S. L., Klinger, Y., Delorme, A., and Gold, R. D. (2022). Off-Fault deformation in regions of complex fault geometries: the 2013, Mw7.7, baluchistan rupture (Pakistan). J. Geophys. Res. Solid Earth 127 (11), e2022JB024480. doi:10.1029/2022JB024480
Cheng, J., Rong, Y., Magistrale, H., Chen, G., and Xu, X. (2020). Earthquake rupture scaling relations for mainland China. Seismol. Res. Lett. 91 (1), 248–261. doi:10.1785/0220190129
Chiou, B., Darragh, R., Gregor, N., and Silva, W. (2008). NGA project strong-motion database. Earthq. Spectra 24 (1), 23–44. doi:10.1193/1.2894831
Choi, J.-H., Klinger, Y., Ferry, M., Ritz, J.-F., Kurtz, R., Rizza, M., et al. (2018). Geologic inheritance and earthquake rupture processes: the 1905 M ≥ 8 tsetserleg-bulnay strike-slip earthquake sequence, Mongolia. J. Geophys. Res. Solid Earth 123 (2), 1925–1953. doi:10.1002/2017JB013962
Foreman-Mackey, D., Conley, A., Meierjurgen Farr, W., Hogg, D. W., Lang, D., Marshall, P., et al. (2013). emcee: the MCMC Hammer. Astrophys. Source Code Libr. 125, 306–312. doi:10.1086/670067
Goodman, J., and Weare, J. (2010). Ensemble samplers with affine invariance. Comm. Appl. Math. Comput. Sci. 5 (1), 65–80. doi:10.2140/camcos.2010.5.65
Inoue, N., Kitada, N., Shibuya, N., Omata, M., Takahama, T., Tonagi, M., et al. (2020). Probabilistic evaluation of off-fault displacements of the 2016 kumamoto earthquake. Pure Appl. Geophys. 177 (5), 2007–2019. doi:10.1007/s00024-019-02345-7
Jin, X. (2019). Study on prediction model of surface permanent displacement of strike-slip faults.(in Chinese). World Earthq. Eng. 35 (2), 18–23.
Kirby, E., Harkins, N., Wang, E., Shi, X., Fan, C., and Burbank, D. (2007). Slip rate gradients along the eastern Kunlun fault. Tectonics 26 (2). doi:10.1029/2006tc002033
Lee, V. W., and Trifunac, M. D. (1995). Frequency dependent attenuation function and fourier amplitude spectra of strong earthquake ground motion in California. Soil Biol. and Biochem. 40 (7), 1646–1653. doi:10.1016/j.soilbio.2008.01.028
Li, C. y., Pang, J. z., and Zhang, Z. q. (2012). Characteristics, geometry, and segmentation of the surface rupture associated with the 14 april 2010 Yushu earthquake, eastern tibet, China. Bull. Seismol. Soc. Am. 102 (4), 1618–1638. doi:10.1785/0120110261
Li, H., Pan, J., Lin, A., Sun, Z., Liu, D., Zhang, J., et al. (2016). Coseismic surface ruptures associated with the 2014Mw 6.9 yutian earthquake on the Altyn Tagh fault, Tibetan plateau. Bull. Seismol. Soc. Am. 106 (2), 595–608. doi:10.1785/0120150136
Li, K., Tapponnier, P., Xu, X., and Kang, W. (2023). The 2022, Ms 6.9 Menyuan earthquake: surface rupture, Paleozoic suture re-activation, slip-rate and seismic gap along the Haiyuan fault system, NE Tibet. Earth Planet. Sci. Lett. 622, 118412. doi:10.1016/j.epsl.2023.118412
Liu-Zeng, J., Liu, Z., Liu, X., Milliner, C., Rodriguez Padilla, A. M., Xu, S., et al. (2024). Fault orientation trumps fault maturity in controlling coseismic rupture characteristics of the 2021 Maduo earthquake. AGU Adv. 5 (2), e2023AV001134. doi:10.1029/2023av001134
Liu-Zeng, J., Liu, Z., Liu, X., Milliner, C., Rodriguez Padilla, A. M., Xu, S., et al. (2024). Fault orientation trumps Fault maturity in controlling coseismic rupture characteristics of the 2021 Maduo earthquake. AGU Adv. 5 (2), e2023AV001134. doi:10.1029/2023AV001134
Molnar, P., and Tapponnier, P. (1978). Active tectonics of tibet. J. Geophys. Res. Solid Earth 83 (B11), 5361–5375. doi:10.1029/jb083ib11p05361
Nurminen, F., Baize, S., Boncio, P., Blumetti, A. M., Cinti, F. R., Civico, R., et al. (2022). SURE 2.0–New release of the worldwide database of surface ruptures for fault displacement hazard analyses. Sci. Data 9 (1), 729. doi:10.1038/s41597-022-01835-z
Nurminen, F., Boncio, P., Visini, F., Pace, B., Valentini, A., Baize, S., et al. (2020). Probability of occurrence and displacement regression of distributed surface rupturing for reverse earthquakes. Front. Earth Sci. 8, 581–605. doi:10.3389/feart.2020.581605
Padilla, A. M. R., Quintana, M. A., Prado, R. M., Aguilar, B. J., Shea, T. A., Oskin, M. E., et al. (2022). Near-field high-resolution maps of the ridgecrest earthquakes from aerial imagery. Seismol. Res. Lett. 93 (1), 494–499. doi:10.1785/0220210234
Pan, J., Bai, M., Li, C., Liu, F., Li, H., Liu, D., et al. (2021). Coseismic surface rupture and seismogenic structure of the 2021-05-22 Maduo (Qinghai) Ms 7.4 earthquake. Acta Geol. Sin. 95 (6), 1655–1670.
Peter, M., and Powers, M. (2010). Distribution of seismicity across strike-slip faults in California. J. Geophys. Res. Solid Earth. 115, B05305. doi:10.1029/2008JB006234
Petersen, M. D., Dawson, T. E., Chen, R., Cao, T., Wills, C. J., Schwartz, D. P., et al. (2011). Fault displacement hazard for strike-slip Faults. Bull. Seismol. Soc. Am. 101 (2), 805–825. doi:10.1785/0120100035
Ren, J., Xu, X., Yeats, R. S., and Zhang, S. (2013). Millennial slip rates of the Tazang fault, the eastern termination of Kunlun fault: implications for strain partitioning in eastern Tibet. Tectonophysics 608, 1180–1200. doi:10.1016/j.tecto.2013.06.026
Ren, J., Xu, X., Yeats, R. S., and Zhang, S. (2013a). Latest Quaternary paleoseismology and slip rates of the Longriba fault zone, eastern Tibet: implications for fault behavior and strain partitioning. Tectonics 32 (2), 216–238. doi:10.1002/tect.20029
Ren, J., Xu, X., Zhang, G., Wang, Q., Zhang, Z., Gai, H., et al. (2022). Coseismic surface ruptures, slip distribution, and 3D seismogenic fault for the 2021 Mw 7.3 Maduo earthquake, central Tibetan Plateau, and its tectonic implications. Tectonophysics 827, 229275. doi:10.1016/j.tecto.2022.229275
Ren, Z., and Zhang, Z. (2019). Structural analysis of the 1997 Mw 7.5 Manyi earthquake and the kinematics of the Manyi fault, central Tibetan Plateau. J. Asian earth Sci. 179 (AUG.1), 149–164. doi:10.1016/j.jseaes.2019.05.003
Rodriguez Padilla, A. M., and Oskin, M. E. (2023). Displacement hazard from distributed ruptures in strike-slip earthquakes. Bull. Seismol. Soc. Am. 113 (6), 2730–2745. doi:10.1785/0120230044
Sarmiento, A. M., Danielle, B., Yousef, S., Lavrentiadis, G., Dawson, T., Madugo, C., et al. (2021). Fault displacement hazard initiative database report GIRS-2021-08. doi:10.34948/N36P48
Shan, X., Li, J., and Zhang, G. (2006). The tectonic condition and the feature of surface rupture zone of the Mani earthquake (MS 7.9) in 1997. Chin. J. Geophys. (in Chinese) 49 (3), 831–837.
Shaw, B. E. (2023). Magnitude and slip scaling relations for fault-based seismic hazard. Bulletin of the Seismological Society of America 113 (3), 924–947. doi:10.1785/0120220144
Sun, X., Xu, X., Chen, L., Tan, X., Yu, G., Li, Z., et al. (2012). Surface rupture features of the 2010 Yushu earthquake and its tectonic implication. Chinese Journal of Geophysics (in Chinese) 55 (1), 155–170. doi:10.6038/j.issn.0001-5733.2012.01.015
Takao, M., Tsuchiyama, J., Annaka, T., and Kurita, T. (2013). Application of Probabilistic Fault Displacement hazard analysis in Japan. Journal of Japan Association for Earthquake Engineering 13 (1), 17–36. doi:10.5610/jaee.13.17
Tapponnier, P., Zhiqin, X., Roger, F., Meyer, B., Arnaud, N., Wittlinger, G., et al. (2001). Oblique stepwise rise and growth of the Tibet Plateau. Science 294 (5547), 1671–1677. doi:10.1126/science.105978
Visage, S., Souloumiac, P., Cubas, N., Maillot, B., Antoine, S., Delorme, A., et al. (2023). Evolution of the off-fault deformation of strike-slip faults in a sand-box experiment. Tectonophysics 847, 229704. doi:10.1016/j.tecto.2023.229704
Wells, B. D. L., and Coppersmith, K. J. (1994). New empirical relationships among magnitude, rupture length, rupture width, rupture area, and surface displacement. Bull.seism.soc.am. 84 (4), 974–1002. doi:10.1785/BSSA0840040974
Wesnousky, S. G. (2006). Predicting the endpoints of earthquake ruptures. Nature 444 (7117), 358–360. doi:10.1038/nature05275
Wesnousky, S. G. (2008). Displacement and geometrical characteristics of earthquake surface ruptures: issues and implications for seismic-hazard analysis and the process of earthquake rupture. Bull.seismol.soc.am. 98 (4), 1609–1632. doi:10.1785/0120070111
Xu, X., Wang, F., Zheng, R., Chen, W., Ma, W., Yu, G., et al. (2005). Late Quaternary sinistral slip rate along the Altyn Tagh fault and its structural transformation model. Science in China Series D Earth Sciences 48, 384–397. doi:10.1360/02yd0436
Xu, X., Yu, G., Klinger, Y., Tapponnier, P., and Van Der Woerd, J. (2006). Reevaluation of surface rupture parameters and faulting segmentation of the 2001 Kunlunshan earthquake (Mw7.8), northern Tibetan Plateau, China. Journal of Geophysical Research Solid Earth 111 (B5). doi:10.1029/2004jb003488
Xue, S., Xie, H., Yuan, D., Li, Z., Shu, R., and Wen, Y. (2022). Seismic disaster characteristics of the surface rupture of Menyuan M S 6.9 earthquake in 2022. China Earthquake Engineering Journal 44 (2), 458–467. doi:10.20000/j.1000-0844.20220215001
Yao, W., Liu-Zeng, J., Oskin, M., Wang, W., Li, Z., Prush, V., et al. (2019). Reevaluation of the late pleistocene slip rate of the Haiyuan fault near songshan, gansu province, China. Journal of Geophysical Research Solid Earth 124 (5), 5217–5240. doi:10.1029/2018jb016907
Youngs, R. R., Arabasz, W. J., Anderson, R. E., Ramelli, A. R., Toro, G. R., Slemmons, D. B., et al. (2003). A methodology for Probabilistic Fault Displacement hazard analysis (PFDHA). Earthquake Spectra 19 (1), 191–219. doi:10.1193/1.1542891
Yuan, Z., Liu, J., Li, X., Xu, J., Yao, W., Han, L., et al. (2021). Detailed mapping of the surface rupture of the 12 February 2014 Yutian M s 7.3 earthquake, Altyn Tagh fault, Xinjiang, China. Science China Earth Sciences 64, 127–147. doi:10.1007/s11430-020-9673-6
Keywords: distributed rupture, strike-slip fault, probabilistic displacement hazard, Tibetan plateau, displacement threshold
Citation: Hu F and Ren J (2024) Displacement hazard from distributed ruptures of strike-slip faults in the Tibetan plateau. Front. Earth Sci. 12:1514086. doi: 10.3389/feart.2024.1514086
Received: 20 October 2024; Accepted: 02 December 2024;
Published: 19 December 2024.
Edited by:
Qi Yao, China Earthquake Administration, ChinaReviewed by:
Guihua Chen, China Earthquake Administration, ChinaZhonghai Wu, Chinese Academy of Geologi-cal Sciences (CAGS), China
Copyright © 2024 Hu and Ren. This is an open-access article distributed under the terms of the Creative Commons Attribution License (CC BY). The use, distribution or reproduction in other forums is permitted, provided the original author(s) and the copyright owner(s) are credited and that the original publication in this journal is cited, in accordance with accepted academic practice. No use, distribution or reproduction is permitted which does not comply with these terms.
*Correspondence: Junjie Ren, cmVuanVuamllQGdtYWlsLmNvbQ==, cmVuanVuamllQGN1Z2IuZWR1LmNu