 Yifan Li
 Letian Zhang
 Sheng Jin1,4*
- 1School of Geophysics and Information Technology, China University of Geosciences (Beijing), Beijing, China
- 2State Key Laboratory of Geological Process and Mineral Resources, Beijing, China
- 3Key Laboratory of Intraplate Volcanoes and Earthquakes, Ministry of Education, Beijing, China
- 4College of Earth Sciences, Hebei GEO University, Shijiazhuang, China
The Central Asian Orogenic Belt (CAOB) was originated from the subduction, closure, convergence, and post-collisional extension of the Paleo-Asian Ocean located between the North China Craton, Tarim Craton, and the Siberian Craton during the late Permian to early Triassic. The Magnetotelluric (MT) method can detect the deep structure and properties of the orogenic belt, and further reveal the crust and mantle deformation mechanism and deep dynamic process inside the orogenic belt. In this paper, we summarize recent developments in the MT studies of the CAOB, including 2 MT studies that we recently conducted for the Beishan and Bainaimiao segments of the CAOB, which briefly describe the complex electrical structure of the crust and upper mantle, and provide valuable information for understanding its deep processes and continental dynamic mechanisms. Finally, we summarize the general characteristics of the lithospheric electrical structure and formation mechanism of low-resistivity zones, based on which we look forward to future MT studies.
1 Introduction
The structure and evolution of orogenic belts and their intrinsic relationship with continent growth are major issues in Earth sciences. The use of geophysical methods that detect the deep structures and properties of orogenic belts and further reveal the crust and mantle deformation mechanisms and deep dynamic processes inside orogenic belts are important frontiers in current Earth science research. The Central Asian Orogenic Belt (CAOB), located in the core region of Eurasia (Figure 1) is the largest accretion-type orogenic belt in the world. From the Neoproterozoic to the early Mesozoic, the Paleo-Asian Ocean experienced long-term, multiple subduction-accretionary orogens during its formation (Şengör et al., 1993; Xiao et al., 2003; Xiao et al., 2015). During the Hercynian tectonic period (∼400–250 Ma), the scattered blocks that made up the northern part of mainland China began to drift northward, converge and accrete (Liu et al., 2021). The Paleo-Asian Ocean, between the Siberian plate, North China plate, and Tarim plate, gradually closed to form the CAOB (Schulmann and Paterson, 2011; Xiao et al., 2003). The North China and Tarim plates eventually aligned with the Siberia plate. Large-scale magmatic activity occurred along this orogenic belt, which combined multiple plates and produced large amounts of new crustal materials. The rocks in the CAOB are mainly composed of igneous rocks and accretionary complex rocks, and it is an area with the most intense accretion and transformation of continental crust since the Phanerozoic (Windley et al., 2007). The CAOB has experienced complex geological processes such as subduction and closure of the Paleo-Asian Ocean, convergence of the land and continent, and extension after collision, systematically preserving information on the formation and evolution of the Eurasian continent. This long tectonic evolution process makes the CAOB an ideal place for studying continental orogeny and postorogenic extension, which has attracted the attention of scholars worldwide (Cawood et al., 2009; Şengör et al., 1993; Windley and Xiao, 2018; Xiao et al., 2014; Xiao et al., 2015; Xiao et al., 2018; Xiao, 2023).
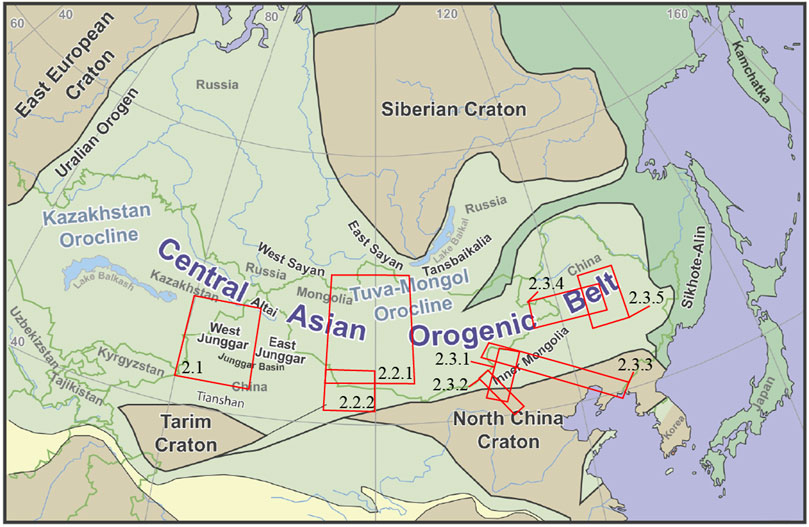
Figure 1. Simplified regional tectonic map of the Central Asian Orogenic Belt (CAOB) (Windley and Xiao, 2018). Red rectangles show the regions of case studies presented in this review with corresponding section numbers labeled.
The geological evolution history of the CAOB is a complex multistage and multievent process that involves various geological processes such as continental collision, crustal accretion, postcollisional extension, and intracontinental orogeny. Together, these actions shape the tectonic characteristics of the CAOB and affect the regional and global climate and ecosystems (Xiao, 2023). Detecting the deep structure of the crust and mantle via geophysical methods can provide important clues and constraints for systematic scientific analysis. In recent years, the deep lithospheric structure of the CAOB has become a popular topic in international academia (Comeau et al., 2018; Käufl et al., 2020; Wang et al., 2022; Xu et al., 2016; Xu et al., 2020; Ye et al., 2019; Xiao et al., 2019; Zhang et al., 2014; Tan et al., 2023).
The Magnetotelluric (MT) method is an important electromagnetic geophysical sounding method in the frequency domain that uses the natural electromagnetic field of the Earth as a field source to image subsurface electrical structures at the lithospheric scale (Chave and Jones, 2012). The natural magnetotelluric field can easily penetrate high-resistivity areas and is very sensitive to the existence of low-resistivity bodies, providing important constraints on temperature, fluid and volatile distributions (Hata and Uyeshima, 2015) as well as rheological structures and deformation mechanisms (Liu and Hasterok, 2016; Xu et al., 2018) in the lithosphere. The field is useful for targeting melts, thermal fluids, saline aqueous solutions, and graphitization anomalies existing in the crust and upper mantle. Furthermore, the lithospheric structure and crust–mantle deformation mechanism of the orogenic belt can be studied, which provides an important basis for investigating the dynamic processes and dynamic mechanisms of the deep continental lithosphere.
In recent years, the MT method has been continuously improved, gradually developing from traditional 2D profile to 3D regional studies. The application results have been significantly improved, and many meaningful research results have been achieved. The MT method has been widely applied to detect the deep structures of various types of tectonic units amid the East Asian continent, from stable craton regions to tectonically active orogenic belts and subduction zones (Zhang, 2017). Among them, the CAOB of East Asia is the most complete and largest accretionary orogenic belt in the world and contains key information for cutting-edge earth science theories such as the formation of orogenic belts, the growth of continents, and the deformation of the crust and mantle (Xiao, 2023), which has attracted the attention of many scholars. In this paper, the main features of the lithospheric electrical structures in these areas are introduced in the order of the western segment, the middle segment and the eastern segment of the CAOB. In addition, the preliminary results of our newly conducted MT study on the Beishan segment and the Bainaimiao segment of the CAOB are also described in this paper to provide a more complete understanding of the lithospheric electrical structure of the CAOB. Finally, we summarize the scientific understanding achieved and the remaining issues to address and provide suggestions for future research directions.
2 Progress in the MT research of the CAOB
2.1 Western segment of the CAOB
Located in the western section of the COAB, the western Junggar area is located at the intersection of three continental plates: Siberia, Kazakhstan and Tarim. It was formed by the aggregation of a multi-island ocean similar to the South China Sea in the early Paleozoic. Geologists believe that the crust is composed mainly of Paleozoic oceanic lithosphere fragments, paleo-active continental margin complexes, and intrusions of late Carboniferous to early Permian granites and dark dikes. The main tectonic strike direction in western Junggar is northeast‒southwest (Figure 2). Previous studies have shown that this area retains a surviving intraoceanic subduction zone structure. Xu et al. (2020) used long-period MT array data to image possibly captured oceanic plates in the upper mantle of the western Junggar region, which elucidated the fate of the subducting oceanic plates and the evolution of the continental lithosphere.
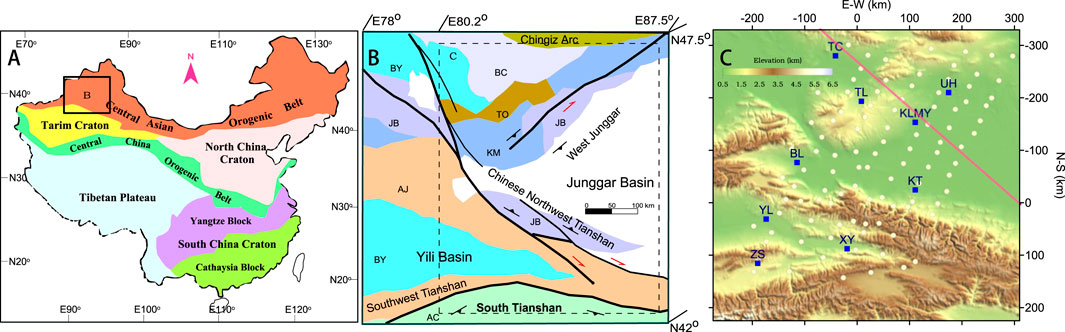
Figure 2. Locations of MT sites in the western Junggar area (Xu et al., 2020). (A) Simplified tectonic framework of China and the study area (box diagram). (B) Regional geological structure. AC–Late Paleozoic accretionary complex; AJ–Early Precambrian basement and Middle Precambrian to Paleozoic caprock; BC–Middle Cambrian to early Silurian island arc; BY–Late Devonian to Permian active continental margin or island arc; JB–Late Devonian to Carboniferous accretionary wedge and suture zone; KM–Ordovician to late Devonian accretionary wedge and suture zone; TO–Early-Middle Devonian active continental margin or island arc. (C) Locations of MT sites (white circles) and cities (squares). BL–Bole, KLMY–Karamay, KT–Kuitun, TC–Tacheng, TL–Tuoli, UH–Wuerhe, XY–Xinyuan, YL–Yili, ZS–Zhaosu. The solid line represents the location of the resistivity and Vs. cross-section in Figure 3D.
This study deployed 101 long-period MT stations with a spacing of 25–45 km in the western Junggar region and the Tianshan region in northwestern China (Figure 2) and obtained a lithosphere-scale resistivity structure model through 3D inversion, as shown in Figure 3. The results of the 3D resistivity model for conductors with resistivities less than 25 Ω m in the depth range of 15–220 km are shown in Figure 3A. The most notable feature is that at depths between 120 and 220 km, there is a large subcontinental lithospheric mantle-scale conductor, which extends in a northeast‒southwest direction, tilts northwest, and extends horizontally for more than 300 km, similar to the pattern of some remnant oceanic slabs. In the Vs. (S-wave velocity) results, the geometry of the conductor matched the mantle low-velocity zone (LVZ) (Figure 3D).
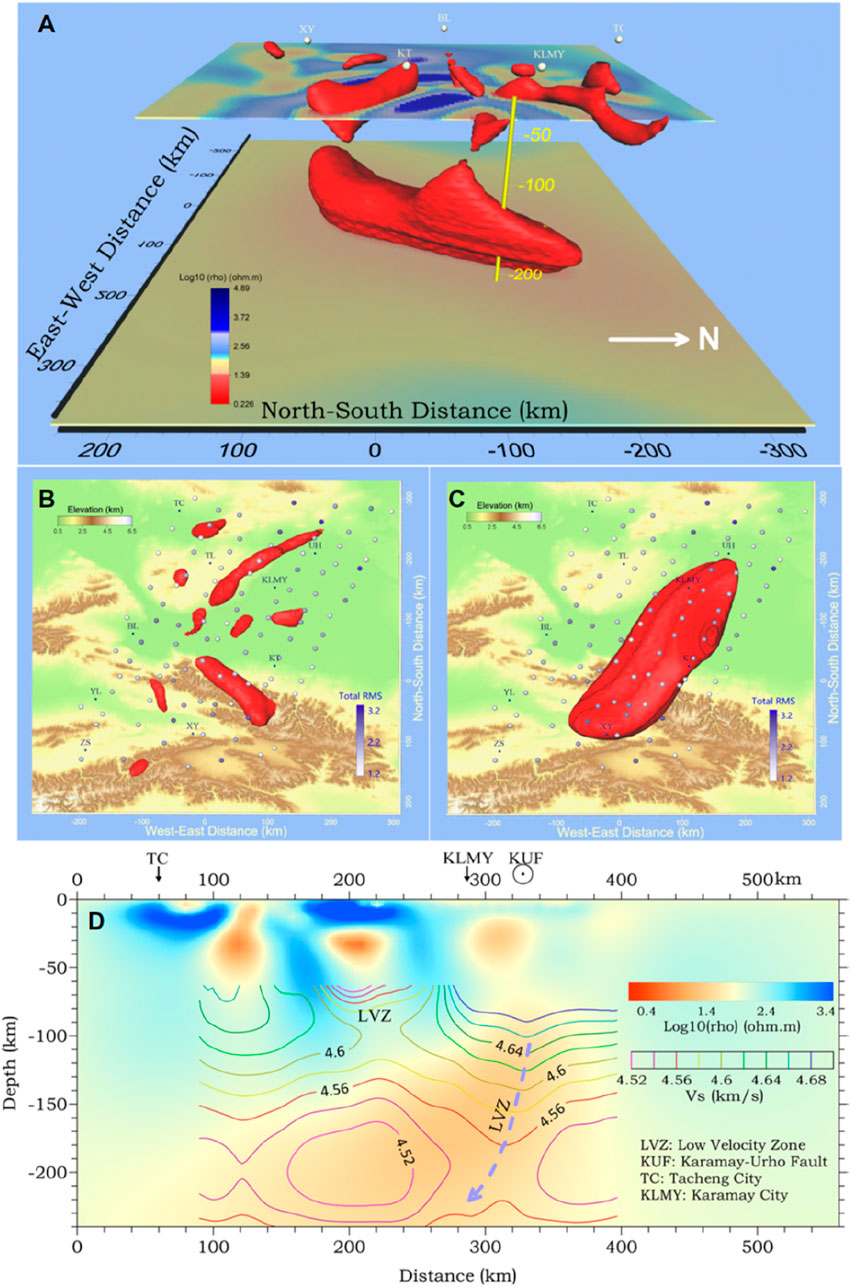
Figure 3. Resistivity model from western Junggar (Xu et al., 2020). (A) Low-resistivity anomaly at depths of 15–220 km. Two horizontal slices were made at depths of 60 km and 200 km. See the city abbreviations in Figure 2. (B) Conductor in the Earth’s crust. (C) Large conductor in the lithospheric mantle. MT sites were color-filled according to their total normalized root mean square (nRMS) misfits. (D) Resistivity cross-section extracted from the 3D model shown in A along the line shown in Figure 2C. The superposed contours are the shear wave velocity. The blue dotted line and arrow highlight the low-velocity zone (LVZ) in the mantle.
Recent studies have shown that under lithospheric mantle conditions, fluorine-containing phlogopite can greatly reduce the resistivity (Li et al., 2016; Li et al., 2017). The enrichment of volatile-bearing metasomatized minerals in the lithospheric mantle is usually related to the metasomatization process caused by the infiltration of massive fluids or melts in subduction systems. The above processes forced the subducting slab to be metasomatized by melts and/or fluids from the top and bottom. This finding matches well with the results shown in Figure 3. Therefore, in this study, metasomatic minerals containing volatiles tend to form an interconnected conductive phase and make the captured oceanic plate a conductor.
Young oceanic plates (e.g., mid-ocean ridges) or oceanic plates with thick crusts (e.g., oceanic plateaus) can avoid sinking into the deep mantle, and owing to their neutral buoyancy, they may be captured by the shallow upper mantle after subduction (Anderson, 2006). These findings indicate that the related subduction of oceanic ridges in the late Paleozoic era in the study area ensured that the subducted oceanic plates were not recycled to the deep mantle. A weak crust‒mantle transition zone with a viscosity one to two orders of magnitude lower than that of the underlying mantle exists everywhere in northwestern Xinjiang (Deng and Tesauro, 2016). This weak crust‒mantle transition zone effectively separates the crust from the underlying mantle lithosphere, thus protecting the existing plate from subsequent deformation and connecting the conductive phases composed of metasomatic minerals containing volatiles. This study revealed that oceanic plates can be trapped in the continental lithosphere, highlighting the importance of oceanic plate subduction for continental accretion and providing new insight into the formation and evolution of continents.
2.2 Central segment of the CAOB
2.2.1 Hangai Dome
The Hangai Dome is an inland uplift area with volcanic activity in the central segment of the CAOB. It is located in the central part of the Asian continent, far from the plate boundary. Currently, the understanding of its formation mechanism and geodynamic background is insufficient. This may be related to the interaction between the crust and the upper mantle. To study this issue, Käufl et al. (2020) collected 3D MT array data from the Hangai Dome and Gobi–Altai Mountain regions of Mongolia (Figure 4A) and, via multiscale 3D inversion, obtained an electrical structure model of the crust and upper mantle of the region (Figure 4B). Using these results, the genetic mechanisms of inland deformation and intraplate volcanic activity in this area are further assessed.
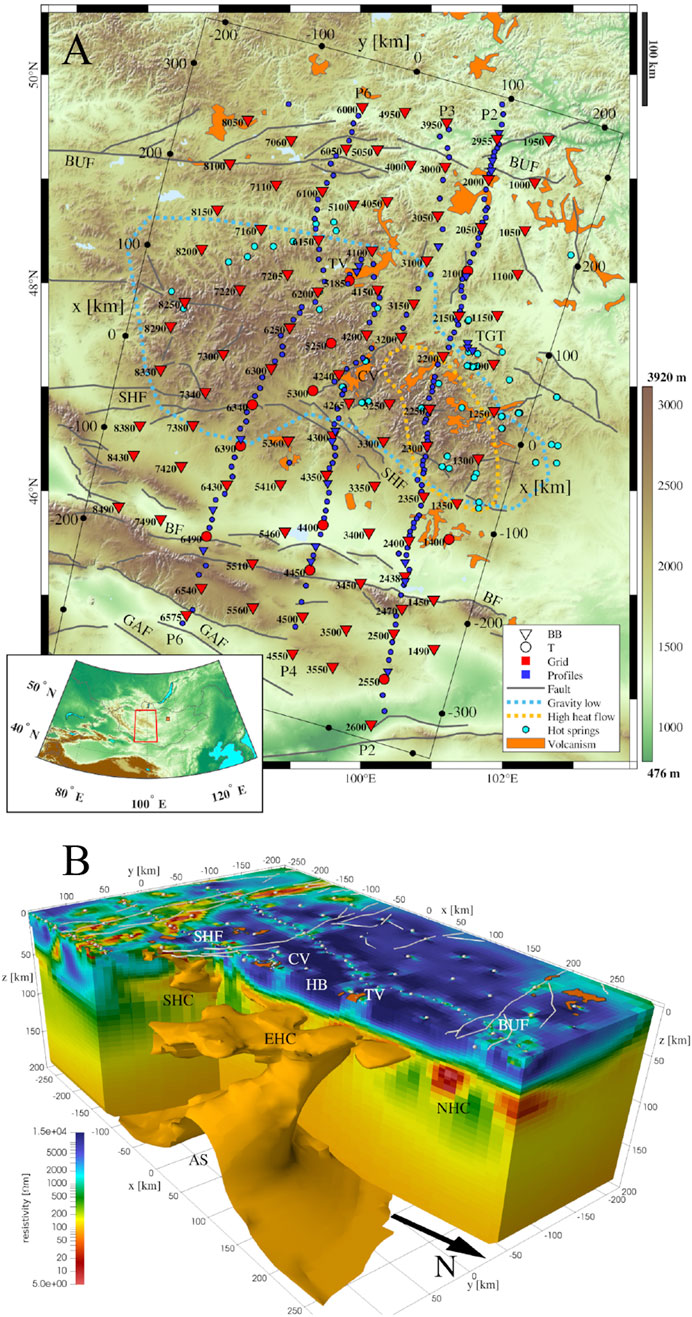
Figure 4. (A) Distribution of 3D MT array in the Hangai Dome area (Käufl et al., 2020). (B) 3D resistivity structure model of the lithosphere of the Hangai Dome (Käufl et al., 2020). AS - Asthenosphere; BF - Bogd fault; BUF - Bulnay fault; CV - Chuluut volcanic zone; EHC - East Hangai conductor; GAC - Gobi-Altai conductor; GAF–Gobi-Altai fault; HB–Hangai block; LAB–Lithosphere-asthenosphere boundary; NHC–North Hangai conductor; SHC–South Hangai conductor; SHF–South Hangai fault; TV–Tariat volcanic zone; TGT–Tsenkher geothermal area; VL–Valley of Lakes; VLR–Valley of Lakes resistor; WHC–West Hangai conductor.
This study deployed an MT array covering a region of 650 × 400 km2 in the Hangai and the Gobi–Altai Mountains in central Mongolia, including 97 array stations and 175 densely arranged stations along four profiles (Figure 4A). The traditional MT observation method and a geoelectric station that only measures the electric field were used. The latter can improve the spatial resolution and reduce the cost of data acquisition. With the use of finite element forward and inversion codes, multiscale model parameterization and terrain fitting were realized on the basis of an unstructured hexahedral mesh. The inversion process was divided into four stages, and more elaborate model parameterization and more data were used in each stage. A multiscale 3D resistivity structure model of the lithosphere was obtained, as shown in Figure 4B.
The model reveals that the conductivity structure of the Hangai Dome has the following main characteristics. In the high-resistivity upper crust, several low-resistivity anomalies are observed, which may be related to the late Cenozoic volcanic belts and modern geothermal regions, which are closely related to the deep mantle structure. In addition, some major fault systems, such as the boundaries that divide different geological units and ore-forming areas, also present low resistivity. In the lower crust, some nonuniform low-resistivity anomalies are found, and they may be composed of fluid-rich regions. These fluids may have originated from the dynamic processes of the mantle or deep crust. The upper mantle contains a large-scale low-resistivity area, indicating that the lithosphere–asthenosphere boundary is not uniform. There are some areas of local upwelling, which cause the asthenosphere to rise to a depth of 70 km. This low-resistivity area may be related to deep melt or fluid activity, and it may also be one of the reasons for the uplift of the Hangai Dome and volcanic activity.
This study is the first to reveal the crust‒mantle resistivity structure of the Mongolian Plateau region through 3D MT inversion, which provides new constraints and clues for further understanding the geological and geodynamic processes of this region.
2.2.2 Beishan orogenic belt
The Beishan Orogenic Belt (BOB) at the southern end of the central segment of the CAOB is bordered by the Outer Mongolia accretion tectonic system in the north and the Kunlun‒Qaidam‒Qilian Basin system in the Tethys tectonic domain in the south. This belt is an ideal place for joint studies of the two tectonic systems. In the BOB, geophysical work is still very limited. At present, the understanding of the deep crust and mantle structure of the BOB is limited to some local areas, and the electrical structure model of the overall tectonic unit of the BOB has not been studied. We used a MT profile arranged in a northeast‒southwest direction from Ejin Banner in the Inner Mongolia Autonomous Region to Jiuquan city in Gansu Province (Figure 5) to conduct profile surveying across each tectonic unit in the entire Beishan area. A total of 52 broadband MT stations were recorded at a spacing of approximately 5 km.
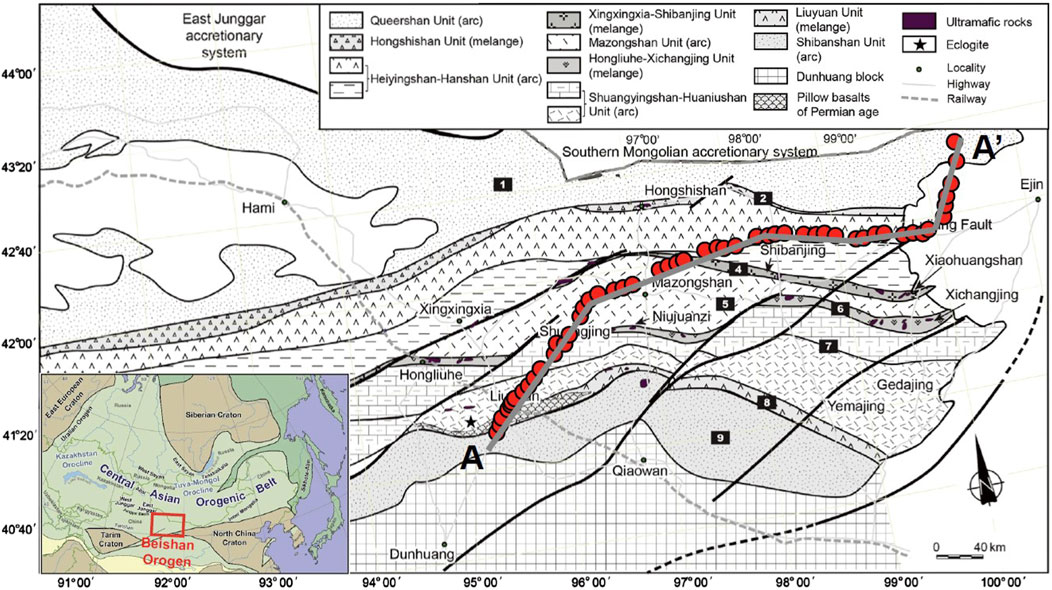
Figure 5. Distribution of MT sites in the Beishan area. (The red dots represent the locations of the MT surveying points; the AA’ line represents the location of the vertical slice of the resistivity model in Figure 6. The base map is from Song et al., 2015).
The ModEM code (Egbert and Kelbert, 2012; Kelbert et al., 2014) was used to perform 3D inversion of MT data via the finite memory quasi-Newton algorithm (L-BFGS). The MT data used in the 3D inversion had a frequency range of 0.01–5000 s, with a total of 35 frequency points. The full impedance tensor and vertical magnetic transfer functions (tippers) were used in the inversion, where the error floor of the four elements of the impedance tensor was
The preliminary resistivity model (Figure 6) shows that the southwestern part of the Beishan block is relatively stable tectonically, appearing as a high-resistivity rigid block. The central and northeastern parts are relatively active, and conductors are widely distributed from the lower crust to the upper mantle. The low-resistivity characteristics across the crust below the northeastern part of the BOB may be related to the closure of the back arc basin or ocean, indicating the locations of the paleo suture zones formed via subduction–accretion processes during the closure of the Paleo-Asian Ocean. The resistivity model of the study area revealed that the high-resistivity bodies was intersected by low-resistivity stripes.
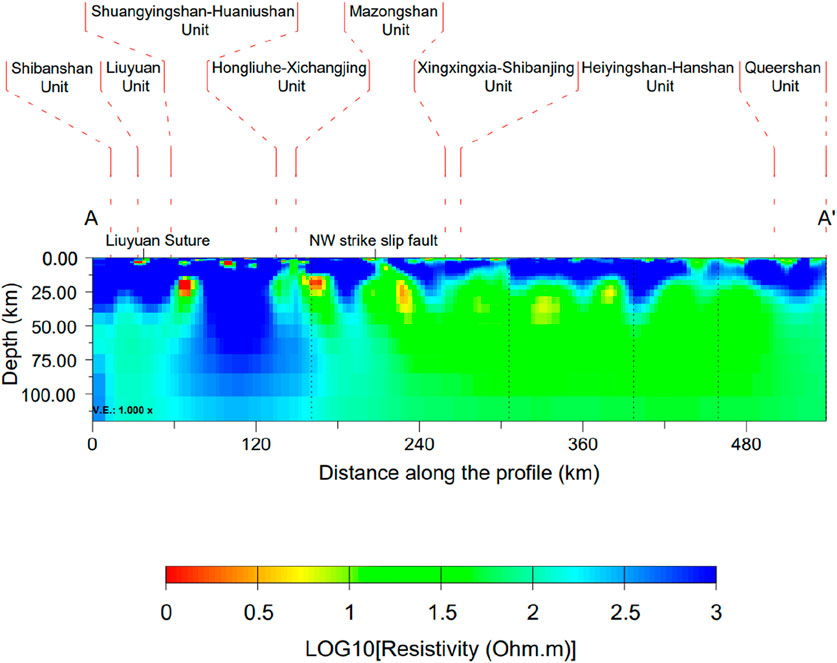
Figure 6. Vertical slice along the MT profile extracted from the 3D resistivity structure model of the Beishan area (The position of the cross-section is shown by the broken line AA’ in Figure 5).
2.3 Eastern segment of the CAOB
2.3.1 Bainaimiao arc
We used MT data collected in the central area of Inner Mongolia to study the electrical structure of the Bainaimiao segment of the CAOB. The MT data used in this study are shown in Figure 7 and are divided into two profiles. The sounding profiles all showed NNE‒SSW strikes and were nearly parallel. 38 MT stations were laid out along profile Line 1, and 25 MT stations were laid out for Line 2, resulting in a total of 63 MT stations. The two profiles spanned six tectonic units, including the Hegenshan Complex Belt, the Baolidao Arc, the Solonker–Linxi suture zone, the Ondor Sum Complex Belt, the Bainaimiao Arc and the Inner Mongolia axis, in the northeastern CAOB. The large fault zones traversed include the Erenhot fault, the Xilinhot fault, the Linxi fault, the Xar Moron fault, and the Chifeng–Bayan Obo fault.
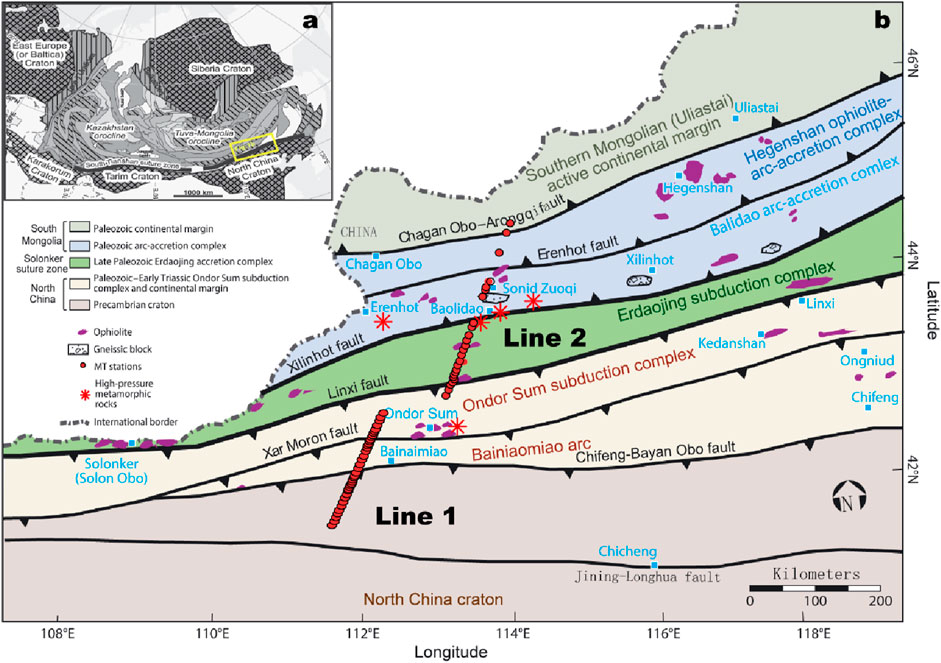
Figure 7. (A) Simplified tectonic map of the CAOB. (B) Simplified tectonic map and MT sites distribution in the study area (Base map modified from Xiao et al., 2015).
Using the dimensionality and tectonic strike analysis of the MT data, it is found that most of the data in the study area are two-dimensional. It can be determined that the strike direction of Line one is roughly along NE 95° and the strike direction of Line two is roughly along NE 60°. On this basis, a 2D lithospheric electrical structure model was obtained through 2D inversion via the nonlinear conjugate gradient (NLCG) algorithm (Rodi and Mackie, 2001) (see Figures 8, 9, upper panels). The two profiles were inverted using both the TE and TM mode data. Considering that the TE mode data are more susceptible to 3D distortion effect (Becken et al., 2008; Jones, 1983; Wannamaker et al., 1984), the inversion parameters were set to 100% of the apparent resistivity error floor and 10% of the impedance phase error floor for the TE mode, and 10% of the apparent resistivity error floor and 5% of the impedance phase error floor for the TM mode. Different values of the regularization factor were used for inversion, and after comparison, the value τ = 1 was determined as the best trade-off between model roughness and data misfits. The initial model was a 100 Ω m uniform half-space, and the initial RMS misfit of the data is 13.04 for Line 1 and 12.67 for Line 2. After 200 iterations, the RMS misfit of the data is 1.76 for Line 1 and 1.52 for Line 2. Furthermore, a 3D electrical structure model at the crust and upper mantle scales in the study area was obtained via 3D inversion using the finite memory quasi-Newton algorithm (L-BFGS) (Figures 8, 9, lower panels). The ModEM code (Egbert and Kelbert, 2012; Kelbert et al., 2014) was used for 3D inversion. The frequency range of the MT data is 0.01–10000 s, with a total of 36 frequency points. The full impedance tensor data were used in 3D inversion, and the error floors of the four elements of the impedance tensor were set as
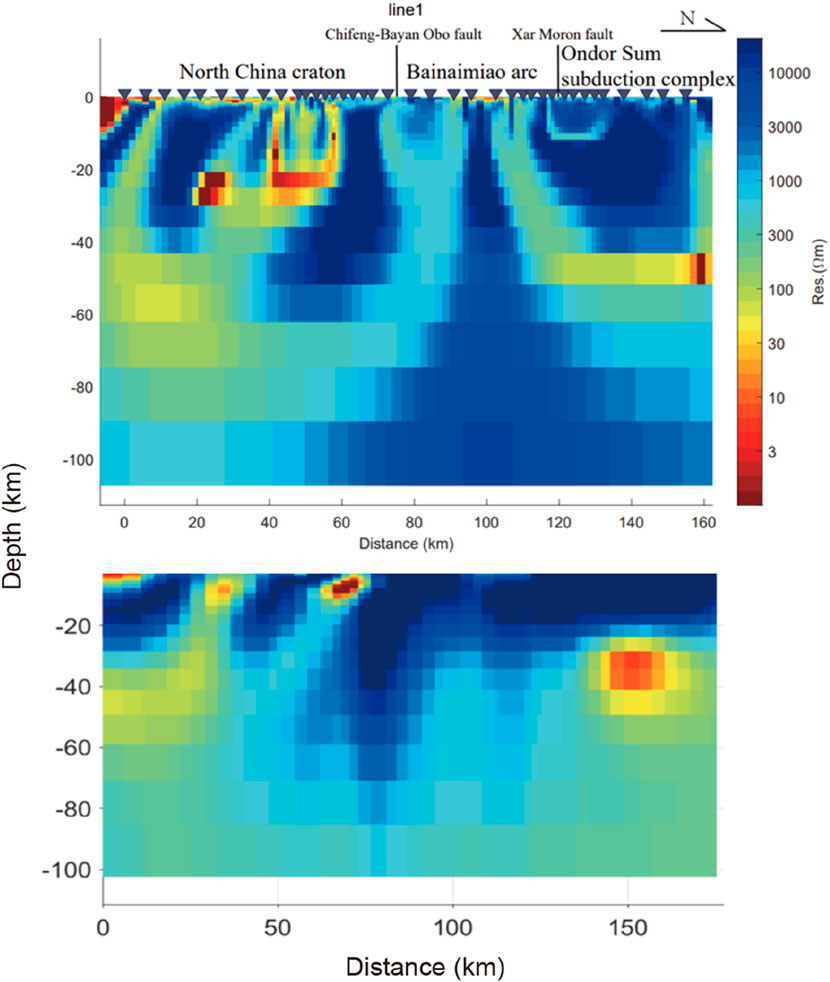
Figure 8. Comparison of the 2D resistivity model (upper panel) and the vertical section extracted from the 3D resistivity model (lower panel) of Line 1.
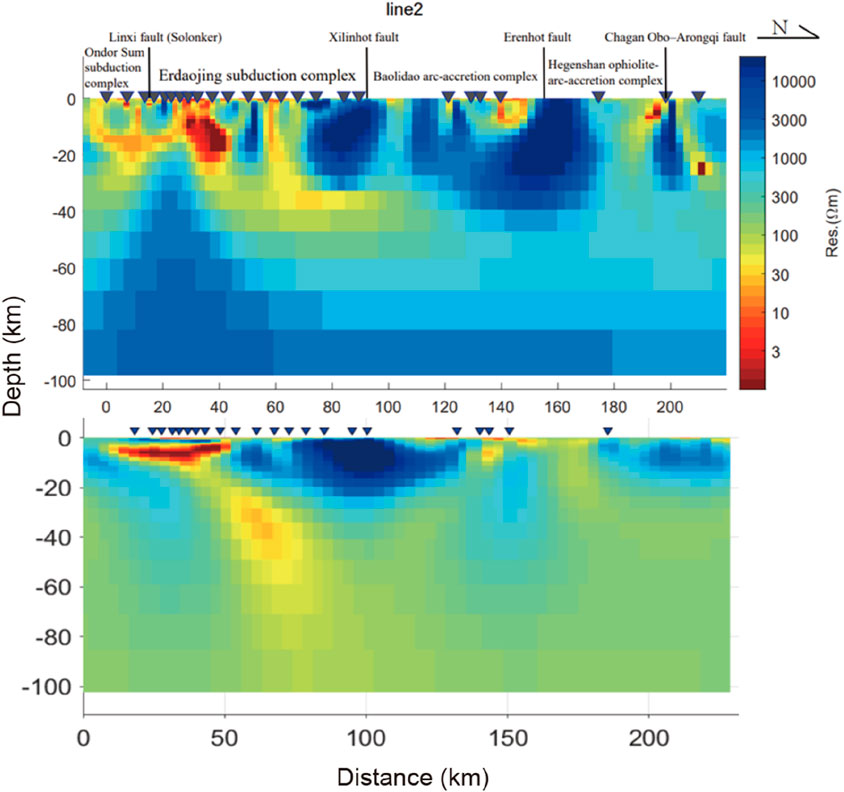
Figure 9. Comparison of the 2D resistivity model (upper panel) and the vertical section extracted from the 3D resistivity model (lower panel) of Line 2.
A comparison revealed that the 3D model and the 2D model have relatively good consistency (Figures 8, 9). According to both the 2D and 3D models, the upper mantle of the North China Craton has a low-resistivity anomaly, and the interior of the crust is dominated by high-resistivity anomaly, with some distributed nearly vertical low-resistivity strips. The low-resistivity strips were connected with the conductor in the upper mantle, indicating that the northern margin of the North China Craton may have experienced reactivation. Under the Bainaimiao Arc, two low-resistivity zones run through the crust in opposite directions. This feature is consistent with the tectonic paleogeography model proposed by Chen et al. (2020). It is speculated that this was the result of the closure of a paleo-ocean, with a high-resistivity zone captured in between. The high-resistivity zone runs from the crust to the upper mantle, forming an isolated lithospheric high-resistivity body. This electrical characteristic indicates that the Bainaimiao Arc may be more in line with the characteristics of an isolated arc terrane during its evolution. The crust under the Ondor Sum subduction complex, the Baolidao arc-accretion complex and the Hegenshan ophiolite arc-accretion complex all have high-resistivity anomalies. Under the Linxi fault and the Erdaojing subduction complex, which is generally recognized as the Solonker suture, there are two large-scale low-resistivity bodies with opposite dips that run through the crust in a northeast‒southwest direction, which is in good agreement with the bidirectional subduction model of the Paleo-Asian Ocean (Xiao et al., 2015). The Solonker suture is speculated to be the remnant of the bidirectional subduction closure of the Paleo-Asian Ocean, and the low-resistivity anomaly is caused by sulfur- and carbon-bearing sediments (Ye et al., 2019). Graphite is the most likely carbon-bearing conductive material in this case, suggesting that the specific location of the Solonker suture may be nearly 10 km north of the Linxi fault. There are also low-resistivity zones below the Chagan Obo-Arongqi fault. This finding is consistent with the closure model of the Hegenshan back-arc basin proposed by Zhang et al. (2020), and it is speculated that the low resistivity is related to the closure of the back-arc basin. In comparison, the distribution scale of this low-resistivity body is much smaller than that of the lithospheric low-resistivity body near the Solonker suture zone. The purple patches on the geological map in Figure 10 show the distribution of ophiolites, which have a good relationship with the low-resistivity anomalies in the upper crust and are closely related to the locations of the paleo-suture zones.
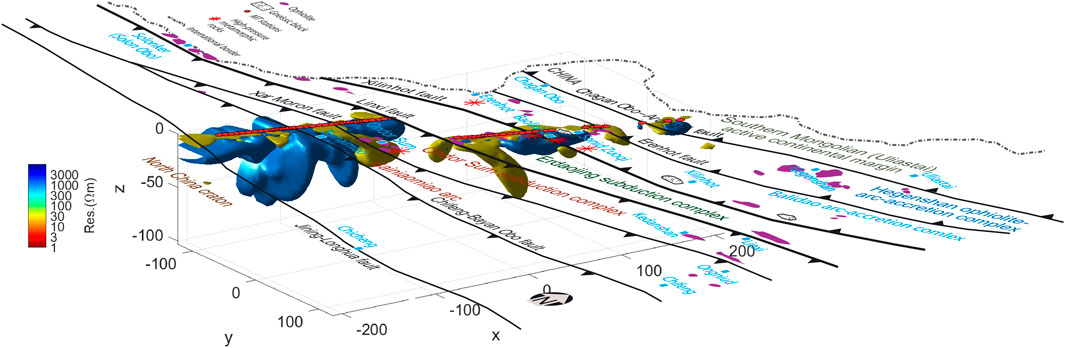
Figure 10. Distributions of the 1000 Ω m and 30 Ω m isosurfaces of the 3D resistivity model for the Bainaimiao arc area (surface tectonic and geological information according to Xiao et al., 2015)
2.3.2 Solonker suture
Ye et al. (2019) conducted MT data analysis, 2D inversion, and model interpretation on the basis of a broadband to long-period, high-resolution MT profile that is approximately 400 km long and crosses the Solonker suture zone in a northwest‒southeast direction (Figure 11). Using 2D anisotropy inversion and model validation, a 2D resistivity model of the study area was obtained (Figure 12). On the basis of previous study results, the model was interpreted to study the evidence and geometric characteristics of the final subduction closure of the Paleo-Asian Ocean. In the high-resistivity lithosphere, a south-dipping low-resistivity zone (Ds) with a dip angle of ∼45° was found, which cuts through the entire crust and reaches the mantle. The low-resistivity anomaly is inferred to be related to sulfur- and carbon-bearing sediments originating from the southward subduction of the Paleo-Asian Ocean, with a subduction depth of up to 80 km. The low-resistivity zones caused by the subduction of oceanic crust have obvious anisotropy. On the basis of the anisotropy characteristics, it is inferred that the high strain rate caused the fold axis to rotate in the dip direction. According to the position of this low-resistivity anomaly, the Paleo-Asian Ocean was inferred to have closed along the Solonker suture zone. The high-resistivity body (R2) found under the northern margin of the North China Craton was interpreted as a thickened lithosphere caused by the southward subduction of the Paleo-Asian Ocean, whereas the north-dipping low-resistivity zones (T1–T5) found in the crust of the CAOB and the North China Craton to the south of the southward subduction location were interpreted as postcollision thrust faults. The two northward-dipping low-resistivity zones (Dn1 and Dn2) may have been related to the northward subduction of the Paleo-Asian Ocean during the closure of the Paleo-Asian Ocean. These results indicate that the Paleo-Asian Ocean exhibited bidirectional subduction characteristics during the closure process, but the deep geometry could not be well traced because of the limited MT sites distribution near the national border at the northwestern end of the MT profile.
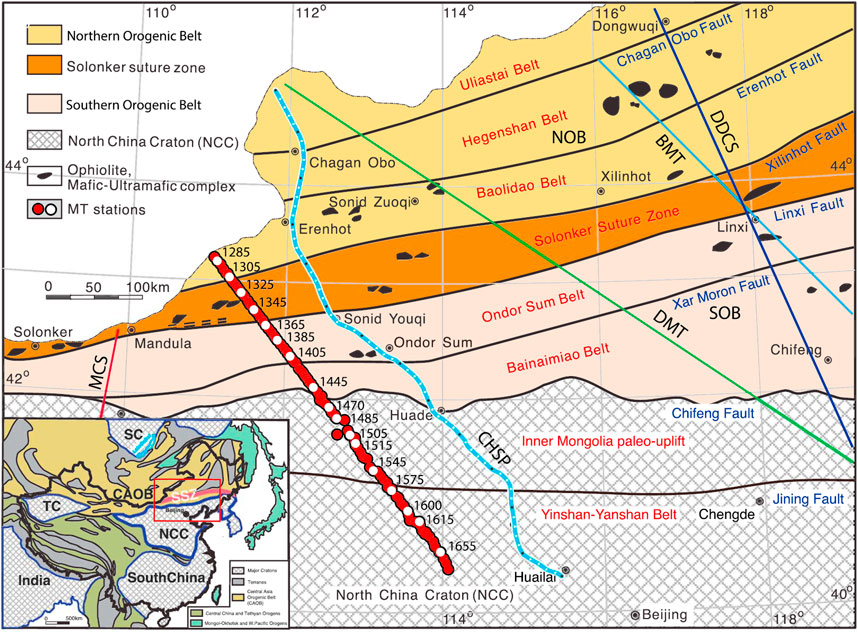
Figure 11. Location map of the MT profile across the Solonker suture zone (Ye et al., 2019). NOB, Northern Orogenic Belt; SOB, Southern Orogenic Belt; BMT/DMT, Previous MT profiles; CHSP, Chagan Obo - Huailai seismic profile; DDCS, Dongwu Qi - Donggou geological cross-section; MCS, Mandula geological cross-section; SC, Siberia Craton; TC, Tarim Craton; SSZ, Solonker Suture Zone.
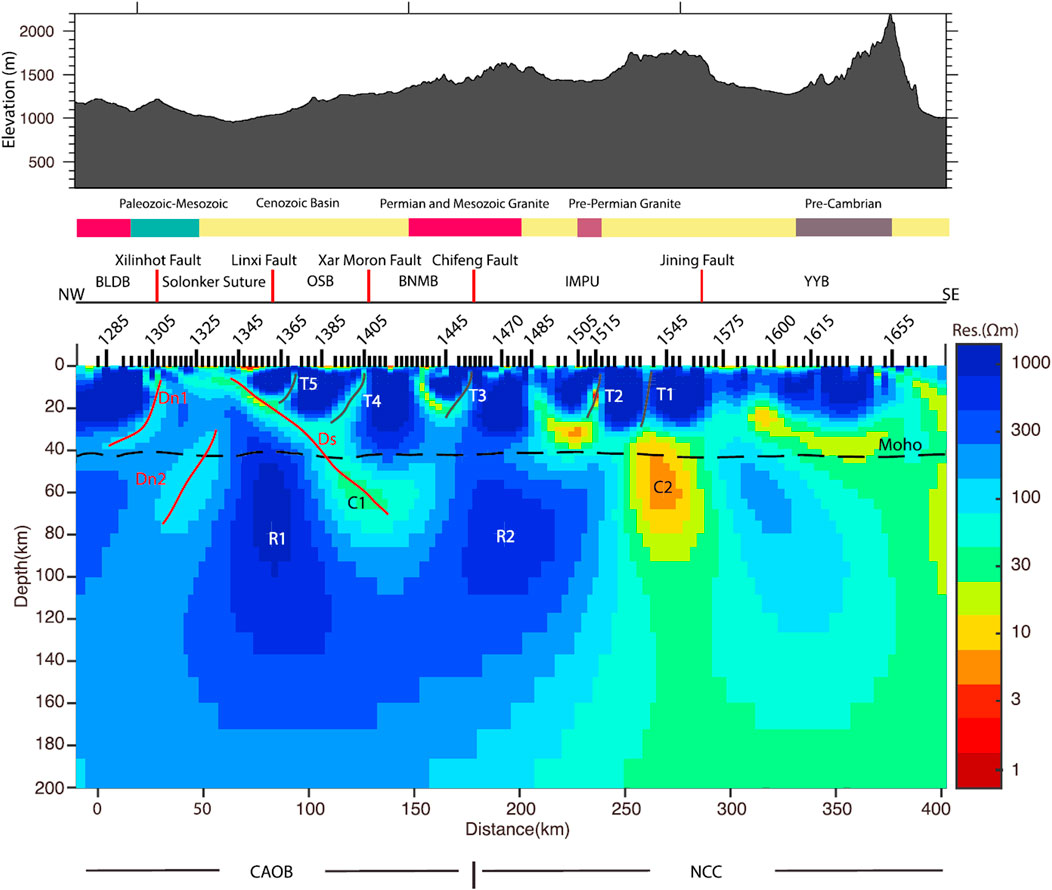
Figure 12. Interpretation diagram of the 2D resistivity model of the lithosphere across the Solonker suture zone (Ye et al., 2019). BLDB, Baolidao Belt; OSB, Ondor Sum Belt; BNMB, Bainaimiao Belt; IMPU, Inner Mongolia Paleo-Uplift; YYB, Yinshan-Yanshan Belt.
2.3.3 Northeastern boundary zone of the north China craton
In the northeastern boundary zone of the North China Craton, Dong et al. (2015) completed a MT profile with a length of approximately 900 km in the NW–SE direction. The cross-section starts from the Hegenshan Complex Belt northwest of the CAOB and passes through the Baolidao Arc, the Solonker‒Linxi suture zone, the Ondor Sum Complex Belt, the Bainaimiao Arc, the Inner Mongolia axis, the Yanshan Orogenic Belt, and finally terminates at the Liaohe depression inside the North China Craton (Figure 13). The MT impedance tensor decomposition technique was used to analyze the dimensionality of the MT data and determine the regional geoelectric strike directions. The MT data along the profile generally exhibit good two-dimensional traits. Using the 2D NLCG inversion method, the subsurface 2D resistivity structure along the cross-section was obtained (lower panel of Figure 13). The resistivity structure along the cross-section can be roughly divided into three main electrical zones, which vary from high-resistivity to low-resistivity to high-resistivity. Generally, the resistivity characteristics within the CAOB and North China Craton are quite different, with the former changing violently and the latter changing relatively gently. Large-scale low-resistivity bodies are found in the middle–lower crust beneath the Solonker–Linxi suture zone and the Inner Mongolia axis, which may have been formed by deep fluids and partial melting. On the basis of the deep electrical structure and other geological and geophysical observations of the study area, the final suture location between the Siberian plate and North China plate may be in the area between the Xilinhot fault and the Xar Moron fault. In addition, the thicker high-resistivity body under the Yanshan Orogenic Belt may act as a tectonic barrier, causing the uppermost mantles inside and outside the North China Craton to have different convective modes, thus weakening the influence of the tectonic evolution of the CAOB on the destruction of the eastern North China Craton.
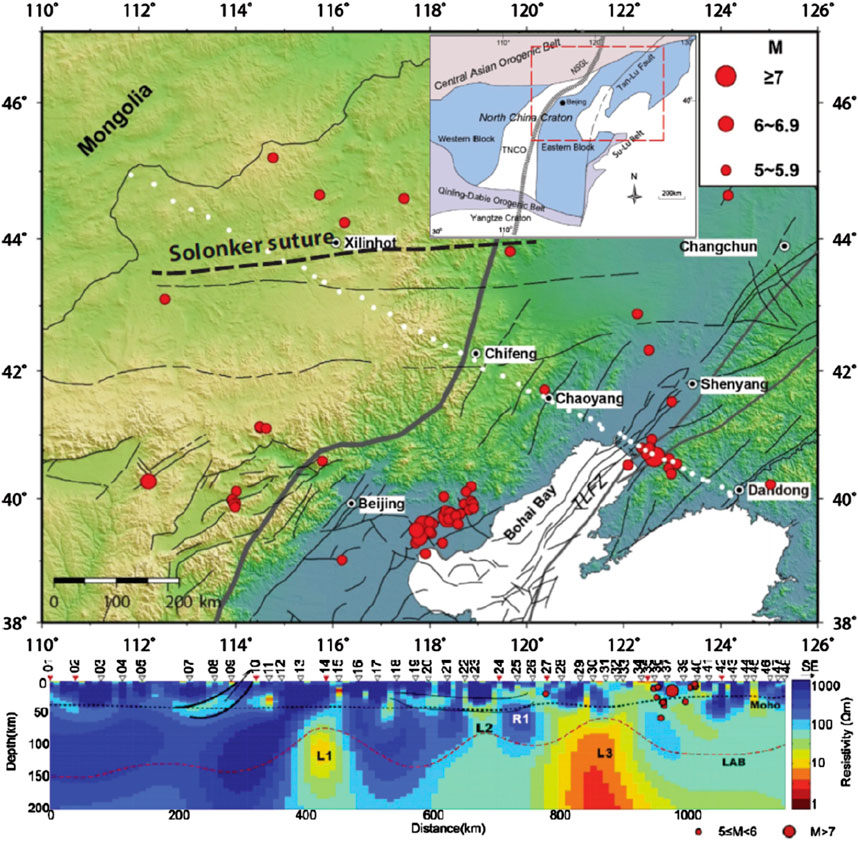
Figure 13. Distribution of the MT profile and 2D resistivity model in the northeastern boundary zone of the North China Craton (Dong et al., 2015)
2.3.4 Great Khingan range
Liang et al. (2015) used MT profile data across the Great Khingan range from the eastern segment of the CAOB to study the lithospheric electrical structure (Figure 14). The purpose of this study is to reveal the lithospheric structure of the CAOB from an electrical perspective and to provide new evidence and constraints for the exploration of its tectonic evolution process as well as a new basis for deep resource surveys in the study area. After standardized data processing, analysis and inversion, a reliable deep electrical structure model was finally obtained (lower panel of Figure 14). The results reveal a large area of low-resistivity anomaly in the middle and lower crust of the study area, which reflects the weak nature of the crust and may have formed in a late extensional environment. The low-resistivity anomaly of the lower crust and the formation of regional mineral resources may be related to the upwelling of hot mantle material. The uplift of mantle material may also be an important driving force for the late tectonic extension of the study area.
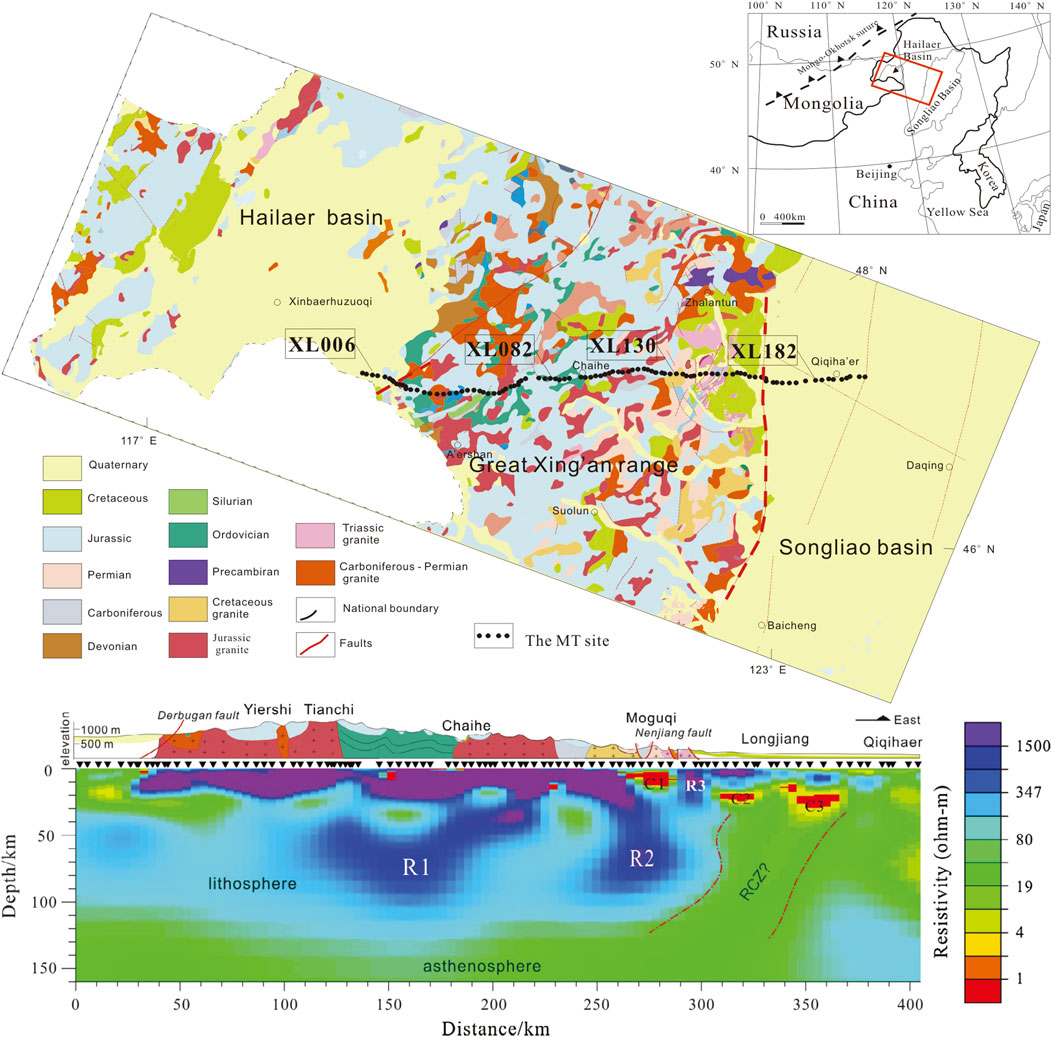
Figure 14. Distribution of the MT profile and 2D resistivity model across the Great Khingan range (Liang et al., 2015). RCZ, relic convergent zone; XL006-XL182 are MT station numbers.
2.3.5 Songliao block
The Songliao block in northeastern China is located in the superposition of multiple tectonic regimes. Its formation and evolution were affected by the closure of the Paleo-Asian Ocean, the closure of the Mongol-Okhotsk Ocean, and the subduction of the Paleo-Pacific plate (Figure 15A). Deep seismic reflection models revealed that there was a tilting mantle reflector under the Songliao block. This was speculated to be the result of the superposition, mutual subduction and compression of different tectonic regimes in the deep part of the Songliao block, followed by strong extension in the later stage. Despite the superposition and transformation of the later tectonic domains, residual traces of the preexisting tectonic regime can still be observed in the lithospheric structure. However, the relationship between the current lithospheric structure and the tectonic regime of the Songliao block is still unclear. One of the key problems is the unclear understanding of the lithospheric structure beneath the Songliao block.
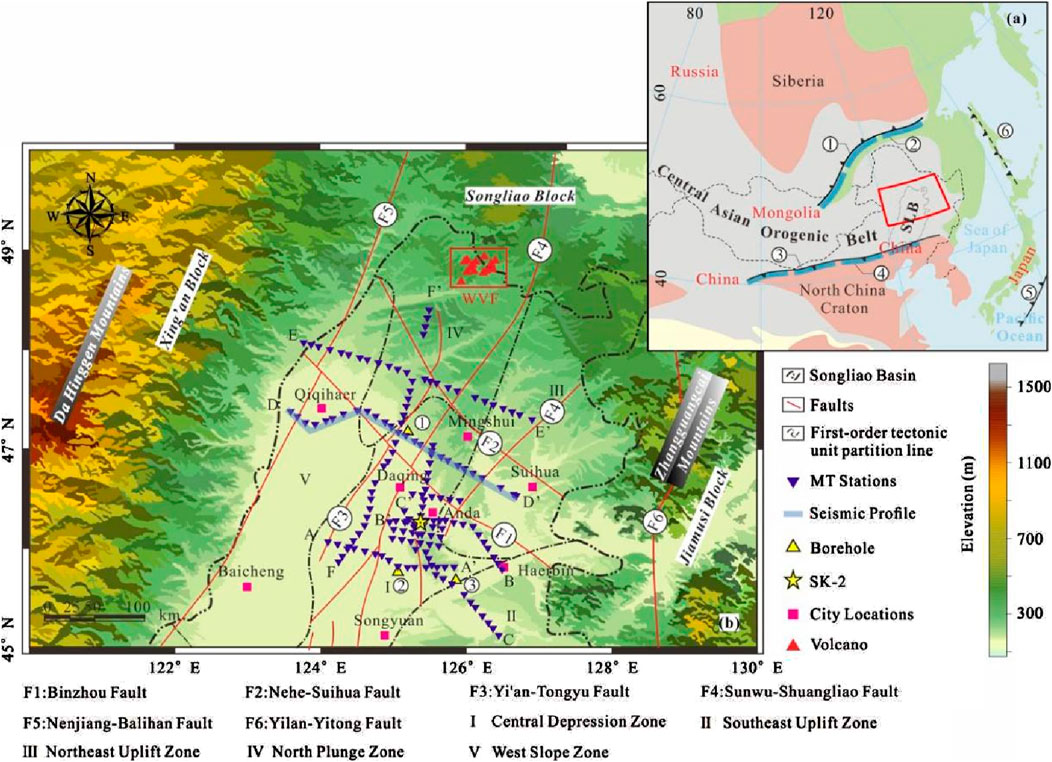
Figure 15. (A) Regional tectonic background of the Songliao block (SLB) and (B) the locations of the MT stations (Wang et al., 2022).
To address the above problems, Wang et al. (2022) conducted a MT study (Figure 15) by establishing a 3D lithospheric electrical structure model in the northern Songliao Basin (Figure 16). They revealed a heterogeneous lithosphere in the northern Songliao Basin. The lithosphere contains multiple low-resistivity anomalies (∼10 Ω m), and the conductivities of the upper crust (<10 km), middle and lower crust (15–35 km), and upper mantle (>45 km) are discussed. Among them, the resistivity anomalies in the upper crust are mostly distributed in the NE and NW directions, and orthogonal low-resistivity anomalies appear at the intersection locations. There is good correspondence between the electrical structure and the surface geological characteristics, and the low-resistivity anomaly identified is located at the boundary of the known orthogonal network fault system and under the rift basin. The low-resistivity anomaly is the result of temperature-controlled partial melting. On the basis of petrologic and seismic shear wave velocity studies (Zhan et al., 2020) of the study area, the melt proportion is calculated to be approximately 5%. Compared with deep seismic reflection profiles (Fu et al., 2019), these features are distributed near locations where the Moho offset is present, indicating that magma and magmatic fluids ascend through the Moho. Adjacent to the junction of the central depression area and the northern plunge area, the low-resistivity anomaly in the deep upper mantle is interpreted as asthenospheric upwelling near the center of the Songliao block, which represents the thinnest lithosphere in the Songliao Basin. On the basis of the 3D resistivity structure and comprehensive tectonic, geological and other geophysical characteristics, the following interpretations are proposed for the present tectonic mechanism of the lithosphere (Figure 17). Owing to the closure of the Pleo-Asian Ocean and the bidirectional convergence between the Mongol–Okhotsk Ocean and the Paleo-Pacific Ocean, collision, convergence and suturing of the Songliao Block and surrounding blocks occurred. These processes generated weak zones in the lithosphere at the edge of the Songliao Block, providing the structural base for the subsequent upward migration of fluids and melts. The fluids and melts were caused by water-bearing upwelling under the subduction of the Paleo-Pacific system. Therefore, even though the Paleo-Pacific tectonic system directly affects the current status of the lithospheric structure below the Songliao block, it is also closely related to the complex tectonic history and superimposed tectonic systems of the area.
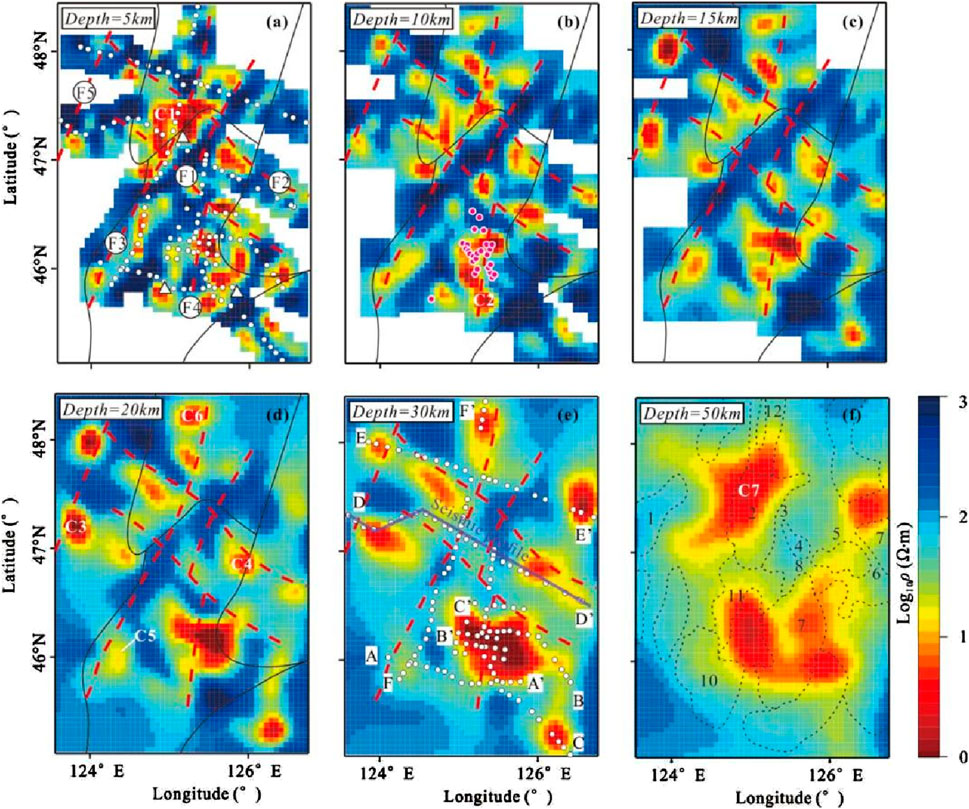
Figure 16. (A–F) Horizontal slices of the 3D resistivity model in the northern part of the Songliao block (Wang et al., 2022). The regions within the data coverage gaps are masked in the upper crust slices (A–C) due to limited constraints.
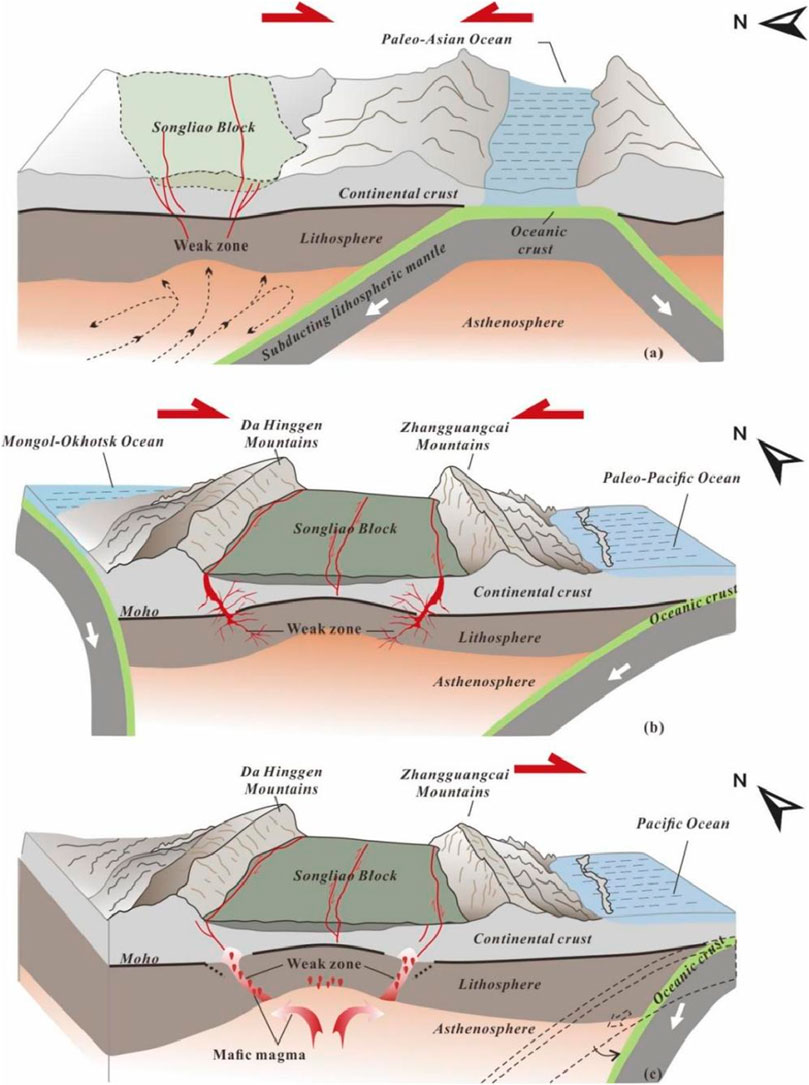
Figure 17. Schematic diagram of the formation and evolution of the Songliao block under the superposition of tectonic systems on the basis of the interpretation of the resistivity model (Wang et al., 2022). (A) Period dominated by the Paleo-Asian Ocean; (B) Period dominated by the Mongol–Okhotsk Ocean and the Paleo-Pacific Ocean; (C) present day. The red line represents fault zones; the dark green layer represents the sedimentary basin; and the red bubbles represent rising melts and fluids.
3 Discussion
3.1 General characteristics of the lithospheric electrical structure
On the basis of the results of the above studies, over the vast area of the CAOB, the electrical structure of the crust and upper mantle is mostly a three-layer structure with high resistivity in the upper crust, medium resistivity in the middle and lower crust, and low resistivity in the upper mantle (Xu et al., 2020; Käufl et al., 2020; Liang et al., 2015; Wang et al., 2022). The locations of the low-resistivity bodies in the middle and lower crust are often strongly correlated with the paleo-suture zones or paleo-subduction zones, and their spatial distribution has strong heterogeneity in the horizontal direction, as evidenced by the complex distribution pattern with horizontally alternating high and low resistivity anomalies in the middle and lower crust over the CAOB. In contrast, inside the collisional Tethys orogenic system, large-scale low-resistivity layers are widely distributed in the middle and lower crust and upper mantle (Zhang, 2017), which is generally considered due to aqueous fluids and/or partial melting, which may further weaken the lithosphere, allowing the lateral migration and flow of materials. This may reflect the significant difference in the electrical structures of the crust and upper mantle between the accretionary and collisional orogenic systems, indicating that the two essentially differ in terms of their tectonic evolution and geological processes.
Large-scale conductors were observed in the upper mantle at the northern margin of the North China Craton, which is adjacent to the southern margin of the CAOB, indicating that the lithospheric margin of the craton has been significantly modified. This phenomenon may have been common during the long process of ocean‒continent transformation of the accretionary orogeny that occurred around the stable cratons. In addition, the electrical structures of the lithosphere in the eastern and western segments of the Central Asian orogenic system also differ significantly. In general, the low-resistivity anomalies in the crust and upper mantle related to the paleo-suture zones can be clearly identified in the central and eastern segments of the CAOB (Ye et al., 2019; Dong et al., 2015; Wang et al., 2022), but this feature is only reflected in the west Junggar Basin in the western segment of the CAOB (Xu et al., 2020). This may be related to the tectonic characteristics of the western segment of the CAOB, which is dominated by orocline structures (Xiao et al., 2015), despite the relatively low level of MT studies on the western segment of the CAOB.
3.2 Formation mechanism of low-resistivity zones
In recent years, MT studies conducted within the CAOB have shown that low-resistivity bodies in the crust and upper mantle are widely distributed inside the CAOB (Comeau et al., 2020; Dong et al., 2015; Xu et al., 2016; Xu et al., 2020; Ye et al., 2019). However, there is still a lack of unified understanding of the causes of low-resistivity in these accretionary orogenic belts.
For low-resistivity bodies in the crust, Comeau et al. (2020), through quantitative theoretical analysis of the length scale and viscous compaction length of crustal fluids under a convergent tectonic setting as a function of depth, proposed that in the interior of the accretionary orogenic belt, saline fluid would be confined within the lower crust, forming locally distributed and disconnected low-resistivity bodies. The inversion results of the MT profile completed in the northeastern boundary zone of the North China Craton by Dong et al. (2015) revealed that there are large areas of low-resistivity anomaly in the middle–lower crust beneath the Solonker–Linxi suture and the Inner Mongolia axis. These areas have been interpreted as deep fluids with partial melting. Ye et al. (2019) conducted a 2D inversion study on both broadband and long-period MT profile data from the eastern segment of the CAOB crossing the Solonker suture zone and reported a southward-dipping low-resistivity zone in the high-resistivity lithosphere that cuts through the entire crust and enters the mantle. The low-resistivity zone is inferred to have been caused by subducted sulfur- and carbon-bearing sediments, which originated from the southward subduction of the Paleo-Asian Ocean.
For the low-resistivity bodies of the upper mantle, the MT study conducted by Xu et al. (2016); Xu et al. (2020) in the western Junggar area of the western segment of the CAOB revealed that there was a large subcontinental lithospheric mantle conductor distributed in a depth range of 120–220 km. The conductor was considered to represent a captured fossilized oceanic slab. The subducting slab was metasomatized by a large amount of melts and/or fluids from the top and bottom, which resulted in the enrichment of volatile metasomatized minerals in the lithospheric mantle and the formation of interconnected conductive phases, thus making the captured oceanic slab behave as a conductor captured by the shallow upper mantle after subduction due to its neutral buoyancy. In contrast, Comeau et al. (2018) and Käufl et al. (2020) reported that large-scale low-resistivity bodies in the upper mantle beneath the Hangai Dome were formed by local asthenospheric upwelling caused by delamination of the lithosphere. These low-resistivity bodies occur at different locations and depths and have different geological backgrounds; thus, the main factors considered in interpretation are different. As a result, there is no unified understanding of the cause of these low-resistivity bodies to date.
In addition, owing to the uncertainty of geophysical inversion and the volume effect of the electromagnetic field, accurately determining the shape and size of low-resistivity objects in a resistivity model is often difficult. When the scale of the interpretation problem is greater than the resolution of the resistivity model, the model can provide strong constraints for interpretation. However, if the scale of the problem is smaller than the resolution of the resistivity model, it can be inaccurate and lead to misinterpretation. The difficulty in defining the boundary of a low-resistivity body is also a factor that limits the development of quantitative explanations. In addition, at present, the connection between laboratory electrical conductivity measurement (Yang, 2014) and the electrical structure model of field survey data is not close enough. On the one hand, the factors influencing subsurface electrical resistivity are much more complex than those in laboratory measurements. With the development of laboratory electrical conductivity measurement, temperature and water content are generally considered, but factors such as other volatile like carbon dioxide, and iron ion contents are considered only in relatively few experiments. On the other hand, the composition of the crust is much more complicated than that of the mantle, and relatively simple mineral assemblage models cannot be used to simulate it. Conductivity experiments on crustal minerals require more supporting data. To better use the resistivity model to understand geological issues, interpretations should be made in combination with geological and other geophysical information based on a reliable resistivity model, and if possible, quantitative analysis should be performed in combination with laboratory electrical conductivity measurement results.
4 Conclusion and suggestions
On the basis of the review content of this paper, MT studies over the CAOB reveal the complex electrical structure of the crust and upper mantle in this region and provide valuable information for understanding its deep processes and continental dynamic mechanisms. Studies have shown that the distribution of low-resistivity bodies in the crust and upper mantle in the CAOB is closely related to paleo-suture zones or paleo-subduction zones. These features reflect the subduction, accretion and modification of the lithosphere during the long-term tectonic evolution of the CAOB. The case studies discussed in this paper verify the validity of the MT method when studying the deformation mechanism of the lithosphere in the CAOB and greatly improve our understanding of the tectonic evolution and formation mechanisms of the CAOB.
Despite significant progress, there are still different interpretations for the origins of the low-resistivity bodies in the crust and upper mantle inside the CAOB, which indicates that further studies are needed to elucidate the specific geological significance of these features. Further in-depth studies are needed to fully understand the complex geological evolution process of the CAOB. First, more comprehensive MT data collection is essentially needed, especially in the central and western segments of the CAOB, to obtain complete data coverage at the scale of the entire orogenic belt. Second, the MT method itself also needs to be improved and developed from the aspects of data processing, analysis and inversion to meet the needs of large-scale 3D MT array data acquisition, processing and inversion at the scale of the entire orogenic belt. Finally, we need to integrate MT data with other geophysical or geological data, such as through joint or constrained inversion, and compare the resistivity with other physical properties of the lithosphere (such as temperature, viscosity, water content, and melt fraction) to reduce the ambiguity of geophysical inversion, obtain a more reliable lithosphere structure model, and perform more quantitative model interpretation. A comprehensive multidisciplinary study based on geological, geochemical and other geophysical data will provide a more comprehensive perspective on the deep structure and evolution of the CAOB. This comprehensive research method helps elucidate the interactions between different geological units and how these interactions affect the accretion and evolution of continents.
In summary, these MT studies of the CAOB improves our understanding of the deep structure of the region while providing important constraints for understanding CAOB dynamics. With the advancement of technology and in-depth study, we look forward to a clearer and more complete understanding of the tectonic evolution history of the CAOB.
Author contributions
YL: Formal Analysis, Investigation, Methodology, Validation, Visualization, Writing–original draft. LeZ: Conceptualization, Data curation, Funding acquisition, Investigation, Methodology, Project administration, Resources, Writing–original draft. SJ: Funding acquisition, Project administration, Resources, Supervision, Writing–review and editing. LiZ: Investigation, Methodology, Writing–review and editing. QZ: Investigation, Methodology, Writing–review and editing.
Funding
The author(s) declare that financial support was received for the research, authorship, and/or publication of this article. This research is funded by the National Natural Science Foundation of China (42074089, 41774087, 41404060) and Deep Earth Probe and Mineral Resources Exploration - National Science and Technology Major Project (01-01-06-04). The 3D inversion is supported by the High-performance Computing Platform of China University of Geosciences (Beijing).
Acknowledgments
The authors would like to express their gratitude to the editor, BY, and the two reviewers, XL and SL, for their constructive suggestions.
Conflict of interest
The authors declare that the research was conducted in the absence of any commercial or financial relationships that could be construed as a potential conflict of interest.
Generative AI statement
The author(s) declare that no Generative AI was used in the creation of this manuscript.
Publisher’s note
All claims expressed in this article are solely those of the authors and do not necessarily represent those of their affiliated organizations, or those of the publisher, the editors and the reviewers. Any product that may be evaluated in this article, or claim that may be made by its manufacturer, is not guaranteed or endorsed by the publisher.
References
Anderson, D. L. (2006). Speculations on the nature and cause of mantle heterogeneity. Tectonophysics 416 (1-4), 7–22. doi:10.1016/j.tecto.2005.07.011
Becken, M., Ritter, O., and Burkhardt, H. (2008). Mode separation of magnetotelluric responses in three-dimensional environments. Geophys. J. Int. 172 (1), 67–86. doi:10.1111/j.1365-246x.2007.03612.x
Cawood, P. A., Kröner, A., Collins, W. J., Kusky, T. M., Mooney, W. D., and Windley, B. F. (2009). Accretionary orogens through Earth history. Geol. Soc. 318 (1), 1–36. doi:10.1144/sp318.1
Chave, A. D., and Jones, A. G. (2012). The magnetotelluric method: theory and practice. Cambridge University Press.
Chen, Y., Zhang, Z., Qian, X., Li, J., Ji, Z., and Wu, T. (2020). Early to mid-Paleozoic magmatic and sedimentary records in the Bainaimiao Arc: an advancing subduction-induced terrane accretion along the northern margin of the North China Craton. Gondwana Res. 79, 263–282. doi:10.1016/j.gr.2019.08.012
Comeau, M. J., Becken, M., Connolly, J. A., Grayver, A. V., and Kuvshinov, A. V. (2020). Compaction-driven fluid localization as an explanation for lower crustal electrical conductors in an intracontinental setting. Geophys. Res. Lett. 47 (19), e2020GL088455. doi:10.1029/2020gl088455
Comeau, M. J., Käufl, J. S., Becken, M., Kuvshinov, A., Grayver, A. V., Kamm, J., et al. (2018). Evidence for fluid and melt generation in response to an asthenospheric upwelling beneath the Hangai Dome, Mongolia. Earth Planet. Sci. Lett. 487, 201–209. doi:10.1016/j.epsl.2018.02.007
Deng, Y., and Tesauro, M. (2016). Lithospheric strength variations in Mainland China: tectonic implications. Tectonics 35 (10), 2313–2333. doi:10.1002/2016tc004272
Dong, Z., Tang, J., Unsworth, M., and Chen, X. (2015). Electrical resistivity structure of the upper mantle beneath Northeastern China: implications for rheology and the mechanism of craton destruction. J. Asian Earth Sci. 100, 115–131. doi:10.1016/j.jseaes.2015.01.008
Egbert, G. D., and Kelbert, A. (2012). Computational recipes for electromagnetic inverse problems. Geophys. J. Int. 189 (1), 251–267. doi:10.1111/j.1365-246x.2011.05347.x
Fu, W., Hou, H., Gao, R., Liu, C., Yang, J., and Guo, R. (2019). Fine structure of the lithosphere beneath the Well SK-2 and its adjacent: revealed by deep seismic reflection profile. Chin. J. Geophys. 62 (4), 1349–1361. doi:10.6038/cjg2019M0370
Hata, M., and Uyeshima, M. (2015). Temperature and melt fraction distributions in a mantle wedge determined from the electrical conductivity structure: application to one nonvolcanic and two volcanic regions in the Kyushu subduction zone, Japan. Geophys. Res. Lett. 42 (8), 2709–2717. doi:10.1002/2015gl063308
Jones, A. G. (1983). The problem of current channelling: a critical review. Geophys. Surv. 6 (1), 79–122. doi:10.1007/bf01453996
Käufl, J. S., Grayver, A. V., Comeau, M. J., Kuvshinov, A. V., Becken, M., Kamm, J., et al. (2020). Magnetotelluric multiscale 3-D inversion reveals crustal and upper mantle structure beneath the Hangai and Gobi-Altai region in Mongolia. Geophys. J. Int. 221 (2), 1002–1028. doi:10.1093/gji/ggaa039
Kelbert, A., Meqbel, N., Egbert, G. D., and Tandon, K. (2014). ModEM: a modular system for inversion of electromagnetic geophysical data. Comput. and Geosciences 66, 40–53. doi:10.1016/j.cageo.2014.01.010
Li, Y., Jiang, H., and Yang, X. (2017). Fluorine follows water: effect on electrical conductivity of silicate minerals by experimental constraints from phlogopite. Geochimica Cosmochimica Acta 217, 16–27. doi:10.1016/j.gca.2017.08.020
Li, Y., Yang, X., Yu, J.-H., and Cai, Y.-F. (2016). Unusually high electrical conductivity of phlogopite: the possible role of fluorine and geophysical implications. Contributions Mineralogy Petrology 171, 37–11. doi:10.1007/s00410-016-1252-x
Liang, H.-D., Gao, R., Hou, H.-S., Liu, G.-X., Han, J.-T., and Han, S. (2015). Lithospheric electrical structure of the Great xing’an range. J. Asian Earth Sci. 113, 501–507. doi:10.1016/j.jseaes.2015.01.026
Liu, L., and Hasterok, D. (2016). High-resolution lithosphere viscosity and dynamics revealed by magnetotelluric imaging. Science 353 (6307), 1515–1519. doi:10.1126/science.aaf6542
Liu, Y., Li, W., Ma, Y., Feng, Z., Guan, Q., Li, S., et al. (2021). An orocline in the eastern central Asian orogenic belt. Earth-Science Rev. 221, 103808. doi:10.1016/j.earscirev.2021.103808
Rodi, W., and Mackie, R. L. (2001). Nonlinear conjugate gradients algorithm for 2-D magnetotelluric inversion. Geophysics 66 (1), 174–187. doi:10.1190/1.1444893
Schulmann, K., and Paterson, S. (2011). Asian continental growth. Nat. Geosci. 4 (12), 827–829. doi:10.1038/ngeo1339
Şengör, A., Natal'In, B., and Burtman, V. (1993). Evolution of the Altaid tectonic collage and Palaeozoic crustal growth in Eurasia. Nature 364 (6435), 299–307. doi:10.1038/364299a0
Song, D., Xiao, W., Windley, B. F., Han, C., and Tian, Z. (2015). A paleozoic Japan-type subduction-accretion system in the beishan orogenic collage, southern central asian orogenic belt. Lithos 224, 195–213. doi:10.1016/j.lithos.2015.03.005
Tan, X. M., Zhou, J. B., Deng, X. F., Wang, H. Y., Hou, H. S., Li, H. L., et al. (2023). Crustal-scale seismic reflection profiling constrains how the paleo-Asian Ocean was closed. Tectonics 42 (9), e2023TC007921. doi:10.1029/2023tc007921
Wang, T., Ma, G., Comeau, M. J., Becken, M., Zhou, Z., Liu, W., et al. (2022). Evidence for the superposition of tectonic systems in the northern Songliao Block, NE China, revealed by a 3-D electrical resistivity model. J. Geophys. Res. Solid Earth 127 (4), e2021JB022827. doi:10.1029/2021jb022827
Wannamaker, P. E., Hohmann, G. W., and Ward, S. H. (1984). Magnetotelluric responses of three-dimensional bodies in layered earths. Geophysics 49 (9), 1517–1533. doi:10.1190/1.1441777
Windley, B. F., Alexeiev, D., Xiao, W., Kröner, A., and Badarch, G. (2007). Tectonic models for accretion of the central asian orogenic belt. J. Geol. Soc. 164 (1), 31–47. doi:10.1144/0016-76492006-022
Windley, B. F., and Xiao, W. (2018). Ridge subduction and slab windows in the Central Asian Orogenic Belt: tectonic implications for the evolution of an accretionary orogen. Gondwana Res. 61, 73–87. doi:10.1016/j.gr.2018.05.003
Xiao, W., Han, C., Liu, W., Wan, B., Zhang, J. e., Ao, S., et al. (2014). How many sutures in the southern Central Asian orogenic belt: insights from east Xinjiang–west Gansu (NW China)? Geosci. Front. 5 (4), 525–536. doi:10.1016/j.gsf.2014.04.002
Xiao, W., Song, D., Windley, B. F., Li, J., Han, C., Wan, B., et al. (2019). Research progresses of the accretionary processes and metallogenesis of the central asian orogenic belt. Sci. China Earth Sci. 49 (10), 1512–1545. doi:10.1360/SSTe-2019-0133
Xiao, W., Windley, B. F., Han, C., Liu, W., Wan, B., Zhang, J. e., et al. (2018). Late Paleozoic to early Triassic multiple roll-back and oroclinal bending of the Mongolia collage in Central Asia. Earth-Science Rev. 186, 94–128. doi:10.1016/j.earscirev.2017.09.020
Xiao, W., Windley, B. F., Hao, J., and Zhai, M. (2003). Accretion leading to collision and the Permian Solonker suture, Inner Mongolia, China: termination of the central Asian orogenic belt. Tectonics 22 (6). doi:10.1029/2002tc001484
Xiao, W., Windley, B. F., Sun, S., Li, J., Huang, B., Han, C., et al. (2015). A tale of amalgamation of three Permo-Triassic collage systems in Central Asia: oroclines, sutures, and terminal accretion. Annu. Rev. earth Planet. Sci. 43 (1), 477–507. doi:10.1146/annurev-earth-060614-105254
Xu, Y., Yang, B., Zhang, A., Wu, S., Zhu, L., Yang, Y., et al. (2020). Magnetotelluric imaging of a fossil oceanic plate in northwestern Xinjiang, China. Geology 48 (4), 385–389. doi:10.1130/g47053.1
Xu, Y., Yang, B., Zhang, S., Liu, Y., Zhu, L., Huang, R., et al. (2016). Magnetotelluric imaging of a fossil paleozoic intraoceanic subduction zone in western Junggar, NW China. J. Geophys. Res. Solid Earth 121 (6), 4103–4117. doi:10.1002/2015jb012394
Xu, Y., Zhang, A., Yang, B., Bao, X., Wang, Q., Xia, J., et al. (2018). Bridging the connection between effective viscosity and electrical conductivity through water content in the upper mantle. Sci. Rep. 8 (1), 1771. doi:10.1038/s41598-018-20250-2
Yang, X. (2014). Electrical petrology: principles, methods and advances. Sci. Sin. Terrae 44, 1884–1990. doi:10.1360/zd-2014-44-9-1884
Ye, G., Unsworth, M., Wei, W., Jin, S., and Liu, Z. (2019). The lithospheric structure of the Solonker Suture Zone and adjacent areas: crustal anisotropy revealed by a high-resolution magnetotelluric study. J. Geophys. Res. Solid Earth 124 (2), 1142–1163. doi:10.1029/2018jb015719
Zhan, W., Pan, L., and Chen, X. (2020). A widespread mid-crustal low-velocity layer beneath Northeast China revealed by the multimodal inversion of Rayleigh waves from ambient seismic noise. J. Asian Earth Sci. 196, 104372. doi:10.1016/j.jseaes.2020.104372
Zhang, L. (2017). A review of recent developments in the study of regional lithospheric electrical structure of the Asian continent. Surv. Geophys. 38 (5), 1043–1096. doi:10.1007/s10712-017-9424-4
Zhang, S., Gao, R., Li, H., Hou, H., Wu, H., Li, Q., et al. (2014). Crustal structures revealed from a deep seismic reflection profile across the Solonker suture zone of the Central Asian Orogenic Belt, northern China: an integrated interpretation. Tectonophysics 612, 26–39. doi:10.1016/j.tecto.2013.11.035
Keywords: magnetotellurics, Central Asian Orogenic Belt, Paleo-Asian Ocean, lithospheric electrical structure, formation mechanism of low-resistivity zones
Citation: Li Y, Zhang L, Jin S, Zhou L and Zong Q (2025) A review on the magnetotelluric studies over the Central Asian Orogenic Belt—recent developments and future aspects. Front. Earth Sci. 12:1526432. doi: 10.3389/feart.2024.1526432
Received: 11 November 2024; Accepted: 27 December 2024;
Published: 20 January 2025.
Edited by:
Bo Yang, Zhejiang University, ChinaCopyright © 2025 Li, Zhang, Jin, Zhou and Zong. This is an open-access article distributed under the terms of the Creative Commons Attribution License (CC BY). The use, distribution or reproduction in other forums is permitted, provided the original author(s) and the copyright owner(s) are credited and that the original publication in this journal is cited, in accordance with accepted academic practice. No use, distribution or reproduction is permitted which does not comply with these terms.
*Correspondence: Letian Zhang, bGV0aWFuT0lAZ21haWwuY29t; Sheng Jin, amluc2hlbmdAY3VnYi5lZHUuY24=