 Kenshiro Arie
 Chiyuki Narama
 Kotaro Fukui4
- 1Earth Observation Research Center, Japan Aerospace Exploration Agency, Tsukuba, Japan
- 2Graduate School of Science and Technology, Niigata University, Niigata, Japan
- 3Program of Field Research in the Environmental Sciences, Niigata University, Niigata, Japan
- 4Tateyama Caldera Sabo Museum, Toyama, Japan
In this study, we measure ice thickness and flow and reveal that Shakushizawa and Kaerazuzawa perennial snow patches (PSPs) in the northern Japanese Alps are glaciers instead. Due to their size, they are very small glaciers (VSGs). For the Shakushizawa VSG investigated by this study, we also calculate the long-term average annual surface mass balances to assess the persistence mechanisms of VSGs in this region. The mass balance calculation is done by substituting the ice thickness and surface flow velocity measured on the Shakushizawa VSG into the continuity equation under the assumption of the steady-state in the long-term average. The annual surface mass balance altitude profile in the long-term average of the Shakushizawa VSG has a positive gradient with the accumulation area upstream and the ablation area downstream. If the other VSGs in the northern Japanese Alps have the same characteristics, these have a localized accumulation area in the long-term average below the climatic ELA by topographic effects. These results suggest that glaciers in the northern Japanese Alps are maintained due to topographic effects, despite being located below the climatic equilibrium line altitude (ELA).
1 Introduction
According to the latest version of the Randolph Glacier Inventory, glaciers (excluding the ice sheets of Antarctica and Greenland) currently number approximately 270,000 on Earth (Consortium, 2023). Among these, glaciers with an area of 0.5 km2 or less are classified as very small glaciers (VSGs: Huss and Fischer, 2016), accounting for around 200,000, or more than 70% of the total. VSGs are located in regions where the mountain summit slightly exceeds the regional equilibrium line altitude (ELA) or where the accumulation area is formed by topographic effects under conditions below the regional ELA. These VSGs are categorized as climate-dependent and topography-dependent, respectively (Kuhn, 1995). Generally, VSGs are particularly sensitive to climate change and exhibit a short response time to climatic variations (Grudd, 1990; Oerlemans, 1994; Nesje et al., 2008; Federici and Pappalardo, 2010). Due to their large numbers and rapid response to climate change, most VSGs are projected to disappear by 2,100 even if future temperature increases are limited to 1.5°C (Rounce et al., 2023). This anticipated loss raises concerns about the impact on local water resources and sea level rise (Bahr and Radić, 2012; Huss and Hock, 2015). However, the responses of individual VSGs to changes in climatic forcing depend on the site, being influenced by topographic factors, feedbacks, and non-linearities (Kuhn, 1995; López-Moreno et al., 2006; Carturan et al., 2013). In addition, Huss and Fischer (2016) indicated that some topographically controlled VSGs in the Swiss Alps are less sensitive to temperature fluctuations and may survive future warming despite the fact that most VSGs in the Swiss Alps will disappear by 2060. The lower sensitivity of topographically controlled VSGs to temperature rise has also been reported in the Eastern Alps (Carrivick et al., 2015) and Canadian Rockies (DeBeer and Sharp, 2009). Although VSGs are relevant for a wide range of aspects in high mountain environments, they are undersampled in worldwide glacier monitoring efforts (WGMS, 2012; Huss and Fischer, 2016). In order to understand the future evolution of VSGs, which are expected to increase in number due to global warming, it is necessary to conduct field observations of VSGs in various regions, climate and topographic conditions.
Recently, although this region has been considered too warm to be glaciated (Hoshiai and Kobayashi, 1957), seven VSGs were confirmed in the northern Japanese Alps (Fukui and Iida, 2012; Fukui et al., 2018; Fukui et al., 2021; Arie et al., 2019). Moreover (Arie et al., 2022), determined the annual and seasonal mass balance of five VSGs in this region (Gozenzawa Glacier, Sannomado Glacier, Komado Glacier, Kakunezato Glacier, Karamatsuzawa Glacier). Using geodetic methods with aerial photography and photogrammetry, they showed that these VSGs show the highest amounts of winter accumulation (20 m snow accumulation) and summer ablation among all glaciers recorded by the World Glacier Monitoring Service (WGMS). These VSGs are comprised of the latest version of the Randolph Glacier Inventory (Consortium, 2023). In addition, for some PSPs and VSGs in this region, the characteristics of the accumulation area throughout in heavy snow years, as well as the ablation area throughout in light snow years, were confirmed (Higuchi et al., 1979; Fukui et al., 2018; Fukui et al., 2021; Arie et al., 2022). However, the glacier equilibrium-line altitude (ELA) that separates the accumulation and ablation areas could not be defined, and the persistence mechanisms remained unclear for these VSGs. In addition, more than 100 perennial snow patches (PSPs) are distributed throughout the northern Japanese Alps (Higuchi and Iozawa, 1971). Although PSPs may be difficult to distinguish from VSGs (Cogley et al., 2011), VSGs distinguished from PSPs in the sense that they are “continuously moving” in Japan (Fukui and Iida, 2012; Fukui et al., 2018; Fukui et al., 2021). However, GPR and GNSS surveys have not been done for all PSPs in the northern Japanese Alps, and the glacier distribution has not been confirmed.
In general, to determine the ELA, the altitude profile of the surface mass balance must be measured. However, for VSGs in Japan, it is difficult to measure the surface mass balance using the direct glaciological method due to snow depths exceeding 20 m in winter as a result of heavy snowfalls and avalanching. Sawagaki et al. (2014) estimated the ELA and surface mass balance of the Rhone Glacier in Switzerland and the Stor Glacier in Sweden using data for observed ice thickness and calculated the flow velocity using the empirical formula for glacial flow and the continuity equation (Cogley et al., 2011) under the assumption that the glaciers were in a steady-state. However, as the mechanism of glacier flow of VSGs in Japan remains unclear (Arie et al., 2019; Arie et al., 2022), it is difficult to calculate their flow velocity based on an empirical glacier flow equation. Therefore, actual measurements of ice thickness and flow velocity over a wide area of VSGs are required to estimate the surface mass balance under a steady-state. Previous flow velocity measurements using GNSS surveys in VSGs were limited to small areas.
It is necessary to measure the glacial thickness and flow by field observations in order to understand the distribution and the maintenance mechanisms of VSGs in the northern Japanese Alps, which are difficult to measure using ELA every year. For this study, we measured ice thickness and flow using GPR and GNSS surveys on Shakushizawa and Kaerazuzawa PSPs in the northern Japanese Alps. Though they are classified as PSPs, we examine whether they should be classified as VSGs. In addition, we also measured the flow velocity in the lower area of Shakushizawa PSP where covered by debris using image-matching analysis. Then, we calculated the surface mass balance of the Shakushizawa VSG, which this study identifies as a VSG, under the assumption of the steady-state in the long-term average from ice thickness and surface flow velocity over a wide area, to assess the persistence mechanisms of VSGs in this region.
2 Study area
Shakushizawa and Kaerazuzawa PSPs both lie further north than the previously confirmed VSGs in the northern Japanese Alps (Figure 1). The furthest north of the two, Shakushizawa PSP (Figure 2A), lies at the head of a glacial trough, extending southeast from the peak of Mt. Shakushi (2,812 m a.s.l). At the end of the snowmelt season, its downstream section is covered with thick debris. Approximately 4 km south of Shakushizawa lies Kaerazuzawa PSP (Figure 2B) at the head of a glacial trough that extends northeast from the peak of Mt. Karamatsu (2,696 m a.s.l). At the end of the snowmelt season, its middle section is covered with debris. Table 1 shows the lengths, widths, areas, and altitude range of both Shakushizawa and Kaerazuzawa, as well as of the previously confirmed VSGs, at the end of the 2020 snowmelt season.
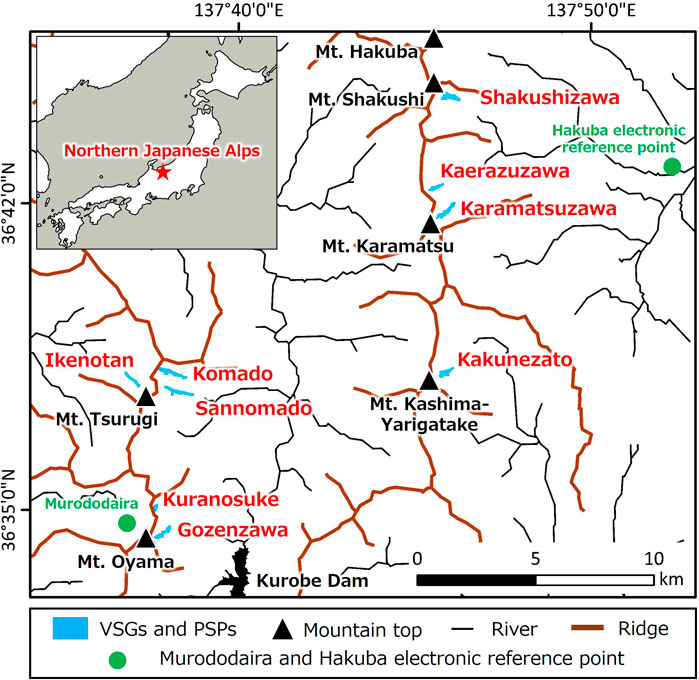
Figure 1. Location of seven PSPs with evidence for classification as VSGs as well as Shakushizawa and Kaerazuzawa PSPs. Murododaira is the place where measurements of snow depth in March for 1996–2018 were carried out (Iida et al., 2018).
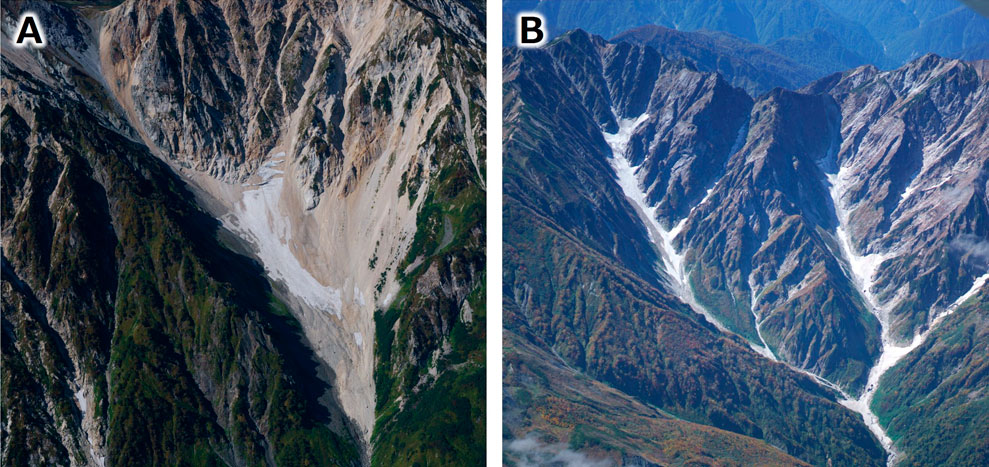
Figure 2. Shakushizawa (A) and Kaerazuzawa ((B): gully on right) at the end of snowmelt season. The aerial photo of Shakushizawa (A) was taken on 3 October 2022 and the aerial photo of Kaerazuzawa (B) was taken on 3 October 2018. Left gully in (B) is the Karamatsuzawa VSG.
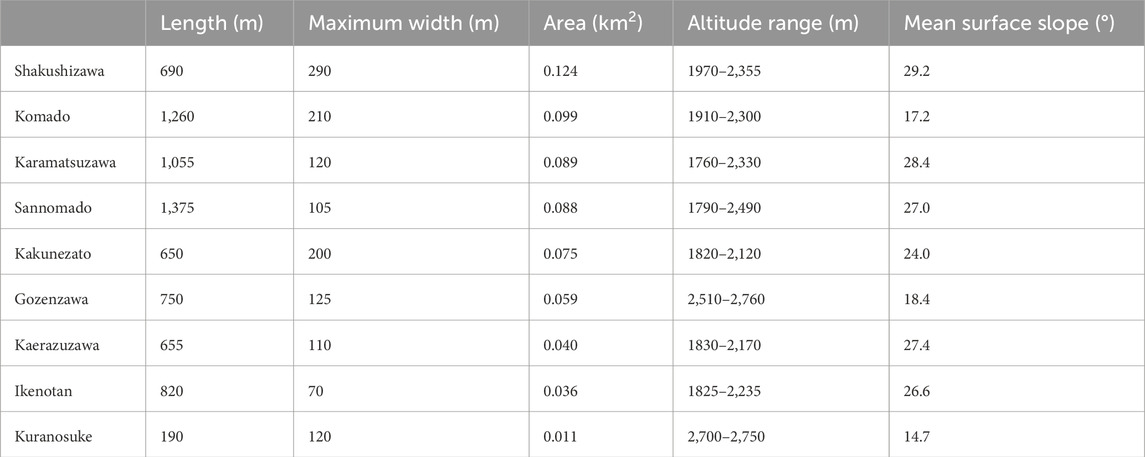
Table 1. Characteristics of Shakushizawa and Kaerazuzawa PSPs and five other VSGs at the end of the snowmelt season in 2020.
The area of the Shakushizawa PSP was larger than that of the VSGs confirmed previously, while the area of the Kaerazuzawa PSP was the third smallest among the confirmed VSGs. The mean annual air temperature in 2011 near the summit of Mt. Hakuba (2,932 m a.s.l.) is −2.3°C, as measured by the Research Center for Mountain Environments at Shinshu University. For 1996–2018, the average March snow depth at Murododaira (2,450 m a.s.l.; Figure 1), located on the west side of a mountain ridge, is approximately 6.8 m (Iida et al., 2018). Shakushizawa and the Kaerazuzawa PSPs, as well as the seven VSGs, are all situated at the bottom of steep and narrow valleys and are therefore heavily influenced by avalanching in addition to large snowfalls. Arie et al. (2022) measured snow accumulation depths exceeding 20 m for five VSGs (Gozenzawa, Sannomado, Komado, Kakunezato, and Karamatsuzawa).
3 Methods
3.1 Measurements of ice thickness and flow
For both Shakushizawa and Kaerazuzawa PSPs, we use GPR surveys to determine the presence of thick ice bodies that cause sufficient flow. We use a GPR survey unit (SIR4000, GSSI, Nashua, NH, United States) that records data and a shielded antenna (GSSI: Model 3,207) with a centre frequency of 100 MHz. This GPR survey unit was also used to observe the glacial thickness of the Karamatsusawa VSG (Arie et al., 2019). For data analysis, we use the RADAN 7 software from GSSI. The relative permittivity used for the analysis is 3.2 (propagation velocity is 168 m μs–1). The measurement dates are 14 August 2022 at the Shakushizawa PSP and 31 August 2021 at the Kaerazuzawa PSP. For the Shakushizawa PSP, we measured one longitudinal and three transverse profile lines, whereas, at the Kaerazuzawa PSP, we measured one longitudinal and four transverse profile lines. The data are cross-checked at the intersection of the longitudinal and profile lines (Figure 3). The transverse lines, except for L5 of Kaerazuzawa PSP, completely cross the glacier. At these intersections, the depth difference at the bedrock is assumed to represent the measurement error of a GPR survey. The positions of the survey lines were recorded using the GARMIN® GPSMAP 66i (Garmin, Olathe, KS, United States) which has a standard 3-m accuracy (Keany et al., 2024). The surface elevation of the GPR survey line is obtained from a digital surface model (DSM), which is generated by aerial photographs taken on 2 October 2022 and the SfM-MVS software (Pix4Dmapper, Prilly, Switzerland). The surface resolution of the DSM is about 15 cm.
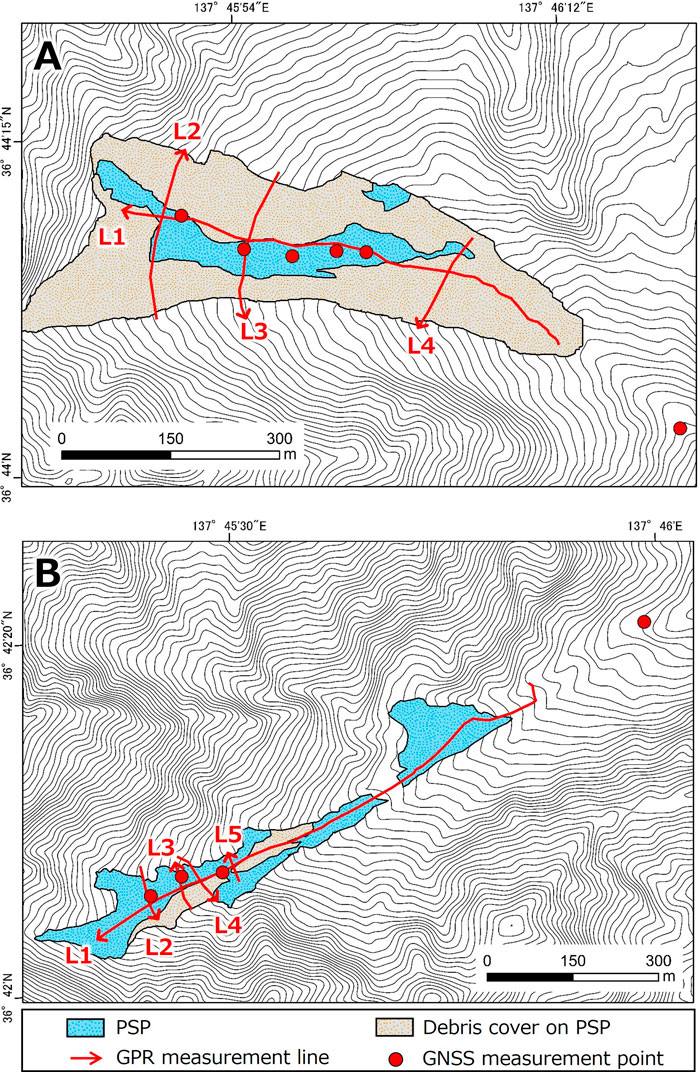
Figure 3. Areas, GPR measurement lines, and GNSS measurement points for (A) Shakushizawa, and (B) Kaerazuzawa PSPs. Contour interval is 10 m.
For each flow measurement, a vertical hole of about 6‒9 m was drilled using an electric ice drill, and two 4.6-m-long stakes were connected and inserted to reach the ice layer. An antenna connected to GNSS surveying equipment (GEM-3; ENABLER, Tokyo, Japan) was attached to the tip of the stake, and positioning was done using the static method for 40 min. Five stakes were placed on 18 September 2022 at the Shakushizawa PSP, and three were placed on 14 September 2022 at the Kaerazuzawa PSP (Figure 3). After 1 month (14 October 2022 at the Shakushizawa PSP and 11 October 2022 at the Kaerazuzawa PSP), the position of each stake tip was re-measured using GNSS, and the surface flow velocity is calculated from the differences in horizontal distance. A base point was placed on the bedrock near the termini of each PSP, and the difference between the horizontal coordinates of the two measurements was used as the measurement error of the GNSS survey. To ensure that the stakes were firmly anchored, we wrapped them with a water-expandable rubber covering. Moreover, for each stake and each measurement, we use a level to confirm they have remained vertical in the ice body. The coordinates of the GNSS survey data at the stake tip are determined by post-processing using the open-source program RTKLIB (version 2.4.3) with the base station data of the Hakuba electronic reference point of the Geospatial Information Authority of Japan (Figure 1).
In addition, the flow of the debris cover area in the lower zone of the Shakushizawa PSP is calculated using image-matching analysis software [CIAS software, originally written by Kääb and Vollmer (2000)]. Shaded undulation maps are created from the airborne laser DSM of the Geospatial Information Authority of Japan for 16 October 2011 and 26 September 2014.
3.2 Calculation of the annual surface mass balance using the continuity equation of glacial flow
Assuming steady-state, we estimate the equilibrium line altitude (ELA) from the surface mass balance by substituting the measured ice thickness and flow into the continuity equation of glacier flow. The continuity equation of glacier flow is as follows (Cogley et al., 2011; Nuimura et al., 2011):
where ρ is the average density of the glacier (kg m–3), s is the area (m2), h is the ice thickness (m), a is the annual, b is the annual surface mass balance (kg a−1) (the mass in and out of the glacier interior and bottom should be included, but due to measurement difficulties (Cogley et al., 2011), we ignore this contribution), and
where W is the width of the glacier cross-section (m), h is the ice thickness (m), and
For the Shakushizawa PSP, we examine 10 cross-sections in which we measured ice thickness and flow over most of the area. Then we designate 8 flux boxes, designed by connecting the two ends of the cross-sections with straight lines, and calculate the annual surface mass balance for each flux box. When the glacier is steady, the annual surface mass balance b in each flux box can be expressed by the Equation 3 derived from Equation 1:
where qUp is the flow in the upstream cross-section in the flux box (kg a−1), qDown is the flow in the downstream cross-section in the flux box (kg a−1), and Sf is the area of the flux box (m2). Both qUp and qDown are calculated from Equation 2. Following Cuffey and Paterson (2010), the depth-averaged flow
To help determine if the glaciers in the northern Japanese Alps were in the steady-state, we compare the past and present glacier areas calculated from orthophoto images of aerial photographs acquired in 1955, 1965, and 1976. Specifically, we use Geospatial Information Authority of Japan (GSI) aerial photographs taken on 25 September 1955 for Sannomado Glacier and Komado Glacier, 30 October 1965 for KakunezatoVSG, 18 October 1976 for Karamatsuzawa Glacier, and 23 October 1976 for the Shakushizawa PSP.
4 Results
4.1 Ice thickness and flow in two PSPs
Consider the cross-sections along the longitudinal lines (L1) as measured by the GPR survey. The arrows in the profiles of Figure 4 represent positions of strong reflection. For the Shakushizawa PSP, Figure 4A appears to show two reflective surfaces. Kawashima et al. (1993) showed that, in Japan, a water-saturated layer existed just above the firn and ice transition during the ablation period. Due to water’s high relative permittivity, the strong reflection observed at 1–10 m depths from the surface presumably indicated boundary between snow-firn and ice. Because the GPR measurement starts from the bedrock and is continuous with the reflective layer at the starting point, the reflection over 30 m down for most of the profile presumably indicates bedrock. The maximum reflection depth of the bedrock was 47 m at a distance of 160 m. For the Kaerazuzawa PSP (Figure 4B), the strong reflection, presumably bedrock, was confirmed as well, and the maximum reflection depth of the bedrock is 32 m at 750 m. In addition, strong reflections presumably indicated boundary between snow-firn and ice were also confirmed at depths of 1–10 m except from 0 to about 100 m up the profile and from about 300 to 400 m. These regions without a second reflecting layer coincide with regions that had neither snow nor ice in October 2020 (the year before the GPR measurement).
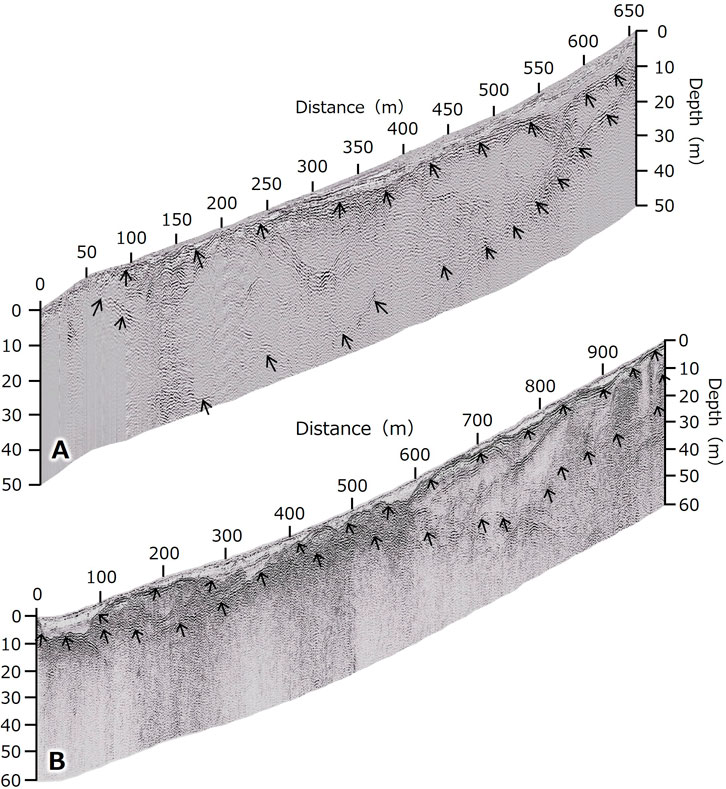
Figure 4. Longitudinal GPR profiles (L1). (A) Shakushizawa, (B) Kaerazuzawa PSPs. Depth is expanded fourfold. Arrows mark the depths of strong reflections.
Now consider the transverse cross-sections. Figure 5A shows the GPR profiles along transverse cross-sections L2‒L4 of the Shakushizawa PSP. At right, in Figure 5B, are short sections of the nearby longitudinal profiles. The vertical dot-dash lines are their intersection lines. The difference in measured depth of the bedrock between the transverse and longitudinal reflections is less than 2 m. The analogous comparison of transverse and longitudinal cross-sections for the Kaerazuzawa PSP is shown in Figure 6. For this case, the difference in measured depth of bedrock reflections between the intersecting cross-sections is less than 3 m. Therefore, the maximum discrepancy in the measured bedrock depths for both Shakushizawa and Kaerazuzawa PSPs is about 3 m (L2 in Kaerazuzawa). So, we approximate the error in the GPR measurements at 3 m.
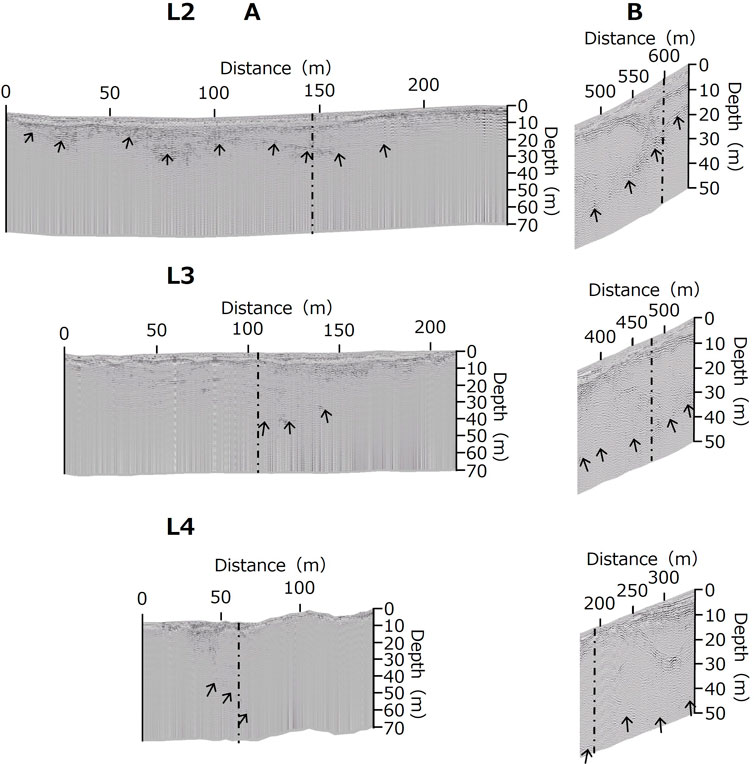
Figure 5. GPR profile along the transverse measurement lines and intersecting sections of the longitudinal line for the Shakushizawa PSP. (A) Transverse lines L2, L3, and L4. Reflection from bedrock could be measured only in the central region of the profile where there were no debris deposits. (B) Longitudinal measurements near the intersections. Depth scale is expanded fourfold. Vertical dot-dash lines mark the intersection of the transverse and longitudinal lines.
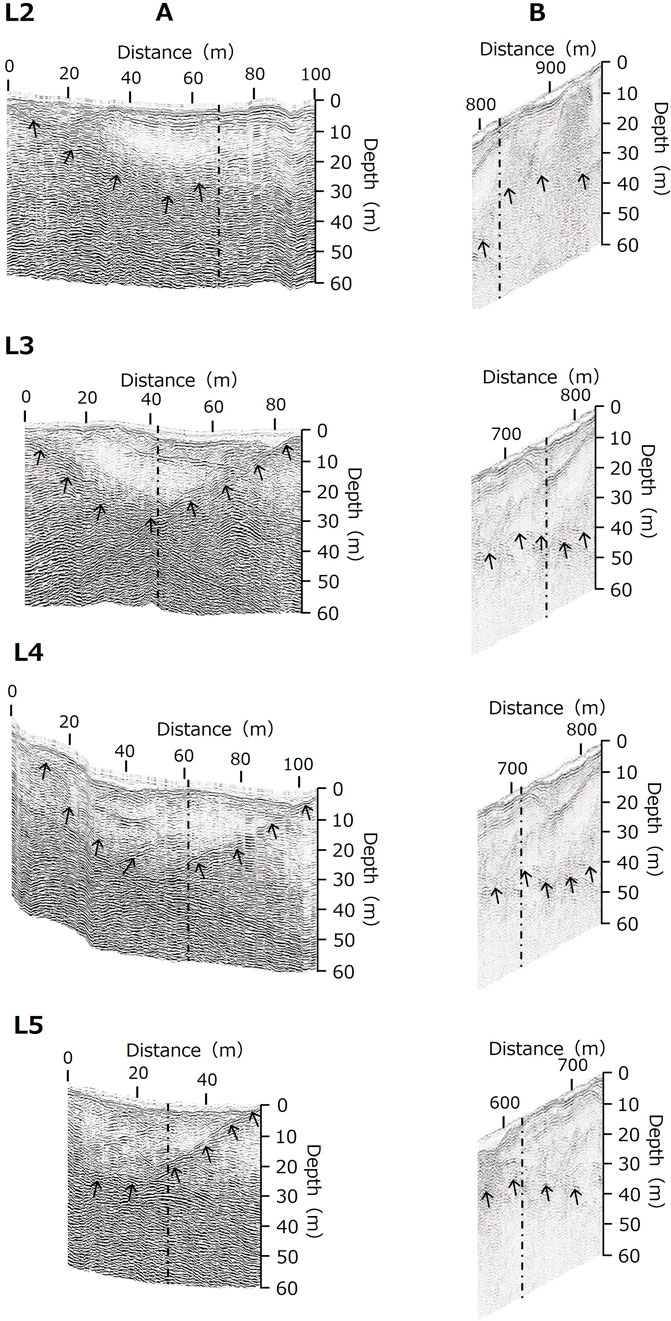
Figure 6. GPR profile along the transverse measurement lines and intersecting sections of the longitudinal line for the Kaerazuzawa PSP. (A) Transverse lines L2, L3, L4, and L5. (B) Longitudinal measurements near the intersections. Depth scale is expanded fourfold. Vertical dot-dash lines mark the intersection of the transverse and longitudinal lines.
We now examine the measured horizontal movements. For the Shakushizawa PSP, the horizontal movement of the five stakes determined from two measurements taken over 29 days at the end of the 2022 snowmelt season is shown at Figure 7A. Also, the direction of movement is consistent with the direction of the maximum slope of the surface. The horizontal movement at the bedrock (P6) is 1 cm over 29 days, so the measurement error is assumed to be 1 cm. For the Kaerazuzawa PSP, the horizontal movement of the three stakes determined from two measurements taken over 27 days at the end of the 2022 snowmelt season is shown at Figure 7B. As with Shakushizawa, the direction of movement is consistent with the direction of the maximum surface slope. For the Kaerazuzawa PSP, the horizontal movement at the bedrock (P4) is 3 cm over 27 days, so the measurement error is set to 3 cm. In both cases, the measured flow is significantly higher than the measurement error. As the stakes maintained their vertical orientation after moving, stake inclination did not contribute to measurement error upon being re-measured. In addition, the image-matching analysis shows that horizontal movement of the debris deposit area downstream ranges from 2 to 5 m a−1 (Figure 8).
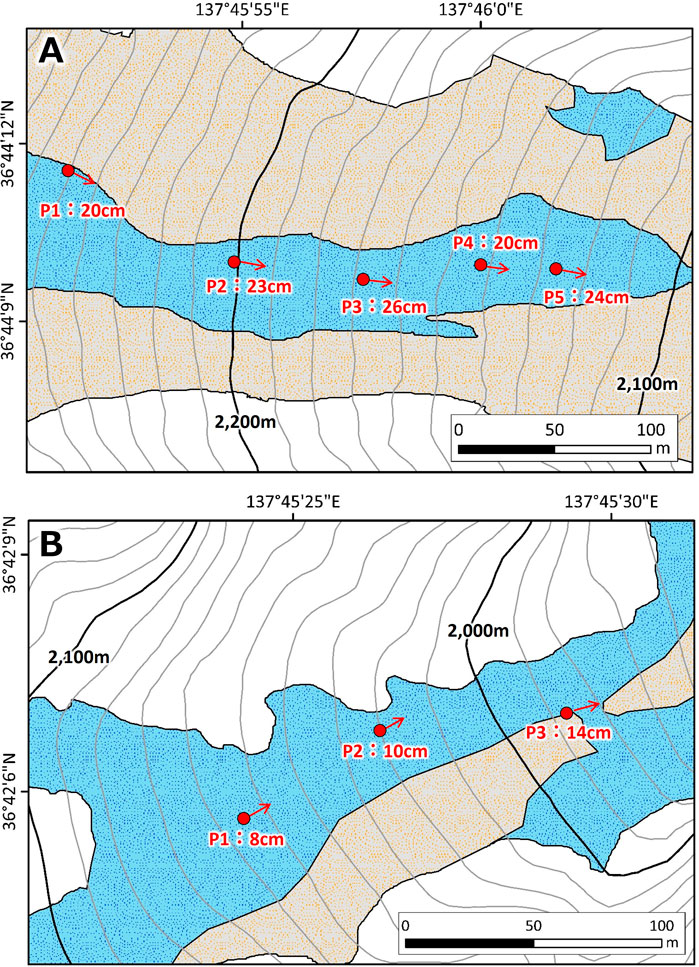
Figure 7. Horizontal movement distances over 26 and 27 days. (A) The Shakushizawa PSP (from September 18 to 14 October 2022: 26 days. (B) The Kaerazuzawa PSP (from September 14 to 11 October 2018: 27 days. Contour interval is 10 m for both cases.
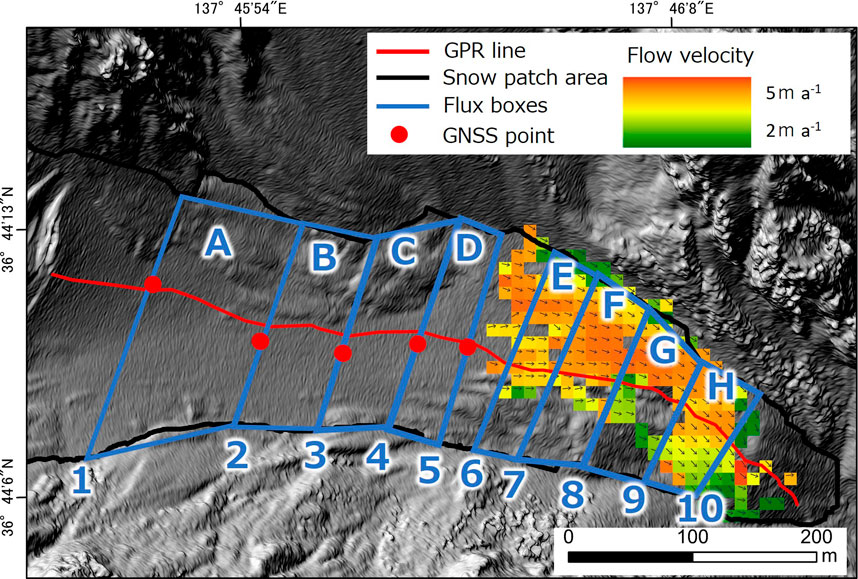
Figure 8. GPR measurement lines, GNSS measurement points, created flux boxes and results of image-matching analysis in the Shakushizawa PSP.
4.2 Profile of the annual mass balance of the Shakushizawa PSP under steady-state conditions and a comparison with WGMS glaciers
Now consider the flux boxes to estimate the annual surface mass balance. Based on the results of the GNSS survey and the image-matching analysis, we designate ten glacier cross-sections (1–10) and eight flux boxes (A–H) by connecting the two cross-sections with straight lines as the volumes between adjacent cross-sections, as shown in Figure 8. Due to the designated flux boxes being created with consideration of the seasonal changes in the surface flow velocity, a flux box connecting 5 and 6 cross-sections is not created. Specifically, the image-matching analysis tracks the flow velocity over the entire year, whereas the GNSS survey analyses the flow velocity over 1 month at the end of the snowmelt season.
We now examine the data for the flux boxes shown in Figure 8. The data shows that the higher the altitude, the more positive the annual surface mass balance (Figure 9, red curve). Thus, the long-term average annual surface mass balance has a positive gradient in the altitude profile, confirming that there is an accumulation area upstream and an ablation area downstream.
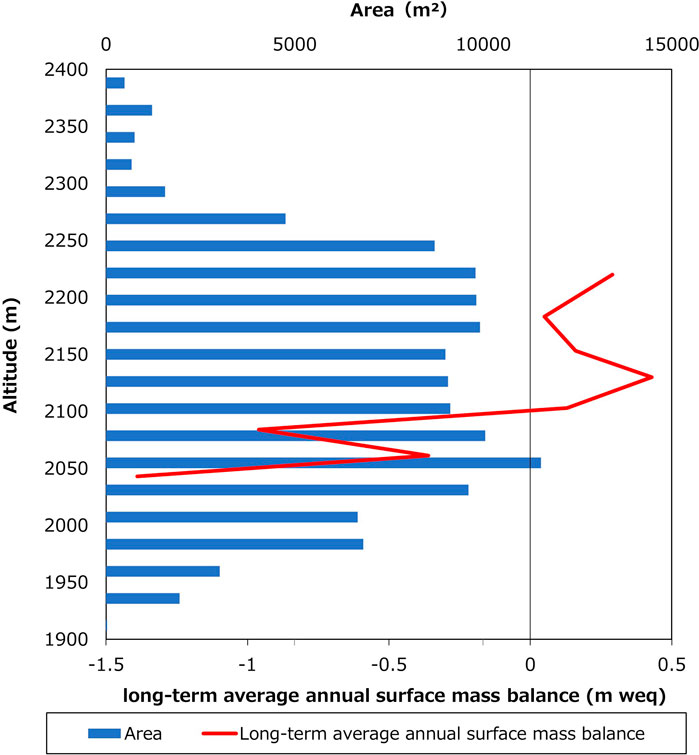
Figure 9. The altitude profile of area (left and top scales) and long-term average annual surface mass balance (left and bottom scales) of the Shakushizawa VSG identified by this study.
5 Discussion
5.1 Reclassifying the PSP as VSG
We first consider the meaning of the two reflective layers for Shakushizawa and Kaerazuzawa PSPs. For the latter, in the area where all ice had disappeared in October 2020 (the year before the study), the reflection surface at a depth of 10 m from the snow surface merges with the reflection surface that is considered bedrock (Figure 4B). This merging where the ice had vanished suggests that the lower layer is glacial ice. In support of this interpretation, consider that ice-core drilling on the Gozenzawa Glacier and snow density measurements in crevasse cross-sections on the Kakunezato Glacier at the end of the snowmelt season showed that about 1 m from the snow surface is a snow-firn layer with a density of 570–740 kg m–3 and below that is a lower layer of glacial ice with a density of 824–907 kg m–3 (Fukui et al., 2018; Fukui et al., 2021). Therefore, we argue that the clear reflective layer within 10 m of the snow surface is the snow-firn layers, and the uniform reflective layer in the lower layer is considered glacial ice. Figure 10 shows this interpretation of the GPR results for both Shakushizawa and Kaerazuzawa PSPs.
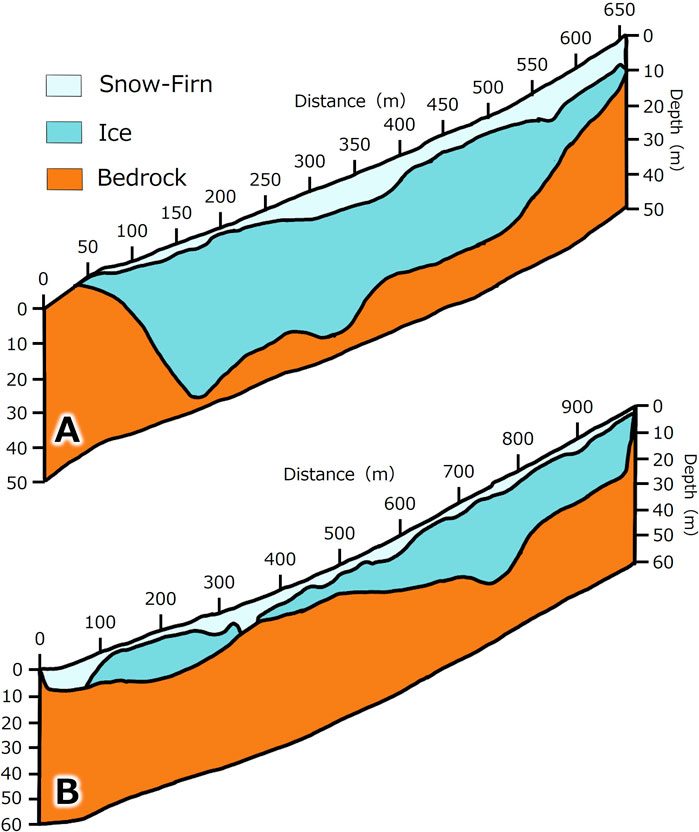
Figure 10. Proposed internal structures based on GPR measurements. (A) Shakushizawa and (B) Kaerazuzawa VSGs identified by this study.
Consider how Shakushizawa and Kaerazuzawa PSPs compare to the seven established glaciers in the northern Japanese Alps. Shakushizawa PSP has a maximum ice thickness (it’s not included the firn layer) of about 43 m and a horizontal movement of 26 cm in 29 days (annualized: 363 cm a−1), whereas, for Kaerazuzawa PSP, ice thickness, these values are 29 m with a horizontal movement of 14 cm in 27 days (annualized: 188 cm a−1). As both cases have values larger than other established glaciers in the region (Table 3), we can also designate Shakushizawa and Kaerazuzawa PSPs as glaciers. As their areas are less than 0.5 km2, they are VSGs.
5.2 Persistence mechanisms of VSGs and PSPs in the northern Japanese Alps
The areas of these glaciers and PSPs from 1955 to 1976 are between their areas in 2017 and 2020 (Table 2). In addition, while the annual mass balance of VSGs in Japan mainly depends on the accumulation depth (Arie et al., 2022), the meteorological observations in the alpine zone of central Japan found no long-term trend in snow depth (Yamaguchi et al., 2011; Suzuki and Sasaki, 2019) and air temperature (Suzuki, 2018) in the alpine zone, yet large yearly fluctuations. It was therefore estimated that the glaciers in the northern Japanese Alps have been in a steady-state from the period of 1955–1976 to the present day, with interannual fluctuations such as repeated expansion and shrinking. Then, for Shakushizawa VSG, we assume that the surface mass balance is in a steady-state and represents the long-term average annual surface mass balance from 1976 to the present day.
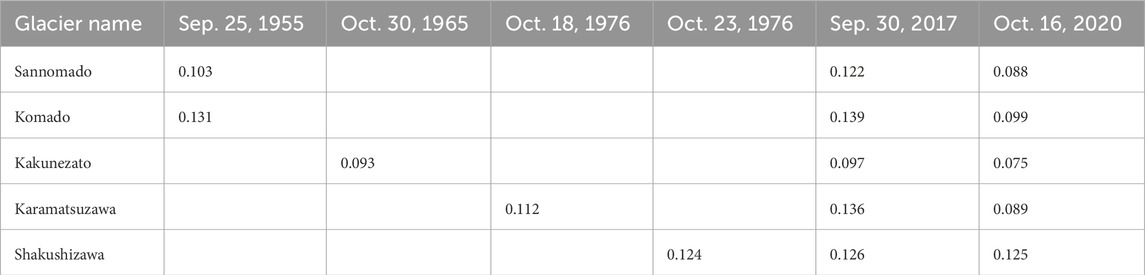
Table 2. Areas (km2) of Shakushizawa and Kaerazuzawa PSPs, and three other VSGs at the end of snowmelt season for three measurement periods.
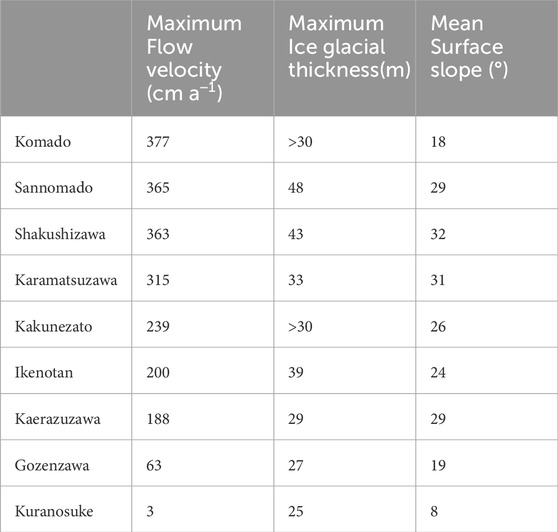
Table 3. Properties of the VSGs in the northern Japanese Alps. Maximum flow velocity (cm a−1) is annualized from measured data for about one month.
The long-term average annual surface mass balance altitude profile of the Shakushizawa VSG that is identified by this study has a positive gradient, confirming that it has an accumulation area upstream and an ablation area downstream (Figure 9). Based on the balance velocity theory, glaciers move accumulated ice in the accumulation area to the ablation area by glacial flow to maintain a steady-state (Benn and Evans, 2014). Although VSGs in the northern Japanese Alps have interannual variation in which the entire area is either in an accumulation or ablation area (Higuchi et al., 1979; Fukui et al., 2018, Fukui et al., 2021; Arie et al., 2022), assuming the VSGs to have the same mass-balance characteristics as that of Shakushizawa VSG, then their long-term average characteristics should also include an upstream accumulation area.
Next, we consider the ELA of VSGs in the northern Japanese Alps. The VSGs in the northern Japanese Alps exist at lower altitudes than the regional climatic glacier ELA because they are topographically controlled VSGs (Kuhn, 1995). VSGs in the northern Japanese Alps accumulate snow to depths of 13–30 m, which is 2–4 times greater than the snow depth of 6.8 m on the flat Murododaira area that is not affected by the topographical influence of avalanches and snowdrifts. As a result, these VSGs are considered to be topographically controlled (Arie et al., 2022). As a result, the ELA should be sensitive to the local terrain, appearing at locations with heavy avalanche activity and wind-blown snowdrifts. Therefore, the ELA in the long-term average of VSGs in the northern Japanese Alps may be different for each of the VSGs.
Then to put the surface mass balance for Shakushizawa VSG into perspective, we compare it to that of other glaciers. Figure 11 shows the altitude profiles of the annual surface mass balance of some WGMS glaciers and ShakushizawaVSG. We classified glaciers in Norway and New Zealand as being in a maritime climate and those in China and Kyrgyzstan as being in a continental climate. Comparing glaciers in maritime and continental climates, one sees that the absolute value of the annual surface mass balance in the accumulation area is larger for glaciers in maritime climates (Figure 11). In the case that the mountain ridge is sufficiently higher than the climatic ELA, accumulations greatly exceed ablations at an upstream accumulation area, because of high precipitations in a maritime climate. However, the absolute value of the annual surface mass balance (long-term average) of the Japanese VSG, which has the largest winter balance of WGMS glaciers worldwide (Arie et al., 2022), is small that it is comparable to that of continental climate glaciers. VSGs in the northern Japanese Alps have been observed to accumulate more than 20 m of snow during winter due to heavy snowfall and the topographic effect of avalanches (Arie et al., 2022). However, these VSGs are located below the climatic ELA in a warm environment at low altitudes in a mid-latitude region. As a result, they experience significant summer ablation exceeding 20 m, leading to small mass changes. Consequently, despite being in an area with maritime-like snowfall, the absolute value of the annual surface mass balance of these glaciers is small, comparable to that of glaciers in continental climates. Concerning the flow speeds, the balance velocity theory predicts that glaciers in maritime climates with large accumulation and ablation rates should have higher flow speeds than those in continental climates (Burgess et al., 2013). However, the VSGs in the northern Japanese Alps have flow speeds of only 1–4 m a−1. This shows the amount of mass exchange is small.
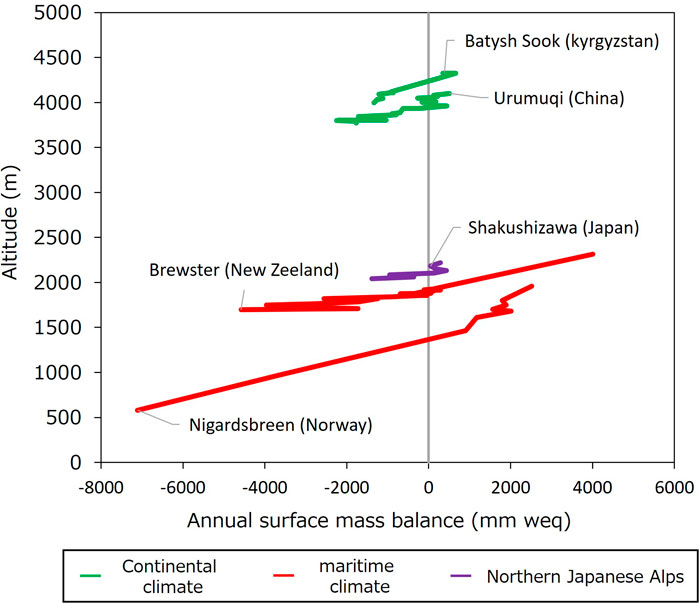
Figure 11. Altitude profile of annual surface balance profiles of selected comparison glaciers recorded in WGMS and the Shakushizawa VSG identified by this study. For the WGMS glaciers, we use mass balance data from 2014 for Urumuqi Glacier, 2016 for Batysh Sook Glacier, and 2007 for Brewster and Nigardsbreen Glaciers (WGMS, 2012).
From the above, it is suggested that VSGs in the northern Japanese Alps are maintained as glaciers with a small mass exchange due to VSGs having a localized accumulation area of slightly positive annual surface mass balance in the long-term average (Figure 12). In other words, it is indicated that they are maintained due to topographic effects, despite being located below the climatic ELA. This supports the prediction that while most VSGs in the Swiss Alps will disappear in the near future as temperatures rise, some topographically controlled VSGs will survive (Huss and Fischer, 2016). In contrast to the VSGs, several studies have argued that the PSPs in the northern Japanese Alps have negative factors on the mass balance compared to VSGs, such as a smaller amount of accumulation due to valley depth (Glazirin et al., 2004) and tunnel formation at the bottom of the PSPs due to a large amount of water entering from the large catchment area above the PSPs (Iida, 2020). PSPs in the northern Japanese Alps do not have a localized accumulation area in the long-term average and are distinguished from VSGs (Note: Shakushizawa and Kaerazuzawa are exceptions, as they have been confirmed as VSGs (Figure 12).
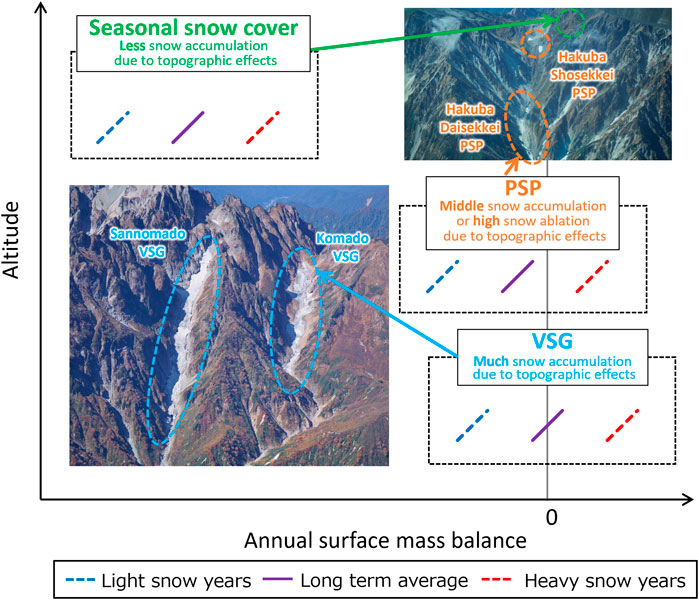
Figure 12. Schematic of annual surface mass balances of typical VSGs, PSPs, and seasonal snow cover (which completely vanish every year) in the northern Japanese Alps. Each type is shown for three cases: heavy snow years, light snow years, and long-term average. Aerial photos were taken on 16 October 2020.
6 Conclusion
We measured the ice thickness and flow of the Shakushizawa and Kaerazuzawa PSPs in the northern Japanese Alps. We found that Shakushizawa PSP has a maximum ice glacial thickness of about 43 m and a horizontal movement of 26 cm over 29 days (annualized: 363 cm a−1), whereas the same quantities for Kaerazuzawa PSP are 29 m and 14 cm over 27 days (annualized: 188 cm a−1). These measurements indicate that the Shakushizawa and Kaerazuzawa PSPs are glaciers, specifically VSGs.
For the Shakushizawa VSG that is identified by this study, we used the assumption of steady-state, along with our ice thickness and flow measurements, to calculate the altitude profile of the long-term average annual surface mass balance. The resulting long-term average annual surface mass balance altitude profile of the Shakushizawa VSG was found to have a positive gradient, confirming an accumulation area upstream and an ablation area downstream. As properties of Shakushizawa VSG are similar to the other VSGs in the region, we speculate that VSGs in the northern Japanese Alps have interannual variation in which the entire area may either be in an accumulation or ablation area. Yet, on a long-term average, they have the localized accumulation area below the climatic ELA due to topographic effects, and thus are maintained as glaciers. In addition, VSGs in the northern Japanese Alps have low absolute values of long-term average annual surface mass balance in the accumulation area despite their large winter accumulation. We argued that the absolute value of the long-term average surface mass balance in the local accumulation area is small, due to the large winter and summer balances offset each other throughout VSGs, leading to only minimal changes in mass. In this way, the VSGs in the northern Japanese Alps are maintained as glaciers with small mass exchange. On the other hand, compared to the VSGs, the PSPs in the region have factors that reduce the mass balance, such as a topographical limitation to accumulation and tunnel formation at their base. Therefore, it is implied that PSPs in this region have no accumulation area in the long-term average surface mass balance and are distinguished from VSGs.
Data availability statement
The raw data supporting the conclusions of this article will be made available by the authors, without undue reservation.
Author contributions
KA: Conceptualization, Data curation, Formal Analysis, Funding acquisition, Investigation, Resources, Supervision, Validation, Visualization, Writing–original draft, Writing–review and editing. CN: Conceptualization, Funding acquisition, Investigation, Project administration, Writing–review and editing. KF: Methodology, Writing–review and editing. HI: Methodology, Writing–review and editing.
Funding
The author(s) declare that financial support was received for the research, authorship, and/or publication of this article. This research was supported by the Toyama Prefecture Energetic Snow Country Creation Project in 2015 and 2016; the glacier project of Hakuba Village, Nagano Prefecture, in 2018, 2020, 2021, 2022; the Mountain Research Project on Asian High Mountains of the Niigata University Asian Link Research Center in 2019; the research grant from the Japan Landslide Society in 2019; Grand-in-Aid for JSPS Fellow 21J15412 and, Grant-in-Aid for Challenging Exploratory Research 22K18500.
Acknowledgments
We would like to express thanks to the Hakuba Village Government; mountain guides–Yukiyasu Matsuzawa, Hidekazu Yokoyama, Satoshi Arakawa, Satoshi Matsumoto, Shigeta Hisada, Tetsuo Kimura, Norio Takahashi, Motoo Nishimura, Nakajima Wataru, Shota Kiyohara, Yoji Irikura, Taichi Nishida, Shinya Hirata, and Yusuke Ito; Hakuba Alpen Library; Nagano Prefectural Government; captains of Cessna aircraft–Takao Kinoshita (New Central Air Service Co.), Kenichiro Tomooka (IBEX Aviation Co.), and Hisatoshi Miyata (Tokyo Koku Co.); the researchers of the National Research Institute for Earth Science and Disaster Resilience–Satoru Yamaguchi, Sojiro Sunako; Niigata University–Hirotaka Sugiyama, Shun Okuyama, Ryouji Yoshimura, Natsumi Honma, Ayano Aoki, Komei Takeda, Eri Takigasaki, Tateru Saito. We appreciate the Matsumoto Sabo Office, Tateyama Mountain Area Sabo Office, and Kurobe River Office of the Ministry of Land, Infrastructure, Transport and Tourism Hokuriku Regional Development Bureau for providing high-resolution aerial laser data. We also appreciate the Research Center for Mountain Environment, Shinshu University, and Keisuke Suzuki, Akihiko Sasaki, and Motoshi Nishimura for providing wind and temperature data near Mt. Hakuba.
Conflict of interest
The authors declare that the research was conducted in the absence of any commercial or financial relationships that could be construed as a potential conflict of interest.
Publisher’s note
All claims expressed in this article are solely those of the authors and do not necessarily represent those of their affiliated organizations, or those of the publisher, the editors and the reviewers. Any product that may be evaluated in this article, or claim that may be made by its manufacturer, is not guaranteed or endorsed by the publisher.
Supplementary material
The Supplementary Material for this article can be found online at: https://www.frontiersin.org/articles/10.3389/feart.2025.1442884/full#supplementary-material
References
Arie, K., Narama, C., Fukui, K., Iida, H., and Takahashi, K. (2019). Ice thickness and flow of the Karamatsuzawa perennial snow patch in the northern Japanese Alps. J. Jpn. Soc. Snow Ice 81, 283–295. doi:10.5331/seppyo.81.6_283
Arie, K., Narama, C., Yamamoto, R., Fukui, K., and Iida, H. (2022). Characteristics of mountain glaciers in the northern Japanese Alps. Cryosphere 16, 1091–1106. doi:10.5194/tc-16-1091-2022
Bahr, D. B., and Radić, V. (2012). Significant contribution to total mass from very small glaciers. cryosphere 6, 763–770. doi:10.5194/tc-6-763-2012
Burgess, E. W., Forster, R. R., and Larsen, C. F. (2013). Flow velocities of Alaskan glaciers. Nat. Commun. 4, 2146–2148. doi:10.1038/ncomms3146
Carrivick, J. L., Berry, K., Geilhausen, M., James, W. H., Williams, C., Brown, L. E., et al. (2015). Decadal-scale changes of the ödenwinkelkees, central Austria, suggest increasing control of topography and evolution towards steady state. Geogr. Ann. Ser. A. Phys. Geogr. 97, 543–562. doi:10.1111/geoa.12100
Carturan, L., Baldassi, G. A., Bondesan, A., Calligaro, S., Carton, A., Cazorzi, F., et al. (2013). Current behaviour and dynamics of the lowermost Italian glacier (montasio occidentale, julian alps). Geogr. Ann. Ser. A. Phys. Geogr. 95, 79–96. doi:10.1111/geoa.12002
Consortium(2023). Randolph Glacier inventory - a dataset of global glacier outlines. Boulder, Colorado USA: National Snow and Ice Data Center. doi:10.5067/f6jmovy5navz
Cogley, J. G., Hock, R., Rasmussen, L. A., Arendt, A. A., Bauder, A., Braithwaite, R. J., et al. (2011). Glossary of glacier mass balance and related terms. IHP-VII Tech. Documents Hydrology 86, 114. doi:10.5167/uzh-53475
Cuffey, K., and Paterson, W. S. B. (2010). The physics of glaciers. 4th edition. Amsterdam: Elsevier.
DeBeer, C. M., and Sharp, M. J. (2009). Topographic influences on recent changes of very small glaciers in the Monashee Mountains, British Columbia, Canada. J. Glaciol. 55, 691–700. doi:10.3189/002214309789470851
Federici, P. R., and Pappalardo, M. (2010). Glacier retreat in the maritime alps area. Geogr. Ann. Ser. A. Phys. Geogr. 92, 361–373. doi:10.1111/j.1468-0459.2010.00401.x
Fukui, K., and Iida, H. (2012). Identifying active glaciers in Mt. Tateyama and Mt. Tsurugi in the northern Japanese Alps, central Japan. J. Jpn. Soc. Snow Ice 74, 213–222. doi:10.5331/seppyo.74.3_213
Fukui, K., Iida, H., and Kosaka, T. (2018). Newly identifying active glaciers in the northern Japanese alps and their characteristics. Geogr. Rev. Jpn. Ser. A 91, 43–61. doi:10.4157/grj.91.43
Fukui, K., Iida, H., and Kosaka, T. (2021). Newly identifying active glaciers in the northern Japanese alps and their characteristics (English translation). Geogr. Rev. Jpn. Ser. B 94, 81–95. doi:10.4157/geogrevjapanb.94.81
Glazirin, G. E., Kodama, Y., and Ohata, T. (2004). Stability of drifting snow-type perennial snow patches. Bull. Glaciol. Res. 21, 1–8.
Grudd, H. (1990). Small glaciers as sensitive indicators of climatic fluctuations. Geogr. Ann. Ser. A. Phys. Geogr. 72, 119–123. doi:10.2307/521243
Higuchi, K., and Iozawa, T. (1971). Atlas of perennial snow patches in central Japan. Water Research Laboratory, Faculty of Science. Nagoya: Nagoya University.
Higuchi, K., Ohata, T., and Watanabe, O. (1979). Change in the size of the “Hamaguri-yuki” perennial snow patch on Mount Tsurugi, central Japan. J. Jpn. Soc. Snow Ice 41, 77–84. doi:10.5331/seppyo.41.77
Hoshiai, M., and Kobayashi, K. (1957). A theoretical discussion on the so-called “snow line”, with refer-ence to the temperature reduction during the Last Glacial Age in Japan. Jpn. J. Geol. Geogr. 28, 61–75.
Huss, M., and Fischer, M. (2016). Sensitivity of very small glaciers in the Swiss alps to future climate change. Front. Earth Sci. 4. doi:10.3389/feart.2016.00034
Huss, M., and Hock, R. (2015). A new model for global glacier change and sea-level rise. Front. Earth Sci. Chin. 3. doi:10.3389/feart.2015.00054
Iida, H., Fukui, K., and Osada, K. (2018). Long-term snow pit survey in murodo-daira, the Tateyama mountains (II). JSSI and JSSE Jt. Conf. 2018, 253. doi:10.14851/jcsir.2018.0_253
Kääb, A., and Vollmer, M. (2000). Surface geometry, thickness changes and flow fields on creeping mountain permafrost: Automatic extraction by digital image analysis. Permafrost Periglacial Processes 11, 315–326. doi:10.1002/1099-1530(200012)11:4<315::aid-ppp365>3.0.co;2-j
Kawashima, K., Yamada, T., and Wakahama, G. (1993). Investigations of internal structure and transformational processes from firn to ice in a perennial snow patch. Ann. Glaciol. 18, 117–122. doi:10.3189/s0260305500011368
Keany, J. M., Burns, P., Abraham, A. J., Jantz, P., Makaga, L., Saatchi, S., et al. (2024). Using multiscale lidar to determine variation in canopy structure from African forest elephant trails. Remote Sens. Ecol. Conserv. 10, 655–667. doi:10.1002/rse2.395
López-Moreno, J. I., Nogués-Bravo, D., Chueca-Cía, J., and Julián-Andrés, A. (2006). Glacier development and topographic context. Earth Surf. Process. Landforms 31, 1585–1594. doi:10.1002/esp.1356
Nesje, A., Bakke, J., Dahl, S. O., Lie, Ø., and Matthews, J. A. (2008). Norwegian mountain glaciers in the past, present and future. Glob. Planet. Change 60, 10–27. doi:10.1016/j.gloplacha.2006.08.004
Nuimura, T., Fujita, K., Fukui, K., Asahi, K., Aryal, R., and Ageta, Y. (2011). Temporal changes in elevation of the debris-covered ablation area of Khumbu Glacier in the Nepal himalaya since 1978. Arct. Antarct. Alp. Res. 43, 246–255. doi:10.1657/1938-4246-43.2.246
Oerlemans, J. (1994). Quantifying global warming from the retreat of glaciers. Science 264, 243–245. doi:10.1126/science.264.5156.243
Rounce, D. R., Hock, R., Maussion, F., Hugonnet, R., Kochtitzky, W., Huss, M., et al. (2023). Global glacier change in the 21st century: every increase in temperature matters. Science 379, 78–83. doi:10.1126/science.abo1324
Sawagaki, T., Satoru, Y., and Abe, Y. (2014). Development of a numerical model to determine glacial equilibrium line altitude in combination of geomorphological interpretation and glacier dynamics. J. Jpn. Soc. Snow Ice 76, 1–19.
Suzuki, K. (2018). Variations in climatic and hydrologic trends in the Kamikochi region of the Japanese Alps. J. Jpn. Soc. Snow Ice 80, 103–113. doi:10.5331/seppyo.80.2_103
Suzuki, K., and Sasaki, A. (2019). Meteorological observations in the Japanese Alps region. J. Geogr. (Chigaku Zasshi) 128, 19. doi:10.5026/jgeography.128.9
WGMS (2012). Fluctuations of glaciers, 2005-2010. Editors M. Zemp, H. Frey, I. Gärtner-Roer, S. U. Nussbaumer, M. Hoelzle, F. Paulet al. (Zurich: IWorld Glacier Monitoring Service CSU(WDS)/IUGG(IACS)/UNEP/UNESCO/WMO).
Keywords: glacier flow, glacier ice thickness, mass balance, very small glaciers, perennial snow patches, northern Japanese Alps
Citation: Arie K, Narama C, Fukui K and Iida H (2025) Identification and persistence mechanism of very small glaciers and perennial snow patches in the northern Japanese Alps. Front. Earth Sci. 13:1442884. doi: 10.3389/feart.2025.1442884
Received: 03 June 2024; Accepted: 06 January 2025;
Published: 11 February 2025.
Edited by:
Zheng Han, Central South University, ChinaReviewed by:
Alexandru Onaca, West University of Timișoara, RomaniaMatthias Huss, ETH Zürich, Switzerland
Copyright © 2025 Arie, Narama, Fukui and Iida. This is an open-access article distributed under the terms of the Creative Commons Attribution License (CC BY). The use, distribution or reproduction in other forums is permitted, provided the original author(s) and the copyright owner(s) are credited and that the original publication in this journal is cited, in accordance with accepted academic practice. No use, distribution or reproduction is permitted which does not comply with these terms.
*Correspondence: Kenshiro Arie, YXJpZS5rZW5zaGlyb0BqYXhhLmpw; Chiyuki Narama, bmFyYW1hQGVudi5zYy5uaWlnYXRhLXUuYWMuanA=