 Lijie Cui
 Pan Zhang
- College of Petroleum, China University of Petroleum-Beijing at Karamay, Karamay, China
The width-displacement (W-D) relationship of fault zones is significant for deepening the understanding of subsurface faulting mechanisms, yet quantitative research using seismic reflection data, especially for boundary identification, remains challenging. This study focuses on the quantitative characterization of the W-D relationship in fault zones using 3D seismic data from the C36 Prospect in the Junggar Basin, China. The hybrid attributes derived from several conditioning approaches, multiple-attribute calculation, and a supervised artificial neural network (ANN) have effectively enhanced images of the fault zones. Quantitative analysis using the computed hybrid attributes reveals that the center and the bend positions of the single fault zone respectively control the largest width and displacement values. Different fault sets containing different fault linkage types with different geometry, standing for different evolution stages, provide various contributions to the W-D relationship, leading to the different scatter data distribution. This research clarifies the relationship between the evolution of fault zones and the scatter data, offering new insights into the mechanisms controlling hydrocarbon accumulation and providing valuable guidance for future exploration.
Highlights
• Improved images of subsurface fault zones using seismic data conditioning, attribute calculation, and artificial neural computation are presented.
• The width and displacement values of subsurface fault zones are measured and analyzed mainly according to the computed hybrid attribute.
• The fault zone sets, including different linkage types, stand for different stages of fault zone growth periodically, and exert divergent controls on hydrocarbon accumulation.
1 Introduction
In recent years, many publications have stated that fault zones play a crucial role in subsurface fluid flow, such as geothermal, groundwater and hydrocarbon, and CO2 (Billi et al., 2003; Schueller et al., 2013; Dimmen et al., 2017; Peacock et al., 2017; Torabi et al., 2019; Wu et al., 2019). The displacement and width (W-D) scaling relation of fault zones is an essential parameter for predicting subsurface faulting mechanisms (Ma et al., 2019). However, The scaling relationship is very complicated and easily influenced by the accuracy of the methods (Ma et al., 2019) utilized to investigate faults, the heterogeneities (Scholz et al., 1993; Childs et al., 1996; Alaei and Torabi, 2017; Celestino et al., 2020) within the fault rocks in 3D, and other vital parameters such as the nature of the protolith, depth of faulting, tectonic environment (e.g., normal, strike-slip or reverse faulting), layer thickness, various stress fields, diagenesis and their interactions (Evans, 1990; Faulkner et al., 2011; Torabi and Berg, 2011). Although segment linkage plays a crucial role in fault evolution (Dawers, 1995; Imber et al., 2004; de Joussineau and Aydin, 2007; Torabi and Berg, 2011; Choi et al., 2016; Mayolle et al., 2019; Wu et al., 2020), different fault sets, including different fault linkage types, play an essential factor for the scaling relationship that is seldom discussed.
The methods of previous studies focused on the outcrop observed (Mitchell and Faulkner, 2009; Putz-Perrier and Sanderson, 2010; Savage and Brodsky, 2011), logging identification (Liu et al., 2017), the core observation (Zeng et al., 2012; Guerriero et al., 2013; Liu et al., 2017), numerical simulation (González et al., 2008; Guerriero et al., 2013), physical simulation (Liao et al., 2017), and other additional means, such as using scanline fracture analysis data techniques and topographic and aeromagnetometric data (Celestino et al., 2020). However, the research on fault zones using 3D seismic data is challenging (Iacopini et al., 2016; Alaei and Torabi, 2017; Liao et al., 2019; Liao et al., 2020; Ma et al., 2019; Wu et al., 2019) while the method using multiple-attribute analysis techniques effectively identify and analyze fault zones is also relatively lacked. Although more and more seismic attributes (Bahorich and Farmer, 1995; Chopra and Marfurt, 2007a; Chopra, 2009; Hale, 2013; Wu and Hale, 2016; Wu, 2017) sensitive to the fault zone response are adopted to image fault zones, fault zone features are almost not accurately characterized using the single seismic attribute derived from seismic data. Seismic attributes (Iacopini et al., 2016; Alaei and Torabi, 2017; Liao et al., 2019; Liao et al., 2020; Ma et al., 2019; Wu et al., 2019; Zhao et al., 2021) recently have been adopted to study the fault zone. However, seismic recognition of the boundary of the fault zone (Alaei and Torabi, 2017; Liao et al., 2019; Ma et al., 2019) is still relatively subjective to the interpreters, leading to a scatter in the reported data attributed to the ambiguity in the definition of fault zones and bringing out additional difficulties in studying the scaling of fault zones objectively. Therefore, the enhancing interpretation of fault zones using advanced workflows will likely help researchers quantitatively study the fault zone via 3D seismic data.
Research progress has been made in post-stack seismic processing technology, especially post-stack data conditioning and seismic multi-attribute amalgamation methods. On the one hand, some conditioning methods based on the dip-steered cube can effectively improve the fault imaging of conventional geometric attributes (Santosh et al., 2013; Odoh et al., 2014). On the other hand, seismic multi-attribute amalgamation methods can further weaken the deficiencies of single-attribute characterization ability and effectively enhance its ability to characterize complex structural features. It is worth mentioning that artificial neural networks (ANNs), as a part of machine learning methods, have gradually gained wide acceptance for the application of seismic multi-attribute amalgamation over the years in the field of seismic fault image (Tingdahl and de Rooij, 2005; Basir et al., 2013; Mirkamali et al., 2013; Zheng et al., 2014; Kumar and Mandal, 2017; Srivastava et al., 2017; Kumar and Sain, 2018; Mandal and Srivastava, 2018; Kumar et al., 2019). It provides enhanced images of fault zones, reducing the interpretation ambiguity to some extent and new clues for our application of seismic multi-attribute amalgamation. Now, the C36 survey within the Baijiahai subuplift from the Central Depression of Junggar Basin is composed of four-fault sets with four different linkage types in the base surface of the toutunhe member of Jurassic formation (J2t) in the map view, and the 3D seismic data are available for trying. Therefore, we believe that delineating fault zone features and analyzing the W-D relationship based on the hybrid attribute from 3D seismic data likely provide new possibilities to investigate fault zones and compare the findings derived from other data sources (like outcrops). Moreover, further geometric classification of the fault zone may reduce data scattering about the relationship between fault zone W-D (Choi et al., 2016) or gain new insights.
This research focused on (1) enhancing the fault zone features from the 3D seismic data by combining the seismic conditioning process, seismic multi-attribute calculation, and an ANN; (2) analyzing the width and displacement distribution features of fault zones via the calculated hybrid seismic attributes; and (3) discussing the relationship between W-D scaling of fault zones and fault linkage types (or different evolution stages).
2 Geology settings
The Junggar Basin is located in the northwestern Xinjiang Uygur Autonomous Region, China. It is a major Paleozoic to Cenozoic sedimentary basin, covering approximately 1.3 × 10⁵ km2. This basin presents a triangular shape in the map view lying at the intersection of the Kazakhstan, Siberia, and Tarim cratons (Chen et al., 2005; Cao et al., 2006). It is a typical “walled” sedimentary basin (Gao et al., 2020), bounded by mountains from the northeastern, western, and southern sides (Bian et al., 2010; He et al., 2018). To the northwest are the Zhayier, Halaalate, and Delun mountains; to the northeast side lie the Kelameili and Qinggelidi mountains; and to the south are the Yilinheibiergen and Bogeda mountains. Several authors have documented the structural arrangement (Figure 1) of the Junggar Basin (Liu et al., 2006; Qiu et al., 2008; Hao et al., 2011; Cao et al., 2012; Xiang et al., 2014; Yang et al., 2015; Han et al., 2019; Tao et al., 2019). According to the Permian tectonic framework, the Junggar Basin comprises six principal structural units: the Wulungu depression, the Luliang uplift, the Western uplift, the Central depression, the North Tian Shan Fold-Thrust Belt, and the Eastern uplift (Wang et al., 2018). Furthermore, each tectonic unit contains several elements, such as structural highs, sedimentary sags, or fault-fold belts. Therefore, the whole basin consists of 44 tectonic elements (He et al., 2005; Zhang et al., 2010). The studied C36 3D Prospect (Figure 1b) lies in the center part of the Baijiahai subuplift of the Central depression.
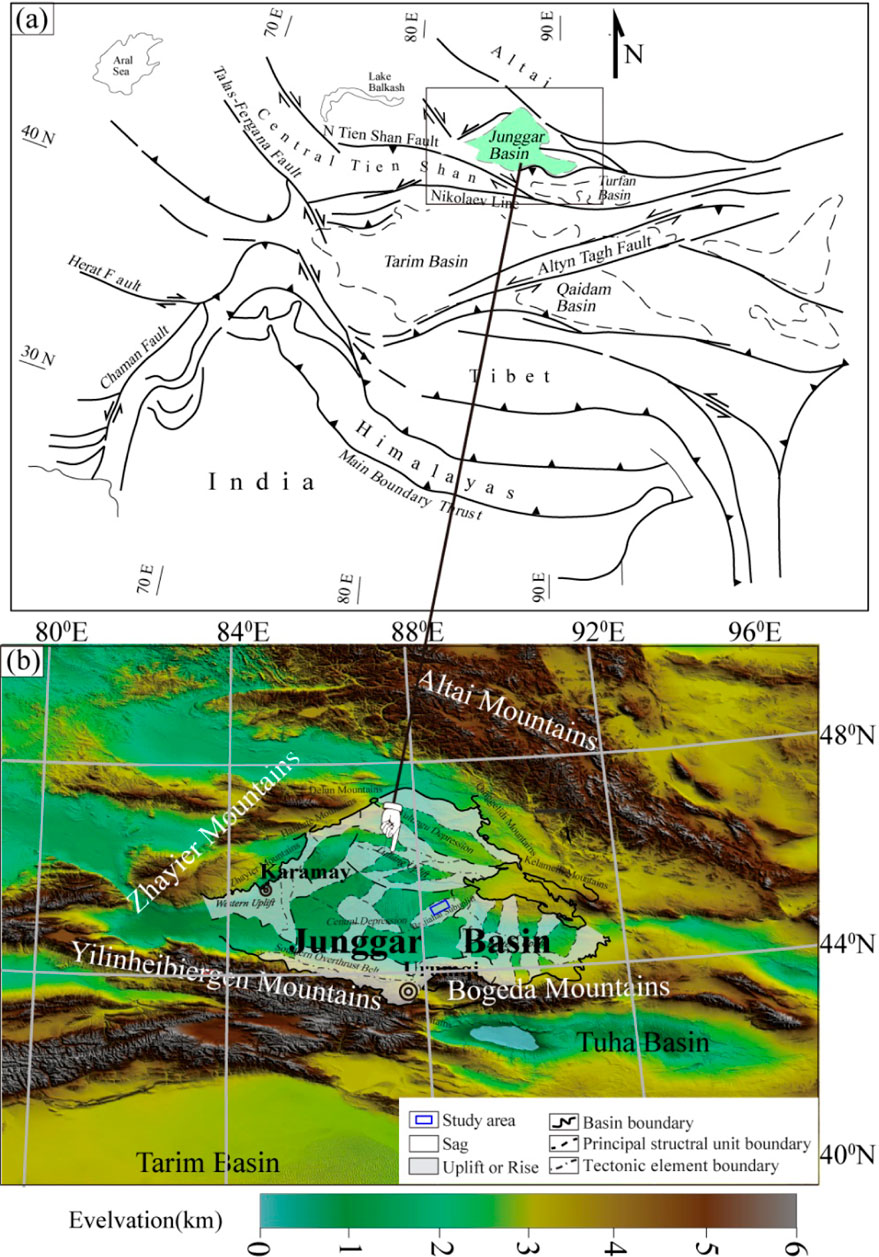
Figure 1. (a) Location of the Junggar Basin. (b) Regional geological map. It presents major structural features of the Junggar Basin [modified from Cao et al. (2017)]. The blue rectangle area indicates the location map of the C36 3D Prospect.
The Junggar basin has experienced four tectonic-sedimentary periods (Zhu et al., 2017): Hercynian, Indo-Chinese, Yanshan, and Himalayan. The strata contain the Carboniferous, Permian, Triassic, Jurassic, Cretaceous, Tertiary, and Quaternary rocks with thickness up to 14,000 m (Figure 2). The Junggar Basin has experienced a protracted structural evolution with multiple compressional and extensional phases since the Late Paleozoic period, closely related to the evolution of the Central Asian Orogenic Belt (CAOB) and the successive accretion onto the south Asian margin (Graham et al., 1993; Zhang et al., 2006; Xiao et al., 2015; Han and Zhao, 2018; He et al., 2018; Wang et al., 2018). This basin was initially formed in the Late Carboniferous period by the collision and amalgamation of the CAOB (Carroll et al., 1990; Allen and Vincent, 1997). Although the Permian formation and tectonic evolution of the Junggar Basin are highly controversial, most researchers agree that there was an orogeny in the Late Permian period (Şengör, 1990; Chen et al., 2005; Wu et al., 2005). During the Triassic-Paleogene periods, the Junggar Basin underwent overall subsidence (Şengör, 1990; Chen et al., 2002; Wu et al., 2005). However, recent studies indicate strike-slip fault activity is likely influenced by the rotation of Siberia (Yang et al., 2015) occurred in the late Jurassic-early Cretaceous period. From Neogene to Quaternary periods, the basin evolved as a near EW-striking intracontinental foreland basin (Chen et al., 2005; Wu et al., 2005; He et al., 2018) due to the collision of the Indian Plate with the Eurasian Plate (Figure 1a).
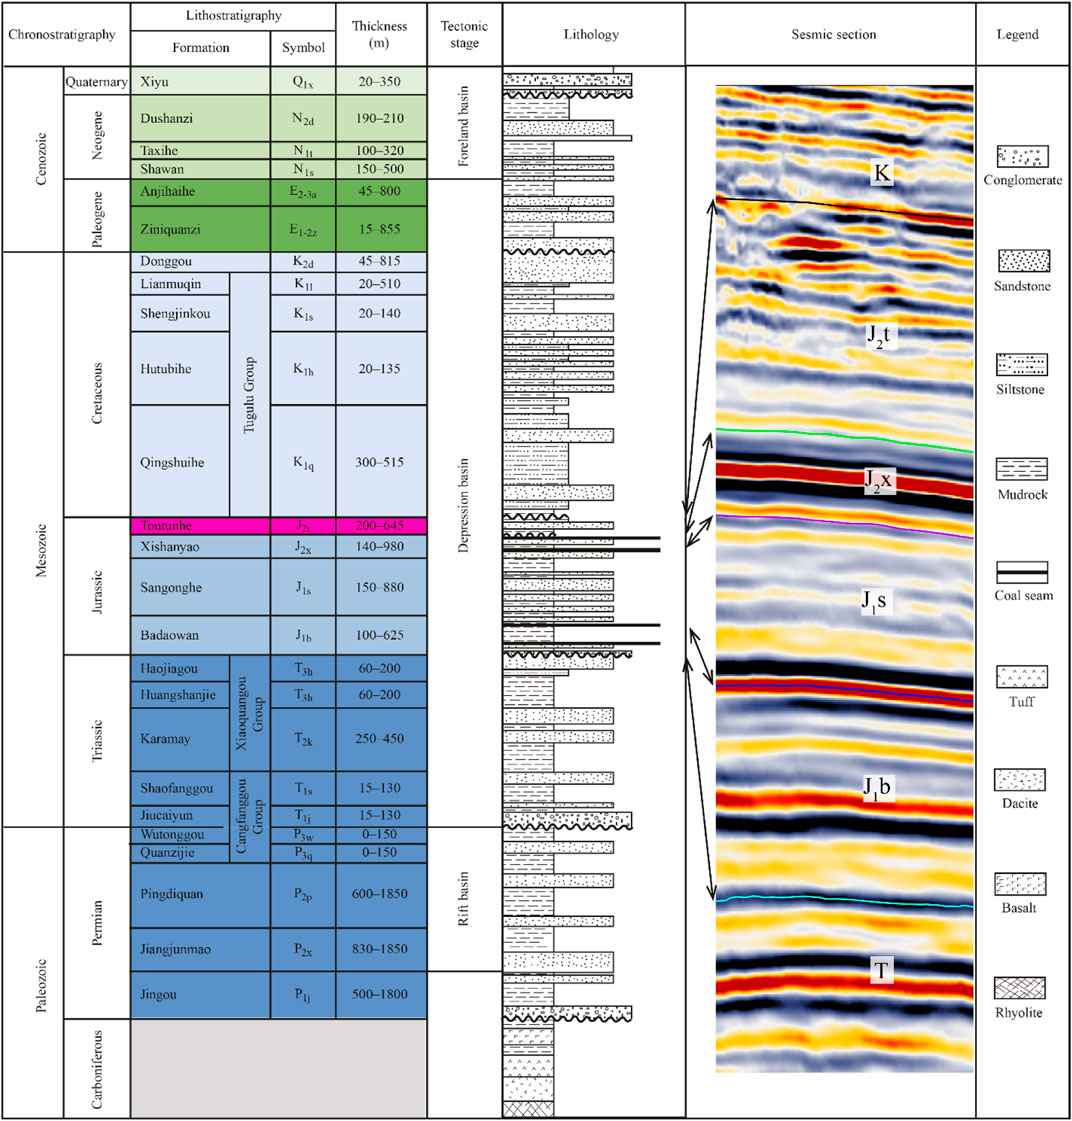
Figure 2. Central Junggar Basin generalized stratigraphic column [modified from Cao et al. (2017)]. The target strata in this research are labeled in pink. J2t stands for the toutunhe formation of the Jurassic.
3 Dataset and methodology
3.1 Dataset
The C36 3D seismic survey was of moderate quality with a 2 ms sample rate, covering about 400 km2. The seismic data were prestack processed with a common bin size of 25 × 50 m. The minimum and maximum frequencies are 8.8 and 63 Hz, respectively, at −20 dB, with a dominant frequency of 29.1 Hz within the Jurassic formation. We determined and interpreted the Toutunhe (J2t) bottom based on the most exploratory wells drilled into the Jurassic bottom in this study area.
3.2 Methodology
The methodology utilized for the present research is shown in the workflow of Figure 3a. We have presented an integrated approach to achieve our objectives. The whole workflow contains four phases: 1) data conditioning, 2) seismic attribute calculation, 3) ANN computation, and 4) displacement and width plot. In this study, the workflow of the first three phases was performed using Opendtect software (Zheng et al., 2014; Kumar and Mandal, 2017; Srivastava et al., 2017; Kumar and Sain, 2018; Mandal and Srivastava, 2018; Kumar et al., 2019). The width and throw measurement scheme of the fault zones is illustrated in a typical seismic profile in Figure 3b, according to the previous definition and approach (Ma et al., 2019). The two-way travel time (TWT) and plane coordinate (X, Y) values of point 1 and point 2 in Figure 3b could be obtained via the ways to extract background values easily along the gridded horizon data. Thus, we could measure the very small W-D values. They are not limited by the resolution of seismic data to some extent. The fault zone throw is simply used as the displacement.
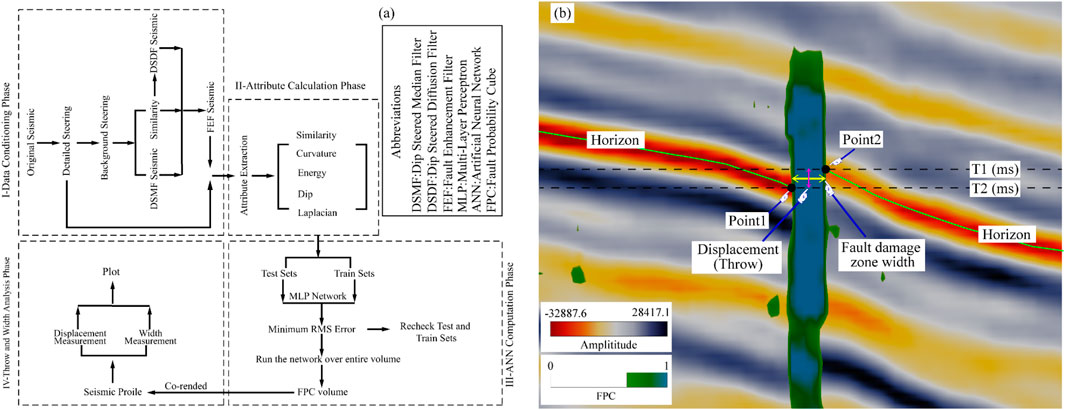
Figure 3. (a) Workflow used for the current research. It comprises four phases: data conditioning, attribute extraction, ANN computation, and W-D plot. (b) Typical definitions of the W-D values from seismic profile. The TWT and plane coordinate (X, Y) values of point 1 and point 2 could be easily obtained by extracting background values along the green horizon data.
3.2.1 Seismic data conditioning
This phase was conducted to obtain conditioned seismic data. Geological features on the seismic data are very complicated because of acoustic disturbances influencing their effective visualization and causing deterioration of data quality, making it very hard to image them (Alves et al., 2015; Marfurt and Alves, 2015). Therefore, the data quality should be optimally conditioned by removing unwanted (noisy) information.
Initially, a dip-azimuth volume (also called steering cube) was calculated from the original seismic data. The steering cube was obtained by extracting dip and azimuth values along the seismic reflectors (Tingdahl et al., 2001; Tingdahl and de Rooij, 2005). Honoring our objectives, we extracted two different steering cubes: (1) the detailed steering cube was computed adopting a mild filtering step-out (set as inline/cross-line/sample: 1/1/3), preserving detailed information of seismic reflectors; (2) the background steering cube was generated adopting coarser filtering step-out (set as inline/cross-line/sample: 5/5/5), storing their overall trend (Kumar and Mandal, 2017). The latter steering cube was utilized further as an input for the seismic data conditioning.
Conditioning of the original seismic data (Figure 4a) improved signal quality by effectively suppressing random noise. It further improved the lateral continuity of the seismic events and highlighted the sharpness of the geologic features via several structure-oriented filters (Fehmers and Höcker, 2003). They could effectively smoothen the seismic events using dip-steered median filtering (DSMF), enhance their edges of fault zones via dip-steered diffusion filtering (DSDF) (Weickert, 1999), simultaneously preserving all their structural characteristics, logically merging the DSMF and the DSDF for producing fault enhanced filtered (FEF) seismic data.
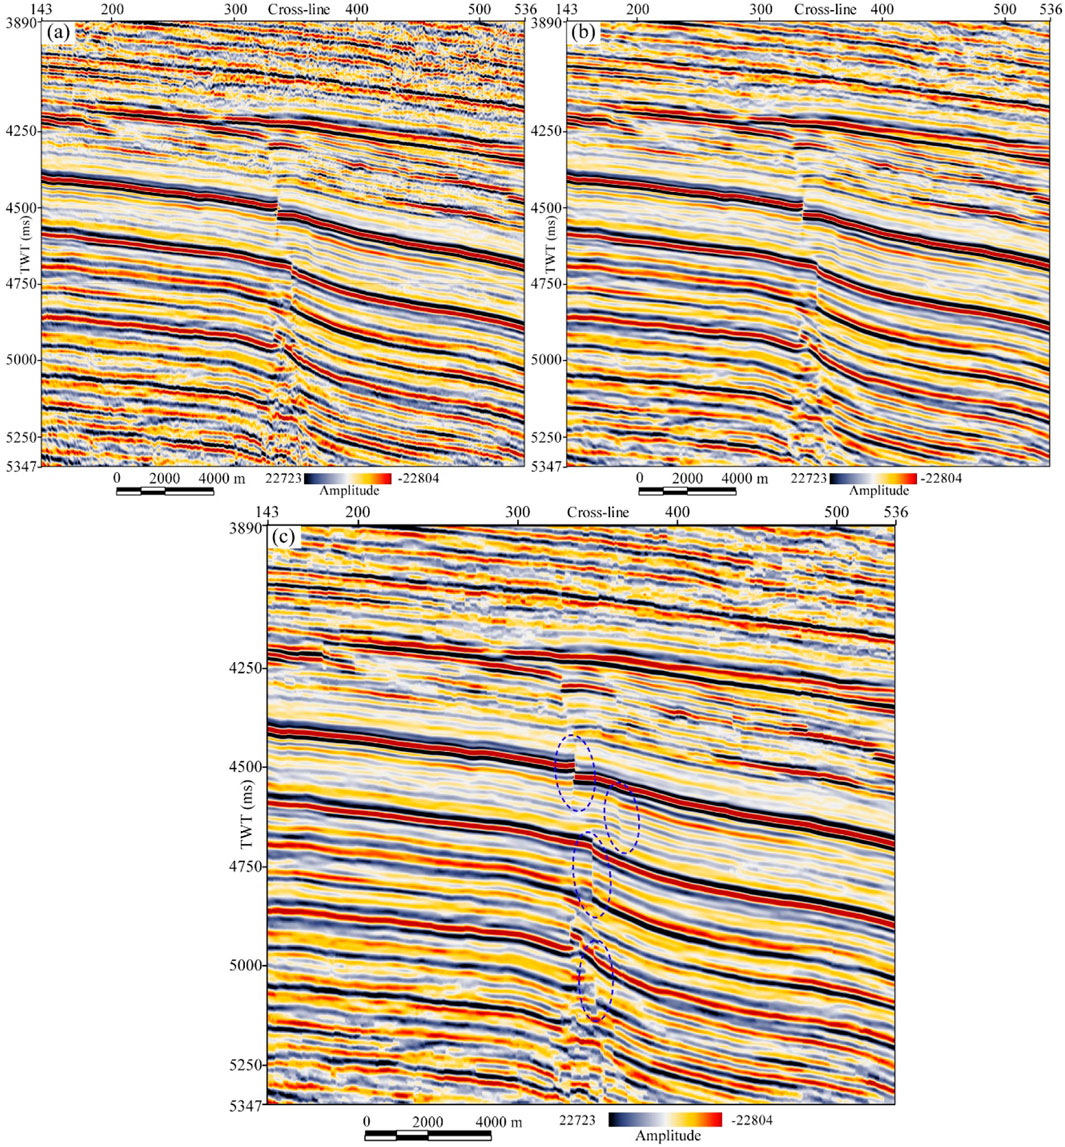
Figure 4. (a) Original seismic for inline 450. The geologic structures are heavily masked with noisy reflections. (b) DSMF seismic for the same inline. DSMF effectively improves image quality by removing random noises and enhancing the lateral continuity of seismic reflects. (c) FEF seismic for the same inline. This result exhibits that the sharpness of the fault zones in the seismic section gets improved and is illustrated using blue ovals. Moreover, reflections closer to fault zones are also enhanced.
The DSMF was firstly used over the original seismic data based on the pre-processed steering cube (Chopra and Marfurt, 2007b; Chopra and Marfurt, 2007a) to generate DSDM seismic volume (Figure 4b). The DSMF seismic volume preserves edges and improves the lateral continuity of seismic events within the seismic data. After the events were smoothed, another filter called DSDF was adopted to sharpen the edges of the seismic events. The filter produced a new seismic volume called DSDF seismic volume. Then, the DSDM and DSDF seismic volume were logically combined with a pre-calculated similarity attribute applying a cut-off value (0.7 for current research) via the FEF to obtain FEF seismic volume. This filter will take the outputs as DSMF when the similarity value is higher than the set threshold value mentioned above; otherwise, the DSDF will be used. The corresponding output, called FEF seismic volume (Figure 4c), improved the sharpness of the fault zones and reduced the random noise. During the second phase, the FEF seismic volume, integrated with the detailed steering cube, was used to extract sensitive attributes related to fault zones.
3.2.2 Seismic attribute calculation
This second phase was intended to select and calculate sensitive attribute sets regarding fault zones. Seismic attributes play a critical role in imaging complex geologic structures from 3D seismic data. We used several time windows and inline/crossline parameters for testing to extract an appropriate attribute set. The attribute calculation is time-consuming, so the result was quality-checked over a few vital seismic lines. If only the results were judged to be suitable, these attributes were further extracted over the entire seismic cube. Several seismic attributes, e.g., similarity, polar dip, curvature, laplacian, and energy attributes, are sensitive to fault zones and finally selected in this research.
3.2.3 Artificial neural computation
This third phase was aimed to implement the precomputed sensitive attribute sets amalgamation and produce hybrid attributes via the supervised ANN. This phase contains the following three procedures: (a) fault and non-fault location picking, (b) neural network design, and (c) network operation as well as validation.
Fault zone locations are generally picked as zones characterized with bed terminations and associated breaks in seismic events, commonly showing low-similarity value, abrupt dip changes, and loss in signal amplitude. However, the non-fault zone locations were picked as zones avoiding such characteristic features. As input data from fault and non-fault zones were prepared according to FEF seismic data and extracted seismic attribute data, they were used for a supervised ANN. Moreover, the input data were split into training and testing data sets. The network underwent a training schedule to obtain an optimum output to effectively discriminate fault and non-fault cases in the input sets through learning from the network. All example sets, including fault zone and no-fault zone locations, were manually picked from the conditioned seismic data to attain this objective. According to extracted seismic attributes (as mentioned in Section 3.2.2), the interpreters picked these locations based on their own experience and the other judgment.
The non-linear neural network chosen in this paper is a fully connected multilayer perceptron (MLP) network (Meldahl et al., 2002; Aminzadeh and De Groot, 2006). Three layers: (1) the input layer, (2) the hidden layer, and (3) the output layer are designed in the neural network. These layers are interconnected with each other via a form of a fully connected MLP network. The neural network training was performed via several iterations to achieve a minimum normalized root mean square (N-RMS) error between the two sets of the train and test data.
Seismic attributes serve as test data sets in this computation. Fault zone features are commonly associated with reflector terminations, abrupt changes in reflector dip and orientations, and signal amplitude loss. Therefore, selecting sensitive attributes is crucial to effectively highlight these variations and help the adopted network gain optimum output. We carefully selected such attributes (as mentioned in Section 3.2.2) to provide a maximum contribution for capturing reliable signatures of fault zones from the seismic data. These attributes were initially tested for their efficacy in imaging fault zone variations. Suitable attributes were finally grouped as input sets for the neural network computation.
Once the input (test) data sets were prepared for training via the network to produce optimum output. Thus, the training data sets were required to train the network to learn through these examples. To attain this objective, 400 example sets, including fault zone and no-fault zone locations, were carefully picked from time slice 4,500 ms. Fault zone locations are commonly associated with seismic event terminations, presenting low similarity, low most positive curvature, low energy, and variable dip. Conversely, non-fault zone locations are not such characteristic features.
During network operation, 30% of input data was assigned for testing the network, and the rest of the input data was assigned for training purposes, respectively. The training set was applied for updating the network weights, while the test set was used to evaluate the performance, preventing over-fitting problems (Atakulreka and Sutivong, 2007; Singh et al., 2016; Kumar and Mandal, 2017). Once a minimum error was achieved between the train and test data sets, the training process was stopped. The result was further adopted over the entire seismic volume to produce a fault probability cube (FPC). It includes sample values from 0 to 1, representing the lowest and highest probability of fault zones. This FPC was firstly validated by comparing it with the fault zone distribution of the studied area. Furthermore, its validation would be assessed again according to the later analysis of the width and displacement distribution features and the W-D relationship based on the computed hybrid attribute.
3.2.4 W-D measurements
This final phase was to gain the W-D values. The W-D measurement schemes were shown in the seismic section (Figure 3b), co-rendered with the hybrid attribute, perpendicular to the strike of the fault zones. Most of the fault zones in this survey are commonly steep in the seismic section and present as slightly normal throws (Figure 4c). The throw is used as a proxy for displacement in this research. We measured the W-D data set at almost all fault zones by the 90 numbered seismic sections from the TVSS structure map co-rendered with the FPC attribute indicating the fault traces. The boundary of the displayed FPC attribute, comprehensively based on the original seismic profile and similarity attribute, is considered the boundary of the fault zone, including the fault core and the damage zone (Ma et al., 2019) in seismic profile. Thus, it is easily taken as the united identification criterion in this research. Fault zone W-D measurements were taken every 350 m along every single fault trace from northeast towards southwest.
Fault traces were digitized based on the attribute volumes in the map view. We digitized 52 fault zones, and 45 fault zones were numbered from the TVSS structural map corresponding to the base surface of the toutunhe formation of the Jurassic (J2t). We plotted the digitized fault traces to investigate their linkage types along these fault zones. Based on the united FPC attribute boundary, we only manually determine the two-point locations where correspond to the intersection points from the navigation line and the boundary of the numbered fault zones. The fault zone width and the corresponding displacements of Figure 3b could be easily calculated via extracting background values (including X, Y and TWT values) of these corresponding two points at the gridded time structural map. In total, their width and the corresponding displacement of fault zones were measured at 174 points distributed, including four different sets and well representing the development trend of fault zones. The constant relationship between travel time and depth is depth (meter) = TWT (millisecond) × 0.89, converting the time domain into the depth domain of all fault geometry data. All the displacement values of the depth domain mentioned below are derived from the TWT domain by this relationship.
4 Results
These results of the current research are illustrated in two main parts. Firstly, the present study presents the efficiency of the hybrid attribute in enhancing fault zone images, aiding in identifying the boundary of the fault zones. Secondly, linkage types of fault zones and the responding measure values were derived from four fault zone sets dominantly displaced clastic rocks within the studied strata.
4.1 Enhancing interpretation of fault zones
The current approach of using non-linear multiple seismic attributes significantly improved the detailed features of the fault zones presented on the seismic data. The FEF seismic data (Figure 4c) have sharpened the structures near the fault zones by eliminating unwanted seismic noises masking critical fault signatures from the subsurface. This FEF seismic data further improve attribute extraction for a better understanding of the subsurface. Seismic attributes extracted from the FEF data generate the fault zone features, providing a better way for reliable interpretation of fault zone features. This similarity attribute calculated from the original seismic data (Figure 5a) delineates the discontinuity of fault zone locations closely related to low similarity values. However, the results of this similarity attribute extracted from FEF seismic data (Figure 5b) can be better. This attribute depicts the structural trend of the fault zones as southwest to northeast (SW-NE), consistent with the general trend of the Baijiahai subuplift. In addition, the sharpness and visibility of the fault zone features are much more apparent by this similarity attribute (Figure 5b), which takes both the steering cube and FEF seismic data as input. The non-steered similarity (mid window) attribute, which only uses the original seismic data as input, could image these fault zone features. However, enhanced interpretation of fault zones could not be realized. We observed that the fault zones were associated with higher polar dip values from the polar dip attribute than those in non-fault zones (Figure 6a). The lowest values are apparently visualized by displaying the most positive curvature attribute (Figure 6b) due to the presence of fault zones. The laplacian showed the sharpness response, with the largest and lowest values (Figure 6c) of the fault zone. The energy response (Figure 6d) near the fault zones is sudden change due to that these signatures are commonly characterized by amplitude distortions. The fault zones present vertical segmented characteristics in the seismic section (Figure 6).
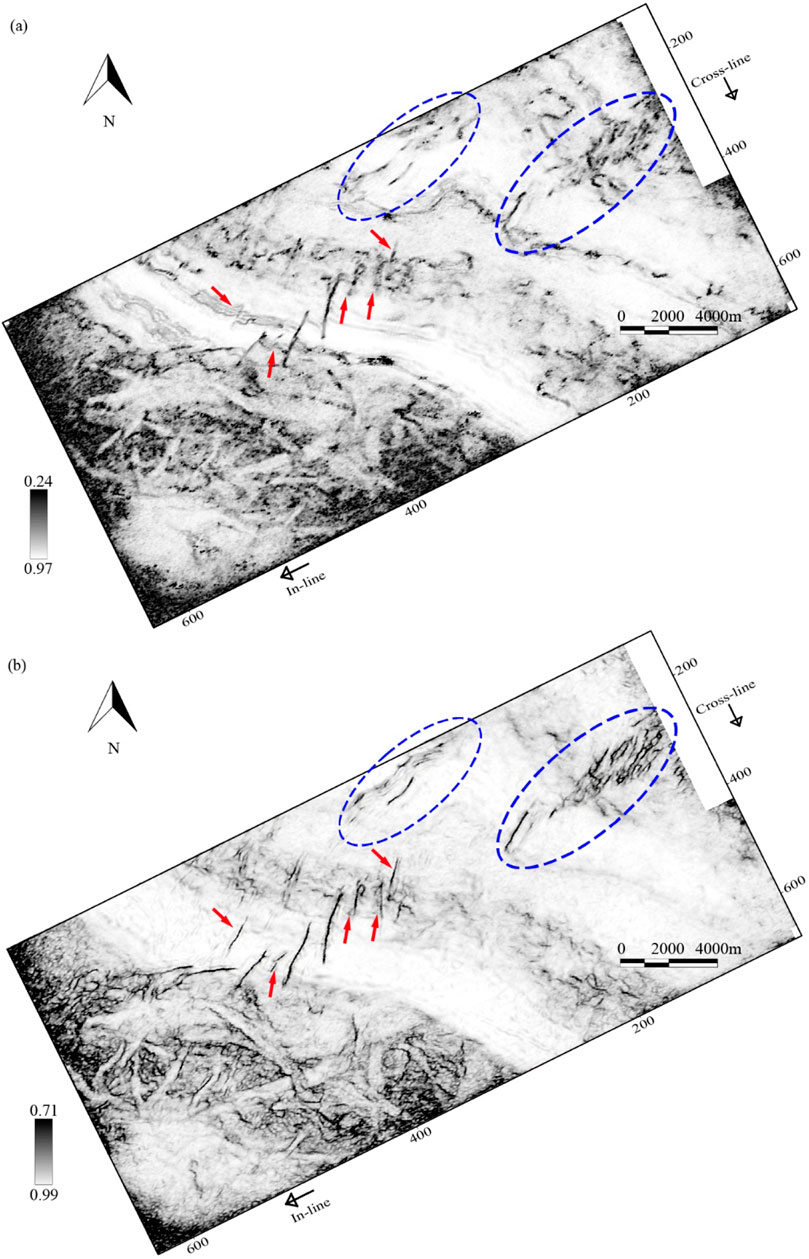
Figure 5. (a) Non-steered similarity (mid window) attribute. It is extracted from the original seismic data displayed over time slice (t = 4,500 ms) cuts the Jurassic formation. The attribute illustrates the presence of fault zones and discontinuities characterized by low similarity values. (b) Steered similarity (mid window) attribute. It is extracted from FEF seismic data displayed for the same time slice. Fault zones are more sharpened and prominent that are marked with red arrows and blue ovals.

Figure 6. (a) Polar dip attribute. This calculated attribute is presented for inline 450. High polar dip values are closely related to the fault zones marked with red ovals. (b) Most positive curvature attribute. This calculated attribute is presented for the same inline. Low positive curvature values exhibit within the fault zones marked with black ovals. (c) Laplacian attribute. This calculated attribute is presented for the same inline. The lowest and highest laplacian values simultaneously present within the fault zones marked with green ovals. (d) Energy attribute. This calculated attribute is presented for the same inline. Sudden changes in the energy occur from high to low within the fault zones marked with white ovals.
The neural computation based on these seismic attributes and the picked fault and non-fault locations (Figure 7a) produced an FPC attribute. The non-linear MLP network designed for the current work consists of 17 fully connected nodes: 10, 5, and 2 nodes responding to the input, hidden, and output layers (Figure 7b). In our study, 30% of the picked data were randomly taken as test sets, and the rest of the data were taken as train sets. The neural training was performed iteratively to update the weights for overcoming over-fitting problems. The relative contribution made by each of the input attributes is listed in Table 1. It is shown that similarity short windows, polar dip offered maximum contribution for training the network. It is also observed that the N-RMS error values for both trained and tested data produce a minimum value that varies between 0.34–0.38 (Figure 7c). The minimum misclassification value (%) for both the train and test data sets ranges from 3.27% to 3.36% (Figure 7d). This indicates that the careful selection of attributes, along with their appropriate combination, plays a crucial role in designing the FPC attribute that effectively highlights fault zones and non-fault zones. The neural training finally produced a hybrid seismic attribute used for processing over the full seismic volume to gain the FPC attribute volume, which (Figure 8a) captures and contains all possible fault zone features. The volume values range from 0 to 1, where 1 stands for higher confidence of fault zone locations. It is observed that the extracted FPC attribute is co-rendered with the FEF seismic time slice 4,500 ms (Figure 8b), capturing and containing fault zone details within the Jurassic formation. The image details of the fault zone (marked with two blue dotted ellipses in Figures 5b, 8a) were further enhanced via multiple-attribute amalgamation. Figure 9 presents eight attributes shown in Figure 7, excluding the Non-steered similarity (mid window) and Steered similarity (mid window) attributes displayed in Figure 5. The fault response characteristics of these attributes are comparatively less distinct than those of the extracted FPC attribute. The computational environment for the experiment was as follows: A Dell Precision 5,760 workstation equipped with an Intel Xeon W-11955M processor (8 cores), 64 GB DDR4 memory (3,200 MHz), and an NVIDIA RTX A3000 laptop GPU (6 GB of video memory). Using OpendTect version 6.2.1, 400 example sets, including fault zone and no-fault zone locations, were selected from the 4,500 ms time slice. The ten attributes listed in Figure 7b served as inputs, with Figures 7c, d used for quality control. The computation of the weight file required approximately 1 min, while the FPC attribute calculation for the 4,500 ms horizontal slice, as shown in Figure 8a, took approximately 20 min. This provides a solid foundation for supporting subsequent research efforts.
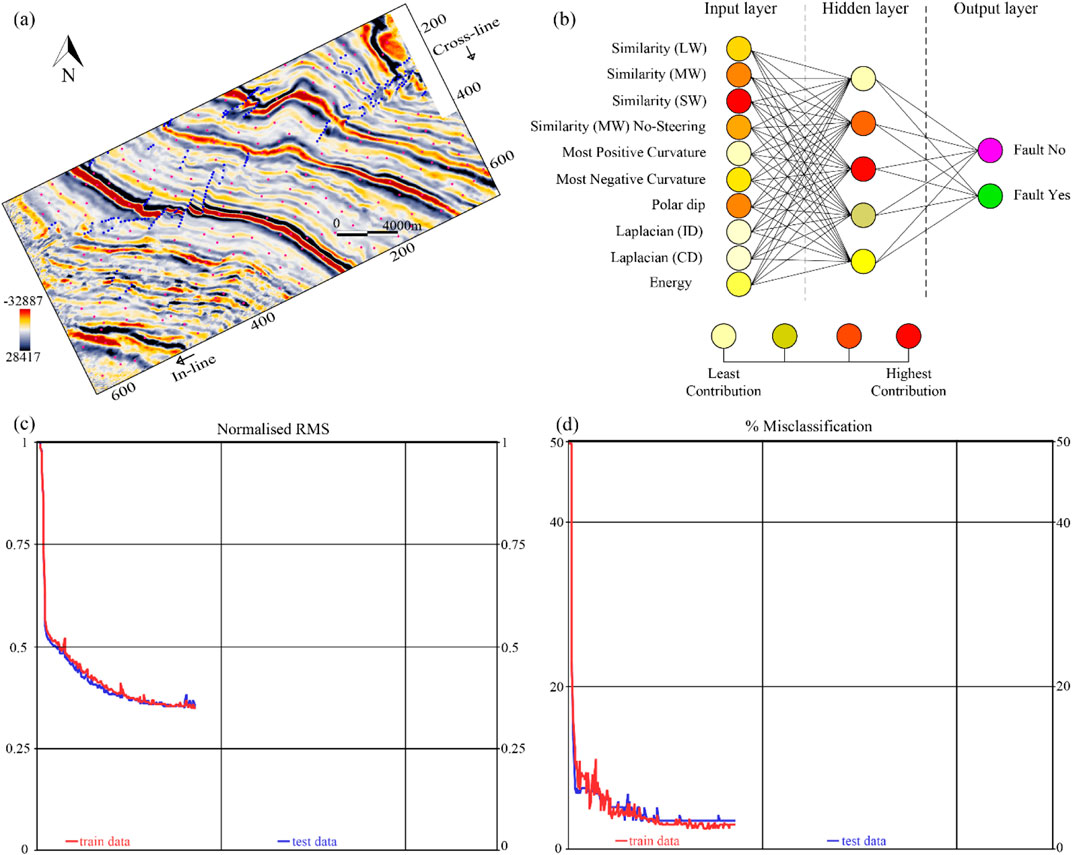
Figure 7. (a) Example locations. They are manually picked from the time slice (4,500 ms) of FEF seismic volume and grouped into fault-yes (blue color) and fault-no (pink color) data sets. (b) Non-linear MLP network. It is applied for artificial neural calculation. (c) N-RMS error between the test data (blue curve) and the train data (red curve). (d) Corresponding misclassification percentage between the two data sets.
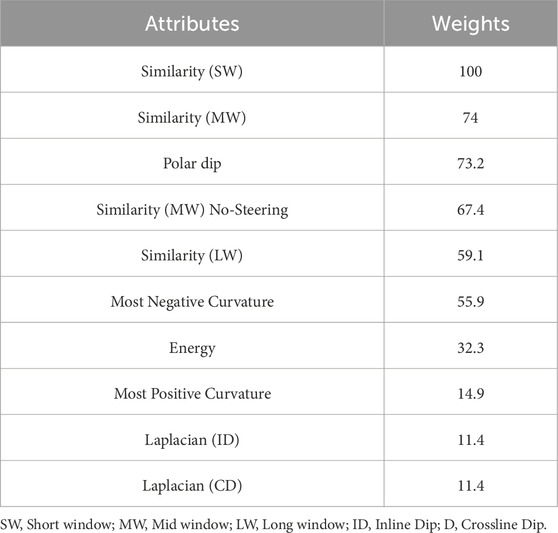
Table 1. Attribute-weight chart illustrating the weight from each attribute adopted for neural training in this research.
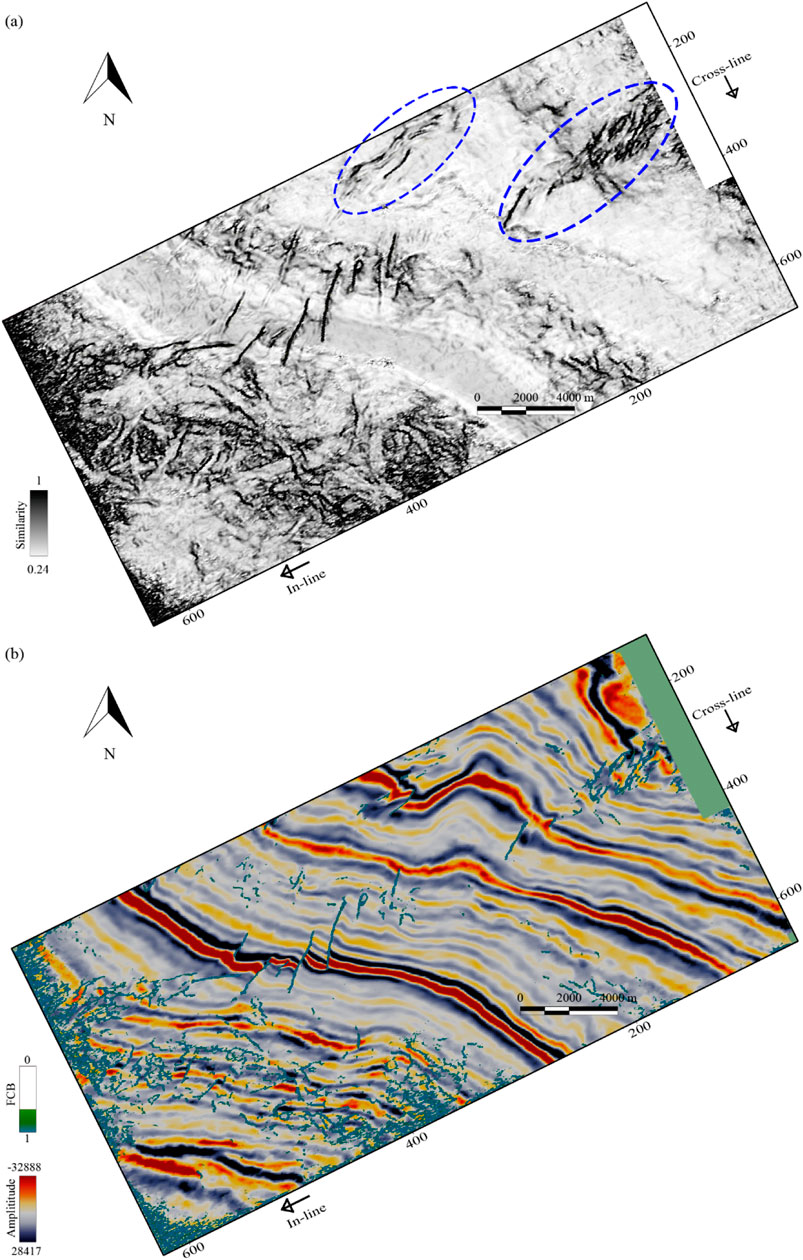
Figure 8. (a) FPC attribute. This attribute is presented for time slice 4,500 ms. Higher fault probabilities are marked with deep black color, while lower fault probabilities are marked with white color. This attribute brings out better visibility of the fault zones and improves seismic reflect continuity. (b) Same attribute. They are co-rendered with FEF seismic data for the same time slice. The green color indicates a higher probability of fault locations.
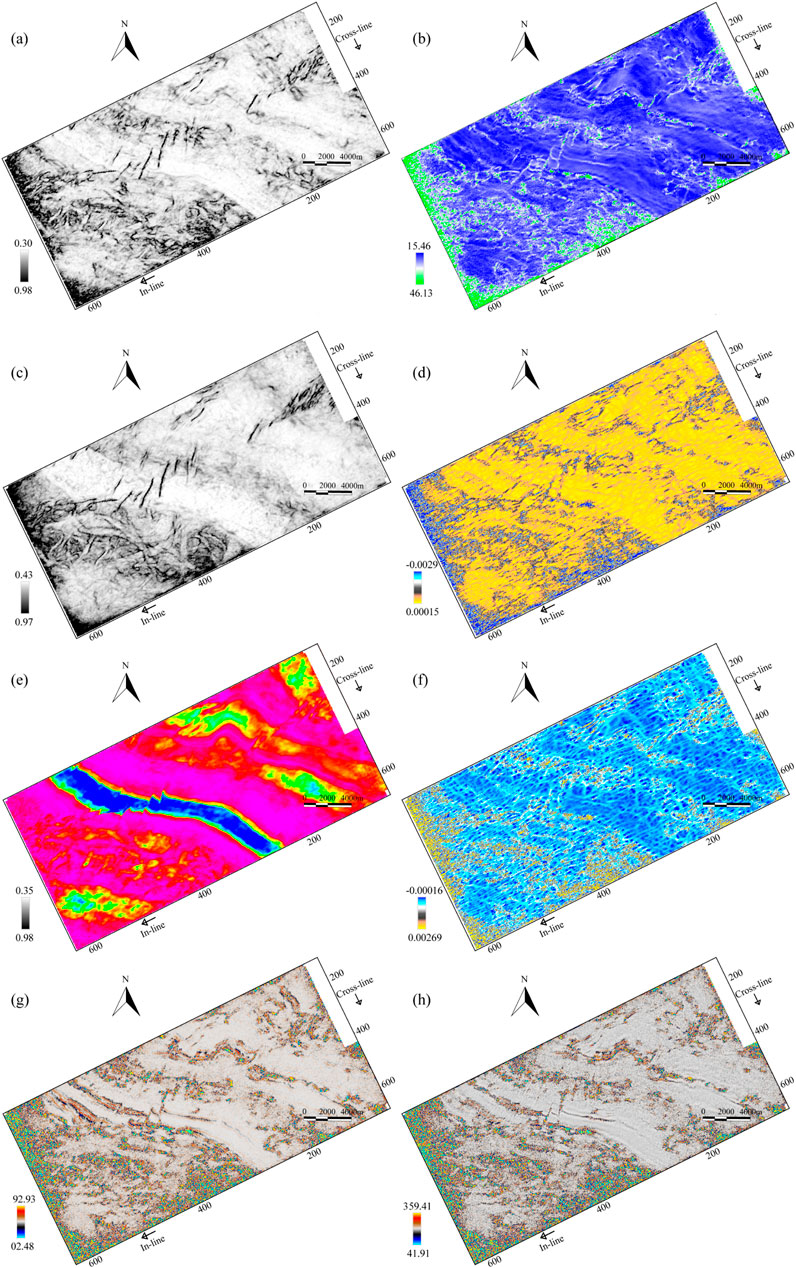
Figure 9. (a) Similarity (SW) attribute. (b) Polar dip attribute. (c) Similarity (LW) attribute. (d) Most negative curvature attribute. (e) Energy attribute. (f) Most positive curvature attribute. (g) Laplacian (ID) attribute. (h) Laplacian (CD) attribute. All these attributes are presented for time slice 4,500 ms.
The FPC attribute has efficiently depicted the spatial and temporal distribution of fault zones and within the Jurassic formation (Figure 10). The fault zones mostly strike NE-SW structural trends and are divided into four different sets based on their curvature degree and linkage types, named I, II, III, and IV (Figure 11), marked with blue dashed ovals), according to the TVDSS structure map co-rendered with the FPC attribute (Figure 11a). It is also observed set I, presenting straight segments, mostly containing soft-linked fault zones with some typically isolated fault zones, is structured with minor fault discontinuities no longer than 3 km and mostly located on the northeast part of this study area. About ten numbered fault zones consist of set II, mostly presenting sub-straight segments and containing typical soft-linked fault zones, and located on the center part of this study area. Set III, roughly presenting sub-curved segments and including typical coalesced fault zones with some bends at the linked locations, is located on the northern part of the studied area. Set IV, mostly showing curved segments and typical hard-linked fault zones, presents more complicated distribution features.
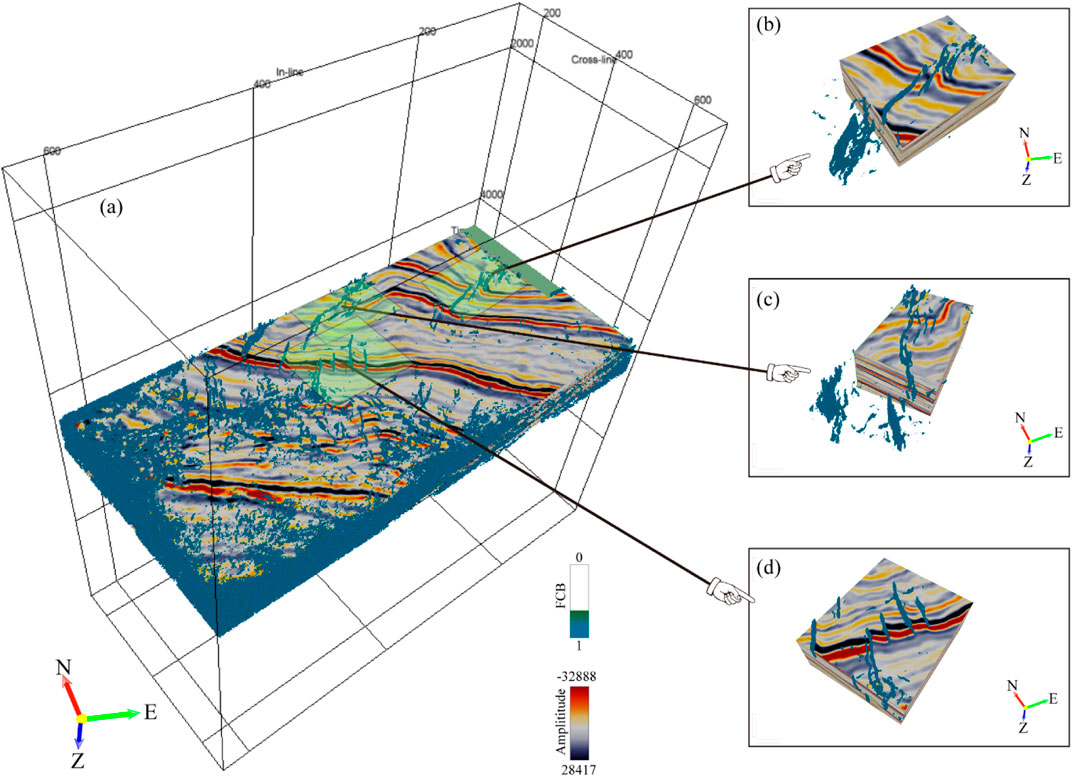
Figure 10. (a) Overall display of the 3D volumetric. The FEF seismic data volume is co-rendered with the FPC attribute within the Jurassic. (b–d) Detailed display of the fault signatures. These fault zones are indicated by the FPC attribute. The different fault zones with different geometry could be observed detailedly.
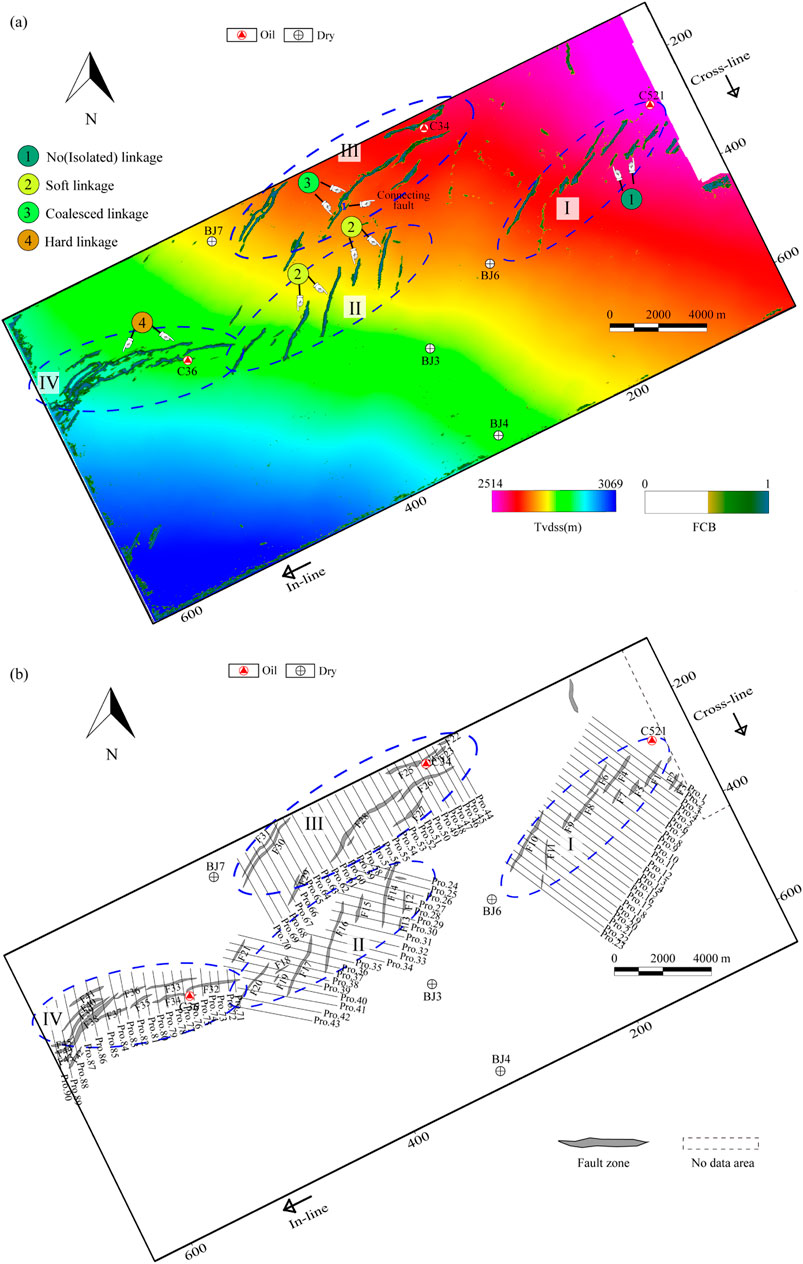
Figure 11. (a) TVDSS structure map of the base surface of J2t from the C36 seismic volume. The TVDSS structure map, co-rendered with the hybrid seismic attribute, presents the distribution and orientation of the fault zones. (b) Fault zones. They are digitized, according to (a). J2t stands for the toutunhe formation of the Jurassic. Here, “Pro.” is an abbreviation for “Profile.” It is used to denote the locations of seismic profiles selected perpendicular to the strike of fault zones.
4.2 The W-D distribution features of fault zones
The W-D values were measured along four sets containing the different linkage types of fault zones at the base of the toutunhe formation of the Jurassic (J2t) (Figure 11a) using the depth converted displacements. Displacement values within set I vary between 0.3 and 26.4 m (Figure 12a). The largest displacement is from the central locations of F8 (pro. 11), located at the middle zones of set I. The northeastern tip of the fault zone is spread beyond the studied seismic survey range. The fault zone width ranges between 43.4 and 160.5 m within the same fault sets (Figure 12a), with the widest position located at the fault bends of F10 (pro. 17). The displacement measurements within set II (Figure 12b) exhibit variations from 2.8 to 28.7 m, with the largest displacement from the central position (pro. 40) of F20 (Figure 12b). The fault zone width varies from 47.3 to 138.1 m, and the largest width (Figure 12b) has been measured near the bend position (pro. 35) of F17 (Figure 12b). Within set III, displacement (Figure 12c) varies between 1.1 and 27.8 m, with the largest displacement from the central position (pro. 49) close to the central location of F26. Displacement decreases toward the western tip of the fault zone. Their width ranges from 37.7 to 236.2 m, and local increases in width (Figure 12c) are shown where the largest width value was measured from the fault bend position (pro. 59) of F28 (Figure 12c). Their displacement measurements within set IV (Figure 12d) demonstrate variations from 1.2 to 49.9 m, with the largest displacement from the western position (pro. 83) of F36 (Figure 12d), hard-linked with F38. Their width (Figure 12d) varies from 47.3 to 326.7 m, and the largest width has been measured near the fault bend positions (pro. 87) of F38.
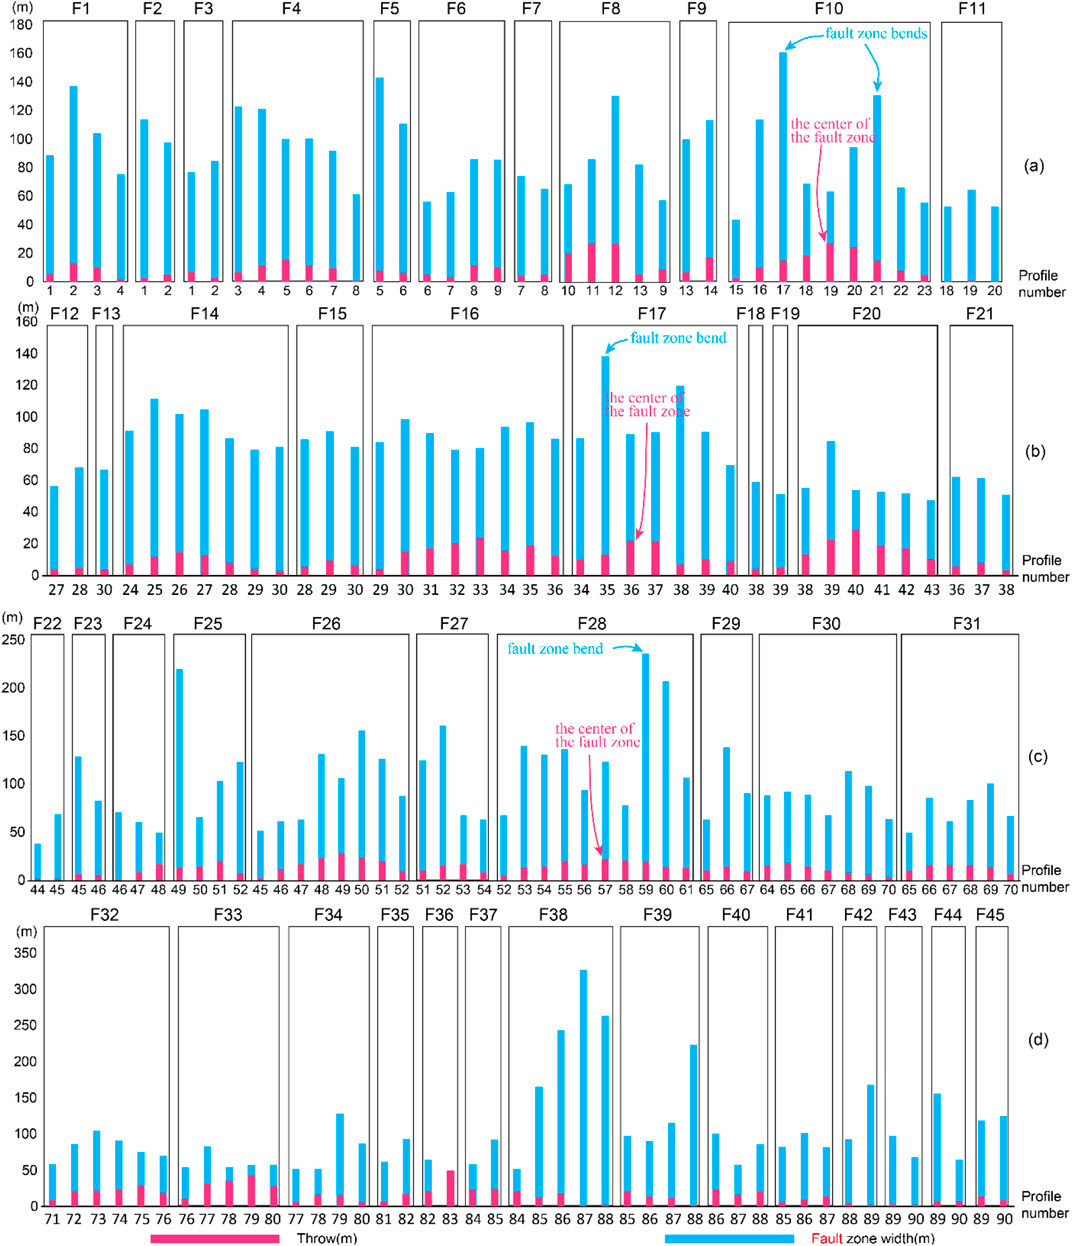
Figure 12. Fault zone W-D values. They were measured by seismic profiles roughly perpendicular to fault zones according to the digitized fault distribution map of the base surface of J2t (See Figure 11b for location). The W-D values cover four named fault sets: I (a), II (b), III (c), and IV (d). J2t = toutunhe formation of the Jurassic.
We have also plotted the W-D relation of the fault zone and further compared our latest results with previous related studies. Our plot presents a similar trend to the previous studies (Figure 13) for the W-D relationship of the fault zone. Moreover, our plot clearly exhibits such evident distribution characteristics of horizontal extension and local aggregation. Furthermore, most of the largest displacement values are almost located on the center locations of single fault zones, while most of the largest width values are almost located on the bend parts of single fault zones. However, the displacement data from the different fault sets with different curved features and linkage types demonstrate significantly different relationships with fault zone width. The W-D of the fault zone data showed a roughly positive correlation in Figures 14a–d, with different R2 values. Conversely, Figure 14d exhibits a significant negative W-D correlation of the fault zone.
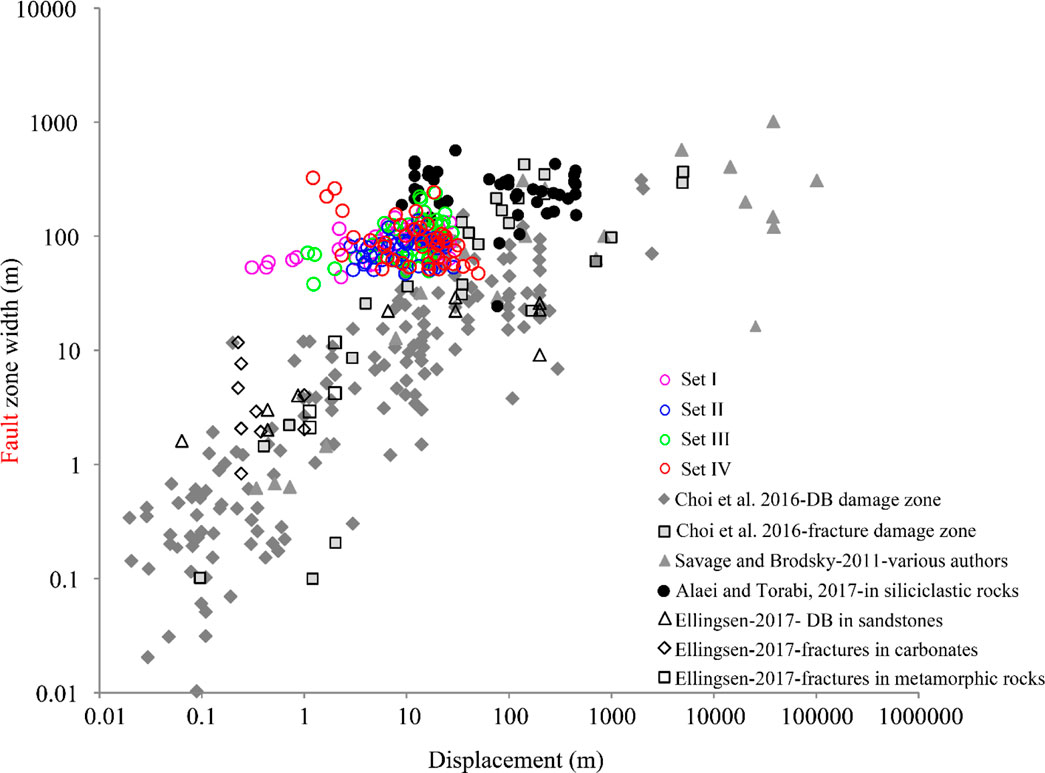
Figure 13. Log-log plots of width versus displacement of strike-slip fault zones. They exhibit a comparison between this research and the previous studies (Alaei and Torabi, 2017). The measured values from four sets with different curved segments and link types are marked with different color circles. DB stands for deformation band.
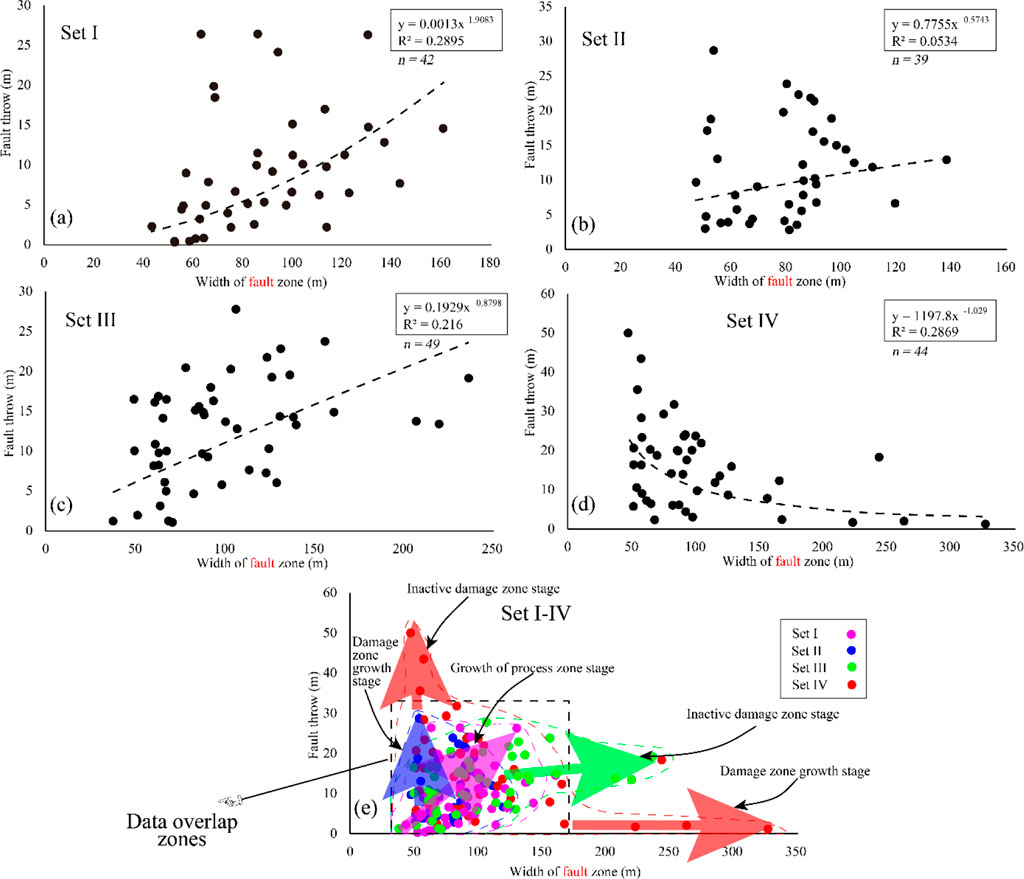
Figure 14. Linear plots of fault zone width versus displacement for the base of J2t in the C36 area, Junggar Basin: (a) Set I, (b) Set II, (c) Set III, (d) Set IV, and (e) combined data from Sets I-IV showing overlapping zones and different fault zone growth stages. The values from different sets are also marked with different color circles.
5 Discussion
5.1 The hybrid attribute for fault zones enhancing imaging
The computed hybrid attribute using ANN networks, jointly combined with post-stack conditioned process and seismic multi-attribute analysis, opens new opportunities to investigate fault zones at seismic scales further and could compare with the previous studies, whose data obtained from other sources, including outcrops. The results indicate that the workflows we proposed, especially the computed hybrid attribute, are valid and widely applied to other 3D surveys.
Some attempts, especially applying seismic attributes to define some characteristics, have been constructed, and part of them could be correlated to the studies from the outcropped fault zones. Dutzer et al. (2010) adopt the seismic fault distortion zone concept containing inner and outer zones. Iacopini et al. (2016) adopt the fault seismic disturbance zone (SDZ) concept and present workflows for imaging the SDZ by comprehensively using amplitude, waveform similarity (coherence), and phase attributes. Alaei and Torabi (2017) extract the segment length and width data of the fault zones by using frequency decomposition and fault attribute analysis methods. Liao et al. (2019) try to adopt seismic coherence to investigate the subsurface characterization of fault zones. Ma et al. (2019) integrate seismic coherence and amplitude attributes to image fault zones, proposing an evolution process of damage zone growth within carbonates. Liao et al. (2020) analyze the internal architecture and fracture distribution within composite damage zones (CDZ-s), jointly applying seismic attributes, such as variance, curvature, and dip-azimuth, defining three classes of CDZ-s. However, using only a single seismic attribute or jointly using several attributes is still arguable or subjective for the reliability of fault interpretation. Therefore, we strongly support that the advanced workflow for attribute amalgamation, mostly including the ANN approach, is adopted to image fault zones and bring out more details than before. The fault zones could be displayed in the 3D space, and quantitatively analyzed the W-D distribution features using the hybrid attribute. This method could reduce the subjectivity of the interpreter during the measuring stage of W-D according to the united identification criterion of the boundary of fault zones to some extent. It is observed that the boundary of fault zones is more apparent than before, and the hybrid attribute brings out a relatively fixed or uniform standard about the boundary. Therefore, the quantitative analysis of fault zone W-D is easy and useful for measuring enough samples for including much different geometry or order fault zones. It also provides convenience for selecting the fault zones to avoid these conditions cutting through various lithologies and measuring at various depths for reducing the unnecessary influence factor of scattering in the sampled data. Thus, we consider that the workflows could be widely applied to other surveys to study the W-D scaling relationship in the future.
The hybrid attribute demonstrates new possibilities of studying fault zones based on 3D seismic data and could compare the latest results with other data sources, especially outcrops. Our proposed workflow, which adopts several post-stack seismic data conditioning processes and multi-attribute amalgamation using a neural network approach (unlike traditional single or several attributes), provides enhanced images of fault zones. The compared image results of fault zones from Figure 5 indicate that data conditioning is necessary and plays an essential role in improving the image quality. Table 1 also illustrates that the multi-attribute amalgamation using a neural network approach could avoid the deficiencies of single-attribute characterization ability to some extent. Figures 5, 9 collectively illustrate the ten input attributes shown in Figure 7b. When compared with Figure 8a, each attribute demonstrates fault response characteristics consistent with the weight contributions listed in Table 1. These methods effectively enhance their ability to image complex structural features (Figure 8). In addition, the additional threshold setting further improves the boundary sharper signatures of fault zones, bringing out the united boundary identification criterion. These considerable improvements in imaging out the boundary of the fault zone allow us to study its scaling relation with displacement efficiently, at least eliminating the interference of boundary inconsistent to some extent. Figure 12 demonstrates that all measured fault zones have thicker fault zones (varies between 37.7 and 326.7 m) with respect to their corresponding displacement compared to previous findings (Alaei and Torabi, 2017). Although seismic attributes are commonly efficient in highlighting fault zones (Botter et al., 2016; Iacopini et al., 2016; Wan et al., 2016; Ma et al., 2019; Liao et al., 2020), identifying fault zone boundaries according to a single or several common seismic attributes remains bias. The use of integrated workflows in this research further enhances the sharper characteristics of the fault zones. Thus, the latest identification of the boundary of the fault zone is more transparent and objective than the previous study, which used the coherence and amplitude attributes (Wan et al., 2016).
Moreover, we have also plotted the scaling relation between the W-D of the fault zone and compared our latest results with previous studies (Figure 13). Our latest research results could be compared well with previous studies. It implies that our approach is feasible and that the result is reliable. Thus, our studies suggest that the boundary identification of fault zone based on the hybrid seismic attribute and the following research of the W-D relationship is feasible. Our current approach provides more possibilities using 3D seismic data to investigate the W-D relationship of fault zones, especially for the area lacking drilling data and outcrop data. Therefore, we strongly suggest that the workflows could be widely applied to other surveys to study the fault zones. Although, this study only presents a related case regarding shallow machine learning, not deep learning. It has demonstrated an effective imaging result of the subsurface fault zones. Therefore, we consider that deep learning must also be extended to study fault zone identification and quantitative interpretation in future research. The application of deep learning will likely bring out more insight into understanding the subsurface fault zones.
5.2 The W-D influencing factors of fault zones
The largest strength of our work is that the sample data collected are enough and derived from the same lithological combinations, deformation element, united boundary definition, and at approximately the same depth range. This enables us to isolate the influence of the aforementioned overlapping factors on fault zones. Consequently, such data is essential for more effectively analyzing other controlling factors of fault zones through the width-displacement relationship. Furthermore, as fault zones are rarely completely exposed in 3-D, especially the examples from outcrops, interpreting the 3-D distribution of fault zones seems always challenging. Therefore, the seismic data seem very important to study the fault zones, avoiding the incomplete observations of fault zones, especially in the outcrops. In addition, the fault zones with four typical geometry characteristics, such as different curved features and linkage types in the map view, are available for direct comparisons. All the data are well used for analyzing the influence for the attribute of W-D of the fault zone.
Most researchers have focused their researches on the influence factors of the W-D of fault zones. The protolith nature, the depth range of faulting, tectonic environment (such as normal, strike-slip, or reverse faulting), layer thickness, and various stress fields are prone to affect the damage zone width (Faulkner et al., 2011). In addition, the fault damage types, including tip damage, wall damage, and link damage, are not differentiated, probably explaining a part of the D-T data scattering (Mayolle et al., 2019). Although some researchers consider that fault linkage types likely influence the scaling of fault zones, the sampled data they used has a common defect: the data are not enough or typical. Our W-D measurements could meet these three conditions (Evans, 1990) from (1) different points along the same fault, (2) families of faults in similar rock types with different amounts of slip, such as different numbered fault zones, and (3) faults with similar amounts of the net slip in similar structural settings. The latest interpretation results indicate that fault linkage-type including isolated, soft-linked, hard-linked, and coalesced fault traces co-occur in the C36 Prospect, with enough sampled and continuous data in this research. It provides a typical case for unlocking the fault geometry influencing for W-D of fault zones because the data set in this study comes from the same lithological combination and deformation histories.
Moreover, the survey locates nearly the same depth range, varying between 2,510 and 3,100 m, and the studied area roughly presents a uniform slope characteristic without any local strata folding, without apparent width or displacement change patterns along the depth even within the same set. Consequently, the influence of lithology and burial effects on fault zones could be negligible. Thus, we consider that perhaps the fault geometry, acting as the most crucial factor, influences both attributes of fault, such as W-D, further leading to the different W-D correlations. Fault zone W-D values were detailedly measured along with four sets at the base surface of the toutunhe formation of the Jurassic (J2t) (Figure 11). It is shown that the largest width of a single fault zone seems always locates the bend of the single fault zone, while the largest throw values are commonly from the locations where located in its center part (Figure. 11) to some extent.
5.3 The fault linkage types and the scatter data from their scaling
The width and corresponding displacement data for all fault zones were plotted against each other in both log-log and linear space. Although the displacement in the present study refers to the throw measured easily (the true displacement values are difficult to measure continuously), our latest research results bring out new insights about the four sets and the scatter data from their scaling, while the fault zones could also be available to unlock the influence of the evolution of fault zone growth for scattering data. The average throw can approximately reveal the activity strength of strike-slip faults (Han et al., 2020). Thus, the activity strength of fault zones, from fault zone I to III, II, and IV, gradually becomes stronger according to their average throws (9.2–11.4, 12.6, and 15.9 m, respectively) and approximately stand for four the different evolution stages of fault zones.
Although the fault zone width mostly demonstrates a positive correlation with the displacement (Figures 14a–c), the W-D relationship of the fault zone presents no simple linear or power-law relation with scattering data. Our plot (Figure 13) clearly exhibits a longitudinally extending feature, similar to the data trends from previous studies (Alaei and Torabi, 2017) to some extent. The W-D data of the fault zones showed a roughly positive correlation in Figures 14a–c, with different R2 values. Conversely, Figure 14d demonstrates a significant negative W-D correlation. These figures present two main characteristics. The first one is that although all of the relationships exhibit mostly the same distribution trend, such as same gradients of best-fit trends or same magnitudes within the plot, the relationships still do not present a positive linear trend. It concludes that the scattering relationships between W-D of the fault zone may not be visible. The second one is that although the scattering relationships are largely reduced, their data scattering still occurs, presenting different R2 values in each relationship.
The data compiled from the fault zones with different geometrical characteristics indicates (Figures 14a–d) that the fault linkage type is an important controlling factor that results in different W-D relationship features, simultaneously presenting a scatter distribution characteristic. It is easily observed that almost all of the largest displacement values are located at the center part of the single fault zones, not identified easily from hard-linked fault zones (set IV) due to their complicated linkage relationship, while almost all of the largest width values are from the bends (Figures 12, 13) of the corresponding fault zones. Whatever the scaling relationships, especially from Figures 14a–c, may help predict geometries of fault zones from the Junggar Basin and possibly elsewhere. Figure 14e contains data from Sets I-IV. This figure indicates that the fault zones with different geometric characteristics have some of the same numerical distribution range of the W-D relationship in the linear plot, especially in the same 3D area with similar tectonic activity history. Our latest research demonstrates that although four sets with different fault geometric features stand for different evolution or growth stage, all of them still have a broad overlap range of W-D distribution (marked with a black rectangle dotted box in Figure 14e) in the plot. Therefore, it is challenging to unlock the evolution process of the fault zones in the linear plot. However, our latest research still could bring out important notes about fault zone evolution with different trend scattering data marked with different color dotted lines in the same plot. The I set, locating the center part of the plot and approximately standing for the isolated fault zone evolution stage, presents both W-D growths simultaneously (marked with a pink arrow in Figure 14e). This pink arrow trend could also roughly stand for the growth of the process zone stage, occurring in the initial evolution stages of fault zones. The II set, mostly standing for the soft-linkage fault zone evolution stage, presents a slight difference in W-D growth, illustrating that the displacement growth is more pronounced (marked with a blue arrow in Figure 14e). This blue arrow trend also could be understood as roughly standing for fault zone growth stage. The III set, roughly standing for the coalesced fault zone evolution stage, presents a moderate growth difference of W-D growth, showing that the scaling of width growth is more pronounced (marked with a green arrow in Figure 14e). This green arrow trend also could be considered to stand for the inactive fault zone stage roughly. The IV set, typically standing for the hard-linked fault zone evolution stage, exhibits great growth differences of W-D growth simultaneously (marked with two red arrows in Figure 14e). These two arrow trends also could be understood as roughly standing for inactive damage zone stage and damage zone growth stage. Therefore, a fault zone can grow periodically (Fossen, 2010), mostly consisting of the process (or damage) zone growth and throw/displacement accumulation stages as shown in Figure 14e. Four different sets containing different fault linkage types, standing for four different fault growing stages and presenting four different W-D growing trends, obviously provide a deep understanding of the scatter data.
5.4 Relationship between different types the fault zones and hydrocarbons
Previous studies have primarily focused on the architecture types of fault zones or W-D relationship, lacking further analysis on their control over hydrocarbons combined with well data (Liao et al., 2019; Liao et al., 2020; Ma et al., 2019; Wu et al., 2019). In this study, we conducted a comprehensive analysis by integrating drilled well data from the C36 3D area. Wells C521, C34, and C36 (Figure 11) are respectively located within fault zones I to III, and IV, and each of these wells shows good potential for hydrocarbon containment. The up-dip directions of wells C34 and C36 are obstructed by fault zones, leading to the formation of reservoirs. In contrast, well C521 formed a reservoir due to the absence of a fault zone in its up-dip direction. It can be inferred that the fault zones I to III in the up-dip directions of wells C34 and C36 likely played a role in laterally sealing these wells to prevent hydrocarbon lateral migration. On the contrary, some fault zones in the down-dip direction of well C521 may play a role in facilitating the drainage of hydrocarbon. Currently, there are no wells within fault zone II, so its role in hydrocarbon accumulation cannot be confirmed from the plan view.
Figure 11a illustrates that different sets are constituted by distinct fault linkage types. Section 5.3 discusses how various fault linkage types are associated with unique fault zone growth processes, corresponding to different growth cycles; evidently, these differing growth cycles probably exert distinct controls on hydrocarbons. To investigate the control exerted by various fracture linkage types on hydrocarbons, this study projects and compares the maximum displacement data of fault zones for different linkage types against prior research (Figure 15). The trends in the projected data suggest that sets I and II are predominantly characterized by extensional activities within the damage zones of fractures, whereas sets III and IV are mainly defined by cumulative displacement activity periods. Fault damage zones contains fracture commonly provide a high-permeability conduit for fluid flow (Billi et al., 2003) and can act as a preferential corridor for fluid flow in the subsurface (Martinelli et al., 2020). In addition, these fault zones display characteristics of strike-slip movement (Cui et al., 2022), and the wells C34 and C36 have been proven to contain hydrocarbons, likely due to obstruction by fault zones. So set I and set II probably act as facilitating the drainage of hydrocarbon. On the contrary, set III and set IV probably play a role in laterally sealing to prevent hydrocarbon lateral migration. This conclusion is likely to provide some potential constraints for future drilling plans in this block and exploration in other blocks. However, this conclusion will require more drilling data and examples in the future to substantiate this viewpoint.
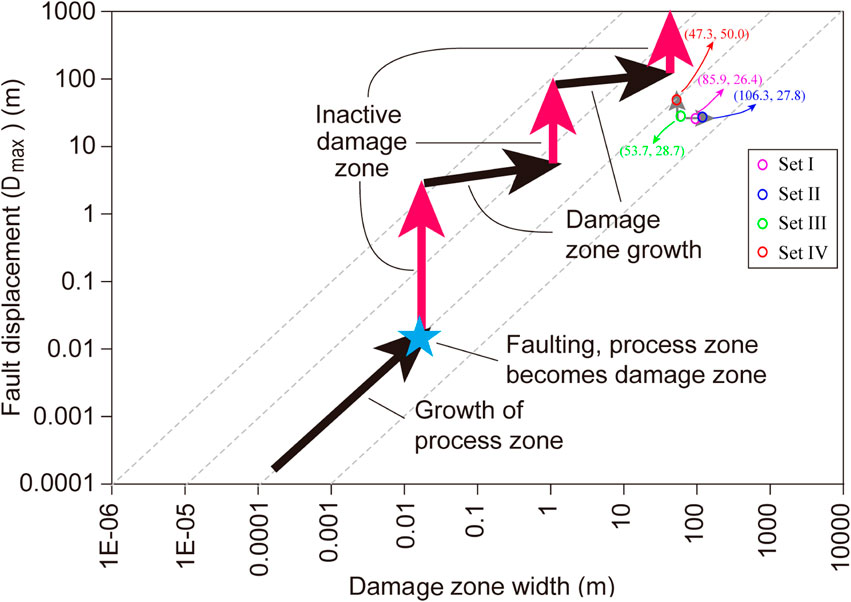
Figure 15. Schematic illustration shows shows the relationship between the width of the damage zone and the corresponding maximum displacement, using data from data sets I, II, III, and IV for the base of J2t in the C36 area, Junggar Basin. The max displacement data sets are selected from four sets. J2t stands for the toutunhe formation of the Jurassic. The schematic demonstrates how a damage zone can grow periodically [modified from Fossen (2010)].
The W-D data of the fault zones with different linkage types showed different R2 values (Figures 14a–d), and presents data scattered characteristics (Figure 14e). These characteristics implie that the relationship between different types the fault zones and hydrocarbons is complicated. In the future, more detailed work is needed to explore the control of hydrocarbon from the perspectives of fault zones with different linkage types or growth cycles with greater precision. This study only analyzes the control of fault zones on hydrocarbons from the “set” perspective. Future research might need to focus on the influence of segmented fault zones within each sets on hydrocarbons, which could be more meaningful for subsequent drilling plans in the Junggar Basin and other petroliferous basins with similar settings (Figure 1).
6 Conclusion
Jointly using post-stack conditioning, seismic attribute calculation, and the ANN approach yielded a hybrid attribute, which provided enhanced images of fault zones from 3D seismic reflection data and could be widely applied to other surveys to quantitative study the W-D relationship in the future. We have imaged and analyzed fault zones, mostly including the W-D, within the C36 Prospect of the Baijiahai subuplift using the hybrid attribute. Furthermore, a comprehensive analysis of the fault linkage types and their W-D relationships has also been carried out. The following main conclusions can be made:
The present work presents a better path for improving fault zone features from 3D seismic data. The conditioned seismic volume with enhanced and sharpened fault features is carried out by several structure-oriented filtering steps in this work. The attribute calculation and neural training performed based on adopting this conditioned seismic data are integrated to produce the optimum hybrid seismic attribute, which has efficiently enhanced the image of fault zones, providing new paths for gaining the united boundary features of fault zones.
The current interpretation strategies provided here enhance boundary features by making them applicable to the fault zones. We gain new insights about the W-D distribution features of different fault sets with different fault linkage types in the map view. The computed hybrid seismic attribute is effectively used to measure and analyze the W-D of the fault zones. The largest width values are closely related to the bend of a single fault zone, while the largest displacement values commonly distribute its center.
The latest statistical results of fault zones provided new insights about the fault linkage types and the scatter data from their W-D relationship of fault zones, simultaneously including isolated, soft-linked, coalesced linkage, and hard-linked by the hybrid attribute. Our results suggest that the fault zone sets, including different linkage types with different geometry features, stand for different stages of fault zone growth periodically, with different fault zone width or displacement value growth process and accordingly provide different contributions for the W-D relationship in the linear plot.
The trends in the projected data suggest that sets I and II predominantly correspond to extensional activities of the fractured damage zones, and sets III and IV mainly associate with cumulative displacement activities of strike-slip fault core zones. Furthermore, based on a comprehensive analysis of drilling data, it is believed that sets I and II are likely to facilitate hydrocarbon drainage, while sets III and IV are believed to play a crucial role in lateral sealing, thereby preventing the lateral migration of hydrocarbons.
Data availability statement
The raw data supporting the conclusions of this article will be made available by the authors, without undue reservation.
Author contributions
LC: Conceptualization, Funding acquisition, Project administration, Resources, Supervision, Writing – original draft, Writing – review and editing. PZ: Data curation, Investigation, Software, Writing – review and editing. YN: Formal Analysis, Investigation, Software, Visualization, Writing – original draft. YH: Investigation, Methodology, Validation, Visualization, Writing – original draft. ZC: Formal Analysis, Investigation, Methodology, Visualization, Writing – original draft.
Funding
The author(s) declare that financial support was received for the research and/or publication of this article. This research was supported by the Research Foundation of China University of Petroleum-Beijing at Karamay (No. XQZX20240011), which provided financial support for research activities. Additional funding was provided by the Xinjiang Uygur Autonomous Region “Tianchi Talents” Introduction Program, supporting author development and project implementation. The work was supported by the “Tianchi Talents” Introduction Program of the Xinjiang Uygur Autonomous Region. This is a talent recruitment program and does not have a specific grant number.
Acknowledgments
This research was mainly supported by Research Foundation of China University of Petroleum-Beijing at Karamay (No. XQZX20240011) and the Xinjiang Uygur Autonomous Region “Tianchi Talents” Introduction Program. PetroChina Xinjiang Oilfield Company is highly acknowledged and thanked for providing 3D seismic data sets.
Conflict of interest
The authors declare that the research was conducted in the absence of any commercial or financial relationships that could be construed as a potential conflict of interest.
Publisher’s note
All claims expressed in this article are solely those of the authors and do not necessarily represent those of their affiliated organizations, or those of the publisher, the editors and the reviewers. Any product that may be evaluated in this article, or claim that may be made by its manufacturer, is not guaranteed or endorsed by the publisher.
References
Alaei, B., and Torabi, A. (2017). Seismic imaging of fault damaged zone and its scaling relation with displacement. Interpretation 5, SP83–SP93. doi:10.1190/int-2016-0230.1
Allen, M. B., and Vincent, S. J. (1997). Fault reactivation in the Junggar region, northwest China: the role of basement structures during Mesozoic-Cenozoic compression. J. Geol. Soc. Lond. 154, 151–155. doi:10.1144/gsjgs.154.1.0151
Alves, T., Omosanya, K., and Gowling, P. (2015). Volume rendering of enigmatic highamplitude anomalies in southeast Brazil: a workflow to distinguish lithologic features from fluid accumulations. Interpretation 3, A1–A14. doi:10.1190/INT-2014-0106.1
Aminzadeh, F., and De Groot, P. (2006). Neural networks and other soft computing techniques with applications in the oil industry. Eage Publications.
Atakulreka, A., and Sutivong, D. (2007). “Avoiding local minima in feedforward neural networks,” in Neural networks (Berlin, Heidelberg: Springer), 100–109.
Bahorich, M., and Farmer, S. (1995). 3-D seismic discontinuity for faults and stratigraphic features: the coherence cube. Lead. Edge 14, 1053–1058. doi:10.1190/1.1437077
Basir, H. M., Javaherian, A., and Yaraki, M. T. (2013). Multi-attribute ant-tracking and neural network for fault detection: a case study of an Iranian oilfield. J. Geophys. Eng. 10, 015009. doi:10.1088/1742-2132/10/1/015009
Bian, W., Hornung, J., Liu, Z., Wang, P., and Hinderer, M. (2010). Sedimentary and palaeoenvironmental evolution of the Junggar Basin, Xinjiang, northwest China. Palaeobiodiversity Palaeoenvironments 90, 175–186. doi:10.1007/s12549-010-0038-9
Billi, A., Salvini, F., and Storti, F. (2003). The damage zone-fault core transition in carbonate rocks: implications for fault growth, structure and permeability. J. Struct. Geol. 25, 1779–1794. doi:10.1016/S0191-8141(03)00037-3
Botter, C., Cardozo, N., Hardy, S., Lecomte, I., Paton, G., and Escalona, A. (2016). Seismic characterisation of fault damage in 3D using mechanical and seismic modelling. Mar. Pet. Geol. 77, 973–990. doi:10.1016/j.marpetgeo.2016.08.002
Cao, B., Luo, X., Zhang, L., Sui, F., Lin, H., and Lei, Y. (2017). Diagenetic heterogeneity of deep sandstones and its relationship to oil emplacement: a case study from the middle jurassic toutunhe formation in the fukang sag, central junggar basin (NW China). Geofluids 2017, 1–23. doi:10.1155/2017/4292079
Cao, J., Wang, X., Sun, P., Zhang, Y., Tang, Y., Xiang, B., et al. (2012). Geochemistry and origins of natural gases in the central Junggar Basin, northwest China. Org. Geochem. 53, 166–176. doi:10.1016/j.orggeochem.2012.06.009
Cao, J., Yao, S., Jin, Z., Hu, W., Zhang, Y., Wang, X., et al. (2006). Petroleum migration and mixing in the northwestern Junggar Basin (NW China): constraints from oil-bearing fluid inclusion analyses. Org. Geochem. 37, 827–846. doi:10.1016/j.orggeochem.2006.02.003
Carroll, A. R., Yunhai, L., Graham, S. A., Xuchang, X., Hendrix, M. S., Jinchi, C., et al. (1990). Junggar basin, northwest China: trapped Late Paleozoic ocean. Tectonophysics 181, 1–14. doi:10.1016/0040-1951(90)90004-R
Celestino, M. A. L., Miranda, T. S. de, Mariano, G., Alencar, M. de L., Carvalho, B. R. B. M. de, Falcão, T. da C., et al. (2020). Fault damage zones width: implications for the tectonic evolution of the northern border of the Araripe Basin, Brazil, NE Brazil. J. Struct. Geol. 138, 104116. doi:10.1016/j.jsg.2020.104116
Chen, F., Wang, X. W., and Wang, X. W. (2005). Prototype and tectonic evolution of the Junggar Basin, northwestern China. Earth Sci. Front. 12, 077–089.
Chen, X., Lu, H. F., Shu, L. S., Wang, H., and Zhang, G. Q. (2002). Study on tectonic evolution of Junggar Basin. Geol. J. China Univ. 8, 257–267.
Childs, C., Nicol, A., Walsh, J. J., and Watterson, J. (1996). Growth of vertically segmented normal faults. J. Struct. Geol. 18, 1389–1397. doi:10.1016/S0191-8141(96)00060-0
Choi, J.-H., Edwards, P., Ko, K., and Kim, Y.-S. (2016). Definition and classification of fault damage zones: a review and a new methodological approach. Earth-Science Rev. 152, 70–87. doi:10.1016/j.earscirev.2015.11.006
Chopra, S. (2009). Interpreting fractures through 3D seismic discontinuity attributes and their visualization. CSEG Rec. 34, 5–14.
Chopra, S., and Marfurt, K. (2007a). Curvature attribute applications to 3D surface seismic data. Lead. Edge (Tulsa, OK) 26, 404–414. doi:10.1190/1.2723201
Chopra, S., and Marfurt, K. J. (2007b). Seismic attributes for Prospect identification and reservoir characterization. Society of Exploration Geophysicists. doi:10.1190/1.9781560801900
Cui, L., Wu, K., Liu, Q., Wang, D., Guo, W., Liu, Y., et al. (2022). Enhanced interpretation of strike-slip faults using hybrid attributes: advanced insights into fault geometry and relationship with hydrocarbon accumulation in Jurassic formations of the Junggar Basin. J. Pet. Sci. Eng. 208, 109630. doi:10.1016/j.petrol.2021.109630
Dawers, H., and Anders, M. H. (1995). Displacement-length scaling and fault linkage. J. Struct. Geol. 17, 607–614. doi:10.1016/0191-8141(94)00091-d
de Joussineau, G., and Aydin, A. (2007). The evolution of the damage zone with fault growth in sandstone and its multiscale characteristics. J. Geophys. Res. Solid Earth 112. doi:10.1029/2006JB004711
Dimmen, V., Rotevatn, A., Peacock, D. C. P., Nixon, C. W., and Nærland, K. (2017). Quantifying structural controls on fluid flow: insights from carbonate-hosted fault damage zones on the Maltese Islands. J. Struct. Geol. 101, 43–57. doi:10.1016/j.jsg.2017.05.012
Dutzer, J. F., Basford, H., and Purves, S. (2010). “Investigating fault-sealing potential through fault relative seismic volume analysis,” in Petroleum geology conference proceedings, 509–515. doi:10.1144/0070509
Evans, J. P. (1990). Thickness-displacement relationships for fault zones. J. Struct. Geol. 12, 1061–1065. doi:10.1016/0191-8141(90)90101-4
Faulkner, D. R., Mitchell, T. M., Jensen, E., and Cembrano, J. (2011). Scaling of fault damage zones with displacement and the implications for fault growth processes. J. Geophys. Res. 116, B05403. doi:10.1029/2010JB007788
Fehmers, G. C., and Höcker, C. F. W. (2003). Fast structural interpretation with structure-oriented filtering. Geophysics 68, 1286–1293. doi:10.1190/1.1598121
Gao, Y., Huang, H., Tao, H., Carroll, A. R., Qin, J., Chen, J., et al. (2020). Paleoenvironmental setting, mechanism and consequence of massive organic carbon burial in the Permian Junggar Basin, NW China. J. Asian Earth Sci. 194, 104222. doi:10.1016/j.jseaes.2019.104222
González, G., Gerbault, M., Martinod, J., Cembrano, J., Carrizo, D., Allmendinger, R., et al. (2008). Crack formation on top of propagating reverse faults of the Chuculay Fault System, northern Chile: insights from field data and numerical modelling. J. Struct. Geol. 30, 791–808. doi:10.1016/j.jsg.2008.02.008
Graham, S. A., Hendrix, M. S., Wang, L. B., and Carroll, A. R. (1993). Collisional successor basins of western China: impact of tectonic inheritance on sand composition. Geol. Soc. Am. Bull. 105, 323–344. doi:10.1130/0016-7606(1993)105<0323:csbowc>2.3.co;2
Guerriero, V., Mazzoli, S., Iannace, A., Vitale, S., Carravetta, A., and Strauss, C. (2013). A permeability model for naturally fractured carbonate reservoirs. Mar. Pet. Geol. 40, 115–134. doi:10.1016/j.marpetgeo.2012.11.002
Hale, D. (2013). Methods to compute fault images, extract fault surfaces, and estimate fault throws from 3D seismic images. Geophysics 78, O33–O43. doi:10.1190/GEO2012-0331.1
Han, S., Sang, S., Liang, J., Wang, W., Zhang, G., and Wang, S. (2019). Geochemistry, Petrology, and U–Pb dating of high-K volcanic rocks in wells WC-1 and Y-2 from the northern Junggar Basin, northwestern China: implications for the closure of the Keramaili oceanic basin during the Carboniferous. Geol. J. 54, 3921–3939. doi:10.1002/gj.3373
Han, X., Tang, L., Deng, S., and Cao, Z. (2020). Spatial characteristics and controlling factors of the strike-slip fault zones in the northern slope of tazhong uplift, tarim basin: insight from 3D seismic data. Acta Geol. Sin. 94, 516–529. doi:10.1111/1755-6724.14333
Han, Y., and Zhao, G. (2018). Final amalgamation of the tianshan and junggar orogenic collage in the southwestern central asian orogenic belt: constraints on the closure of the paleo-asian ocean. Earth-Science Rev. 186, 129–152. doi:10.1016/j.earscirev.2017.09.012
Hao, F., Zhang, Z., Zou, H., Zhang, Y., and Yang, Y. (2011). Origin and mechanism of the formation of the low-oil-saturation Moxizhuang field, Junggar Basin, China: implication for petroleum exploration in basins having complex histories. Am. Assoc. Pet. Geol. Bull. 95, 983–1008. doi:10.1306/11191010114
He, D., Zhang, L., Wu, S., Li, D., and Zhen, Y. (2018). Tectonic evolution stages and features of the Junggar Basin. Oil Gas. Geol. 39, 845–861. doi:10.11743/ogg20180501
He, D. F., Zhai, G. M., Kuang, J., Zhang, Y. J., and Shi, X. (2005). Distribution and tectonic features of paleo-uplifts in the Junggar Basin. Chin. J. Geol. 40, 248–261.
Iacopini, D., Butler, R. W. H., Purves, S., McArdle, N., and De Freslon, N. (2016). Exploring the seismic expression of fault zones in 3D seismic volumes. J. Struct. Geol. 89, 54–73. doi:10.1016/j.jsg.2016.05.005
Imber, J., Tuckwell, G. W., Childs, C., Walsh, J. J., Manzocchi, T., Heath, A. E., et al. (2004). Three-dimensional distinct element modelling of relay growth and breaching along normal faults. J. Struct. Geol. 26, 1897–1911. doi:10.1016/j.jsg.2004.02.010
Kumar, P. C., and Mandal, A. (2017). Enhancement of fault interpretation using multi-attribute analysis and artificial neural network (ANN) approach: a case study from Taranaki Basin, New Zealand. Explor. Geophys. 49, 409–424. doi:10.1071/EG16072
Kumar, P. C., Omosanya, K. O., Alves, T. M., and Sain, K. (2019). A neural network approach for elucidating fluid leakage along hard-linked normal faults. Mar. Pet. Geol. 110, 518–538. doi:10.1016/j.marpetgeo.2019.07.042
Kumar, P. C., and Sain, K. (2018). Attribute amalgamation-aiding interpretation of faults from seismic data: an example from Waitara 3D prospect in Taranaki basin off New Zealand. J. Appl. Geophys. 159, 52–68. doi:10.1016/j.jappgeo.2018.07.023
Liao, Z., Li, W., Zou, H., Hao, F., Marfurt, K. J., and Reches, Z. (2020). Composite damage zones in the subsurface. Geophys. J. Int. 222, 225–230. doi:10.1093/gji/ggaa158
Liao, Z., Liu, H., Carpenter, B. M., Marfurt, K. J., and Reches, Z. (2019). Analysis of fault damage zones using three-dimensional seismic coherence in the Anadarko Basin, Oklahoma. Am. Assoc. Pet. Geol. Bull. 103, 1771–1785. doi:10.1306/1219181413417207
Liao, Z., Liu, H., Jiang, Z., Marfurt, K. J., and Reches, Z. (2017). Fault damage zone at subsurface: a case study using 3D seismic attributes and a clay model analog for the Anadarko Basin, Oklahoma. Interpretation 5, T143–T150. doi:10.1190/INT-2016-0033.1
Liu, H., Wang, Y., Xin, R., and Wang, Y. (2006). Study on the slope break belts in the Jurassic down-warped lacustrine basin in western-margin area, Junggar Basin, northwestern China. Mar. Pet. Geol. 23, 913–930. doi:10.1016/j.marpetgeo.2006.08.004
Liu, Y., Wu, K., Wang, X., Liu, B., Guo, J., and Du, Y. (2017). Architecture of buried reverse fault zone in the sedimentary basin: a case study from the Hong-Che Fault Zone of the Junggar Basin. J. Struct. Geol. 105, 1–17. doi:10.1016/j.jsg.2017.11.002
Ma, D. B., Wu, G. H., Scarselli, N., Luo, X. S., Han, J. F., and Chen, Z. Y. (2019). Seismic damage zone and width–throw scaling along the strike-slip faults in the Ordovician carbonates in the Tarim Basin. Pet. Sci. 16, 752–762. doi:10.1007/s12182-019-0352-4
Mandal, A., and Srivastava, E. (2018). Enhanced structural interpretation from 3D seismic data using hybrid attributes: new insights into fault visualization and displacement in Cretaceous formations of the Scotian Basin, offshore Nova Scotia. Mar. Pet. Geol. 89, 464–478. doi:10.1016/j.marpetgeo.2017.10.013
Marfurt, K. J., and Alves, T. M. (2015). Pitfalls and limitations in seismic attribute interpretation of tectonic features. Interpretation 3, SB5–SB15. doi:10.1190/INT-2014-0122.1
Martinelli, M., Bistacchi, A., Mittempergher, S., Bonneau, F., Balsamo, F., Caumon, G., et al. (2020). Damage zone characterization combining scan-line and scan-area analysis on a km-scale Digital Outcrop Model: the Qala Fault (Gozo). J. Struct. Geol. 140, 104144. doi:10.1016/j.jsg.2020.104144
Mayolle, S., Soliva, R., Caniven, Y., Wibberley, C., Ballas, G., Milesi, G., et al. (2019). Scaling of fault damage zones in carbonate rocks. J. Struct. Geol. 124, 35–50. doi:10.1016/j.jsg.2019.03.007
Meldahl, P., Najjar, N., Oldenziel-Dijkstra, T., and Ligtenberg, H. (2002). Semi-automated detection of 4D anomalies., in 64th EAGE conference and exhibition, (European Association of Geoscientists and Engineers).
Mirkamali, M. S., Keshavarz, N. F. K., and Bakhtiari, M. R. (2013). Fault zone identification in the eastern part of the Persian Gulf based on combined seismic attributes. J. Geophys. Eng. 10, 1–11. doi:10.1088/1742-2132/10/1/015007
Mitchell, T. M., and Faulkner, D. R. (2009). The nature and origin of off-fault damage surrounding strike-slip fault zones with a wide range of displacements: a field study from the Atacama fault system, northern Chile. J. Struct. Geol. 31, 802–816. doi:10.1016/j.jsg.2009.05.002
Odoh, B. I., Ilechukwu, J. N., and Okoli, N. I. (2014). The use of seismic attributes to enhance fault interpretation of OT field, Niger delta. Int. J. Geosci. 05, 826–834. doi:10.4236/ijg.2014.58073
Peacock, D. C. P., Dimmen, V., Rotevatn, A., and Sanderson, D. J. (2017). A broader classification of damage zones. J. Struct. Geol. 102, 179–192. doi:10.1016/j.jsg.2017.08.004
Putz-Perrier, M. W., and Sanderson, D. J. (2010). Distribution of faults and extensional strain in fractured carbonates of the North Malta Graben. Am. Assoc. Pet. Geol. Bull. 94, 435–456. doi:10.1306/08260909063
Qiu, N., Zhang, Z., and Xu, E. (2008). Geothermal regime and Jurassic source rock maturity of the Junggar basin, northwest China. J. Asian Earth Sci. 31, 464–478. doi:10.1016/j.jseaes.2007.08.001
Santosh, D., Aditi, B., Poonam, K., Priyanka, S., Rao, P. H., Hasan, S. Z., et al. (2013). “An Integrated approach for faults and fractures delineation with dip and curvature attributes,” in 10th biennial international conference and exposition, (kochi), 7. Available online at: https://www.spgindia.org/10_biennial_form/P265.pdf.
Savage, H. M., and Brodsky, E. E. (2011). Collateral damage: evolution with displacement of fracture distribution and secondary fault strands in fault damage zones. J. Geophys. Res. Solid Earth 116, B03405. doi:10.1029/2010JB007665
Scholz, C. H., Dawers, N. H., Yu, J. Z., Anders, M. H., and Cowie, P. A. (1993). Fault growth and fault scaling laws: preliminary results. J. Geophys. Res. 98, 21951–21961. doi:10.1029/93jb01008
Schueller, S., Braathen, A., Fossen, H., and Tveranger, J. (2013). Spatial distribution of deformation bands in damage zones of extensional faults in porous sandstones: statistical analysis of field data. J. Struct. Geol. 52, 148–162. doi:10.1016/j.jsg.2013.03.013
Şengör, A. M. C. (1990). Plate tectonics and orogenic research after 25 years: a Tethyan perspective. Earth Sci. Rev. 27, 1–201. doi:10.1016/0012-8252(90)90002-D
Singh, D., Kumar, P. C., and Sain, K. (2016). Interpretation of gas chimney from seismic data using artificial neural network: a study from Maari 3D prospect in the Taranaki basin, New Zealand. J. Nat. Gas. Sci. Eng. 36, 339–357. doi:10.1016/j.jngse.2016.10.039
Srivastava, E., Kumar, P. C., and Mandal, A. (2017). “Seismic data conditioning and multi-attribute analysis for enhanced structural interpretation: a case study from offshore Nova Scotia, Scotian Basin,” in SEG technical Program expanded abstracts 2017 (Society of Exploration Geophysicists), 2225–2229. doi:10.1190/segam2017-17778902.1
Tao, K., Cao, J., Chen, X., Nueraili, Z., Hu, W., and Shi, C. (2019). Deep hydrocarbons in the northwestern Junggar Basin (NW China): geochemistry, origin, and implications for the oil vs. gas generation potential of post-mature saline lacustrine source rocks. Mar. Pet. Geol. 109, 623–640. doi:10.1016/j.marpetgeo.2019.06.041
Tingdahl, K. M., Bril, A. H., and de Groot, P. F. (2001). Improving seismic chimney detection using directional attributes. J. Pet. Sci. Eng. 29, 205–211. doi:10.1016/s0920-4105(01)00090-0
Tingdahl, K. M., and de Rooij, M. (2005). Semi-automatic detection of faults in 3D seismic data. Geophys. Prospect. 53, 533–542. doi:10.1111/j.1365-2478.2005.00489.x
Torabi, A., and Berg, S. S. (2011). Scaling of fault attributes: a review. Mar. Pet. Geol. 28, 1444–1460. doi:10.1016/j.marpetgeo.2011.04.003
Torabi, A., Johannessen, M. U., and Ellingsen, T. S. S. (2019). Fault core thickness: insights from siliciclastic and carbonate rocks. Geofluids 2019, 1–24. doi:10.1155/2019/2918673
Wan, X., Wu, G., Xie, E., Zhang, Y., and Gao, L. (2016). Seismic prediction of fault damage zones in carbonates in Halahatang area,Tarim Basin. Oil Gas. Geol. 37, 786–791. doi:10.11743/ogg20160519
Wang, Y., Jia, D., Pan, J., Wei, D., Tang, Y., Wang, G., et al. (2018). Multiple-phase tectonic superposition and reworking in the Junggar Basin of northwestern China-Implications for deepseated petroleum exploration. Am. Assoc. Pet. Geol. Bull. 102, 1489–1521. doi:10.1306/10181716518
Weickert, J. (1999). Coherence-enhancing diffusion filtering. Int. J. Comput. Vis. 31, 111–127. doi:10.1023/A:1008009714131
Wu, G., Gao, L., Zhang, Y., Ning, C., and Xie, E. (2019). Fracture attributes in reservoir-scale carbonate fault damage zones and implications for damage zone width and growth in the deep subsurface. J. Struct. Geol. 118, 181–193. doi:10.1016/j.jsg.2018.10.008
Wu, G., Kim, Y. S., Su, Z., Yang, P., Ma, D., and Zheng, D. (2020). Segment interaction and linkage evolution in a conjugate strike-slip fault system from the Tarim Basin, NW China. Mar. Pet. Geol. 112, 104054. doi:10.1016/j.marpetgeo.2019.104054
Wu, K., Zha, M., Wang, X. L., Qu, J. X., and Chen, X. (2005). Further researches on the tectonic evolution and dynamic setting of the Junggar Basin. Acta Geosci. Sin. 26, 217–222.
Wu, X. (2017). Directional structure-tensor-based coherence to detect seismic faults and channels. Geophysics 82, A13–A17. doi:10.1190/GEO2016-0473.1
Wu, X., and Hale, D. (2016). 3D seismic image processing for faults. Geophysics 81, IM1–IM11. doi:10.1190/geo2015-0380.1
Xiang, B., Zhou, N., Ma, W., Wu, M., and Cao, J. (2014). Multiple-stage migration and accumulation of Permian lacustrine mixed oils in the central Junggar Basin (NW China). Mar. Pet. Geol. 59, 187–201. doi:10.1016/j.marpetgeo.2014.08.014
Xiao, W., Windley, B., Sun, S., Li, J., Huang, B., Han, C., et al. (2015). A tale of amalgamation of three permo-triassic collage systems in central asia: oroclines, sutures, and terminal accretion. Annu. Rev. Earth Planet. Sci. 43, 477–507. doi:10.1146/annurev-earth-060614-105254
Yang, Y. T., Song, C. C., and He, S. (2015). Jurassic tectonostratigraphic evolution of the Junggar basin, NW China: a record of Mesozoic intraplate deformation in Central Asia. Tectonics 34, 86–115. doi:10.1002/2014TC003640
Zeng, L., Tang, X., Wang, T., and Gong, L. (2012). The influence of fracture cements in tight Paleogene saline lacustrine carbonate reservoirs, western Qaidam Basin,northwest China. Am. Assoc. Pet. Geol. Bull. 96, 2003–2017. doi:10.1306/04181211090
Zhang, C. J., He, D. F., Wu, X. Z., Shi, X., Luo, J. N., Wang, B. Y., et al. (2006). Formation and evolution of multicycle superimposed basins in Junggar Basin. China Pet. Explor 11, 47–58.
Zhang, Y. J., Cao, J., and Hu, W. X. (2010). Timing of petroleum accumulation and the division of reservoir-forming assemblages, Junggar Basin, NW China. Pet. Explor. Dev. 37, 257–262. doi:10.1016/S1876-3804(10)60031-6
Zhao, Z., Liu, J., Ding, W., Yang, R., and Zhao, G. (2021). Analysis of seismic damage zones: a case study of the ordovician formation in the shunbei 5 fault zone, tarim basin, China. J. Mar. Sci. Eng. 9, 630. doi:10.3390/jmse9060630
Zheng, Z. H., Kavousi, P., and Di, H. B. (2014). Multi-attributes and neural network-based fault detection in 3d seismic interpretation. Adv. Mater. Res. 838–841, 1497–1502. doi:10.4028/www.scientific.net/AMR.838-841.1497
Keywords: width-displacement relationship, seismic attributes, fault linkage, artificial neural network (ANN), Junggar Basin
Citation: Cui L, Zhang P, Niu Y, Huang Y and Chen Z (2025) Linkage types, hydrocarbons and their relationship with subsurface fault zones width and displacement scaling. Front. Earth Sci. 13:1460680. doi: 10.3389/feart.2025.1460680
Received: 06 July 2024; Accepted: 19 May 2025;
Published: 09 June 2025.
Edited by:
Giovanni Martinelli, National Institute of Geophysics and Volcanology, Section of Palermo, ItalyReviewed by:
Cong Luo, Hohai University, ChinaPuspendu Saha, Indian Institute of Technology Kanpur, India
Copyright © 2025 Cui, Zhang, Niu, Huang and Chen. This is an open-access article distributed under the terms of the Creative Commons Attribution License (CC BY). The use, distribution or reproduction in other forums is permitted, provided the original author(s) and the copyright owner(s) are credited and that the original publication in this journal is cited, in accordance with accepted academic practice. No use, distribution or reproduction is permitted which does not comply with these terms.
*Correspondence: Lijie Cui, bGlqaWVjdWkyMDIwQG91dGxvb2suY29t