Abstract
Reservoir description based on geostatistics requires cross well constraints (such as high-quality seismic data) to predict the quality of cross well reservoirs that conform to geological laws. However, the seismic data resolution of multiple basins or reservoirs is not sufficient to identify the distribution of different types of sand bodies. This article proposes a new method to improve the accuracy of reservoir description: reservoir modeling under the constraints of sedimentary process models and sedimentary microfacies. Using a process based forward modeling method for strata, the modeling of the Dongying Formation reservoir in Block X of Dawa Oilfield is constrained. We divide reservoir modeling into three different steps. Firstly, a sand ratio model that can reflect the macroscopic distribution of the reservoir is obtained through sedimentary simulation, The model should be able to reflect the sedimentary law of the plane and the vertical sedimentary structure on seismic data. Secondly, using the sand ratio obtained from sedimentary simulation as a constraint condition, a high-precision sand ratio prediction model is established using the sequential Gaussian simulation method based on the sand ratio data from the well. Thirdly, based on the characteristics of the sand ratio, the sand ratio model is transformed into a sedimentary microfacies model. Under the facies controlled modeling method, the porosity Modeling permeability and oil saturation. The high-resolution reservoir model indicates that the porosity, permeability, and oil saturation of distributary channels are greater than 20%, 10 × 10−3 μm2, and 50%, respectively, far higher than other types of sedimentary microfacies. The results indicate that compared with other types of sedimentation, distributary channels have better physical properties and more oil and gas accumulation in the front of the fan delta, making them the most favorable oil and gas development zone in the study area.
1 Introduction
The Overseas River Oilfield is located at the southern end of the dip zone in the central uplift of the Liaohe Depression. It is a complex fault anticline structure developed on the background of a buried hill, characterized by the Dawa and Overseas River fault zones. The overall structural pattern is controlled by ancient topography and the Dawa Fault, with strong tectonic movements forming multiple levels of faults, resulting in the formation of various structural types and fault block types in the area, and creating a good oil storage trap for oil and gas accumulation (Figure 1, The gray box in the bottom left corner of the picture is the study area). The target layer of this study is the Paleogene Dongying Formation (Figure 2), The Dongying Formation in the study area belongs to the Oligocene strata of the Paleogene. It is divided into the d3 member, the d2 member, and the d1 member from bottom to top. Among them, the d1 member is divided into 3 oil groups, with a stratum thickness of about 50–395 m. Thick massive conglomerate sandstone, glutenite, medium-fine sandstone interspersed with light gray and gray-green mudstone are mainly developed, and the overall sand ratio is relatively high, showing an unconformable contact with the overlying strata. The d2 member is divided into 4 oil groups, with a stratum thickness of about 277–385 m. Gray-green and light gray medium-fine sandstone, siltstone are mainly developed, interspersed with thin layers of gray mudstone, and the sand ratio is relatively high. The d3 member has a stratum thickness of about 80–1,100 m, and the overall performance is characterized by the lithologic combination of gray, green-gray mudstone interspersed with light gray, gray-green siltstone, and fine sandstone. The sand ratio is relatively low, and it shows an unconformable contact with the Shahejie Formation. Due to the sedimentary conditions, the facies zone on the plane is narrow and changes rapidly, the longitudinal and horizontal changes of the reservoir are large, the degree of connectivity is low, and the reservoir heterogeneity is serious (Sheng, 2008; Dong et al., 2008; Ye et al., 2009; Liu, 2014; Huang et al., 2016; Zhu et al., 2015). Therefore, how to accurately predict reservoirs has become a major bottleneck in current exploration and development.
FIGURE 1

Location map of the study area.
FIGURE 2

Stratigraphic column of the study area.
Sedimentary forward simulation can reproduce the sedimentary filling process of strata, which is a favorable tool for describing the lithological distribution of strata, and the simulation results can be used to study the reservoir distribution of sedimentary basins (Harbaugh and Bonham, 1970; Kenyon and Turcotte, 1985; Bosence and Waltham, 1990; Martinez and Harbaugh, 1993; Granjeon, 1996; Lin et al., 1995; Lin et al., 1998; Griffiths et al., 2001; Syvitski and Hutton, 2001; Plint et al., 2001; Warrlich et al., 2002; Hoy and Ridgway, 2003; Pelletier, 2004; Overeem et al., 2005; Burgess et al., 2006; Vesely et al., 2007; Hutton and Syvitski, 2008; Torra et al., 2009; Xiu et al., 2012; Csato et al., 2013; Seard et al., 2013). However, sedimentary simulation technology still has its shortcomings, because sediment simulation is based on regional sedimentary conditions and uses sediment transport equations to calculate the sediment filling process, and its simulation results often reflect a macroscopic distribution law (For example, the distribution of subfacies in sedimentary facies and the relative high and low sand ratio in a large range.), and the microscopic accuracy is often insufficient (For example, the distribution of microfacies in sedimentary facies, and the coincidence of sand ratio and logging in a specific area.), and it is difficult to fully agree with the borehole data (Cooper et al., 2018; Cloetingh and Beekman, 2015; Miller et al., 2000; Xu et al., 2012; Yin et al., 2015). The geological modeling is mainly based on the well data, according to the spatial structure characteristics of the attributes to be simulated, the geostatistical algorithm is used to interpolate the data between the wells, and the simulated results are completely consistent with the well data, but the distribution of the data between the wells has a large uncertainty, which completely depends on the pre-defined spatial structure parameter characteristics. Therefore, the two methods can complement each other, and on the basis of geostatistical modeling, the results of sedimentary forward simulation are used as the trend constraints between wells, so as to obtain a model with more accurate prediction effect. Some scholars have also carried out the use of geophysical methods to obtain reservoir physical property data (Lutome et al., 2020; Pang et al., 2019; Pang et al., 2022; Pang et al., 2024), achieving very good results. This study mainly discusses the methods of modeling and sedimentary forward modeling, and plans to conduct in-depth research on the integration of geophysics and sedimentary forward modeling in the future.
2 Data and methodology
The prediction effect of reservoir seismic data in block X of the overseas river oilfield is poor, and it is very difficult to explore and develop. At present, there are 3 wells drilled in block X, and 1 well has a good oil and gas display after test production, while the other 2 wells have no oil and gas display, and the logging shows that the reservoir is not developed, so it is necessary to clarify the distribution characteristics of the reservoir to set the target for the next exploration. In this paper, taking the Dongying Formation in Block X of Liaohe Oilfield as an example, We utilized the results of seismic inversion to analyze the vertical progradation structure characteristics of the delta. Guided by this sedimentary law, we conducted sedimentary forward modeling simulations, the sedimentary simulation and geostatistics are combined, the sedimentary simulated sand ratio is used as the constraint condition, and the sequential Gaussian simulation method is used to establish the sand ratio model in the study area, and the sedimentary microfacies model is determined according to the characteristics of the sand ratio, and the geological model of the porosity reservoir is further established under phase control, The process of this study is shown in Figure 3. Therefore, it provides a good research foundation for the next exploration and development of oilfields, and can also provide high-precision geological models for reservoir numerical simulation.
FIGURE 3

Paper flow chart.
The target interval is the Dongying Formation, with a porosity distribution range of 17.44%∼33.90%, an average value of 25.44%, and a permeability distribution range of 10∼1,300 × 10−3 μm2 (Zhang, 2021). At present, there are three wells in this block, except for well A with relatively good reservoir and good oil and gas display, the other two wells (B and C wells) have no developed reservoirs (Figure 4). From Figure 4, it can be seen that the sandstone in Well A is relatively thick, showing a curve characteristic of normal cycle, and the facies is channel; The sandstone in well B is thinner and exhibits a inverse cycle curve characteristic, indicating sedimentation at the mouth bar; The sandstone in well C is the thinnest, with only inverse cycle mouth bar. The changes from well A to well C indicate the characteristics of the delta plain to the pre delta.
FIGURE 4

Characteristics of well logging curves in Dongying strata. Well (A) features a relatively thick sand body, predominantly composed of channel deposits, while Wells (B, C) have thinner sand bodies, mainly consisting of mouth bar deposits.
In this study, we mainly combine the two methods to establish a three-dimensional high-resolution reservoir geological model.
There are many software for sedimentary orthodoxy (Csato et al., 2013), among which Dionisos was developed by the France Petroleum Research Institute and is based on nonlinear gravity and water-driven diffusion processes. The software can simulate sedimentary processes in continental and carbonate environments, and is widely used, and many scholars have carried out forward simulations of alluvial fans, alluvial plains, deltas, lakes, or oceans to carbonate platform sedimentation (Seard et al., 2013; Cloetingh and Beekman, 2015; Zhang, 2021; Caers, 2011), good results have been obtained, and Dionisos is also used to establish a sedimentary forward model. The second method is geostatistical modeling based on Gaussian stochastic simulation, i.e., the sequential Gaussian simulation method. The sequential Gauss simulation method is to calculate the conditional cumulative distribution function of each node in sequence along the random path, and then obtain an analog value from the conditional cumulative distribution function, and take the analog value together with the original data as the conditional data to simulate the next point. This process will be repeated until all points are simulated. The main input parameters of the sequential Gaussian simulation method of the two software are the same, but the RMS can more flexibly define the spatial trend of the data, such as the positive/reverse cycle, the variation of reservoir properties with the distance to the source, etc., and the RMS is used to carry out geostatistical modeling.
There are three input parameters of the Dionisos sedimentary forward model, the first is the tectonic settlement, initial water depth and lake level change parameters related to the accommodating space, which are the main controlling factors for the accommodating space change. The second is the source detrital supply parameters, including the direction and location of the source area and the lithological composition of the source, which affect the macroscopic scale of the sedimentation in space. The third is the transport mode of the water body, where different particle transport mechanisms produce different sediment morphologies, which affect the spatial distribution of the sediments. Combined with the actual geological characteristics of the construction area, five input parameters required for sedimentary forward simulation were determined: initial water depth, lake level change, structural subsidence, material supply, and sediment transport. The parameters of the runtime are described as follows:
Grid: The research area is a square area of 15 km × 15 km, and the grid size is 200 m.
Time: The start and end times of sedimentation are 36 and 35.5 Ma, respectively, with a time step of 0.0125 Ma.
Sediment type: The sediments are mainly fine sandstone and mudstone. The grain size of fine sandstone is 0.2 mm, and the grain size of mudstone is 0.05 mm.
Initial water depth: The initial average water depth is 20 m, and the initial maximum water depth is 30 m (Figure 5).
Lake level elevation: The maximum lake level change is 8 m using empirical data (Figure 6).
FIGURE 5
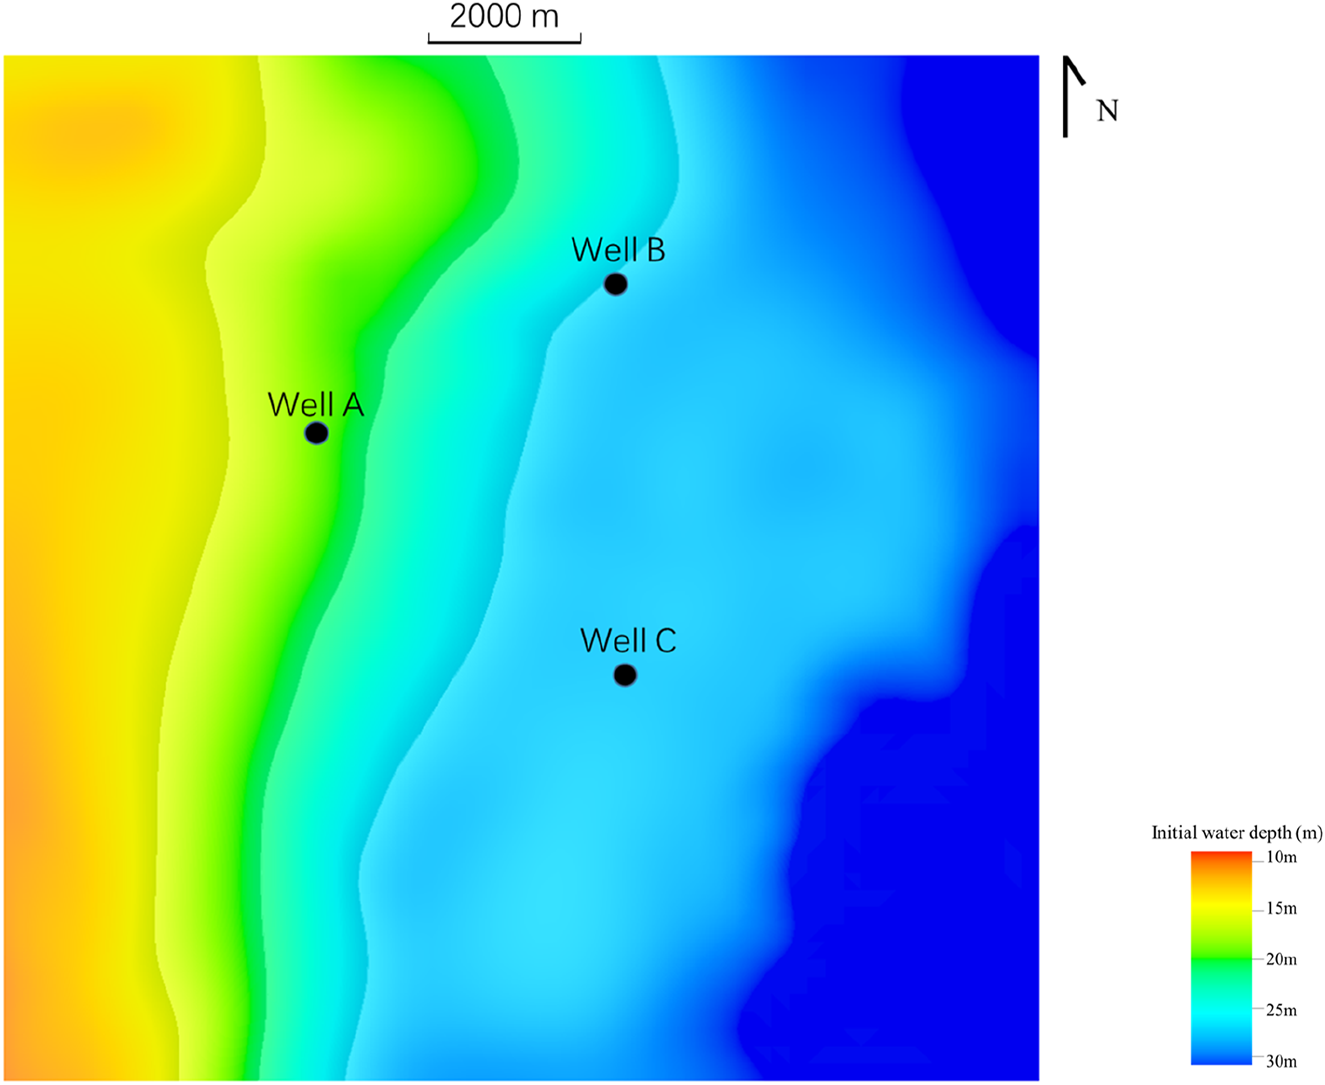
Initial water depth. The water depth gradually increases from east to west in the study area, with an initial average water depth of 20 m and an initial maximum water depth of 30 m.
FIGURE 6

Lake level change curve. The overall sedimentary period is characterized by a process of lake level lowering.
The lake level change not only affects the size of the accommodating space at a macro level, but also affects the cross-sectional structure of sedimentary bodies at a micro level. Generally, a retrogradational sedimentary structure is formed when the water body deepens, and an progradational sedimentary structure is formed when the water body becomes shallower (Yu et al., 2013a). Absolute lake level is a difficult parameter to obtain, and currently the methods used to determine lake level changes mainly rely on relative lake level (Li and Zhang, 1999; Zhao et al., 2000). Poyang Lake is the largest freshwater lake in China, with an area of approximately 3,690 square kilometers. Ouyang and Liu (2014) analyzed the characteristics of lake level changes in Poyang Lake over the past 50 years and found that its average change amplitude was 8 m. The study area also set the lake level change amplitude to 8 m and determined the water depth of the study area.
Tectonic subsidence: The subsidence inheritance in the study area is good, and the sedimentary center is consistent with the subsidence center (Cloetingh and Beekman, 2015). The structural settlement is mainly calculated based on the sedimentary thickness of the target area using the Airy equilibrium formula (Desiree et al., 2017) (Figure 7).
FIGURE 7

The settlement of the target layer in the study area. The depositional center coincides with the subsidence center, and tectonic subsidence is primarily calculated using Airy’s isostasy formula based on the sedimentary thickness of the target area (Desiree et al., 2017).
Tectonic subsidence is another major controlling factor that affects the accommodation space, and together with changes in lake level, it controls the development patterns of large sets of sedimentary sequences and their secondary sequences, as well as the sedimentary systems and lithofacies distribution of each level of sequence. During the filling and evolution process of sedimentary basins, the available space is approximately equal to the sum of sediment thickness and water depth, as well as the sum of horizontal plane and subsidence. Therefore, tectonic subsidence is equal to the thickness of the buried strata plus the change in water depth.
The tectonic subsidence in this study was mainly calculated using the Airy equilibrium formula (Yang et al., 2017), taking into account the subsidence caused by lake level rise and fall, tectonic effects, and load balancing effects. Figure 7 shows the subsidence map of the target layer, and the tectonic subsidence center in the work area coincides well with the sedimentary center. Overall, the tectonic subsidence amplitude in the eastern part of the study area is larger than that in the western part. Source supply: The area of the study area (15 km × 15 km) and the average thickness of the target layer can be used to calculate the total amount of detrital material supplied by the source. The total volume of the stratum is 12.15 km3, and the start and end times of sedimentation are 36 Ma ago and 35.5 Ma ago, respectively, and the sedimentation lasted for a total of 0.5 Ma. Therefore, the sediment supply rate is 24.3 km3/ma. Sandstone accounted for 67.8% and mudstone accounted for 32.2%.
Sediment transport: Under the premise that the total sediment volume is determined, the transport capacity of the river is related to the particle density, and the smallest concentration of detrital matter in terrestrial rivers is 0.1 g/L in mountain rivers (Cloetingh and Beekman, 2015), and the debris concentration in underwater distributary channels is generally less than 0.1 g/L, which is caused by the diffusion effect of lake water on sediment materials. Due to the relatively large source supply rate in the study area, the debris concentration was 0.13 g/L.
After the sedimentary forward simulation is completed, the simulation results can be applied to the geological modeling to obtain a high-precision 3D geological model, which includes the following steps:
(1) Establish sedimentary model: Different from Dionisos’s sedimentary model, the tectonic model established here uses the sedimentary data interpreted by seismic data, which is consistent with the tectonic characteristics observed on the earthquake and is completely consistent with the stratification data on the well. In addition, because sedimentary forward models usually simulate larger scales, while geological models model smaller scales, there is a large difference in grid size. For example, in this study, the sedimentary forward grid is set to 200*200 m, while in the geological modeling, it is set to 50*50, and the vertical direction is divided according to the grid of 1 m.
(2) The study of the structural characteristics of sedimentary parameters (variogram), which is the most important input parameter for geological modeling;
(3) The sand ratio model was established by using geostatistical methods, and the sand ratio model simulated by sedimentary forward simulation was used as the trend constraint in this process, and the well data were used for correction.
(4) According to the characteristics of different sedimentary microfacies sand ratio, the sand ratio model was further converted into a three-dimensional sedimentary microfacies model.
(5) Under the control of the sedimentary microfacies model, the porosity of the reservoir was simulated.
3 Results
3.1 Sedimentary forward simulation results
Figure 8 shows the results of the forward simulation, and the sandstone content model shows that the simulation results reflect the characteristics of the delta facies distribution well, with the delta plain being the main source end, the sand ratio is usually high, the sand ratio is lower in the delta-to-lake sedimentary direction, and the estuarine dam sedimentation is developed at the front estuarine unloading (Figure 8). However, this result is difficult to be used for oilfield development, because of the lack of detailed features, only a large area of color distribution (representing the sand ratio) can be seen in Figure 8, which represents the distribution characteristics of the sand ratio at the macro level, and the characteristics such as the shape of the reservoir around Well A at the micro level, and the extension direction, length and width are not clear.
FIGURE 8

Simulation results. It exhibits the morphological characteristics of a delta, with the sand ratio gradually decreasing from west to east, and the sedimentary facies transitioning from delta plain to prodelta.
Different from geostatistical modeling, geological modeling is essentially based on the interpolation of well data, while sedimentary forward simulation is based on process-result response, and the results of sedimentary simulation can better reflect the macroscopic laws of sediment geology, but it is difficult to be inconsistent with the measured data, as shown in Figure 9, which is also shown by the research results of many scholars (Cooper et al., 2018; Cloetingh and Beekman, 2015; Miller et al., 2000; Pardo, 1999; Xu et al., 2012; Yin et al., 2015). This error has a greater impact on the oilfield in the development stage, because the development stage has more detailed requirements for reservoir characterization. In order to overcome this shortcoming, the sand ratio parameter in the conceptual model of Figure 8 was used as a constraint on the three-dimensional trend volume to establish a geological model.
FIGURE 9

Comparison of grid parameters. The results of sedimentary simulation in terms of sand content show a high degree of agreement with the logging curves, which can better reflect the macroscopic patterns of sedimentary geology [(A): Well A, (B): Well B, (C): Well C)]
Because of the three-dimensional seismic data in this area, the macroscopic sedimentary structure of the two types of strata can be observed in section (Figure 10). According to the seismic reflection structure of Figure 10A, due to the downward trend of the water level of the target layer, the seismic reflection presents an overall progradational structure. The thickness of the sedimentary bodies gradually increases from left to right, and the area of the sedimentary bodies also gradually increases, reflecting the increasing trend of the sediment supply. Figure 10B is a simulation result, and the overall depositional structure is in good agreement with the seismic reflection. Due to the limited seismic resolution, the seismic data can only reflect the sedimentary structure, and the simulation results are on a smaller scale with more detail. The research results show that the simulation results reflect the macroscopic law of a sedimentary body but can also reflect more details than the seismic data, allowing for a better prediction of the seismic data.
FIGURE 10

Contrast diagram of the sedimentary structure in section. Both the seismic profile and the sedimentary simulation profile exhibit progradational characteristics, and the simulation results are consistent with the actual geological conditions of the work area. The figure in the lower left corner shows the location of 3 wells and seismic profile. However, since this seismic profile does not cross any well, the location and name of the well are not marked on the seismic profile. (A) Reflection structure of seismic impedance. (B) Sedimentary structure profile of the simulation (sand ratio).
3.2 Variogram
There are two types of input parameters for geological modeling: the distribution characteristics of the parameters, and the variogram. The distribution characteristics of the parameters can be obtained through the statistics of the on-hole logging data (such as the proportion of lithology, the minimum, maximum and average values of porosity), which are deterministic parameters. The variogram reflects the spatial structure information of the sand body, in which the direction of the variogram usually reflects the direction of the source, which is also a deterministic parameter, and the three parameters of the main range, the secondary range and the vertical range are mainly used to describe the spatial size information of the sand body.
The three range parameters are obtained by the statistical analysis of the variogram of the uphole data, which requires a high density of data, and the more data, the more reliable the statistical results. Since the vertical sampling of the logging data is usually high (0.125 m), the density of the data meets the statistical requirements of the variogram, and the vertical range is almost a deterministic parameter. In addition, there are only three wells in the study area, which is a relatively small number, making it difficult to determine the primary and secondary range parameters. In fact, it is sometimes difficult to obtain a suitable ariogram with relatively sufficient data (more than 10 wells), and many scholars have carried out a lot of research on how to obtain the characteristics of the uphole variogram (Pardo, 1999; Feng et al., 2005; Atkinson and Lloyd, 2007; Jin et al., 2009; Hu et al., 2014). But in any case, it is difficult to obtain a reliable variogram with too little data.
Since the variogram reflects the structural information of the sand body, it should not be limited to statistics only through the data on the well, but can be obtained through various data statistics, such as the statistics of the variability function by some scholars through the information of seismic wave impedance (Behrens et al., 1996). In this study area, although the number of wells is small, the results of sedimentary forward simulation reflect the characteristics of the sand body plane, and the characteristics of the variogram can be calculated by using the sand ratio parameter (Figure 8) of the sedimentary forward simulation.
3.3 Geological modeling constrained by sedimentary forward modeling results
Geological modeling is based on the interpolation of well data, so the more well data, the better the predictive reliability of the inter-well reservoir. There is considerable uncertainty in geological modeling when well data is scarce, and conditional constraints need to be added to improve the accuracy of well-to-well prediction. A large number of scholars have carried out research on constraint modeling, most of which focus on seismic properties to constrain geological modeling (Yao and Chopra, 2000; Wu et al., 2003; Yu et al., 2008; Yu et al., 2013b). There is a premise of seismic attribute constraint geological modeling, that is, the relevant attributes can effectively reflect the characteristics of the reservoir, but the seismic characteristics of tight sandstone reservoirs are similar to those of non-reservoirs, and the effect of seismic prediction is not good, which also brings great difficulties to the exploration and development of tight sandstone.
Fortunately, in addition to seismic data, sedimentary forward simulation can also effectively reflect the spatial distribution of reservoirs, which can be used as an effective trend condition to constrain geological modeling. Before constraining modeling, the sand ratio information of the sedimentary simulation is converted into trend condition data and normalized to 0–1. Figure 11 shows the results of constrained modeling, and compared with Figure 8, it can be found that the overall law of the constrained modeling results is consistent with the results of sedimentary simulation, and on the basis of the sedimentary simulation results, according to the description of the variogram, some sand bodies are predicted between wells, and the simulation accuracy is obviously higher, while the comparison of the data on the well is completely consistent (Figure 12).
FIGURE 11

The modeling results are based on the sedimentary forward sand ratio trend constraints. The simulation results clearly demonstrate the distribution characteristics of channels and mouth bar areas, while the continuity of the sand bodies is also more fully represented.
FIGURE 12

Comparison of the modeling results with the results of the well [(A): Well A, (B): Well B, (C): Well C)]
3.4 Facies modeling
A geological model with relatively high prediction accuracy is obtained through the geological modeling of sedimentary forward sand ratio constraints, but it is not enough to apply it to oilfield exploration and development, and oilfields often care about reservoir parameters closely related to production, such as porosity, permeability, saturation, etc. These three parameters cannot be interpolated only through geostatistical parameters. As shown in Figure 13, the porosity of the insertion value is not comparable with the sand ratio in Figure 11 at all, and there are many places with high sand ratio and low porosity. In order to reflect the geological laws in the reservoir parameter model, the facie modeling method is generally used, which is widely used in geological modeling (Grujic and Caers, 2015), that is, the reservoir parameters of different sedimentary microfacies are also different.
FIGURE 13

The porosity model calculated through geological statistical interpolation shows that compared with Figure 14, the matching degree between porosity and sand content is not high, which cannot reflect the reservoir development law in the study area.
The premise of facies modeling requires a sedimentary facies model, and the sand ratio can reflect the distribution of sedimentary facies zones, and the sand ratio is often used as a quantitative index to determine the sedimentary facies in practical work (Yu et al., 2008; Yu et al., 2013a), that is, the sedimentary microfacies can be divided by the sand ratio according to the sedimentary characteristics of the work area. Therefore, on the basis of Figure 11, combined with the sedimentary background of the study area, the sand ratio model is transformed into a sedimentary microfacies model (distributary channel, estuarine dam, far-sand dam and intertributary bay). The distribution of these microphases can be seen in Figure 14. The results show that as the delta advances to the lake basin, the channel bifurcation becomes more numerous, and the estuarine dam sedimentary sand bodies appear in the direction of the leading edge, and the sand bodies such as the far sand bar appear at the further end of the leading edge.
FIGURE 14

A sedimentary microfacies model based on the sand ratio model. As the delta advances towards the lake basin, more and more river channels bifurcate, and sedimentary sand bodies such as river mouth bars appear in the leading edge direction, while distant sand bars appear at the other end of the leading edge.
After the sedimentary facies model is obtained, the phased modeling can be carried out, the porosity model can be established, and the method of establishing the porosity model is also the sequential Gaussian simulation method, but the difference is to add the control of the sedimentary facies, that is, the distribution characteristics and variogram characteristics of the reservoir parameters according to the different sedimentary microfacies statistics. Due to the small number of wells in the study area and the variogram of reservoir parameters is not easy to obtain, this study mainly counts the variogram of sand ratio of different sedimentary microfacies for the simulation of reservoir porosity, and Table 1 is the simulation parameter table.
TABLE 1
| Sedimentary facies | Major range of variation (m) | Minor range of variation (m) |
|---|---|---|
| Channel | 3,408 | 680 |
| Channel margin | 2,122 | 421 |
| Mouth bar | 1,192 | 1,083 |
| Distal bar | 1,141 | 937 |
| Interdistributary bay | 3,933 | 3,031 |
| Prodelta | 7,145 | 5,077 |
Variogram of reservoir porosity modeling.
Figure 15 is the reservoir porosity model, the central reservoir in the study area is dominated by the distributary channel sand body, the sand body distribution area is large, and the porosity is generally more than 8%. In the eastern part of the study area, the sand content of the far sand bar and the estuarine dam near the center of the basin are more developed, and there are three main areas, and the distribution area is smaller than that of the river channel, but the porosity is better, which is more than 12%. Although the sand content and physical properties of the estuarine dam and the remote sand dam are better than those of the river channel, it can be seen from Figure 14 that the thickness of the sand body is not large, so compared with other types of sedimentary facies, the physical properties of the distributary channel are the most favorable development areas in block A.
FIGURE 15

Simulation results of porosity under phase controlled constraints (A) The porosity model is highly consistent with sedimentary facies; (B) The grid plot of porosity model a shows progradation characteristics vertically, and the spatial distribution of the reservoir matches the seismic profile in Figure 10A.
4 Discussion
As exploration and development work continues to deepen, the requirements for reservoir prediction accuracy are becoming increasingly stringent. Geologists have explored a series of effective technical means for reservoir prediction based on multidimensional information such as core samples, well logging data, and seismic data. These include seismic prediction technology, sedimentary forward modeling, reservoir modeling, and other techniques (Dodd et al., 2019; Lutome et al., 2020; Liu et al., 2020; Hu et al., 2021; Gao et al., 2020). These technologies have achieved good application results in practice, providing strong support for reservoir prediction. However, they all have certain limitations in the process of application. This paper proposes a high-precision reservoir characterization method based on sedimentary process simulation and sedimentary microfacies constraints, which can better reproduce the distribution characteristics of the reservoir.
Extensive research has been conducted on sedimentary forward modeling by predecessors, such as Yin et al. (2015), Zhang et al. (2024), and Hu et al. (2020). They used sedimentary forward modeling to recreate the delta sedimentary evolution characteristics based on lake-level changes and discussed the impact of various geological parameters on delta evolution. However, sedimentary forward modeling is only applicable in the exploration stage with limited drilling data, as it can only macroscopically demonstrate the evolution patterns of sedimentary bodies and struggles to accurately simulate sedimentary microfacies (Figure 8). In this paper, we combine sedimentary forward modeling with sequential Gaussian simulation to constrain the sedimentary microfacies using drilling data based on the macroscopic distribution patterns of deltas. This approach effectively reproduces the morphology and distribution characteristics of river channels and mouth bars (Figure 14).
Previous research in sedimentary forward modeling primarily relied on drilling data and modern depositional patterns to set simulation parameters, with the establishment of a basement, but did not consider actual seismic and drilling data (Yang H. et al., 2024; Huang et al., 2012). Zhang et al. (2024) macroscopically compared the morphological characteristics of deltas on a planar scale and found a high degree of consistency between the distribution patterns of river channels and seismic prediction results. However, they did not conduct an analysis of sedimentary profiles. In this paper, we compare the profiles of the simulation results based on seismic data (Figure 10). The seismic reflection structure aligns well with the evolution patterns of sedimentary bodies, indicating that the simulation results are more consistent with the actual geological conditions of the work area.
Currently, sedimentary modeling methods are mostly applied in the exploration phase of areas with limited drilling data, primarily used for simulating basin evolution, sedimentary systems, and facies distribution, as well as quantitatively interpreting key geological factors (Csato et al., 2013; Hu et al., 2020; Hoy and Ridgway, 2003). However, their application in the development process has not been reported. During the establishment of geological models, the distribution patterns of sand bodies in deltas exhibit extremely high complexity, and the heterogeneity of reservoirs is particularly pronounced. This complexity and heterogeneity pose significant challenges to reservoir simulation, making it difficult to accurately reproduce the true distribution characteristics of subsurface geological bodies using traditional geostatistical methods alone (as shown in Figure 13). Although multi-point geostatistics is widely used at present, it still has obvious limitations in reproducing non-stationary geological phenomena. Models generated using this method often suffer from poor continuity of sand bodies, which affects the accuracy and reliability of the models (Gao et al., 2020; Song et al., 2022). In this paper, we integrate sedimentary simulation with sequential Gaussian simulation techniques to achieve detailed characterization of subsurface reservoirs. Sedimentary simulation allows for an in-depth analysis of the distribution characteristics of sand bodies at the macro scale. On this basis, we apply the sequential Gaussian simulation method, combined with drilling data, and use the results of sedimentary simulation as key conditional constraints to construct a high-precision sand ratio prediction model. Subsequently, the sand ratio model is further transformed into a sedimentary microfacies model, achieving comprehensive characterization from the macro to the micro scale (Figure 15). This method not only effectively addresses the challenges of reproducing continuous channels using traditional geostatistical methods but also fully respects and integrates well data and seismic reflection characteristics, enhancing the accuracy and reliability of the model. The successful introduction of sedimentary simulation technology provides strong support and broad prospects for constructing more accurate and realistic geological models.
5 Conclusion
At present, China’s oil and gas exploration and development has entered the stage of unconventional reservoirs, and traditional seismic exploration is difficult to play a big role in reservoir prediction, while sedimentary forward simulation is based on sequence stratigraphy, which can simulate the sedimentary process and effectively show the spatial distribution characteristics of different lithologies, which can be used to carry out reservoir prediction of tight sandstone. However, although sedimentary forward simulation can be used as a supplement to seismic prediction, its simulation scale is usually large, resulting in insufficient prediction accuracy, and it is difficult to achieve good agreement with the well, and it is difficult to effectively apply it to oilfield development.
This paper shows that the combination of sedimentary forward modeling and geostatistical modeling can effectively overcome the above two shortcomings. During the field development phase, researchers typically apply geostatistics to quantitatively describe the distribution of reservoirs and their properties (such as porosity and permeability), as well as oil and gas saturation. However, some constraints must be added to improve the accuracy of the inter-well prediction (e.g., seismic attribute parameters). For tight sandstone reservoirs, the constraints on seismic properties are also limited, and the study confirms that the prediction results of sedimentary forward simulation can also be used to constrain geological modeling, and not only that, but it can also provide input parameters (variogram) for geostatistical modeling when well data is scarce.
In this paper, we creatively combine sedimentary forward simulation with geostatistics to establish a high-resolution model of tight sandstone reservoirs. There are two sequences in this process. Firstly, the sand ratio parameter of the sedimentary forward model was used as the constraint condition and the source data of the variogram, and the sand ratio model was established by using the geostatistical sequential Gaussian simulation method. Secondly, the sand ratio model was converted into a sedimentary microfacies model, and the three-dimensional fine models such as reservoir parameter models (porosity model, permeability model and oil saturation model) of different microfacies were established by using the idea of phased modeling and exported to the reservoir numerical simulation research software, in which the variogram characteristics of reservoir parameters were statistically obtained by the sedimentary microfacies model of sand ratio conversion.
The results show that the prediction results reflect the macroscopic law of the reservoir and the microscopic characteristics, and reveal that the favorable sand body is the distributary channel in the middle of the study area, which points out the direction for future oilfield development.
In conclusion, this method is an innovation of reservoir modeling methods, which can greatly improve the accuracy of reservoir description. It is especially suitable for oilfield exploration and development of well-less areas or low-resolution seismic data. In addition, by establishing high-resolution reservoir models, it can serve reservoir numerical simulation and oilfield development strategies.
Statements
Data availability statement
The original contributions presented in the study are included in the article/supplementary material, further inquiries can be directed to the corresponding author.
Author contributions
FZ: Conceptualization, Data curation, Formal Analysis, Funding acquisition, Investigation, Methodology, Project administration, Resources, Software, Supervision, Validation, Visualization, Writing–original draft, Writing–review and editing. HC: Methodology, Project administration, Resources, Supervision, Writing–original draft. JS: Resources, Validation, Visualization, Conceptualization, Writing–review and editing. YR: Resources, Validation, Writing–review and editing. LM: Methodology, Project administration, Resources, Writing–original draft. ZL: Investigation, Software, Supervision, Writing–original draft.
Funding
The author(s) declare that no financial support was received for the research, authorship, and/or publication of this article.
Conflict of interest
Authors FZ, HC, YR, LM, and ZL were employed by PetroChina.
The remaining author declares that the research was conducted in the absence of any commercial or financial relationships that could be construed as a potential conflict of interest.
Publisher’s note
All claims expressed in this article are solely those of the authors and do not necessarily represent those of their affiliated organizations, or those of the publisher, the editors and the reviewers. Any product that may be evaluated in this article, or claim that may be made by its manufacturer, is not guaranteed or endorsed by the publisher.
References
1
Atkinson P. M. Lloyd C. D. (2007). Non-stationary variogram models for geostatistical sampling optimisation: an empirical investigation using elevation data. Comput. Geosciences33 (10), 1285–1300. 10.1016/j.cageo.2007.05.011
2
Behrens R. A. Macleod M. K. Tran T. T. (1996). Incorporating seismic attribute maps in 3D reservoir models. SPE36499, 31–36. 10.2118/36499-PA
3
Bosence D. Waltham D. (1990). Computer modeling the internal architecture of carbonate platforms. Geology18 (1), 26–30. 10.1130/0091-7613(1990)0182.3.CO;2
4
Burgess P. M. Lammers H. Oosterhout C. V. Granjeon D. (2006). Multivariate sequence stratigraphy: tackling complexity and uncertainty with sedimentary forward modeling, multiple scenarios, and conditional frequency maps. Aapg Bull.90 (12), 1883–1901. 10.1306/06260605081
5
Caers J. (2011). Modeling uncertainty in the earth sciences. Wiley. 10.1002/9781119995920.fmatter
6
Cloetingh Z. Beekman B. Garcia C. (2015). Matenco. Tectonic models for the evolution of sedimentary basins. Treatise Geophys.6, 513–592. 10.1016/B978-0-444-53802-4.00117-2
7
Cooper M. Green K. Green A. N. Klein A. H. F. Toldo E. (2018). Late Quaternary stratigraphic evolution of the inner continental shelf in response to sea-level change. Mar. Geol.397, 1–14. 10.1016/j.margeo.2017.11.011
8
Csato I. Granjeon D. Catuneanu O. Baum G. R. (2013). A three-dimensional stratigraphic model for the Messinian crisis in the Pannonian Basin, eastern Hungary. Basin Res.25, 121–148. 10.1111/j.1365-2117.2012.00553.x
9
Desiree L. Antonio T. Olinto G. (2017). Three-dimensional stratigraphic-sedimentological forward modeling of an Aptian carbonate reservoir deposited during the sag stage in the Santos basin, Brazil. Mar. Petroleum Geol.88, 676–695. 10.1016/j.marpetgeo.2017.09.013
10
Dodd T. J. McCarthy D. J. Richards P. C. (2019). A depositional model for deep-lacustrine, partially confined, turbidite fans: early Cretaceous, North Falkland Basin. Sedimentology66 (1), 53–80. 10.1111/sed.12483
11
Dong N. Liu Z. F. Zhou X. Y. Wang J. B. Liu J. Z. Xia H. M. et al (2008). Seismic detection and prediction of tight gas reservoirs in the Ordos Basin. Oil and Gas Geol. (in Chinese)29 (5), 668–675. 10.11743/ogg20080516
12
Feng G. Q. Zhou Y. X. Li Y. Li H. Li J. N. (2005). Application of genentic algorithm to math theoretical variogram. Journal of Southwest Petroleum Institute27 (5), 23–26. 10.3863/j.issn.1674-5086.2005.05.006
13
Gao X. He W. Hu Y. (2020). Modeling of meandering river deltas based on the conditional generative adversarial network. Journal of Petroleum Science and Engineering193, 107352. 10.1016/j.petrol.2020.107352
14
Granjeon D. (1996). Modelisation stratigraphique deterministee conception et applications d'un modele diffusif 3D multilithologique (Memoires Geosciences Rennes, PhD Dissertation). Rennes: Geosciences.
15
Griffiths C. M. Dyt C. P. Paraschivoiu E. Liu K. (2001). Sedsim in hydrocarbon exploration. Geological Prior Information Informing Science and Engineering, 71–97. 10.1007/978-1-4615-1359-9_5
16
Grujic O. Caers J. (2015). Kriging unconventional production decline rate from geological and completion parameters [C]. Petroleum Geostatistics. 10.3997/2214-4609.201413601
17
Harbaugh J. W. Bonham G. (1970). Computer simulation in geology. Journal of Geology79 (3), 375. 10.1086/627636
18
Hoy R. G. Ridgway K. D. (2003). Sedimentology and sequence stratigraphy of fan-delta and river-delta deposystems, Pennsylvanian Minturn Formation, Colorado. AAPG Bull87 (7), 1169–1191. 10.1306/03110300127
19
Hu Y. He W. Guo B. (2020). Combining sedimentary forward modeling with sequential Gauss simulation for fine prediction of tight sandstone reservoir. Marine and Petroleum Geology112, 104044. 10.1016/j.marpetgeo.2019.104044
20
Hu Y. Xiao J. He W. Xiaoyang G. (2021). Application of high frequency lake level change in the prediction of tight sandstone thin reservoir by sedimentary simulation. Marine and Petroleum Geology128, 105049. 10.1016/j.marpetgeo.2021.105049
21
Hu Y. Yu X. H. Li S. L. Chen G. Y. Zhou Y. L. Gao Z. P. (2014). Applying seismic forward and backward modeling techniques to improve geological modeling accuracy. Petroleum Exploration and Development41 (02), 190–197. 10.1016/S1876-3804(14)60024-0
22
Huang X. R. Huang J. P. Sun Q. X. Cui W. (2016). Progress in seismic processing method of tight oil. Progress in Geophysics.1, 205–216. 10.6038/pg20160124
23
Hutton E. W. Syvitski J. P. (2008). Sedflux 2.0: an advanced process-response model that generates three-dimensional stratigraphy. Computers and Geosciences34 (10), 1319–1337. 10.1016/j.cageo.2008.02.013
24
Jin Y. Pan M. Yao L. Q. Ma C. (2009). On a robust variogram estimator. Acta Scientiarum Naturalium Universitatis Pekinensis45 (6), 1033–1038. 10.13209/j.0479-8023.2009.154
25
Kenyon P. M. Turcotte D. L. (1985). Morphology of a delta prograding by bulk sediment transport. Geological Society of America Bulletin96 (11), 1457. 10.1130/0016-7606(1985)962.0.CO;2
26
Li X. Zhang J. (1999). A review of sea level and sea level change. Sedimentary facies and palaeogeography19 (4), 61–72.
27
Lin C. S. (1998). Computer simulation study on two-dimensional sedimentary sequences. Acta Sedimentologica Sinica02, 68–73.
28
Lin C. S. Li S. T. Ren J. Y. (1995). Sequence architecture and depositional systems of erlian lacustrine fault basins, North China. Earth science frontiers2 (3), 124–132.
29
Liu S. Jiang Z. He Y. Dou L. Yang Y. Li Y. et al (2020). Geomorphology, lithofacies and sedimentary environment of lacustrine carbonates in the eocene dongying depression, bohai bay basin, China. Marine and Petroleum Geology113, 104125. 10.1016/j.marpetgeo.2019.104125
30
Liu Z. F. (2014). Key techniques of integrated seismic reservoir characterization for tight oil and gas sands. Progress in Geophysics.29 (1), 182–190. 10.6038/pg20140125
31
Lutome M. S. Lin C. Chunmei D. Zhang X. Harishidayat D. (2020). Seismic sedimentology of lacustrine delta-fed turbidite systems: implications for paleoenvironment reconstruction and reservoir prediction. Marine and Petroleum Geology113, 104159. 10.1016/j.marpetgeo.2019.104159
32
Martinez P. A. Harbaugh J. W. (1993). “Chapter 3 - Hydrodynamics of Waves and Nearshore Currents,”in Computer Methods in the Geosciences (Pergamon), 12, 37–78. Available online at: https://www.sciencedirect.com/science/article/abs/pii/B9780080379371500099.
33
Miller R. B. Castle J. W. Temples T. J. (2000). Deterministic and stochastic modeling of aquifer stratigraphy. South Carolina. Groundwater38(2), 284–295. 10.1111/j.1745-6584.2000.tb00339.x
34
Ouyang Z. L. Liu W. L. (2014). Variation characteristics of water level in poyang lake over 50 years. Resources and environment in the yangtze basin23 (11), 1546–1550.
35
Overeem I. Syvitski J. P. Hutton E. W. (2005). Three-dimensional numerical modeling of deltas. River Deltas-Concepts, Models, and Examples. 10.2110/pec.05.83.0011
36
Pang M. Ba J. Carcione J. M. Balcewicz M. Yue W. Saenger E. H. (2022). Acoustic and electrical properties of tight rocks: a comparative study between experiment and theory. Surveys in Geophysics43, 1761–1791. 10.1007/s10712-022-09730-3
37
Pang M. Ba J. Carcione J. M. Picotti S. Zhou J. Jiang R. (2019). Estimation of porosity and fluid saturation in carbonates from rock-physics templates based on seismic Q. Geophysics84 (6), 25–36. 10.1190/geo2019-0031.1
38
Pang M. Ba J. Carcione J. M. Saenger E. H. (2024). Combined acoustical-electrical modeling for tight sandstones verified by laboratory measurements. International Journal of Rock Mechanics and Mining Sciences176, 105682. 10.1016/j.ijrmms.2024.105682
39
Pardo I. E. (1999). VARFIT: a fortran-77 program for fitting variogram models by weighted least squares. Computers and Geosciences25 (3), 251–261. 10.1016/s0098-3004(98)00128-9
40
Pelletier J. D. (2004). Persistent drainage migration in a numerical landscape evolution model. Geophysical Research Letters31 (20), 379–398. 10.1029/2004gl020802
41
Plint A. G. Mccarthy P. J. Faccini U. F. (2001). Nonmarine sequence stratigraphy: updip expression of sequence boundaries and systems tracts in a high-resolution framework, cenomanian dunvegan formation, alberta foreland basin. Canada: AAPG Bulletin. 10.1306/8626D0C7-173B-11D7-8645000102C1865D
42
Seard C. Borgomano J. Granjeon D. Camoin G. Riegl B. (2013). Impact of environmental parameters on coral reef development and drowning: forward modelling of the last deglacial reefs from Tahiti (French Polynesia; IODP Expedition #310). Sedimentology60 (6), 1357–1388. 10.1111/sed.12030
43
Sheng F. (2008). Application of seismic rockphysics and forward simulation in predicting tight sand-stone reservoirs. Journal of Oil and Gas Technology30 (6), 61–65.
44
Song S. Shi Y. Hou J. (2022). Review of a generative adversarial networks (GANs)-based geomodelling method. Petroleum Science Bulletin01, 34–49. 10.3969/j.issn.2096-1693.2022.01.004
45
Syvitski J. P. Hutton E. W. (2001). 2D SEDFLUX 1.0C: an advanced process-response numerical model for the fill of marine sedimentary basins. Computers and Geosciences27 (6), 731–753. 10.1016/s0098-3004(00)00139-4
46
Torra O. G. Bitzer K. Cabrera L. Roca E. (2009). SIMSAFADIM-CLASTIC: a new approach to mathematical 3D forward simulation modeling for terrigenous and carbonate marine sedimentation. Geol. Acta7, 311–322. 10.1344/105.000001390
47
Vesely F. Rostirolla S. P. Appi C. J. Kraft R. P. (2007). Late Paleozoic glacially related sandstone reservoirs in the Paraná Basin, Brazil. Aapg Bulletin91 (2), 151–160. 10.1306/09250605085
48
Warrlich G. M. Waltham D. A. Bosence D. W. (2002). Quantifying the sequence stratigraphy and drowning mechanisms of atolls using a new 3-D forward stratigraphic modelling program (CARBONATE 3D). Basin Res.14 (3), 379–400. 10.1046/j.1365-2117.2002.00181.x
49
Wu S. Liu Y. Fan Z. Su M. C. Yin W. Zhang G. M. et al (2003). 3D Stochastic modeling of sedimentary microfacies with geological and seismic data. Journal of Palaeogeography (04), 439–449. 10.1007/BF02873153
50
Xiu H. Dyt C. Griffiths C. Salles T. (2012). Numerical forward modelling of ‘fluxoturbidite’ flume experiments using Sedsim. Marine and Petroleum Geology35(1), 190–200. 10.1016/j.marpetgeo.2012.02.012
51
Xiu H. Dyt C. Griffiths C. Salles T. (2012). Numerical forward modelling of 'fluxoturbidite' flume experiments using SEDSIM. Geol.35, 190–200. 10.1016/j.marpetgeo.2012.02.012
52
Xu G. Zhao L. Xu F. Zhang T. Zhao X. B. et al (2012). Seepage characteristics of a tight sandstone reservoir in the Huagang Formation of a certain structure in the Xihu Depression. Journal of Chengdu University of Technology39 (02), 113–121.
53
Yang H. L. Zhang Q. Q. Heng L. Q. Wang J. Liu T. X. (2024). Simulation of sedimentary spatiotemporal evolution of wave-dominated delta of the miocene zhujiang Formation in north-central pearl river mouth basin. Marine origin petroleum geology29 (3), 291–302. 10.3969/j.issn.1672-9854.2024.03.007
54
Yang N. Li G. Li T. Zhao D. F. Gu W. W. (2024). An improved deep dilated convolutional neural network for seismic facies interpretation. Petroleum Science21 (3), 1569–1583. 10.1016/j.petsci.2023.11.027
55
Yang W. Wang Y. Zhang Z. Liang C. Li J. (2017). A three-dimensional numerical sedimentary simulation model for the lower-middle ordovician of shunnan area, tarim basin. Acta sedimentologica sinica35 (1), 117–123. 10.14027/j.cnki.cjxb.2017.01.012
56
Yao T. Chopra A. (2000). Integration of seismic attribute map into 3D facies modeling. Journal of Petroleum Science and Engineering27 (1/2), 69–84. 10.1016/s0920-4105(00)00048-6
57
Ye T. Fu S. Lv Q. Lai W. R. (2009). Application of multi-wave joint inversion to the prediction of relatively high-quality reservoirs: an example from the prediction of deep tight clastic sandstone reservoirs in the western Sichuan Basin. Oil and Gas Geology30 (3), 357–362. 10.11743/ogg20090315
58
Yin X. Huang W. Wang P. Wang J. Wang Q. Yan D. (2015). Sedimentary evolution of overlapped sand bodies in terrestrial faulted lacustrine basin: insights from 3D stratigraphic forward modeling. Marine and Petroleum Geology, 141–1413. 10.1016/j.marpetgeo.2015.09.010
59
Yu X. Li S. Li S. (2013a). The structure of delta sediments: genetic classification and mapping methods. Acta Sedimentologica Sinica31 (05), 782–797.
60
Yu X. Li S. Li Sh. (2013b). Texture-genetic classifications and mapping methods for deltaic deposits. Acta sedimentologica sinica31 (5), 782–797.
61
Yu X. Li S. Zhao S. Chen J. Y. Hou G. W. (2008). The constraining method on stochastic modeling for fluvial petroleum reservoir controlled by depositional facies integrating wells with seismic data. Earth Science Frontiers70 (04), 33–41. 10.3321/j.issn:1005-2321.2008.04.005
62
Zhang X. Z. (2021). Research on profile control and water blocking technology in high water cut blocks of Overseas River Oilfield. China Petroleum and Chemical Standard and Quality41 (08). 10.3969/j.issn.1673-4076.2021.08.092
63
Zhang X. Li J. Wang L. Liu C. Hu Y. (2024). Influence of Silurian shale detachment on the structural style of the Dabashan Foreland Thrust Belt-based on physical simulation. Geotectonica et Metallogenia, 48 (04), 698–708.
64
Zhao Y. Liu B. Xu X. (2000). Mathematical modelof sea_level change curves in geological history. Earth Science25 (2), 117–121. 10.3321/j.issn:1000-2383.2000.02.002
65
Zhu C. Xia Z. Y. Wang C. W. Song G. Y. Wei X. B. Wang P. et al (2015). Seismic prediction for sweet spot reservoir of tight oil. Journal of Jilin University (Earth Science Edition).45 (2), 602–610. 10.13278/j.cnki.jjuese.201502302
Summary
Keywords
tight sandstone, high quality reservoir, sedimentary simulation, seismic sedimentology, forward, sedimentary evolution, sequence stratigraphy
Citation
Zuochun F, Changhao H, Shu J, Rui Y, Man L and Lintian Z (2025) Improving the accuracy of geological models and seismic sedimentology using sedimentary forward modeling. Front. Earth Sci. 13:1494273. doi: 10.3389/feart.2025.1494273
Received
10 September 2024
Accepted
22 January 2025
Published
06 May 2025
Volume
13 - 2025
Edited by
Dicky Harishidayat, Pertamina Hulu Energi, Indonesia
Reviewed by
Ilyas Anindita, Eni Indonesia, Indonesia
Mengqiang Pang, Hohai University, China
Updates
Copyright
© 2025 Zuochun, Changhao, Shu, Rui, Man and Lintian.
This is an open-access article distributed under the terms of the Creative Commons Attribution License (CC BY). The use, distribution or reproduction in other forums is permitted, provided the original author(s) and the copyright owner(s) are credited and that the original publication in this journal is cited, in accordance with accepted academic practice. No use, distribution or reproduction is permitted which does not comply with these terms.
*Correspondence: Fan Zuochun, 884570830@qq.com
Disclaimer
All claims expressed in this article are solely those of the authors and do not necessarily represent those of their affiliated organizations, or those of the publisher, the editors and the reviewers. Any product that may be evaluated in this article or claim that may be made by its manufacturer is not guaranteed or endorsed by the publisher.