 Shuguang Miao1,2
 Xiang Liu
- 1School of Physics and Electronic Information, Huaibei Normal University, Huaibei, China
- 2Anhui Province Key Laboratory of Intelligent Computing and Applications, Huaibei Normal University, Huaibei, China
- 3School of Information and Control Engineering, China University of Mining and Technology, Xuzhou, China
- 4IOT Perception Mine Research Center, China University of Mining and Technology, Xuzhou, Jiangsu, China
The traditional coal type identification method needs to measure a variety of parameters of coal samples to obtain more accurate results, and the detection process is time-consuming and laborious, and can not realize the rapid identification of coal types. In this paper, a bituminous coal species identification method based on terahertz time-domain spectroscopy combined with machine learning-principal component analysis Principal component analysis (PCA) and cluster analysis (CA) was proposed. The two types of bituminous coal samples were detected by the transmission terahertz time-domain spectroscopy system, and the spectral data of various bituminous coal samples were obtained, and then the absorption coefficient and refractive index of each sample were obtained after mathematical calculations such as fast Fourier transform (FFT). The results show that the PCA-CA classification model based on terahertz absorption coefficient spectrum can accurately identify different bituminous coals with an accuracy of 100%, while the PCA-CA classification model based on refractive index spectra cannot accurately identify different bituminous coals. The results show that the terahertz time-domain spectroscopy combined with machine learning algorithm can accurately identify different kinds of bituminous coal, and the model classification effect based on terahertz absorption coefficient spectrum is better than that of the model based on refractive index spectroscopy, which provides a new idea for coal mining and utilization.
1 Introduction
Coal is one of the most important energy sources in China, and for a long time, it has accounted for about 75% and 70% of China’s primary energy production and consumption structure. In recent years, although the proportion of coal consumption has gradually decreased, China’s energy structure of “rich in coal, poor in oil, and low in gas” determines that the status of coal as the main energy source will not change fundamentally in the short term, and coal will still be the stabilizer and ballast stone of China’s energy security (Liang et al., 2021). There are many types of coal resources in China, and according to the degree of coalification of coal, coal can be roughly divided into three categories, namely, lignite, bituminous coal and anthracite. In the process of coal mining and use, the classification of bituminous coal has important guiding significance for production planning (Wang et al., 2022). Although the chemical analysis method has high classification accuracy, the detection time is long and the cost is high, and the above two methods cannot achieve fast and accurate identification of coal types, so how to accurately and quickly identify the types of bituminous coal is an urgent problem to be solved in coal mining and utilization.
In recent years, with the rapid development of terahertz technology, terahertz technology has shown great application prospects in the fields of substance identification (Zhao et al., 2023; Jie et al., 2023) and nondestructive testing (Li and He, 2023; Cao and Yuan, 2021). Terahertz wave refers to the electromagnetic wave with a frequency of 0.1 THz∼10 THz and a wavelength of 0.03 mm∼3 mm, which is located between microwave and infrared light in the electromagnetic spectrum. In recent years, some new methods have been proposed by scholars at home and abroad in the field of coal identification, mainly focusing on the field of spectroscopy, such as near-infrared spectroscopy analysis and laser-induced breakdown spectroscopy. Xiao et al. (2020) used visible-near-infrared spectroscopy combined with improved local receptive field extreme learning machine algorithm to identify anthracite, bituminous coal, lignite and coal gangue. Hong et al. (2022) used near-infrared spectroscopy combined with Fisher-stepwise discriminant analysis to identify different coal species. Song et al. (2017) used visible-near-infrared spectroscopy technology combined with different algorithms to classify bituminous coal and lignite, and the results showed that the random forest method and the MAO model method had better classification effects, and thus proposed different application scenarios of the two algorithms. Le et al. (2018) used visible-near-infrared spectroscopy technology and deep learning CNN-ELM algorithm to classify and identify anthracite, bituminous coal, and lignite. Yang et al. (2019) studied the reflectance spectral characteristics of typical lump coal in the visible-near-infrared band, and determined the element content, fixed carbon content and ash content in the samples through X-ray fluorescence (XRF) analysis and industrial analysis. Petrovic et al. (2022) studied the quantitative detection of inorganic elements in lignite using LIBS technology based on TEA carbon dioxide laser, and verified that the detection of coal by LIBS can control the coal burning process of power plants. Zhang et al. (2017a) used the combination of LIBS technology and independent component analysis-wavelet neural network (ICA-WNN) for coal classification research, and compared the effect of artificial neural network (ANN) model on coal sample identification and classification, the ICA-WNN model showed better classification effect. The above studies mainly focus on the classification and identification of three major types of coal (anthracite, bituminous coal and lignite) in China, and there are few studies on the classification and identification of different types of bituminous coal.
In this study, terahertz time-domain spectroscopy and two machine learning algorithms were used to qualitatively identify different types of bituminous coal, in order to explore an accurate and rapid method for identifying bituminous coal.
2 Materials and methods
2.1 Sample preparation
The five bituminous coal samples selected in the experiment were low volatile bituminous coal (ZBM104, ZBM100D, ZBM100E, ZBM124) and medium and high volatile bituminous coal (ZBM111C). The five bituminous coal samples are all coal reference materials, all of which were purchased from the National Material Standards Network, and their physical properties and chemical compositions are provided by the National Material Center. The physical properties and chemical compositions of the five bituminous coal samples are shown in Table 1.
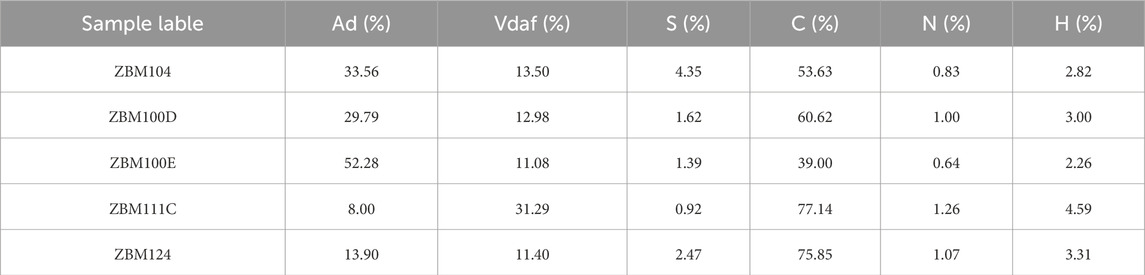
Table 1. Labeling and parameters of bituminous coal samples.
A certain quality of sample powder was weighed before the test, and then high-density polyethylene powder is added in the same ratio and the two are thoroughly mixed, the ratio is polyethylene powder: sample powder = 2:1. When the powder is weighed with a certain quality of mixture, the pressure of the tablet press is set to 10 MPa, and the tablet pressing time is set to 6 min, and finally the disc test tablet with a thickness of about 1.1 mm and the upper and lower surfaces are parallel without cracks.
2.2 Terahertz spectroscopy
In this study, the bituminous coal samples were detected using the TAS7400SU THz-TDS system of Advantest in Japan, which can choose the transmission and reflection modes, and the transmission mode was selected in this study (Chen et al., 2021), the spectral measurement range of the system is 0.5–7 THz, the spectral resolution is 7.6 GHz, and the dynamic peak frequency range is greater than 57 dB. The system is mainly composed of femtosecond lasers, terahertz emitters, terahertz detectors and time-lapse systems. In order to reduce the experimental error, the experimental samples were detected in the environment with an ambient temperature of 24°C, and the sample signal was averaged after repeated measurements for each sample for 3 times, and the air humidity in the optical path part was kept below 1% RH. The operating principle of the system is roughly shown in Figure 1.
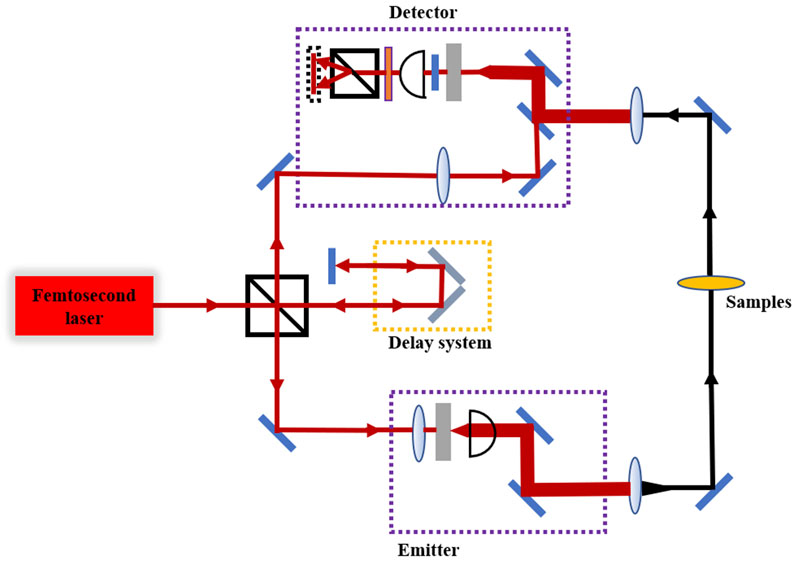
Figure 1. Structure diagram of terahertz time-domain spectroscopy system.
2.3 Optical parameter extraction
After obtaining the terahertz spectral data of various samples by detecting coal samples, the refractive index
where,
2.4 Introduction to algorithms
Principal component analysis (PCA) (Esteki et al., 2023) is a commonly used feature extraction method and is often used in spectroscopic analysis. Taking the original dataset as input, multiple potentially related variables in the original data are transformed into fewer completely unrelated new variables through orthogonal linear transformation, which is called principal components. Each principal component is orthogonal to each other, and the first principal component contains most of the information in the original data, which can interpret the original data to the greatest extent and display a large amount of data in the original data in a more intuitive form (Zhang et al., 2017b).
Cluster analysis (CA) (Cheng et al., 2021) is an unsupervised classification method that classifies samples in an unlabeled dataset by measuring the similarity between them. In the clustering process, the dataset does not need to be labeled in advance, each sample is taken as a separate class before the calculation begins, by calculating the Euclidean distance between each sample, the two samples that are closest to each other are taken as a new class, then the Euclidean distance between the new class and other samples is calculated, the samples closest to the new class are combined with the new class to form a class, and the above calculation is repeated, and finally all samples are clustered into a class to obtain a cluster tree diagram that can reflect the similarity and heterogeneity between the samples.
3 Results and discussion
3.1 Terahertz time-domain spectroscopy
The terahertz time-domain spectra of the five bituminous coal samples are shown in Figure 2a. As can be seen from the figure, the time delay and peak intensity of various bituminous coal samples are different, and the time delay of each sample is concentrated in the range of 17–19 ps. The time-domain spectral waveforms of the four low-volatile bituminous coal ZBM100D, ZBM100E, ZBM104 and ZBMZ124 are very similar, and the main time-delay peak of the ZBM100E appears earliest and has the smallest amplitude. The main peak appeared at 18.05 s with an amplitude of 0.053 V, the main peak of ZBM124 appeared the latest, and the main peak appeared at 18.29 s with an amplitude of 0.058 V. Compared with the four low-volatile bituminous coals, the main peak of ZBM111C appeared earliest and had the largest amplitude at 17.82 s with an amplitude of 0.118 V. Since the refraction and absorption of terahertz waves are not the same in the samples, the time delay and peak intensity of the various coal samples varies. Figure 2a shows the power spectra of the five samples in the frequency range of 0.5–3 THz, and it can be seen that the power spectra of the five samples maintain the same trend, and all of them show that the energy consumption increases first and then decreases with the increase of frequency, among which the energy consumption of ZBM111C is the largest, and the energy consumption of ZBM100D, ZBM100E, ZBM104 and ZBMZ124 is lower than that of ZBM111C. Figures 2a, b show that there are obvious differences in the terahertz time-domain spectrum and power spectrum of various samples, which indicates that it is feasible to qualitatively identify bituminous coal by using terahertz time-domain spectroscopy.
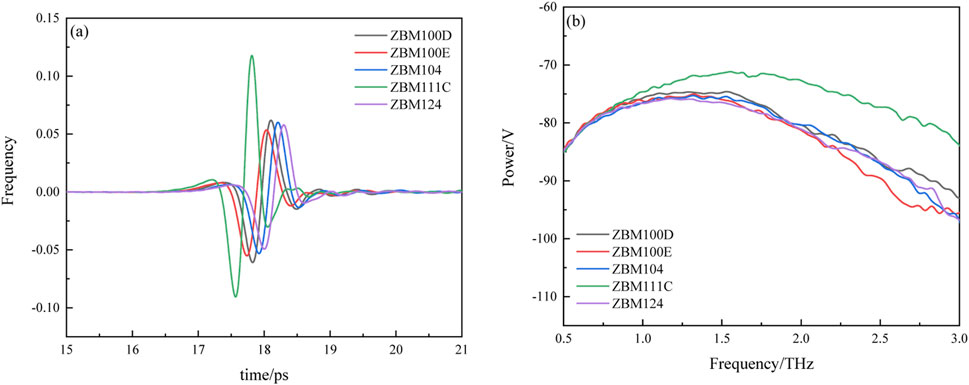
Figure 2. Terahertz time domain spectrum (a) and power spectrum (b).
Figure 3 shows the refractive index spectra and absorption coefficient spectra of the five bituminous coal samples in the 0.5–3 THz band. Where the refractive index is given by Equation 1 and the absorption coefficient is given by Equations 2, 3. It was observed that the five coal samples had a certain separability in the terahertz refractive index and dielectric constant spectra. In the refractive index spectrum of Figure 3a, the refractive index of the ZBM111C is the largest, with an average refractive index of 1.537, and the refractive indices of ZBM124, ZBM104, ZBM100E, and ZBM100D decrease sequentially, with the average refractive indices of 1.524, 1.522, 1.491, and 1.469, respectively, all lower than ZBM111C. There are obvious differences in the refractive index spectra of the five bituminous coals, and it can be seen that the refractive index spectra of terahertz can be used to preliminarily calibrate different types of bituminous coals. In Figure 3b absorption coefficient spectrum, it can be seen that the absorption coefficient spectrum of the five bituminous coals has no obvious characteristic absorption peaks, which may be due to the complex chemical composition of the coal, which causes the absorption peaks to cancel each other out due to the overlap of the positions, and the absorption coefficients all increase with the increase of frequency, which is consistent with the propagation law of electromagnetic waves in the lossy medium in the classical electromagnetic wave theory, among which the absorption coefficient of the ZBM111C is the smallest, and the four low-volatile bituminous coals ZBM124, ZBM104, The absorption coefficients of ZBM100E and ZBM100D are higher than those of ZBM111C, and the feasibility of using terahertz time-domain spectroscopy to identify bituminous coal types is further illustrated by the analysis of refractive index spectra and absorption coefficient spectra.
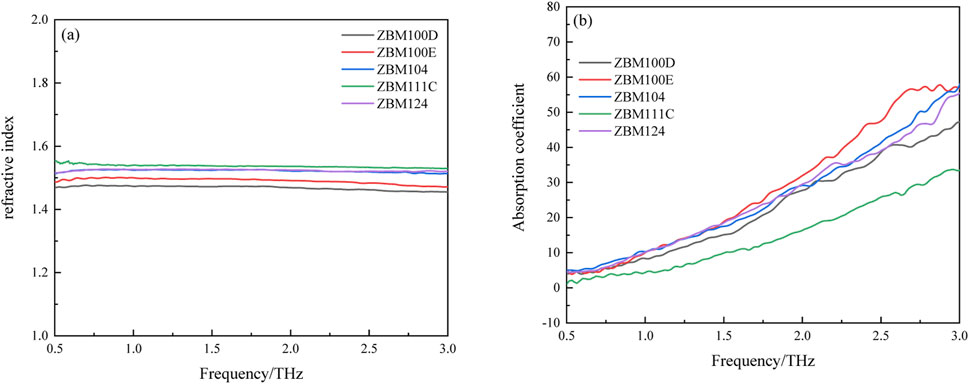
Figure 3. Terahertz refractive index spectra (a) and absorption coefficient spectra (b).
3.2 Classification of coal types
According to the original spectra of the collected bituminous coal samples, cluster analysis and principal component analysis were used to identify and classify the five bituminous coal samples. Figure 4a uses the absorption coefficient spectra in the frequency range of 0.5-3 THz as the input set, and uses cluster analysis to classify the five samples, and the cluster tree map reflecting the similarity and dissimilarity of the five samples is obtained after four steps of gradual clustering. As can be seen from the figure, when the Euclidean distance is 120, the five samples are divided into two categories: the ZBM111C is divided into one category alone, and the remaining four samples (ZBM104, ZBM124, ZBM100D, ZBM100E) are divided into the second category, where the Euclidean distance between ZBM104 and ZBM124 is the smallest, is 30.04, the Euclidean distance between ZBM100D and the new class composed of ZBM104 and ZBM124 increases slightly, to 63.43, and the ZBM100E gradually increases, and finally the four samples are clustered into a class.
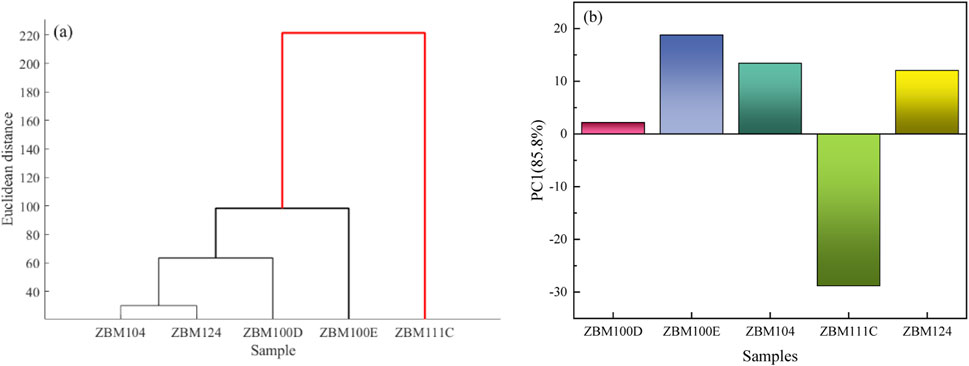
Figure 4. Cluster tree diagram (a) and PC1 score histogram (b) based on absorption coefficient spectrum.
The absorption coefficient spectrum in the frequency range of 0.5–3 THz was used as the input set for principal component analysis, and the first two principal components (PC1, PC2) were extracted, and the cumulative contribution rate of the first two principal components was 96.8%, of which the contribution rate of the first principal component was 85.8%, and the contribution rate of the second principal component was 11%, and the PC1 of each sample basically contained most of the original information of the sample. The smaller the PC1 difference between samples, the more similar the samples are. The greater the difference, the greater the variability between samples. Figure 4b shows the PC1 scores of the five samples, from which it can be seen that the PC1 score of ZBM111C is negative, which is the most different from the other four bituminous coals. The difference between PC1 between ZBM104 and ZBM124 is the smallest, and the conclusion of PCA is consistent with that of CA compared with the cluster tree diagram in Figure 4a, which shows that the PCA-CA classification model based on the absorption coefficient spectrum can accurately identify different types of bituminous coal with a recognition accuracy of 100%.
Similarly, the refractive index spectrum in the frequency range of 0.5–3 THz is used as the input set, and the cluster tree diagram obtained by cluster analysis is shown in Figure 5a. As can be seen from the figure, when the Euclidean distance is 0.5, the five samples are divided into two categories: ZBM104, ZBM124 and ZBM111C are divided into the first category, and ZBM100D and ZBM100E are divided into the second category, where the Euclidean distance between ZBM104 and ZBM124 is the smallest, The Euclidean distance is 0.049, followed by 0.27 between the new class and the ZBM111C, and finally the three coals form the first class, and the Euclidean distance between the ZBM100D and the ZBM100E is the largest, which is 0.41, and these two form the second class.
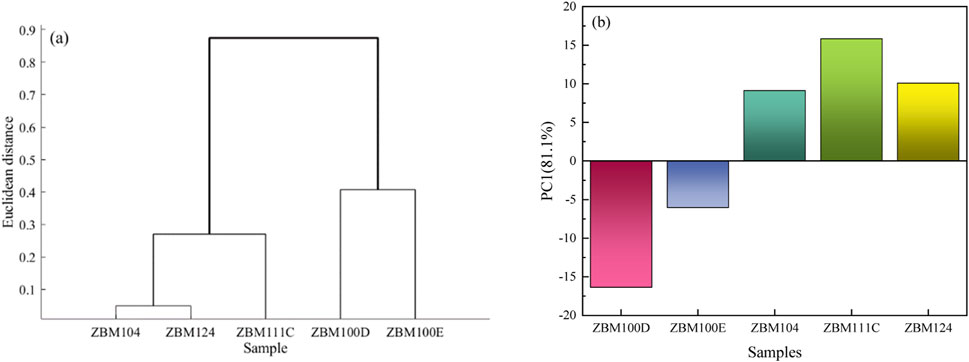
Figure 5. Clustering tree diagram (a) and PC1 score histogram (b) based on refractive index spectrum.
The first two principal components were extracted with the input set of the refractive index spectrum in the frequency range of 0.5–3 THz. The cumulative contribution rate of the first two principal components was 99.89%, and the contribution rate of the first principal component was 81.1%. Figure 5b shows the PC1 score histogram of five coal samples. It can be seen from the figure that the PC1 score histogram of ZBM104, ZBM111C and ZBM124 are all positive, while the PC1 score histogram of ZBM100D and ZBM100E are all negative. Compared with the clustering tree diagram of Figure 5a, it can be seen that this conclusion is consistent with the CA conclusion. It can be concluded that the PCA-CA classification model based on refractive index spectrum can not achieve accurate identification of different types of bituminous coal.
4 Conclusion
In this experiment, five samples of two types of bituminous coal (low volatile bituminous coal and medium and high volatile bituminous coal) were used as research objects, and the terahertz time-domain spectroscopy technology combined with machine learning algorithm was used to qualitatively identify the types of bituminous coal. The results show that there are certain differences in the time-domain spectra of the five bituminous coal samples, which illustrates the feasibility of qualitative identification of different bituminous coal species by using terahertz time-domain spectroscopy. In the frequency range of 0.5–3 THz, the PCA-CA classification model was established by using the refractive index spectra and absorption coefficient spectra of five samples, and by comparing the classification effects of the two, it can be concluded that the PCA-CA classification model based on the terahertz absorption coefficient spectrum is better than the classification model based on the refractive index spectrum, and the PCA-CA classification model based on the terahertz absorption coefficient spectrum can accurately identify the two types of bituminous coal, and the recognition accuracy is 100%. Compared with the traditional coal identification methods, the terahertz time-domain spectroscopy technology combined with the PCA-CA classification model proposed in this study can quickly and accurately identify different types of bituminous coal, which is of great significance for the construction of intelligent mines.
Data availability statement
The original contributions presented in the study are included in the article/Supplementary Material, further inquiries can be directed to the corresponding author.
Author contributions
SM: Funding acquisition, Writing – review and editing. XL: Methodology, Validation, Visualization, Writing – original draft. YZ: Investigation, Writing – review and editing. Suwen SL: Funding acquisition, Resources, Writing – review and editing. ED: Resources, Writing – review and editing.
Funding
The author(s) declare that financial support was received for the research and/or publication of this article. This work was supported by the financial support of the National Natural Science Foundation of China under Grant 52074273, the Key Natural Science Research Project for Colleges and Universities of Anhui Province under Grant 2023AH05034, the Pollutant Sensitivity Monitoring and Application Innovation Team of Anhui Province under Grant 2023AH010043, Anhui Provincial Department of Education Quality Engineering Project under Grant 2022jyxm1405.
Conflict of interest
The authors declare that the research was conducted in the absence of any commercial or financial relationships that could be construed as a potential conflict of interest.
Generative AI statement
The author(s) declare that no Generative AI was used in the creation of this manuscript.
Publisher’s note
All claims expressed in this article are solely those of the authors and do not necessarily represent those of their affiliated organizations, or those of the publisher, the editors and the reviewers. Any product that may be evaluated in this article, or claim that may be made by its manufacturer, is not guaranteed or endorsed by the publisher.
Supplementary material
The Supplementary Material for this article can be found online at: https://www.frontiersin.org/articles/10.3389/feart.2025.1503835/full#supplementary-material
References
Cao, J., and Yuan, Y. (2021). Detection of electrode coating quality of lithium battery based on terahertz technology. Opt. Instrum. 43 (5), 1–6. doi:10.3969/j.issn.1005-5630.2021.05.001
Chen, M., He, M., and Li, M. (2021). Application of interval selection methods in quantitative analysis of water content in engine oil by terahertz spectroscopy. Spectrosc. Spectr. Analysis 41 (5), 1393–1397. doi:10.3964/j.issn.1000-0593(2021)05-1393-05
Cheng, Y., Jia, W., and Chi, R. (2021). A clustering analysis method with high reliability based on Wilcoxon-Mann-Whitney testing. IEEE Access 9, 19776–19787. doi:10.1109/access.2021.3053244
Dorney, T. D., Baraniuk, R. G., and Mittleman, D. M. (2001). Material parameter estimation with terahertz time-domain spectroscopy. Opt. Soc. Am. A 18 (7), 1562–1571. doi:10.1364/josaa.18.001562
Esteki, M., Memarbashi, N., and Simal-Gandara, J. (2023). Classification and authentication of tea according to their harvest season based on FT-IR fingerprinting using pattern recognition methods. J. Food Compos. Analysis 115, 104995. doi:10.1016/j.jfca.2022.104995
Hong, Z., Yan, C., and Min, H. (2022). Research on coal species identification based on near-infrared spectroscopy and discriminant analysis. Spectrosc. Spectr. Analysis 42 (9), 2800–2806. doi:10.3964/j.issn.1000-0593(2022)09-2800-07
Jie, Z., Zhou, S., and Wang, J. (2023). Identification on adulteration of rice seeds by terahertz time-domain spectroscopy based on multi feature algorithm selection. J. Instrum. Analysis 42 (2), 158–165. doi:10.19969/j.fxcsxb.22091602
Le, B., Xiao, D., and Mao, Y. (2018). Coal classification based on visible, near-infrared spectroscopy and I CNN-ELM algorithms. Spectrosc. Spectr. Analysis 38 (7), 2107–2112. doi:10.3964/j.issn.1000-0593(2018)07-2107-06
Li, Q., and He, M. (2023). Application of terahertz spectroscopy in porosity detection of polyolefin films. Laser and Optoelectron. Prog. 60 (9), 456–462. doi:10.3788/LOP221114
Liang, Z., Ye, X., and Zhao, G. (2021). China's energy security situation and measures to promote coal to ensure energy supply. Coal Econ. Res. 41 (11), 9–13. doi:10.13202/j.cnki.cer.2021.11.006
Petrovic, J., Savovic, J., Rankovic, D., and Kuzmanovic, M. (2022). Quantitative analysis of coal by laser-induced breakdown spectroscopy using TEA CO2 laser as the excitation source. Plasma Chem. Plasma Process. 42 (3), 519–533. doi:10.1007/s11090-022-10234-6
Song, L., Liu, S., and Mao, Y. (2017). Coal classification based on visible and near-infrared spectrum. J. Northeast. Univ. Sci. 38 (10), 1473–1476. doi:10.12068/j.issn.1005-3026.2017.10.021
Wang, G., Pang, Y., and Ren, H. (2022). Challenges and reflections on intelligent construction of mines. Intell. Mine 3 (10), 2–15.
Xiao, D., Li, H., and Sun, X. (2020). Coal classification method based on improved local receptive field-based extreme learning machine algorithm and visible–infrared spectroscopy. ACS Omega 5 (40), 25772–25783. doi:10.1021/acsomega.0c03069
Yang, E., Wang, S., and Ge, S. (2019). Visible-near-infrared spectroscopic characteristics of typical lump coals. Spectrosc. Spectr. Analysis 39 (06), 1717–1723. doi:10.3964/j.issn.1000-0593(2019)06-1717-07
Zhang, T., Yan, C., Qi, J., Tang, H., and Li, H. (2017a). Classification and discrimination of coal ash by laser-induced breakdown spectroscopy (LIBS) coupled with advanced chemometric methods. J. Anal. Atomic Spectrom. 32 (10), 1960–1965. doi:10.1039/c7ja00218a
Zhang, W., Li, Y., and Zhan, P. (2017b). Recognition of transgenic soybean oil based on terahertz time-domain spectroscopy and PCA-SVM. Infrared Laser Eng. 46 (11), 159–164. doi:10.3788/IRLA201746.1125004
Keywords: bituminous coal identification, terahertz spectroscopy, machine Learning, principal component analysis, cluster analysis
Citation: Miao S, Liu X, Zhang Y, Li S and Ding E (2025) Research on identification method of bituminous coal based on terahertz time-domain spectroscopy. Front. Earth Sci. 13:1503835. doi: 10.3389/feart.2025.1503835
Received: 29 September 2024; Accepted: 24 March 2025;
Published: 11 April 2025.
Edited by:
Lei Ni, Nanjing Tech University, ChinaReviewed by:
Sen Li, Chinese Academy of Sciences (CAS), ChinaShiyong Wu, East China University of Science and Technology, China
Copyright © 2025 Miao, Liu, Zhang, Li and Ding. This is an open-access article distributed under the terms of the Creative Commons Attribution License (CC BY). The use, distribution or reproduction in other forums is permitted, provided the original author(s) and the copyright owner(s) are credited and that the original publication in this journal is cited, in accordance with accepted academic practice. No use, distribution or reproduction is permitted which does not comply with these terms.
*Correspondence: Xiang Liu, MTgxMDU2NzM3MjFAMTYzLmNvbQ==