 Weibiao Xie
 Qiuli Yin1,2*
- 1School of Petroleum, China University of Petroleum (Beijing) at Karamay, Karamay, China
- 2State Key Laboratory of Petroleum Resources and Prospecting, China University of Petroleum (Beijing), Beijing, China
- 3China Petroleum Logging Co., Ltd., Xian, Shanxi, China
Accurately predicting the water production rate of multiple-phase fluid flows through porous rock is important for many engineering and geological applications. Taking into account irreducible water and capillary tortuosity, the equivalent rock element model from previous studies has been improved. Based on the improved capillary equivalent rock element model, this study proposes a relationship model between the water production rate in two-phase fluid systems and the resistivity index. The relationship model is verified using rock samples, and the result shows that the water production rate calculated by the new model closely matches experimental values, improving parameter calculation accuracy. In addition, applications of the new model to well logging data show that the calculated water production rate is consistent with the actual production situation. This approach is more efficient and accurate in reservoir evaluation. The new model provides a new idea for studying the seepage characteristics of rocks with multiple-phase fluids.
1 Introduction
The seepage characteristics of porous media with multiple-phase fluids are a research hot spot (Chen and Yao, 2017; Behrang et al., 2016). Understanding the seepage characteristics of rocks in oil–water two-phase flow and oil–gas–water three-phase flow is fundamental for reservoir development planning, production forecasting, and reservoir evaluation (Tiab and Donaldson, 2024; McKenna et al., 2020; Yushu Wu, 2015).
The water production rate, defined as the water volume ratio during reservoir exploitation, is an important seepage characteristic parameter and serves as a dynamic indicator for evaluating the reservoir’s oil-bearing properties. The theoretical results show that there is a clear functional relationship between water production rate and relative permeability (Schön, 2011). In order to accurately calculate the water production rate, several researchers have developed methods for relative permeability. Honarpour et al. derived a relationship model between water production rate and water saturation based on the empirical relative permeability model proposed by Honarpour (2018), Kasha et al. (2023), and Corey (1954). This model is one of the most widely used models, but it only considers the general relationship between water production rate and water saturation, and the accuracy is low in low porosity and low permeability reservoirs (Bear, 2013; Rutqvist et al., 2002). Chima et al. (2010) analyzed the relationship between water production rate and relative permeability during natural gas exploitation in a fractured reservoir. Clarkson described the variation in the water production rate during coal-bed gas exploitation using relative permeability analysis (Clarkson et al., 2011). A theoretical model of gas–water relative permeability in gas hydrate reservoirs is established by Lei et al. (2020). These models can accurately predict the water production rate in fractured formations, coal-bed gas formations, and gas hydrate reservoirs, but their application range is limited. Schlachter et al. examined the water production rate using Modular Dynamics Tester (MDT) testing and logging (Schlachter, 2007; Whittle et al., 2003; Wu and Zhang, 2018). Wang et al. used machine learning and deep learning to predict relative permeability and the oil content ratio during reservoir exploitation, achieving good results (Wang et al., 2022; Zhong et al., 2021).
Previous studies have shown that relative permeability is a key parameter in determining the water production rate, and relative permeability itself is a function of water saturation (Iscan, 2021; Xu et al., 2014). Therefore, the relationship between water production rate and water saturation plays a crucial role in determining the water production rate (Pius and Olamigoke, 2020). Water saturation is a static parameter describing the oil-bearing properties of a reservoir. A common method for determining water saturation is using rock electrical properties, with widely used existing models such as the Archie model and the three-water model (Archie, 1942; Rangelov and Nassiri, 2018; Xie et al., 2023; Jin et al., 2020). The equivalent rock element model (EREM), which incorporates the impact of the pore structure on rock resistivity, is also extensively utilized in the investigation of rock seepage (Shang et al., 2003; Shang et al. 2004; Shang et al. 2008). Consequently, using rock electrical properties to determine the water production rate proves to be a valuable approach. However, research on this topic is limited.
Research has shown that the seepage characteristics and electrical properties of rocks are closely related to the pore structure (Yin et al., 2020; Smirnov et al., 2019; Reza-E-Rabbi et al., 2020). Xie et al. (2020) proposed a relationship model between relative permeability and rock electrical properties, considering the effect of the pore structure. Xu P et al. developed a relative permeability model based on the fractal theory (Peng et al., 2013; Wang et al., 2019). The pore structure is an essential factor in establishing the relationship model between water production rate and rock electrical properties. Taking into account the effect of the pore structure, this paper has improved the EREM, and a relationship model between water production rate and resistivity index is proposed. Seven rock samples with different pore structure types were used to validate the new model, and the average relative error between the water production rate calculated by the new model and the experimental data is 5%. The results of both verification and application show that the new model can directly calculate the water production rate from the resistivity index and accurately predict the water production rate of rocks with different pore structures. The novel model incorporates pore structure characterization parameters to mitigate the impact of the pore structure on the water production rate, thereby enhancing the precision of water production rates. In addition, the new model provides a new idea for studying the seepage characteristics of rocks and enriches the data foundation for guiding reservoir development planning, production forecasting, and reservoir evaluation.
2 Relationship between water production rate and electrical resistivity in two-phase fluid flows
2.1 Improved capillary equivalent rock element model
According to the EREM (Shang et al., 2003; Shang et al. 2004; Shang et al. 2008), we obtain
where in Equation 1,
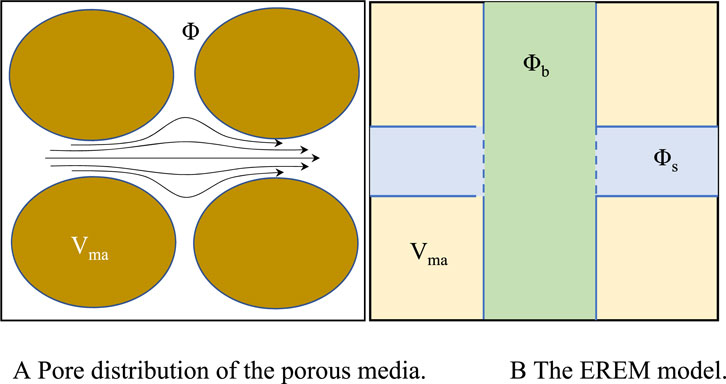
Figure 1. Equivalent rock element model of the porous media. (A) Pore distribution of the porous media. (B) EREM.
In Figure 1,
Generally, the flow characteristics are mainly featured by throat pores. Figure 2 shows the flow model of the pore fluids. The equivalent capillary porosity can be expressed as
where in Equation 2,
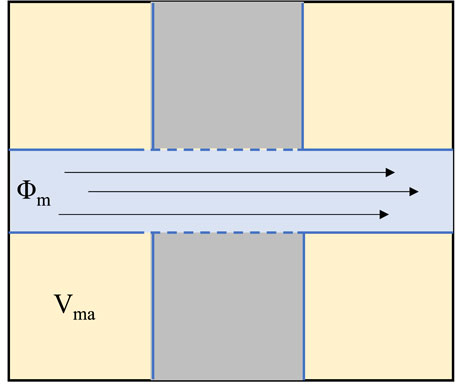
Figure 2. Flow model of the pore fluids.
In Figure 2,
Actually, water-wetted rocks contain irreducible water. The effective flow porosity
where
where
By substituting Equation 4 into Equation 3, the effective porosity of flow fluids is expressed as
The equivalent rock element model assumes that the effective flow pores are straight capillaries. However, studies have shown that the flow of pore fluids in porous media is a complex process (Cai et al., 2019). In order to simulate the actual flow of pore fluids, the effective flow pores are assumed to be curved capillaries. Figure 3 shows the improved capillary equivalent rock element model (ICEREM), where
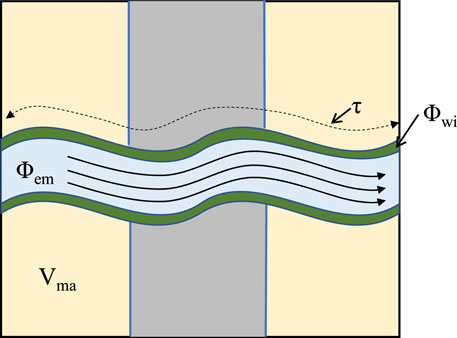
Figure 3. ICEREM.
In Figure 3,
2.2 Relationship between water production rate and electrical resistivity in two-phase fluid flows
According to Darcy’s law and Poiseuille equation (Darcy, 1856; Song R et al., 2019), the water flow through the rock section can be expressed as
where
From Equation 6, it is assumed that fluids flow only in the effective flow pores, as shown in Figure 3.
As the non-wetting phase fluid entered the pores, it was mainly distributed in the central part of the capillary pores. Figure 4 shows the distribution of the two-phase flow fluids in the capillary pores.
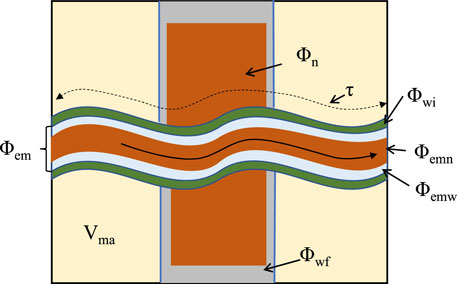
Figure 4. Distribution of the two-phase fluid flows in the capillary pores.
In Figure 4,
The water flow and non-wetting phase fluid flow across the rock section can be expressed as
where
According to Equation 7, the water production rate of a two-phase fluid flow can be calculated as follows:
Rock conductivity is the parallel conductance between equivalent capillary porosity and the invalid flow part (invalid flow capillary porosity and the rock matrix). The conductivity of the invalid flow part is assumed to be 0, and the conductivities of water-saturated and partially saturated rock can be obtained as follows:
In Equation 9,
The three-water model considers rock conductivity as a parallel conductance among shaly irreducible water, micropore irreducible water, and free water, and each conductance component follows the Archie model (Zhang and Pan, 2010; Mo et al., 2001). According to the three-water model, the conductivity of water-saturated and partially saturated rock can be further revised as follows:
In Equation 10, both shaly irreducible water and micropore irreducible water are treated as irreducible water and are assumed to have the same conductivity.
By comparing Equation 9 with Equation 10, we can derive the equivalent tortuosity for the water flow in effective flow capillary pores
In addition, when the non-wetting phase fluid conductivity equals the pore water conductivity, according to Equations 9, 10,
However, the difference between actual non-wetting phase fluid conductivity and wetting phase fluid conductivity may cause a variation in
By substituting Equations 4, 5, 11, 13 into Equation 8, the water production rate
According to Equations 9, 10, the relationship between
where
where
By comparing Equation 16 with Equation 14, the relationship between the resistivity index and water production rate
In Equation 17,
In Equations 16, 17, pore structure characterization parameters
3 Verification
To verify the model in this paper, the selected rock samples have the same sedimentary environment and lithology, ensuring that the resistivity and seepage capacity of the samples are mainly affected by the pore structure while minimizing the influence of other factors, such as clay content. Seven rock samples selected from the Dongying Formation, Nanpu Sag, are used to verify the relationship model between the
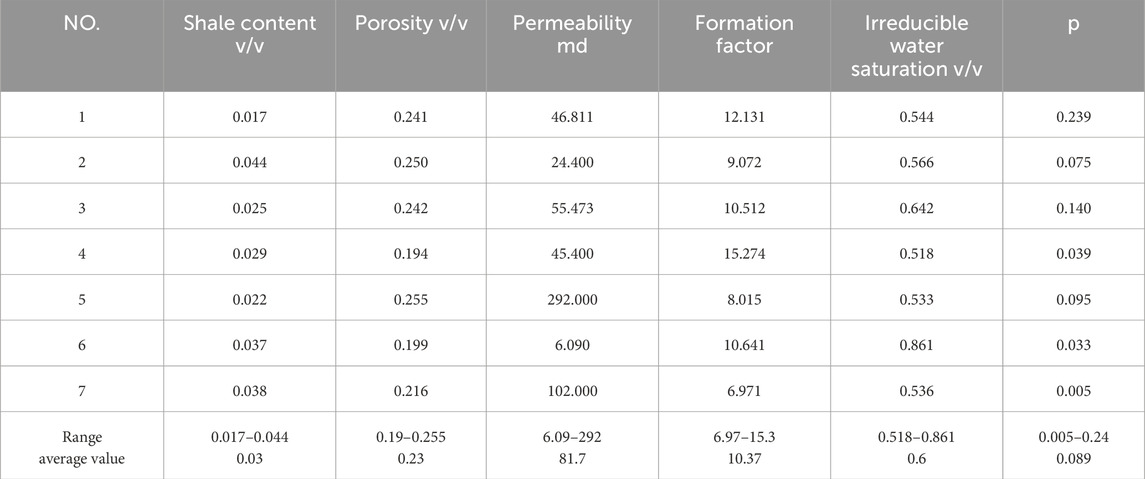
Table 1. Characteristic parameters of rock samples.
Figure 5 shows the T2 spectrum of rock samples; the variation in the distribution of the T2 spectra and the position of T2 peak values indicate differences in pore structures. For example, sample No. 1 shows a double-peak right-skew type with the highest peak position of 100 ms; sample No. 2 shows a double-peak balanced type with the highest peak position of 10 ms; sample No. 3 shows a double-peak left-skew type with the highest peak position of 3 ms; sample No. 4 shows a double-peak right-skew type with the highest peak position of 30 ms; sample No. 5 shows a medium peak with the peak position of 10 ms; sample No. 6 shows a single-peak left-skew type with the peak position of 2 ms; and sample No. 7 shows a single-peak left-handed type with the peak position of 3 ms.
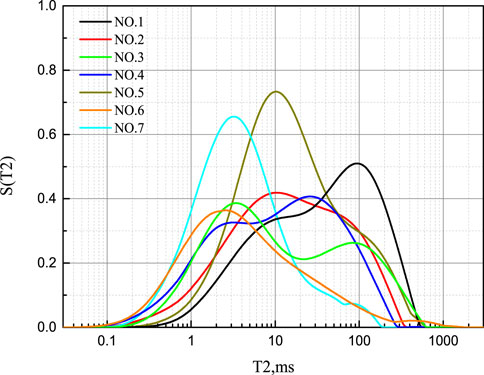
Figure 5. T2 spectrum of the seven rock samples.
Figures 6–8 show the relationship among
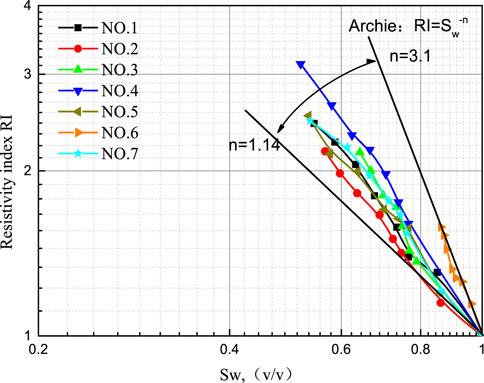
Figure 6. Relationship between
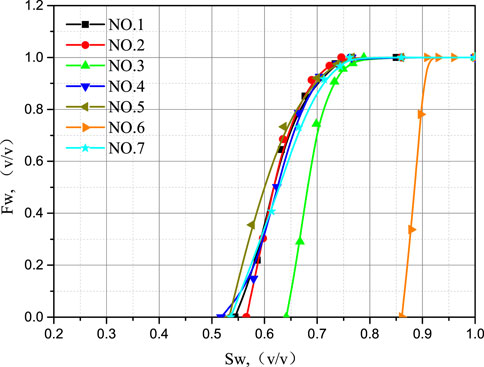
Figure 7. Relationship between Sw and
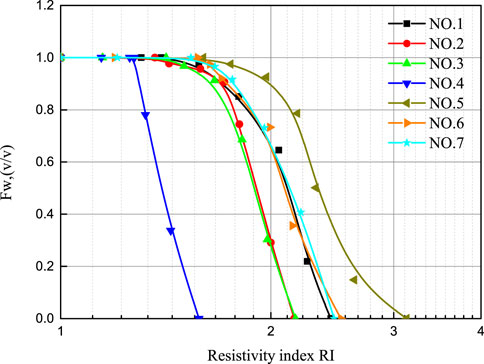
Figure 8. Relationship between RI and
It can be observed that
In Equation 16, parameter
The Swanson parameter (inflexion point) of the mercury injection curve is used to distinguish large and small pores (throat pores) in rock samples (Swanson, 1981; Zhang and Weller, 2021; Xiao et al., 2017). The integral curve of the NMR T2 spectrum corresponds well with the mercury injection curve. According to the definition of the Swanson parameter, T2 time at the inflexion point between macropore and small pores is determined, and then parameter
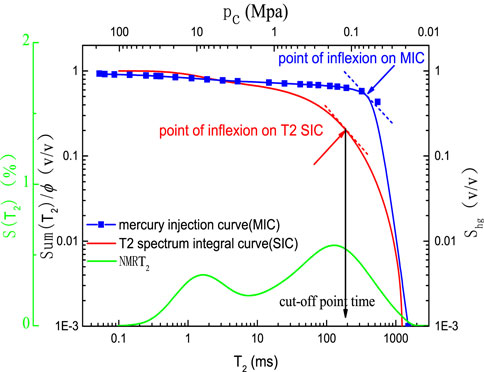
Figure 9. Classification of macropores and throat pores.
In Figure 9, the NMR T2 spectra of the core sample (red line) and the pore size distribution of the core sample derived from the MICP experimental data (blue dash-dotted line) are presented. T2 (ms) is the transverse relaxation time. S (T2) (%) is the T2 pore component. ra (μm) is the pore radius. S (ra) (%) is the pore component derived from MICP experimental data. Demarcation T2 time (ms) is the inflexion point between macropores and throat pores, which is 110 ms in this part.
Regional coefficients
In order to compare with previous research results, the water production rate is expressed as
where the relative permeability of oil and water phases in the Equation 18 can be calculated according to the model proposed by Wang and Cardenas (2018).
where in Equation 19,
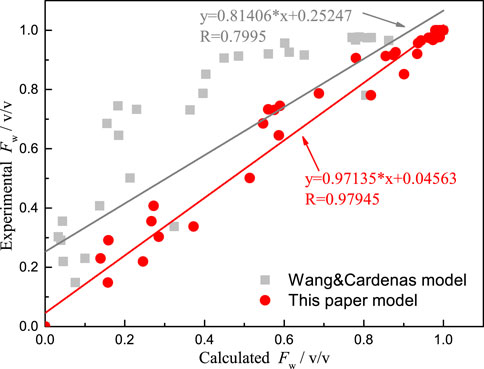
Figure 10. Comparison between calculated
The water production rate can be calculated using Equation 17 and Wang and Cardenas model. Figure 10 shows the comparison between the calculated water production rate using Equation 17 and experimental data (the red point in Figure 10), where the goodness of fit is 0.97945, and the average relative error is 5%. Figure 10 shows the comparison between the calculated water production rate by the Wang and Cardenas model and experimental data, where the goodness of fit is 0.7995 and the average relative error is 23%. The result indicates a strong agreement between the calculated water production rate and experimental data.
4 Application in well logging data
The new method is applied to Well NPX49 in Nanpu Sag, Huanghua depression, China. The NMR logging measurement mode of Well NPX49 is D9TWE3. Specific parameter areas are as follows: for Group A, TWl = 12.988 s, TEs = 0.9 ms, and the echo number is 500; for Group B, TWs = 1 s, TEs = 0.9 ms, and the echo number is 500; for Group C, TWc = 0.02s, TEc = 0.6 ms, and the echo number is 20; for Group D, TWl = 12.988 s, TEl = 3.6 ms, and the echo number is 125; and for Group E, TWs = 1 s, TEl = 3.6 ms, and the echo number is 125. Drilling mud resistivity is 2.26 OHMM/18°C.
Figure 11 shows the evaluation result of Well NPX49 (layers 1–3) using the new method. The reservoir parameters and water production rate of the produced fluid from layers 1–3 are shown in Table 2.
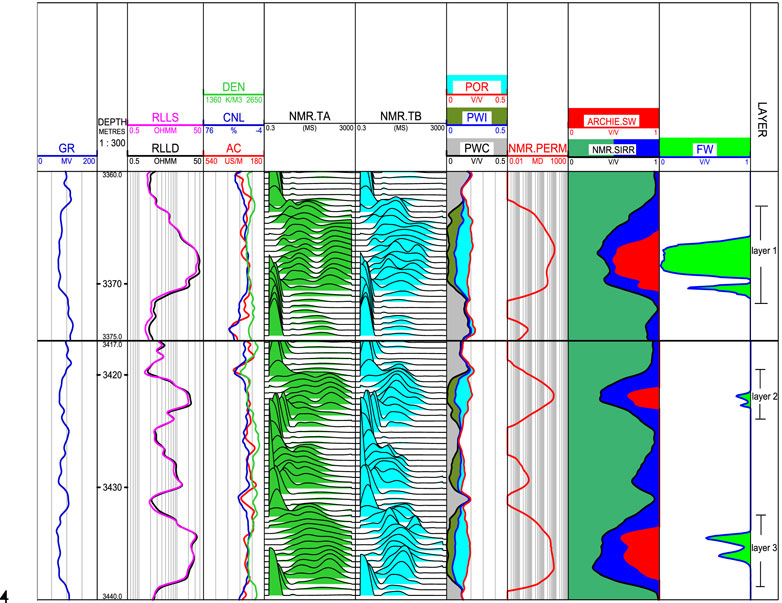
Figure 11. Application to well NPX49 (layers 1–3).

Table 2. Reservoir parameters.
In Figure 11, tracks from left to right include tracks 1–4: natural gamma-ray logging (GR: GAPI)/spontaneous potential logging (SP: MV), depth (meters), apparent resistivity logs (RLLD/RLLS: OHMM), acoustic-wave slowness logs (AC: us/m), bulk density (DEN: g/cm3), and neutron porosity (CNL:%). Track 5: NMR logging T2 spectra measured with parameters TE = 0.9 ms and TW=12988 ms (NMR.TA:ms). Track 6: NMR logging T2 spectra measured with parameters TE = 3.6 ms and TW=12988 ms (NMR.TB: ms). Track 7: clay-bound water porosity (PWC: V/V)/ capillary-bound water porosity (PWI: V/V)/ movable water porosity (POR: V/V) computed from NMR logging. Track 8: permeability calculated from NMR logging (NMR.PERM: MD). Track 9: water saturation by the Archie model (ARCHIE.SW: V/V)/ irreducible water saturation from NMR (NMR.SIRR: V/V). Track 9: the new method calculated the water production rate of percolating fluid (FW: V/V). Track 10: the number of the layer.
In layers 1–3, the low natural gamma-ray logging values present the characteristics of sandstone with low clay content. The resistivity of layer 1 is high, with a value of 39 Ω·m. The distribution of NMR T2 spectra for both short-TE and long-TE is broad. The calculated water saturation is 40.3%, and the bound water saturation calculated based on NMR is 38%, demonstrating excellent oil-bearing characteristics. The daily oil production of layer 1 is 14 m³ with no water (the water production rate
The distribution of long-TE T2 spectra and short-TE T2 spectra narrows from layer 1 to layer 3. The oil saturations of layers 1–3 are 59.7%, 34.2%, and 38.3%, respectively. The calculated water saturation reduced from layer 1 to layer 3, indicating that layer 1 is more oil-rich than layers 2 and 3. The calculated results of layers 2 and 3 show some differences. However, the daily oil production of layer 2 is 0.2 m3, with a water production rate of 95.6%. The daily oil production of layer 3 is 3.2 m3, with a water production rate of 60.4%. The main reason for the difference between layers 2 and 3 is the difference in the pore structure; for instance, the NMR T2 spectrum in layer 2 shows obvious bimodal right-skew characteristics, while in layer 3, it shows single-modal left-skew characteristics. The application results show that oil saturation does not reflect actual oil production. The water production rate calculated by the new model is consistent with the actual production situation.
5 Discussion and future work
(1) Accurately estimating the pore structure is a crucial factor in improving the accuracy of water production rate prediction models. The new model can directly calculate the water production rate from the resistivity index, avoiding errors introduced by water saturation calculation in previous
(2) The new model can accurately predict the water production rate of rocks with different pore structures with the introduction of a pore structure-related parameter
(3) The error in the water production rate calculated by the new model may be caused by the following factors: ①pore structure differences between the actual model and the ICEREM, ② flow path differences between the electrical and fluid flows, ③measurement errors in experimental data, and ④ the presence of additional conductive minerals in the rock skeleton.
(4) Since the ICEREM model mainly considers irreducible water and capillary tortuosity, other pore structure parameters, such as wettability and shaly content, are assumed to be uniform; the accuracy of the new model can be further improved by classifying pore structures and redefining the empirical parameters in Equations 16, 17 of each pore structure type.
(5) The wetting phase saturation value in a reservoir does not accurately reflect the wetting phase ratio of the output fluid volume in two-phase fluid seepage, so the calculated water saturation/oil saturation is not consistent with the actual water/oil ratio, as shown in Figure 11. However, the water production rate calculated by the new model is consistent with the actual production situation, indicating that the model can be used to guide reservoir production or the application of two-fluid seepage in a porous material.
Further research directions concerning the electrical properties of sand-based porous materials and the conductivity equation of rocks may include the following aspects:
a. A new equation should be established for rock resistivity based on sandstone pore structure characteristics. However, in carbonate, volcanic rocks, and other types of rock, the pore characteristics differ from those of sandstone, such as fractures and caves in carbonate and high- and low-angle fractures in volcanic rocks (Xie et al., 2024a). The new model’s adaptability needs further validation, and model parameters must be determined by sample experiments.
b. The model in this paper does not consider skeleton conductivity, but some mineral skeletons in rock samples are conductive, such as wet clay and pyrite. Considering the influence of conductive minerals on rock conductivity is the next step to improve the accuracy of the model.
c. The conductivity models of rock are widely used in well logging research, reservoir evaluation, reservoir research, and geological research (Xie et al., 2024b). One of the next steps is to extend the new model in this paper and apply it to these research areas.
d. The conductivity theory of sandstone in this paper can be extended and applied to cement, coal, and other types of porous materials, but it needs to be verified and analyzed by conducting experiments on different types of porous media.
6 Conclusion
(1) Pore structure significantly influences rock electrical properties and seepage characteristics. The EREM has been improved by considering irreducible water and capillary tortuosity.
(2) Based on the ICEREM, the relationship model between the water production rate and resistivity index has been proposed.
(3) Compared to the previous water production rate models (
(4) The results of verification and application have shown that the water production rate calculated by the new model is in accordance with experimental values and the actual water production rate.
(5) The new model can predict the water production rate based on electrical properties, dynamically enhance reservoir evaluation, and strengthen the database for reservoir development planning, production forecasting, and reservoir evaluation.
Data availability statement
The raw data supporting the conclusions of this article will be made available by the authors, without undue reservation.
Author contributions
WX: conceptualization, methodology, writing–original draft, and writing–review and editing. QY: conceptualization, methodology, and writing–review and editing. XD: writing–review and editing. YF: data curation, validation, and writing–review and editing. PZ: writing–review and editing.
Funding
The author(s) declare that financial support was received for the research, authorship, and/or publication of this article. This article was supported by the Research Foundation of Karamay, China (2024hjcxrc0075), the Research Foundation of the China University of Petroleum-Beijing at Karamay (No. XQZX20230012), “Tianchi Talent” Introduction Plan Foundation of Xinjiang, and the Natural Science Foundation of Xinjiang (No. 2021D01E22).
Conflict of interest
Author YF was employed by China Petroleum Logging Co., Ltd.
The remaining authors declare that the research was conducted in the absence of any commercial or financial relationships that could be construed as a potential conflict of interest.
Generative AI statement
The author(s) declare that no Generative AI was used in the creation of this manuscript.
Publisher’s note
All claims expressed in this article are solely those of the authors and do not necessarily represent those of their affiliated organizations, or those of the publisher, the editors and the reviewers. Any product that may be evaluated in this article, or claim that may be made by its manufacturer, is not guaranteed or endorsed by the publisher.
References
Archie, G. E. (1942). The electrical resistivity log as an aid in determining some reservoir characteristics. Trans. AIME 146 (01), 54–62. doi:10.2118/942054-g
Behrang, A., Mohammadmoradi, P., Taheri, S., and Kantzas, A. (2016). A theoretical study on the permeability of tight media; effects of slippage and condensation. Fuel 181, 610–617. doi:10.1016/j.fuel.2016.05.048
Burdine, N. T. (1953). Relative permeability calculations from pore size distribution data. Petr.trans.am Inst.mining Metall.eng. 98 (3), 71–78.
Cai, J., Lin, D., Singh, H., Zhou, S., Meng, Q., and Zhang, Q. (2019). A simple permeability model for shale gas and key insights on relative importance of various transport mechanisms. Fuel 252, 210–219. doi:10.1016/j.fuel.2019.04.054
Chen, X., and Yao, G. (2017). An improved model for permeability estimation in low permeable porous media based on fractal geometry and modified Hagen-Poiseuille flow. Fuel 210, 748–757. doi:10.1016/j.fuel.2017.08.101
Chimá, A., Chávez, E. A., and Calderón, Z. (2010). “An equation to predict two-phase relative permeability curves in fractures,” in SPE Latin American and Caribbean petroleum engineering conference (Society of Petroleum Engineers). doi:10.2118/138282-MS
Clarkson, C. R., Rahmanian, M., Kantzas, A., and Morad, K. (2011). Relative permeability of CBM reservoirs: controls on curve shape. Int. J. Coal Geol. 88 (4), 204–217. doi:10.1016/j.coal.2011.10.003
Corey, A. T. (1954). The interrelation between gas and oil relative permeabilities. Prod. Mon. 19 (1), 38–41.
Iscan, A. G. (2021). Water saturation calculation using fractional flow and production logging data in a Caspian region sandstone petroleum reservoir. J. Petroleum Sci. Eng. 200, 108355. doi:10.1016/j.petrol.2021.108355
Jin, Y., Li, S., and Yang, D. (2020). Experimental and theoretical quantification of the relationship between electrical resistivity and hydrate saturation in porous media. Fuel 269, 117378–378. doi:10.1016/j.fuel.2020.117378
Kasha, A., Myers, M., Hathon, L., Sakhaee-Pour, A., Sadooni, F., Nasser, M., et al. (2023). Integrated approach for closure correction of mercury injection capillary pressure measurements. Geoenergy Sci. Eng. 230, 212245. doi:10.1016/j.geoen.2023.212245
Lei, G., Liao, Q., Lin, Q., Zhang, L., Xue, L., and Chen, W. (2020). Stress dependent gas-water relative permeability in gas hydrates: a theoretical model. Adv. Geo-Energy Res. 4 (3), 326–338. doi:10.46690/ager.2020.03.10
McKenna, S. A., Akhriev, A., Ciaurri, D. E., and Zhuk, S. (2020). Efficient uncertainty quantification of reservoir properties for parameter estimation and production forecasting. Math. Geosci. 52 (2), 233–251. doi:10.1007/s11004-019-09810-y
Mo, X. W., He, D. H., Li, Z.Bo, Wen, X. C., and Li, G. R. (2001). The application of three-water conduction model in the interpretation of low-resistivity reservoir. J. Changchun Univ. ence Technol (01), 92–95. doi:10.13278/j.cnki.jjuese.2001.01.019
Peng, Xu, Qiu, S., Yu, B., and Jiang, Z. (2013). Prediction of relative permeability in unsaturated porous media with a fractal approach. Int. J. Heat Mass Transf. 64, 829–837. doi:10.1016/j.ijheatmasstransfer.2013.05.003
Pius, T. O., and Olamigoke, O. (2020). “Investigating the correlation between water saturation obtained from cased-hole saturation tool measurements and produced water cut in strong water drive reservoirs,” in SPE Nigeria annual international conference and exhibition, D013S018R002.
Purcell, W. R. (1949). Capillary pressures - their measurement using mercury and the calculation of permeability therefrom J. Pet. Technol. 1 (02), 39–48.
Rangelov, M., and Nassiri, S. (2018). Empirical time-dependent tortuosity relations for hydrating mortar mixtures based on modified archie's law. Constr. Build. Mater. 171, 825–838. doi:10.1016/j.conbuildmat.2018.03.173
Reza-E-Rabbi, S., Ahmmed, S. F., Arifuzzaman, S. M., Sarkar, T., and Khan, M. S. (2020). Computational modelling of multiphase fluid flow behaviour over a stretching sheet in the presence of nanoparticles. Eng. Sci. Technol. Int. J. 23 (3), 605–617. doi:10.1016/j.jestch.2019.07.006
Rutqvist, J., Wu, Y. S., Tsang, C. F., and Bodvarsson, G. (2002). A modeling approach for analysis of coupled multiphase fluid flow, heat transfer, and deformation in fractured porous rock. Int. J. Rock Mech. Min. Sci. 39 (4), 429–442. doi:10.1016/s1365-1609(02)00022-9
Schlachter, G. (2007). “Using wireline formation evaluation tools to characterize coalbed methane formations,” in Eastern regional meeting (Society of Petroleum Engineers). doi:10.2118/111213-ms
Shang, B. Z., Hamman, J. G., and Caldwell, D. H. (2003). “A physical model to explain the first Archie relationship and beyond,” in SPE annual technical conference and exhibition (Society of Petroleum Engineers). doi:10.2118/84300-MS
Shang, B. Z., Hamman, J. G., and Caldwell, D. H. (2004). “Water saturation estimation using equivalent rock element model,” in SPE annual technical conference and exhibition (Society of Petroleum Engineers). doi:10.2118/90143-MS
Shang, B. Z., Hamman, J. G., and Caldwell, D. H. (2008). “Improved water saturation estimation using equivalent rock element model and applications to different rock types,” in Europec/EAGE conference and exhibition (Society of Petroleum Engineers). doi:10.2118/113342-MS
Smirnov, N. N., Nikitin, V. F., and Skryleva, E. I. (2019). Microgravity investigation of seepage flows in porous media. Microgravity Sci. Technol. 31 (1), 629–639. doi:10.1007/s12217-019-09733-7
Song, R., Wang, Y., Liu, J., Cui, M., and Lei, Y. (2019). Comparative analysis on pore-scale permeability prediction on micro-ct images of rock using numerical and empirical approaches. Energy ence and Eng. 7 (2), 2842–2854. doi:10.1002/ese3.465
Swanson, B. F. (1981). A simple correlation between permeabilities and mercury capillary pressures. J. Petroleum Technol. 33 (12), 2498–2504. doi:10.2118/8234-pa
Tiab, D., and Donaldson, E. C. (2024). Petrophysics: theory and practice of measuring reservoir rock and fluid transport properties. Elsevier.
Wang, F., Jiao, L., Zhao, J., and Cai, J. (2019). A more generalized model for relative permeability prediction in unsaturated fractal porous media. J. Nat. Gas Sci. Eng. 67, 82–92. doi:10.1016/j.jngse.2019.04.019
Wang, L., and Cardenas, M. B. (2018). Connecting pressure-saturation and relative permeability models to fracture properties: the case of capillary-dominated flow of supercritical CO2 and brine. Water Resour. Res. 54 (9), 6965–6982. doi:10.1029/2018wr023526
Wang, Y., Li, H., Xu, J., Liu, S., and Wang, X. (2022). Machine learning assisted relative permeability upscaling for uncertainty quantification. Energy 245, 123284. doi:10.1016/j.energy.2022.123284
Whittle, T. M., Lee, J., and Gringarten, A. C. (2003). “Will wireline formation tests replace well tests?,” in SPE annual technical conference and exhibition (Society of Petroleum Engineers). doi:10.2118/84086-MS
Wu, Y., Zhang, H., Yang, D., Zhang, H., and Yuan, W. (2018). Oil-gas breakthrough time and water content predict or mdt pump in low permeability reservoir. Well logging Technol. 42 (5), 557–561. doi:10.16489/j.issn.1004-1338.2018.05.012
Xiao, L., Liu, D., Wang, H., Li, J., Lu, J., and Zou, C. (2017). The applicability analysis of models for permeability prediction using mercury injection capillary pressure (MICP) data. J. Petroleum Sci. Eng. 156, 589–593. doi:10.1016/j.petrol.2017.06.042
Xie, W., Yin, Q., Guan, W., Wang, G., and Lai, J. (2020). Estimating the relative permeability from the electrical parameters of sandstone with a complex pore structure. Energy&Fuels 34, 14124–14131. doi:10.1021/acs.energyfuels.0c03218
Xie, W., Yin, Q., Wu, L., Yang, F., Zhao, J., and Wang, G. (2024b). A new nuclear magnetic resonance-based permeability model based on two pore structure characterization methods for complex pore structure rocks: permeability assessment in Nanpu Sag, China. Geophysics 89 (1), MR43–MR51. doi:10.1190/geo2023-0026.1
Xie, W., Yin, Q., Zeng, J., Wang, G., Feng, C., and Zhang, P. (2023). Fractal-based approaches to pore structure investigation and water saturation prediction from NMR measurements: a case study of the gas-bearing tight sandstone reservoir in Nanpu sag. Fractal Fract. 7, 273. doi:10.3390/fractalfract7030273
Xie, W., Yin, Q., Zeng, J., Yang, F., Zhang, P., and Yan, B. (2024a). An improved rock resistivity model based on multi-fractal characterization method for sandstone micro-pore structure using capillary pressure. Fractal Fract. 8, 118. doi:10.3390/fractalfract8020118
Xu, F., Mu, L., Wu, X., Sun, T., Ding, Y., Tian, X., et al. (2014). New expression of oil/water relative permeability ratio vs. water saturation and its application in water flooding curve. Energy Explor. and exploitation 32 (5), 817–830. doi:10.1260/0144-5987.32.5.817
Yin, X., Jiang, S., YanLu, L., Wei, G., Jungang, L., Peng, W., et al. (2020). Impact of pore structure and clay content on the water-gas relative permeability curve within tight sandstones: a case study from the ls block, eastern ordos basin, China. J. Nat. Gas ence Eng. 81, 103418. doi:10.1016/j.jngse.2020.103418
Yushu Wu (2015). Multiphase fluid flow in porous and fractured reservoirs. Houston: Gulf professional publishing.
Zhang, L., Pan, B., Li, Z., Mo, X., Xia, Z., and Xu, W. (2010). New three-water conduction model and its application in evaluation of low porosity and low permeability reservoir. Oil Geophys. Prospect. 45 (3), 431–435. doi:10.13810/j.cnki.issn.1000-7210.2010.03.025
Zhang, Z., and Weller, A. (2021). A comparative study of permeability prediction for Eocene sandstones—Part 1: application of modified Swanson models to mercury injection capillary pressure and nuclear magnetic resonance data. Geophysics 86 (6), M233–M243. doi:10.1190/geo2021-0194.1
Keywords: pore structure, resistivity index, water production rate, two-phase fluid, sand-based porous material
Citation: Xie W, Yin Q, Dai X, Fan Y and Zhang P (2025) The relationship between water production rate and resistivity in sand-based porous materials under two-phase fluid flow and its application. Front. Earth Sci. 13:1508283. doi: 10.3389/feart.2025.1508283
Received: 09 October 2024; Accepted: 09 January 2025;
Published: 11 February 2025.
Edited by:
Weichao Yan, Ocean University of China, ChinaReviewed by:
Suhaib Umer Ilyas, Jeddah University, Saudi ArabiaLi Dan, CNOOC Research Institute Ltd, China
Wang Song, China University of Petroleum, China
Copyright © 2025 Xie, Yin, Dai, Fan and Zhang. This is an open-access article distributed under the terms of the Creative Commons Attribution License (CC BY). The use, distribution or reproduction in other forums is permitted, provided the original author(s) and the copyright owner(s) are credited and that the original publication in this journal is cited, in accordance with accepted academic practice. No use, distribution or reproduction is permitted which does not comply with these terms.
*Correspondence: Weibiao Xie, Z2FyZXRoMTIzQDEyNi5jb20=; Qiuli Yin, MjAyMzU5MTMwMUBjdXBrLmVkdS5jbg==