 A. L. Back
 C. Kana Tepakbong
 L. Paul Bédard
 A. Barry
- 1Sciences de la Terre - CERM, LabMaTer, Université du Québec à Chicoutimi, Chicoutimi, QC, Canada
- 2Département d’Informatique et de Mathématique, Université du Québec à Chicoutimi, Chicoutimi, QC, Canada
- 3Centre Armand Frappier–Santé Biotechnologie, Institut National de la Recherche Scientifique (INRS), Laval, QC, Canada
- 4INRS-Unité Mixte de Recherche INRS-UQAC en Santé Durable, Chicoutimi, QC, Canada
Accurately describing grain shapes is crucial in geology, mineral exploration, civil engineering, and other sciences. Advances in image analysis now allow for easy object separation and quantitative shape description. However, despite extensive applications in sedimentology, chemistry, and civil engineering, there is no consensus on the use of shape descriptors, and their meanings often remain unclear. This article presents a method for quantitatively describing grain shapes at a micrometer-to-centimeter scale using various image analysis techniques. Our approach selects the most appropriate combination of quantitative descriptors to describe grain shape. This work is based on an extensive literature review across many scientific fields to extract multiple quantitative shape measurements. This paper focuses on size, orientation, and form descriptors. A total of 51 descriptors, including elongation and Fourier amplitudes, were extracted, compiled, and computed using Python. The descriptor computation code is provided as a library with this article. We use principal component analysis to select the most significant descriptors and use multiple descriptors without losing clarity. We validated our approach on generated images. Using this combination of principal component analysis and image-based descriptors, we could discriminate 8 of the 13 ideal forms (ranging from a circle to a dodecagon), showcasing the potential precision when running noiseless data. The process was then applied to a sample of 584 galena grains, and we successfully described quantitatively the shape tendencies within this galena grain population. Our results, accompanied by noisy generated images, highlight the strong influence of roundness, roughness, and form descriptors on each other, which explains the challenges in identifying the best descriptors. This work demonstrates the potential of combining PCA with image-based shape analysis to improve the quantitative description of grains, with implications for sedimentology, mineral exploration, and other fields.
1 Introduction
In Earth sciences, the description of mineral shape in texts is typically accompanied by minimal quantification. The problems associated with detailing mineral shape have been known for decades, and many authors have attempted to increase precision by using visual charts (Folk, 1951; Goldstone, 1993; Murphy and Kemp, 1984). The use of visual charts remains current (Garzanti et al., 2015; Sandeep et al., 2018). With the broader availability of grain images obtained through imaging systems and the use of segmentation techniques, it is possible to properly separate grains (Banerjee et al., 2019; Chen et al., 2024; Latif et al., 2022; Zheng and Hryciw, 2016). Thus, a quantitative description of grains is possible using appropriate shape descriptors.
Quantitative description is crucial as it allows automating the description task on a much larger data set, greatly improving precision and reproducibility. It also permits examining grain shapes statistically, similar to how grains are analyzed for their chemistry. This approach can be applied to various subjects in geology, such as the shape classification of zircon, which provides insights into magma petrogenesis (Pupin, 1980; Scharf et al., 2022), sedimentology, where grain shape is directly related to transport distance and medium (Garzanti et al., 2015; Huddart et al., 1998), and geotechnics, where grain shape influences soil properties (Altuhafi et al., 2016; Lu et al., 2019). In igneous petrology, mineral shape indicates the order of crystallization, assimilation, crystal growth conditions, and more. Moreover, with advances in artificial intelligence (AI) and applications such as AI mineral potential maps, the absence of quantitative descriptors of petrographic textures is a major limitation. The use of proper quantitative parameters for petrographic textures could be a significant advancement for many AI applications in geology.
Shape descriptions of objects or particles are widely studied in many scientific fields. This article aims to quantify the shape of mineral grains at a micrometer-to-centimeter scale using image analysis techniques. The need to describe microscopic–macroscopic particles is important in various disciplines (e.g., geology, materials science, agriculture, and chemistry), and thus, a large body of relevant literature exists. A consequence of this abundance is that quantitative shape descriptors are numerous and often redundant, with different names and ambiguous applications.
This article aims to introduce a framework for quantifying mineral grain (crystal) shape, which will eventually lead to describing petrographic textural parameters. It focuses on identifying and assessing the most relevant size, orientation, and form descriptors of grain shape. Alongside this framework, we propose a first nomenclature to clarify the use of descriptors. This work is based on an in-depth study of the literature facilitated by the use of statistical methods. We assess size measurements to determine the most accurate descriptors. Orientation measurement methods are evaluated for what information they provide and their potential to reduce noise in form discrimination. Finally, we test this descriptor framework for selecting and using descriptors on generated and actual grain images.
2 Shape characteristics: why quantitative petrography matters for petrology?
It is necessary to first define the terms used in this study, as there is no consensus on terminology in the literature. Most authors agree with Barrett’s (1980) definition that shape (or form) consists of three components: form, roundness and roughness (Figure 1). However, the naming of the set and its subsets poses challenges. In this article, shape refers to the general contour of the object. However, two additional components must be added: size and orientation, increasing the total to five components. These components are crucial for describing minerals in petrography. It is also essential to understand why precise numerical definitions are required and the broader implications of these definitions for petrology. The terminology, definitions, and examples of implications for petrology are as follows:
1. Size is determined by the measurable dimensions of the shape, but its value and interpretation depend on the applied measurement method. Crystal size, which has already been studied in detail, provides valuable insights into magmatic and metamorphic textures. It can reveal information about the cooling rate, deformation rate, and element availability (Higgins, 2002; Marsh, 1988). For these studies, the size measurement method is irrelevant as long as it is applied consistently, includes measurements of the short and long axes, and specifies the resolution limit (Higgins, 2000).
2. Orientation is described by the direction of one of the shape’s axes relative to a reference point, but its value also depends on the measurement used. Crystal orientation is well known for indicating the flow direction in both water and lava, as well as providing information about deformation and its intensity (Nédélec and Bouchez, 2015; Shelton and Mack, 1970; Ventura et al., 1996).
3. Form refers to the polygon or ellipse that is closest to the grain shape. The form can be related to the order of crystallization, as in cumulate texture, where well-formed minerals crystallize during the early stages of the process (Vernon and Collins, 2011). Alternatively, variations in form within the same mineral, such as zircon, provide insights into magma petrogenesis (Pupin, 1980; Zheng et al., 2022).
4. Roundness (also known as angularity) describes the angles of the grain: are they close to an acute edge or a smooth curve? Roundness, which has been studied early and intensively by sedimentologists (Diepenbroek et al., 1992; Krumbein, 1941; Tafesse et al., 2013; Wentworth, 1919), is a critical parameter, as it influences how clastic particles move in water and provides clues about their distance of travel or origin.
5. Roughness (also known as surface texture) characterizes the outline features of the grain. Roughness can reflect various processes depending on the surrounding rock and context, such as rapid mineral growth leading to skeletal and dendritic crystals or dissolution resulting in the formation of re-entrant (Hibbard, 1994).
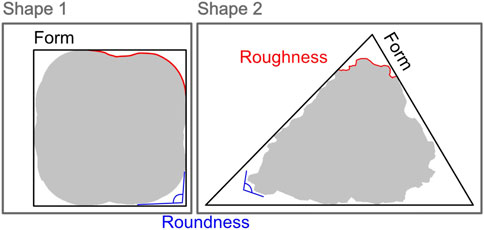
Figure 1. Illustration of the definitions used in this article on the basis of the Barrett (1980) definition. Shape 1 has a square form (in black) with a high roundness (in blue) and a low roughness (in red); shape 2 has a triangle form (in black) with a low roundness (in blue) and a high roughness (in red).
These examples clearly show that an in-depth study of one of the shape parameters could provide valuable and useful information for petrology, as seen in zircon form classification (Pupin, 1980). Given that quantitative measurements are better able to distinguish subtle and meaningful changes within the rock, as demonstrated by the crystal size distribution (CSD) results (Higgins, 2002; Marsh, 1988), the combined study of shape parameters with quantitative tools will enable the discovery of new textural indicators to provide a better understanding of geological phenomena. Moreover, in geometallurgy, quantitative shape descriptors are critical for exploitation and exploration (Frenzel et al., 2023).
In this article, the term “roundness” is preferred over “angularity” because angularity represents an extreme on the roundness continuum. When discussing roughness, it is recommended to use the term “roughness” rather than “surface texture” because it describes the grain outline in a 2D context, which is represented by a line rather than a surface. Additionally, “surface texture” is a more appropriate term for methodologies that describe the entire grain image (Al-Rousan et al., 2007; Chandan et al., 2004). Although surface texture in sand grain images can be influenced by roughness, other significant factors, such as fractures and inclusions, may also contribute.
For this article, the term “descriptor” refers to a method or formula used to describe one of the shape components. The descriptors used in this study are presented in the “Size, orientation, and form descriptors” section. The formulas for these descriptors can be found in the Appendix.
Finally, in this study, all these definitions are applied to the 2D representation of grains using image analysis techniques. Two-dimensional imaging techniques are widely available and more cost-effective compared to three-dimensional methods. Additionally, petrographic analyses are generally performed in 2D before 3D imaging is pursued.
3 Size, orientation, and form descriptors
This section presents condensed results from our extensive literature review. The methodology used for this review is detailed in the first part of the “Methodology” section. The following methods are derived from the clarification, sorting, and grouping of formulas identified in the review.
3.1 Size descriptors
The equivalent area disc diameter approximates grain size by using the diameter of a disc with the same area as the grain (Figure 2A; Ren et al., 2021; Wang et al., 2008). It is easily computable but should only be used when the grain form is very similar for the entire data set, as it assumes that all the grains are perfectly circular (Pirard, 2004).
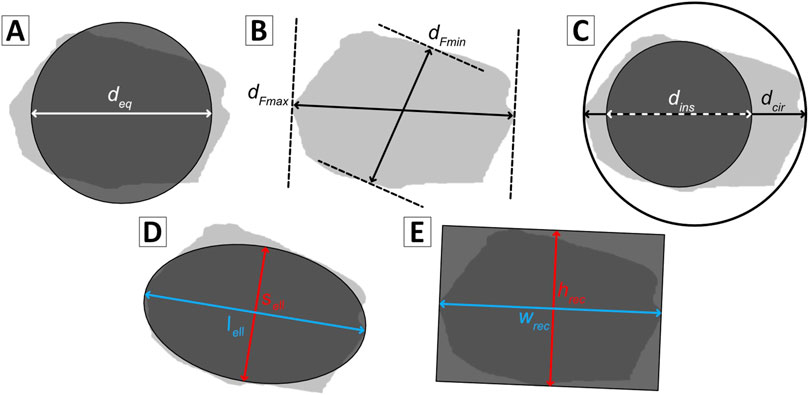
Figure 2. Size measurement methods: (A) equivalent area disc diameter (deq); (B) minimum (dFmin) and maximum Feret diameter (dFmax); (C) maximum inscribed circle diameter (dins) and minimum circumscribed circle diameter (dcir); (D) short (sell) and long (lell) equivalent-moment ellipse axis; (E) minimum enclosing rectangle width (wrec) and height (hrec).
The maximum inscribed circle of a grain is the largest circle that can be drawn inside the grain without extending beyond its boundaries. It is used as a measure of the short axis. The minimum circumscribed circle is the smallest circle that can enclose the grain, and it is used as a measurement of the grain’s long axis (Figure 2C; Cho et al., 2006; Wadell, 1932).
The Feret diameter is defined as the maximum distance between two parallel tangential lines that can be drawn in a specific direction across the grain (Han et al., 2023; Persson, 1998). For measurements, the orientation of the object can be changed at regular intervals, e.g., every 5°, and the distance is computed. The result of the method is a list of distances describing the discrete version of the grain outline. The most commonly used Feret diameters are the maximum, minimum, and mean (Figure 2B). However, as it is an incremental method, this approach could miss the longest or shortest distance depending on the measurement step.
The minimum circumscribed circle diameter and the maximum Feret diameter measure the same axis, which is the longest distance between two points placed on the grain outline. In the case of the maximum inscribed circle diameter, if the center of the circle is the same as the grain’s center of rotation, the measure will be precisely the same as the minimum Feret diameter. The only difference between these methods is the precision induced by the analysis step (Figure 2B).
The equivalent-moment ellipse is defined as an ellipse having the same moments of inertia for each axis of the grain. It approximates the grain by an ellipsoid that is dynamically equivalent to it (Medalia, 1971; Figure 2D). This method has the advantage of obtaining a biaxial approximation of the grain and its orientation, and it can also weight orientation by area (Higgins, 2006), as it preserves the same perimeter and area (Rodieck, 2007).
The minimum enclosing rectangle is a rectangle that surrounds the grain with a specific direction to obtain the smallest possible area (Figure 2E; Maerz, 2004; Xing et al., 2023). It can be seen as the Feret measurements performed along the principal orientation and its perpendicular (Wang, 2006). This biaxial approximation of the grain has the advantage of imitating its passage through the smallest sieve possible.
3.2 Orientation descriptors
The orientation of the long axis measures the angle between the long axis of the minimum enclosing rectangle and the horizontal axis of the image, ranging from 0° to 180°. The second-moment orientation provides the orientation of the least second-moment axis of the object binary image, which has the advantage of measuring the orientation even for complex contours (Higgins, 2006; Medalia, 1971).
3.3 Form descriptors
The earliest use of mathematics to classify grain form involved comparing axis ratios or parameters to an ideal form (Wadell, 1933; Zingg, 1935). The axis ratio method uses 3D measurements to classify, for example, grain forms such as oblate to prolate. As discussed in the previous section on size measurement methods, there are various methods for measuring axes. Depending on the size measurement method being used, different formulas have been developed. However, they can be simplified by assuming that in 3D, grain size has three measurements: the long (
The choice of formula depends on the user’s intention to represent numbers between 0 and 1 or greater than 1, but they describe the same grain aspect. In 2D, the only available axis ratio is elongation, the first ratio in the two groups representing the ratio between the long and short axis (Equation 1). Some authors have attempted to use mean diameter as a measure for the intermediate axis (Wettimuny and Penumadu, 2004).
Another way to describe form is by comparing the grain to an ideal shape such as a circle, rectangle, or ellipse. The parameters used are areas or perimeters, represented as a ratio using both the grain and ideal shape parameters (Arasan et al., 2011; Cox and Budhu, 2008; Li et al., 2021; Ulusoy et al., 2003). The result addresses the question, “How closely does this shape resemble the ideal shape?” This concept gives rise to circularity (often referred to as sphericity, even in 2D studies) and encompasses the variety of formulas that can exist for a single descriptor (Kuo and Freeman, 2000). It also demonstrates the potential differences in usage for the same descriptor. Circularly has been widely used to describe roundness and grain form, highlighting the lack of consensus in regard to specific formulas stemming from the varying scientific approaches and interpretations (Arasan et al., 2011; Maroof et al., 2020b).
A modern method for mathematically describing grains involves applying Fourier analysis to the grain contour curve. There are two techniques for obtaining the grain contour curve: the Rθ method and the elliptic method. The Rθ method, the oldest, plots the ratio of the mean diameter to the diameter as a function of θ, ranging from 0° to 360° (Bui et al., 1989). However, this method is only applicable to convex shapes. The elliptic method obtains separate curves for the x and y coordinates as functions of θ, which allows for characterizing concave grains. Fourier analysis is then performed on the combined curves (Caple et al., 2017). In this article, this method will be referred to as the xy method to indicate contour information extraction.
Fourier analysis begins by applying the discrete Fourier transform to the grain contour curve to convert spatial information into frequency domain information. Then, the power spectral density is computed to provide frequency distribution information of the boundary shape. Low-frequency components correspond to form characteristics. Analyzing the low harmonics and their amplitude reveals the harmonics that affects the most the grain form. Combined, these two parameters create the shape descriptor. For instance, in the case of a square, the fourth harmonic will be present, and its amplitude will be high, whereas for an octagon, it will be the eighth harmonic. Consequently, it is essential to specify the harmonics used, as they could change the meaning of the form descriptors entirely.
4 Nomenclature
In the nomenclature, the descriptor name is based on a shortened version of its definition. When a dozen is available in the literature, the most accurate or widely used descriptor was chosen. For descriptors using Fourier analysis, information about the extraction method of the grain contour (Rθ or elliptic) is provided. The descriptor name should also include the range of harmonics used for a quicker understanding (e.g., Rθ Fourier forms 1–12). The list of equivalent names in the literature is not exhaustive and is based on the authors' literature review. Differences in terminology within this nomenclature (Table 1) may arise because of varying interpretations of how different authors use the descriptors. All references, along with their corresponding descriptor labels, used to establish the nomenclature are compiled in the descriptor review datasheet included in the article's Supplementary Material.
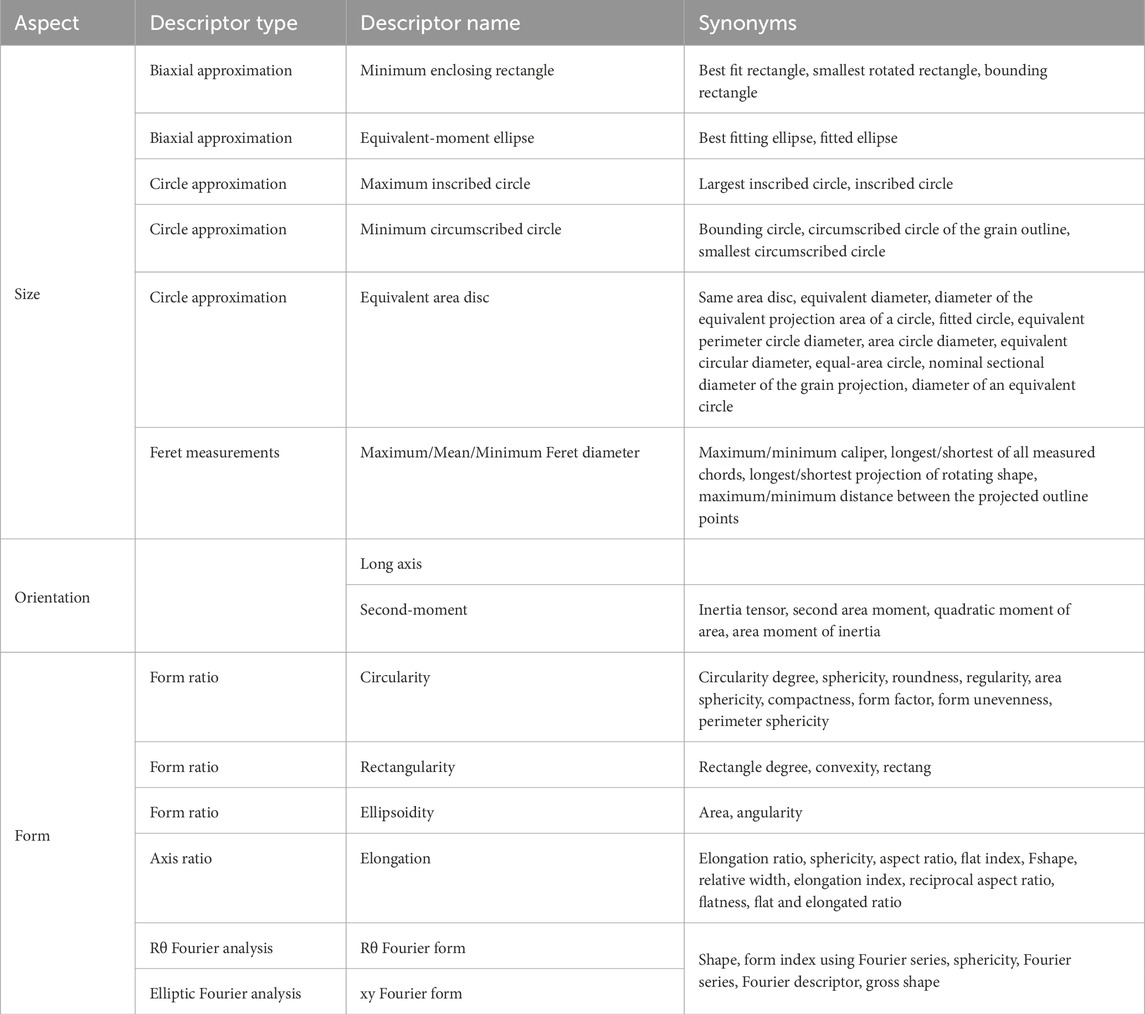
Table 1. Nomenclature of two-dimensional size, orientation, and form descriptors.
5 Methodology
The framework proposed in this study is applied to optical microscope images to illustrate its functionality. However, the methodology and associated Python code can analyze images of any type (SEM, µXRF, LA-ICP-MS such as: Savard et al. (2023), etc.), provided they are processed to produce a 2D binary image of the object of interest. For 3D imaging techniques such as 3D X-ray tomography, this can be easily achieved by generating sectional slices to obtain the required 2D images.
As literature is abundant on the quantitative description of shapes, each descriptor captures specific aspects of the intended information. Although no descriptor is perfect, the key is not to determine the best descriptor but to identify the most suitable for a particular study. By selecting meaningful descriptors and studying their parameters, the underlying physical properties influencing grain shape can be uncovered. Our first step in this approach was to create a comprehensive inventory of quantitative descriptors.
5.1 Relevant article determination
To address the need for a systematic approach to analyzing over 1000 papers on quantitative shape descriptors in various sciences, we adopted a statistical approach. The goal of this extensive bibliographic research was to identify a wide range of methods for quantifying grain shape in fields such as geology (Barrett, 1980; Yang et al., 2022), agronomy and crop sciences (Igathinathane et al., 2008; Vaezi et al., 2013), chemical engineering (Haffar et al., 2021; Huo et al., 2016; Lu et al., 2010), and civil engineering (Al-Raoush, 2007; Chandan et al., 2004; Maroof et al., 2020a). We selected articles using the following steps:
1. A broad query, including necessary keywords and their synonyms, was initiated and subsequently refined to obtain a substantial number (100 s–1,000 s) of articles matching the research topic. This initial selection was based on a quick data set review, including brief readings of the abstracts.
2. The database was then imported into VOSviewer software (van Eck and Waltman, 2010), which is designed for constructing and visualizing bibliometric networks.
3. The citation-per-document mapping option was used to create a bibliographic network (Figure 3), showcasing each article by the first author’s name and publication year. Cross-referencing between the articles was graphically depicted as links. In this visual representation, an article’s label size is proportional to its number of citations. This step effectively eliminated articles that matched the query but were found to lack relevance to the research topic, as evidenced by their absence from the citation network.
4. The clustering option in VOSviewer identified groups of related articles based on co-citation patterns (van Eck and Waltman, 2010). Articles were selected from each cluster (2–7 articles per cluster) based on highest citation count and publication year, ensuring a balanced perspective with older, intermediate, and recent works.
5. To ensure thorough coverage, unlinked articles not initially displayed in VOSviewer were revisited. This involved replotting them using the visual examination software to confirm their lack of relevance to the study. This process was repeated until all relevant articles were included in the analysis.
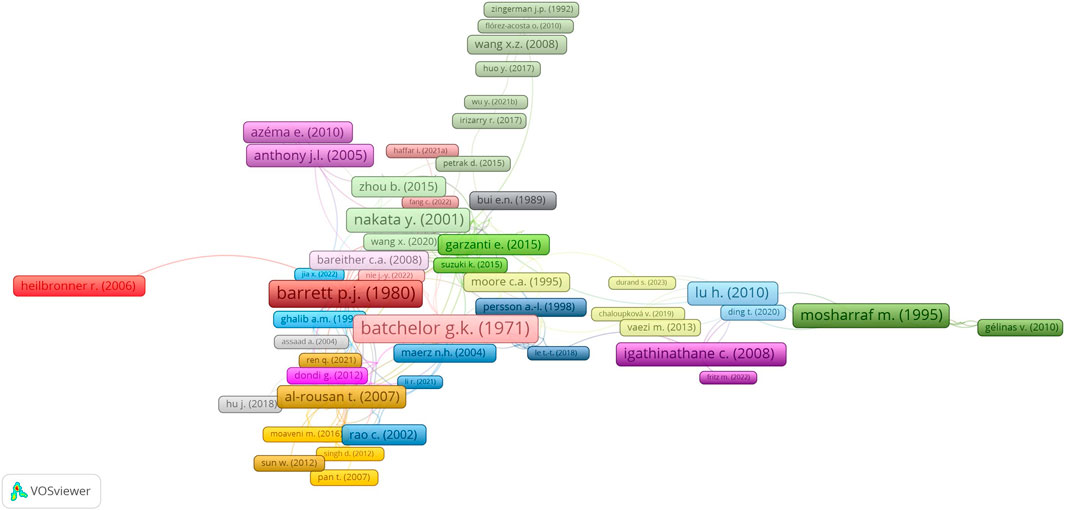
Figure 3. VOS viewer network of the Scopus database reflecting the query for grain description using image analysis, where each color represents a cluster.
The first step in the approach involved refining the query multiple times to obtain a reasonable number of articles. The number of articles per query ranged from 2044 to 42,262. Tens of thousands of articles were found for cases where physics-related articles do not use image-based size measurement methods, which was not desired for this study. The selected query produced 2127 articles, which were condensed to 274 using VOSviewer by removing articles lacking cross-referencing. These 274 articles were then grouped into 24 clusters, resulting in the selection of 82 articles for further study. Moreover, when an article referenced a formula used, the reference article was read, increasing the number of articles read to 109 (see the Supplementary Material for the list). However, of the 359 shape descriptors identified during the literature review, only 66% of the descriptors in the papers had a cited reference to indicate their source (when the article proposed a new method, it was considered as referenced). This absence of sourcing indicated a lack of rigor in the use of these descriptors and measurement methods.
5.2 Framework for selecting and evaluating size, orientation, and form descriptors
The second step involved testing shape descriptors from the literature survey using images that were generated with known shape parameters for grain image simulation. The objective was to measure and compare size and orientation using different methods. This step was important because shape descriptors often use size measurements in their formulas. As seen earlier, there are several methods for size measurements, and the chosen method may not match what is needed for the form descriptors. For example, rectangularity should be computed with the minimum enclosing rectangle parameters, not the Feret maximum and minimum measurements, as the two axes of the rectangle are perpendicular, which may not be the case for Feret’s size. In addition to size and orientation, few also evaluated form descriptors and the dependencies between form, roundness, and roughness. Finally, we applied our method to an actual grain population to evaluate its effectiveness in a real-life scenario.
5.2.1 Grain image simulation
Crystals are limited to seven geometric lattice shapes, resulting in a finite number of 3D forms, including truncations. When observed in two dimensions, these forms offer more possibilities but remain confined to geometric objects, allowing them to be modeled using perfect polygons. To explore this further, we generated binary images of ideal geometric shapes having known parameters.
All parameter values were constrained using subjective criteria to maintain the visual resemblance to a grain (Figure 4). The shape size ranged from 300 to 600 pixels, on the basis of data from an earlier study (Back et al., 2023), where the average image size of segmented grains was 448 ± 158 by 447 ± 160 pixels (n = 1369). The orientation was randomized to test all possible scenarios and avoid bias. Thirteen different forms were studied: circle, triangle, square, rectangle, ellipse, pentagon, hexagon, heptagon, octagon, nonagon, decagon, hendecagon, and dodecagon. The roundness effect was achieved through a Minkowski sum operation using the Shapely library’s buffering function (“shapely.buffer—Shapely 2.0. 6 documentation) with a disc of radius equal to the desired buffer distance. The object was rescaled on the basis of its initial area to prevent excessive size reduction. The roundness value ranged from 0 to 6 with a step of 0.6 (Figure 4). At its miximum, the shape is highly circular but deviates from a perfect circle. The roughness was modeled using Perlin noise to imitate the visual complexity of natural objects (Perlin, 1985). This method has been used previously to generate 3D images of grains by deforming a geometrical form like a sphere (Al Ibrahim et al., 2019; Michot-Roberto et al., 2021). The roughness value ranged from 0 to 1.2 with a step of 0.12 and a fixed number of octaves set at 12 (Figure 4).
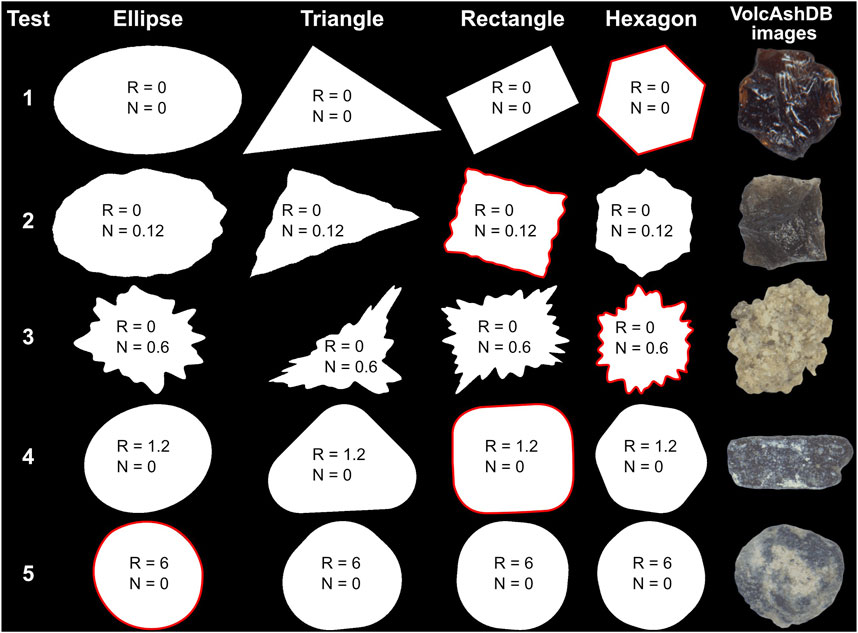
Figure 4. Examples of images generated for size, orientation, and form testing and their associated parameters (R: roundness value, N: Perlin noise strength) alongside grain images from the VolcAshDB database showing similar patterns (Benet et al., 2024).
Six tests were conducted for form analysis using different parameters (Table 2; Figure 4). Tests 1 and 8 evaluated the size and orientation methods, representing ideal shapes with no roundness or noise. The purpose was to understand the ability of form descriptors to distinguish between the 13 generated forms. Tests 2 and 3 examined the impact of roughness on form description, with low and maximum noise intensity, respectively. Similarly, tests 4 and 5 explored the influence of roundness. The objective was to discriminate between the forms and understand how roundness and roughness affect the method’s discrimination capacity. Test 8 replicated Test 1 with 25 images per form to assess reproducibility.
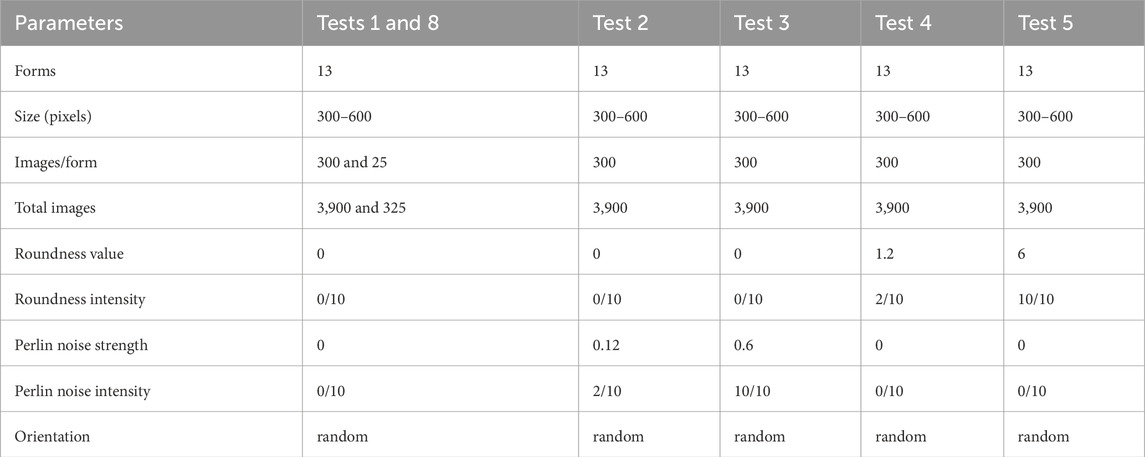
Table 2. Form tests and their related parameters.
To show the proximity of the generated grain images to real grain images characteristics, we present images extracted from the VolcAshDB (Benet et al., 2024; Figure 4). We used these images because they illustrate clearly the objective of the simulation.
5.2.2 Size measurement tests
The size measurement tests were performed on ideal shapes (Test 1, Table 2; Figure 4), and are expressed in pixels. Roundness and roughness modify the shape, altering the initial size and making the initial size parameters unsuitable as a reference. However, all shapes were randomly oriented from 0° to 180°. Size measurements were divided into two groups: methods that measure the long axis and methods that measure the short axis. The mean Feret diameter (Shang et al., 2018) or the equivalent area disc diameter (Bui et al., 1989; Fritz et al., 2022) were classified in both groups, as they do not measure a specific axis. For the short-axis test, only shapes with a known short axis measurement were used: circle, ellipse, square, and rectangle. To compare the methods, we calculated the reference deviation as
where
The initialization parameters for shape generation depended on the specific geometric form:
• Circle: Defined by a radius, which determines both the short and long axes.
• Pentagon to dodecagon: Defined by a radius that specifies the long axis, as the sides do not fully touch the circumscribing circle used to draw the form.
• Square: Defined by a side length, applicable to both the short and long axes.
• Rectangle and ellipse: Defined by two perpendicular axes: short and long.
• Triangle: Defined by base and height parameters, with height as the long axis and base as the short axis.
The reference deviation was used as an indicator because the length described by the shape initialization parameters differed from that of the size measurements (Equation 2). For example, the long-axis reference for a rectangle is its length, but the minimum circumscribed circle measures its diagonal. As a result, some of the high values and outliers of the reference deviation stemmed from this difference in measured axes.
5.2.3 Orientation measurement tests
The orientation tests were performed using an ellipse and a rectangle with distinct major and minor axes to determine their orientation. The shape generation parameters were identical to those of test 1. Two methods were tested: the second-moment of inertia orientation and the long-axis orientation. However, the long axis of the minimum enclosing rectangle and the second-moment axis of the same grain could differ; therefore, direct comparison is not appropriate. To address this, we measured the orientation using both methods, applied a known rotation to the particle, and then measured the orientation again. Finally, we used the equation below to calculate the rotation (Equation 3). All orientation and rotation values range from 0° to 180°.
where
5.2.4 Form descriptor tests
For form tests, all parameters in Table 1 were calculated using Python. Both the Rθ and elliptic Fourier methods were used with a range of harmonics from 1 to 12. The harmonic limit was arbitrarily set at 12; beyond this limit, the harmonics are related to roundness and roughness. Each harmonic amplitude was considered a separate form descriptor and was not merged into a single formula at this point. The ratios requiring axis measurements were calculated using the most accurate method based on our results. This process allowed us to fully evaluate the descriptors.
Several authors have highlighted that each descriptor has limitations. Even if they describe the same aspect of shape, such as roughness or form, they do not capture the entire phenomenon (Al-Rousan et al., 2007; Hentschel and Page, 2003; Tafesse et al., 2013). Hentschel and Page (2003) suggest that combining these descriptors could be a solution for capturing the complete information. In this paper, we identify the most discriminative combination of descriptors found in the literature. The best linear combination was determined using principal component analysis (PCA), which automatically weights the equation on the basis of the variance within the training data set (Abdi and Williams, 2010; Jolliffe and Cadima, 2016). This method provided significant results in sediment grain analysis using Fourier amplitude (Suzuki et al., 2015). A similar method has also been applied to otoliths (ear stones), small calcified structures in the inner ears of fish used to differentiate fish stocks on the basis of their shape variation, using both Fourier descriptors and classic shape descriptors such as elongation and rectangularity (He et al., 2018; Mérigot et al., 2007).
To prepare the data for PCA, the descriptors that were not directly extracted from the image were calculated, increasing the number of features from 42 to 51 (see the Appendix). As the descriptors come from 16 different scientific disciplines with different constraints, they should be able to describe the majority of shapes. Information such as grain perimeter and convex hull area was kept, as it can provide valuable information for discriminating between forms. Then, the entire data set was scaled using Equation 4
where
A first PCA analysis was conducted on the test 1 data set to select the most discriminant descriptors (approximately ten). Then, a second PCA was performed using only the ten retained descriptors. Feature reduction was necessary because the PCA included up to 51 features, some of which provided redundant information. For example, the Feret measurements and the inscribed and circumscribed circle diameters measure the same axis. From these results, we divided the second PCA into two parts: one using Rθ Fourier amplitudes and the other using elliptic Fourier amplitudes. Using them together was not relevant as they would both lose their respective advantages. The Rθ is more robust, but it cannot be used on concave grains, unlike the elliptic method.
To understand the effect of roundness and roughness on form discrimination obtained by PCA, we used images from tests 2 to 5 (Table 2; Figure 4). The data from these tests were processed in the same way as for test 1 (ideal form) and projected into both test 1 PCA domains, Rθ, and the elliptic Fourier.
5.3 Real grain images
To verify the applicability of this method to real-life situations, we acquired images of galena grains from glacial sediments, using the protocol of Back et al. (2023), with the acquisition parameters held constant, except for the change in light source to transmitted light and an exposure time of 364.2 µs.
Transmitted light images of opaque minerals provide clear grain outlines and simplify the segmentation process. The segmentation procedure involved 1) converting the image from RGB color space to grayscale; 2) applying a pixel intensity threshold set at 30; 3) implementing opening and closing operations to eliminate anomalous pixels in both the object and background; and 4) extracting each grain contour using the find Contours method from the Open CV library. Finally, the contours were filled with white (pixel intensity at 255), and the background was colored black (pixel intensity at 0), saving the result as a binary image. Some contours were manually removed because of acquisition artifacts caused by the stitching method of the Olympus Stream® software and touching grains. We used 580 galena grain images for training and 4 images for testing.
The PCA methodology used for the form analysis was replicated, starting with an initial PCA on all computed features. Then, using the loadings and explained variances, we selected the most discriminant descriptors (eight in this case), and a second PCA was performed exclusively on these descriptors. To ensure method reproducibility, four characteristic grains were removed from the PCA training data set and transformed into the PCA domain after the learning process.
6 Results
6.1 Size measurements
The size measurement methods exhibited significant differences between the short- and long-axis measurements (Figure 5). The short axis (Figure 5A) showed low reference deviation for the maximum inscribed circle, minimum Feret diameter, and bounding rectangle height; however, it showed a high reference deviation for the mean Feret diameter, equivalent-moment ellipse short axis, and equivalent area disc diameter. The long axis (Figure 5B) generally had higher values of reference deviation for all methods, and these differences can be attributed to the disparity between the measured axis in the measurement method and the reference axis of the shape (Figure 5).
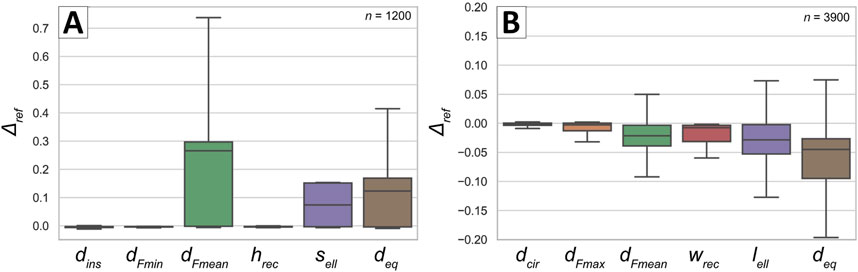
Figure 5. Boxplots showing the size measurement methods of the (A) short and (B) long axis as a function of the reference deviation (Equation 2); for illustration purposes the outliers are not shown. See Figure 2 and the Appendix for the definitions of the size measurement methods.
For the short-axis measurement, the reference deviation was −0.08 ± 0.10 (mean ± standard deviation) for the maximum inscribed circle diameter, −0.06 ± 0.06 for the minimum Feret diameter, 0.06 ± 0.17 for the mean Feret diameter, −0.05 ± 0.05 for the bounding rectangle height, −0.03 ± 0.11 for the equivalent-moment ellipse short axis, and −0.01 ± 0.12 for the equivalent area disc diameter. Given these results and the boxplot information (Figure 5A), the method having the lowest reference deviation and highest consistency was the bounding rectangle height.
For the long-axis measurements, the reference deviation was 0.07 ± 0.14 for the minimum circumscribed circle, 0.06 ± 0.15 for the maximum Feret diameter, 0.00 ± 0.10 for the mean Feret diameter, −0.01 ± 0.06 for the bounding rectangle width, −0.01 ± 0.08 for the equivalent-moment ellipse short axis, and −0.06 ± 0.10 for the equivalent area disc diameter. Despite its higher mean reference deviation and standard deviation, the minimum circumscribed circle diameter was the most consistent method, as highlighted by the boxplot graph (Figure 5B).
6.2 Orientation measurements
The long-axis orientation showed great precision for shapes having a clear long axis and a diameter elongation greater than 1.2 (Figure 6A). Below this value, the precision was highly variable. The second-moment orientation was less precise (Figure 6B), but all points remained within a 10% error margin, even for those with a very low elongation close to 1. This method was more accurate than the long-axis orientation for shapes with low elongation.
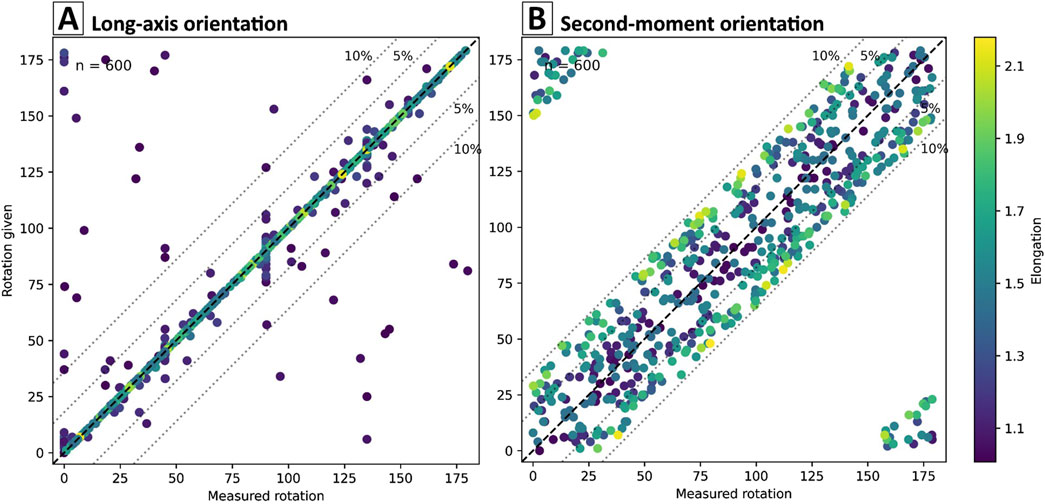
Figure 6. Scatterplots of the rotation given to the shape (rectangle or ellipse) versus the orientation measured for (A) the long-axis orientation and (B) the second-moment orientation. Point color reflects the degree of shape diameter elongation.
6.3 Framework tests on generated images
The first PCA loadings indicated the following parameters were being discriminant for the 13 ideal shapes: minimum circumscribed circle, mean Feret diameter, convex hull perimeter, maximum inscribed circle, rectangularity perimeter, and Fourier amplitude for both methods. The selected amplitudes were the 1st, 3rd, 4th, 6th, and 8th for the Rθ method and the 1st, 3rd, 5th, 7th, 9th, and 11th for the elliptic method (xy; Table 3). When two methods described the same aspects, e.g., minimum circumscribed circle and maximum Feret diameter, we selected the one with the highest loading value.
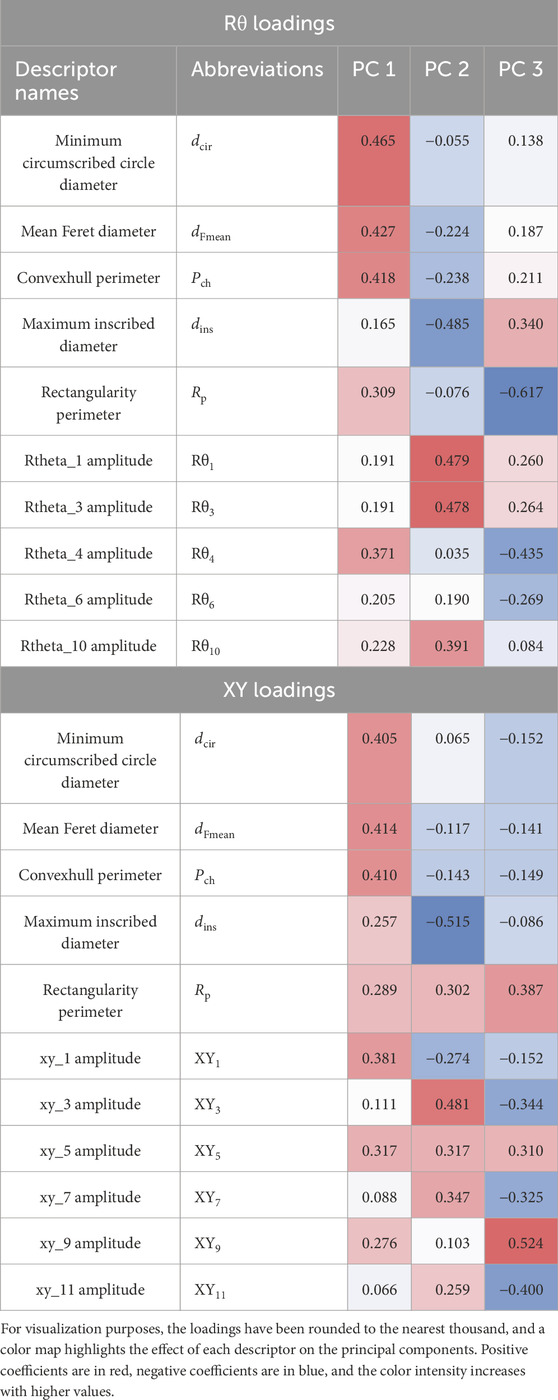
Table 3. Principal component analysis loadings for the Rθ and xy methods and their related descriptors.
In the second PCA, using the 10 and 11 selected descriptors for Rθ and xy, respectively, PC1 to PC3 collectively accounted for 87.0% and 83.8% of the total explained variance, with PC1 alone accounting for 43.9% and 49.4% for the Rθ and xy PCA, respectively.
Using Table 3, which presents the first three principal components of both methods, we could rebuild the principal component’s linear combinations (Equation 5) as
where
Figure 7 presents the PC2 and PC3 axes, as most differences were easily visible using this axis pair. The scatterplots of Figures 7A,B depict ideal shapes (without roughness and roundness), whereas those of Figures 7C,D represent shapes having maximum roughness. In the PCAs of Rθ (Figures 7A,C) and xy (Figures 7B,D), the Rθ clusters were more tightly defined and grouped than their xy counterparts. This divergence was greatest for the cases of maximum roughness (Figures 7C,D), making form discrimination challenging when using xy amplitudes. Nonetheless, even under these conditions, the Rθ PCA remained capable of differentiating triangular, circular (hexagons, ellipses, and circles), and rectangular (squares, rectangles) shapes, thereby highlighting the robustness of the Rθ method. Given the negligible contribution of concave segments of the grain perimeter to its form description, coupled with the Rθ method’s ability to retain discrimination capability even in noisy conditions, Rθ amplitudes emerged as a preferred method for describing shapes.
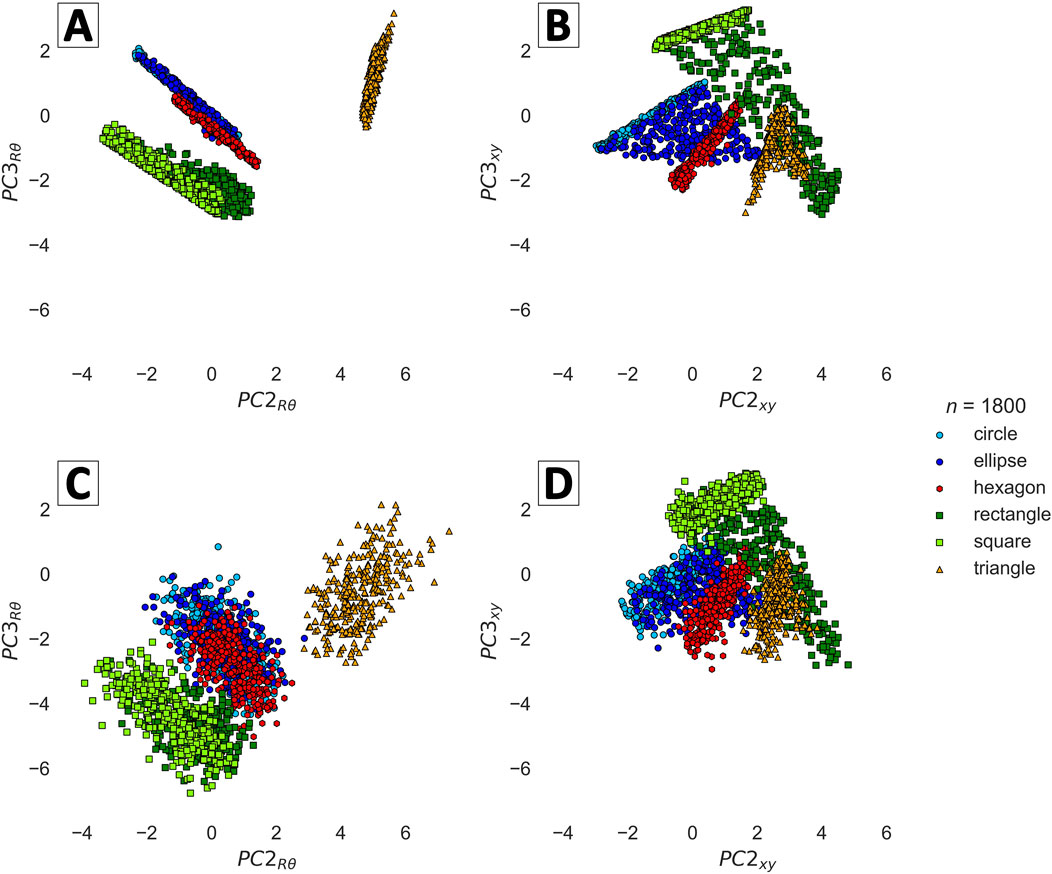
Figure 7. PCA scatterplots showing the difference between the (A, C) Rθ and (B, D) xy methods for the (A, B) test 1 and (C, D) test 5 data sets. Only six forms are presented for visualization purposes.
Figure 8 illustrates the effect of roughness on the Rθ PCA. Roughness had a significant effect on PC1 and a smaller effect on PC2 and PC3 (Figures 8A,C). Moreover, the Rθ method retained its ability to distinguish triangular, circular, and rectangular forms despite elevated roughness.
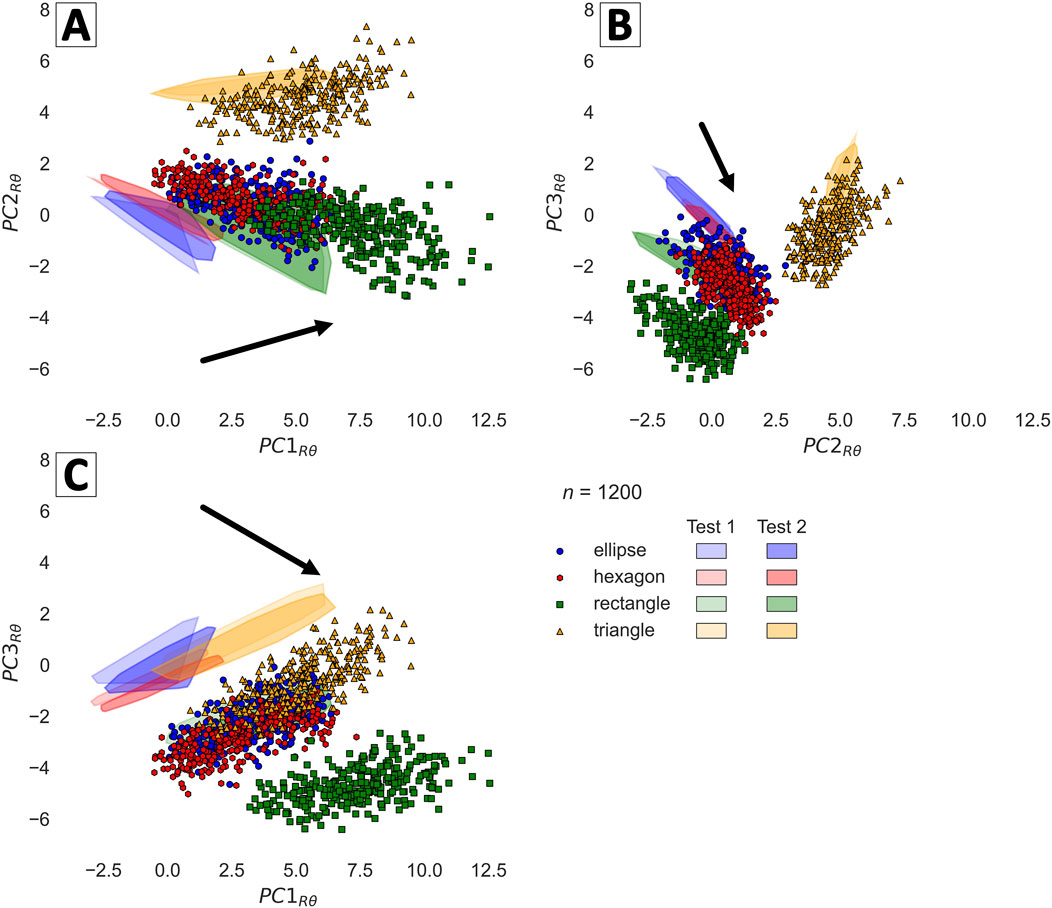
Figure 8. Rθ PCA plots showing the evolution of form with increasing roughness for the different PC axes (A–C). Color zones represent the form at differing roughness: test 1 (the most transparent, N = 0) and test 2 (N = 0.12); the scatterplots represent test 3 having a maximum roughness (N = 0.6); the arrow highlights the data dispersion with increasing roughness.
Figure 9 illustrates the effect of roundness on the Rθ PCAs. All graphs (Figures 9A–C) demonstrated that form recognition using Rθ amplitudes was greatly affected by roundness, and no PC showed any apparent reduced effect from roundness. All the shape clusters tended to be attracted toward the circle cluster, making initial form recognition more difficult as roundness increased.
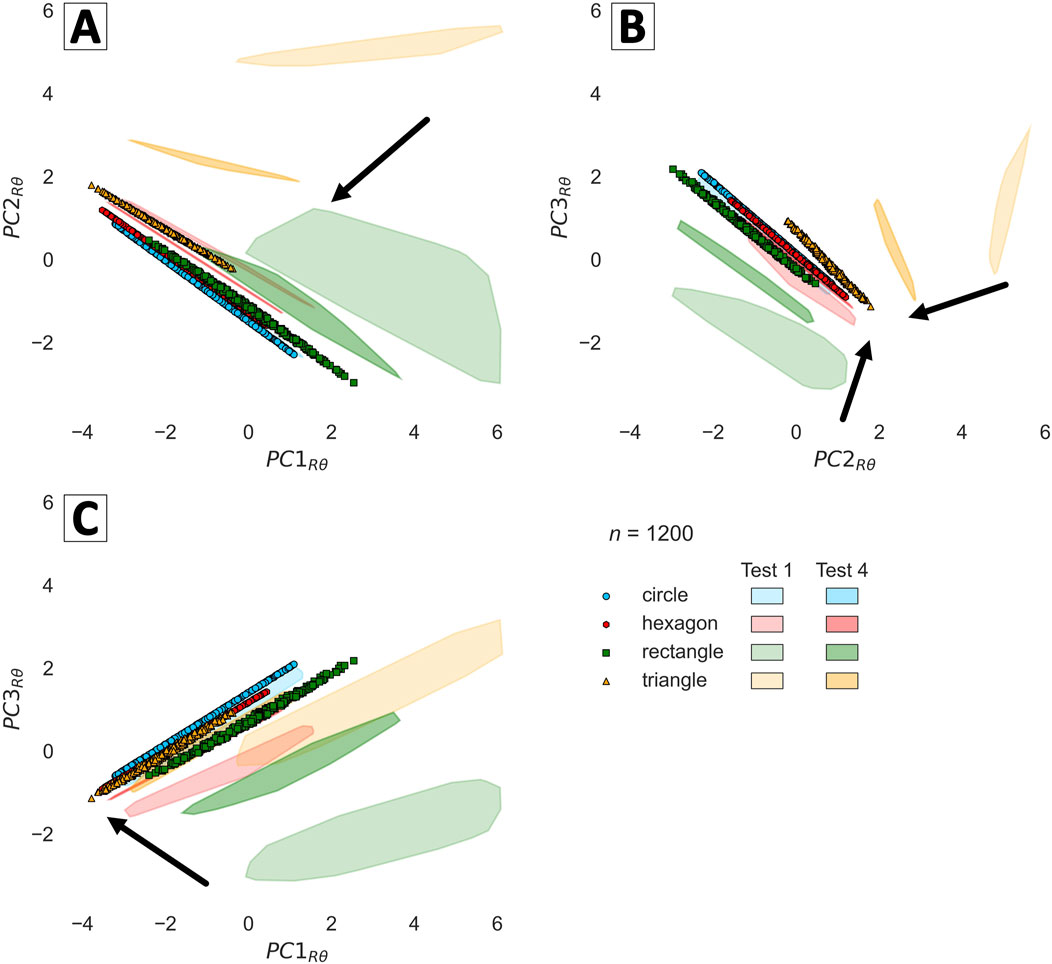
Figure 9. Rθ PCA plots showing the evolution of form with increasing roundness for the different PC axes (A–C). The color zones represent the form at a different roundness: test 1 (the most transparent, R = 0) and test 4 (R = 1.2); the scatterplot represents test 5 with the maximum roundness (R = 6); the arrow highlights the data dispersion with increasing roundness.
In Figure 10, we divided the 13 forms into two columns for better visualization. The left-hand column zooms in slightly on the PCA axes to distinguish differences between forms approximating a circle (high number of sides). The right-hand column shows the remaining forms. The delineated zones represent the convex hull of the test 1 and test 8 data sets. Tests 1 and 8 are distinct data sets of ideal shape images characterized by identical parameters (R and N were set at 0), demonstrating excellent reproducibility. Pentagons, hexagons, and decagons were clearly distinguished in Figures 10A,E, whereas shapes with fewer than four sides were easily discriminated in Figures 10B,D,F. The scatterplot PC2 vs PC3 (Figure 10D) best discriminated these forms. The circle and square are particular cases of the ellipse and rectangle, respectively, having a constant side length. Both form clusters appeared as a straight line at the longest extremity of their respective form cluster (Figures 7B,9B,D,F).
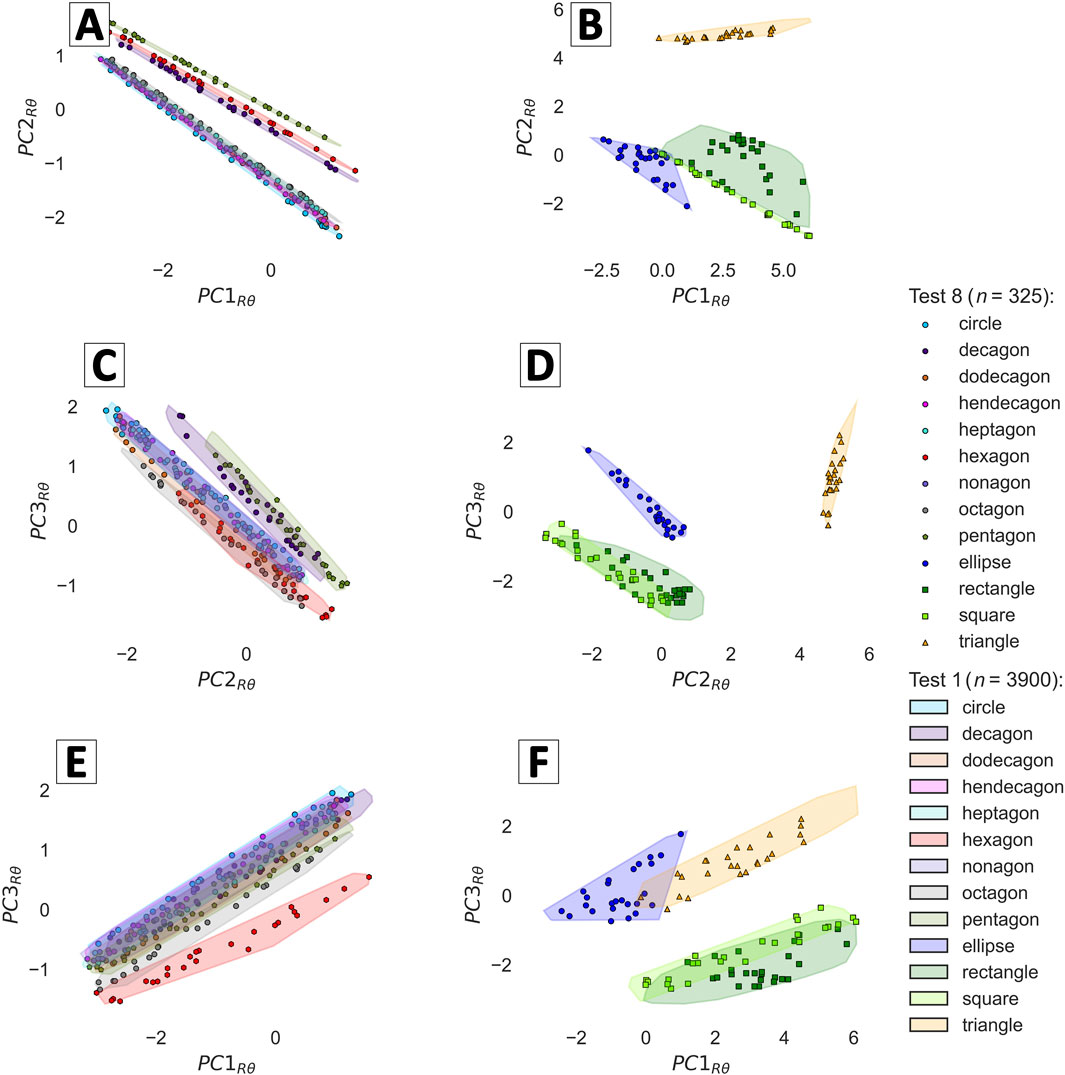
Figure 10. Rθ PCA plot showing the 13 forms divided into two columns for visualization purposes. Subplots (A,C,E) present a close-up of the PC axes, showing the differences between shapes close to a circle (high number of sides), while subplots (B,D,F) present the other shapes. The zones and the points represent the convex hull of the test 1 data and test 8 data, respectively.
6.4 Framework validation with real grain images
After validating our approach using generated images, we then applied our process to actual images of galena grains. The first PCA loadings indicated that particle perimeter, polygon to circle area, diameter elongation, minimum circumscribed circle diameter, maximum inscribed circle diameter, circularity, and the first and third amplitudes of the elliptic Fourier method were discriminant form descriptors for the galena grain population. A second PCA that applied the eight selected descriptors had PC1 to PC3 collectively accounting for 94.4% of the total explained variance, with PC1 alone accounting for 53.2%. The other PCs were omitted, as they did not significantly contribute to shape discrimination. Loadings of the first three principal components for the eight descriptors are presented in Table 4.
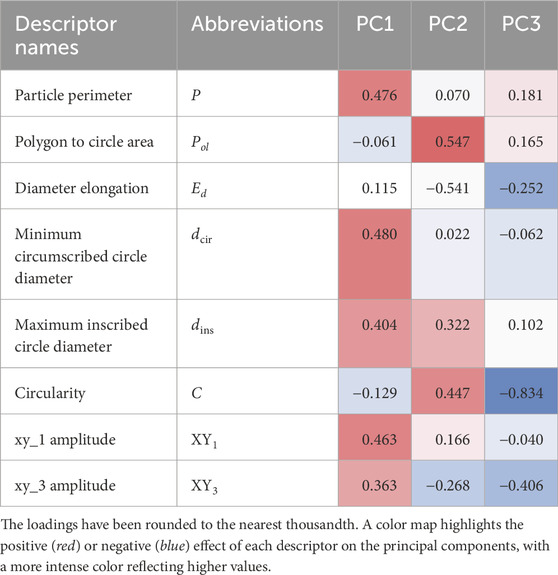
Table 4. Principal component analysis loadings for the galena grains and their related descriptors.
The PCA output for the galena binary images demonstrated how the first principal component sorted the galena grains by size (Figures 11A,C). The scatterplots were consistent with the grain data set image (Figure 11E), and clearly showed a large number of small grains around 180 pixels (e.g., grains 263, 391, and 494) and a smaller number of larger grains, e.g., grain 101 (Figure 11D). PC2 distinguished rounded and elongated rectangular grains, as indicated by its high positive or negative loadings for the polygon to circle area, circularity, and diameter elongation. These loadings values are in accordance with the grain position (Figure 11D) along PC2 (Figures 11A,B), ranging from the most rectangular and elongated grain 391 to the less elongated subangular grain 494 to the sub-round grain 101 and finally to rounded grain 263 having a low diameter elongation of 1.19. PC2 accurately reflected the shapes observed in the grain data set image (Figure 11E), with a small number of well-rounded and very elongated rectangular grains, most being rectangular grains similar to that of grain 494. Finally, PC3 described both grain roughness and roundness, with smooth and rounded particles (e.g., grains 263, 494, and 101) having low values and grains with angular and complex outlines (e.g., grain 391) having higher values (Figures 11B–D).
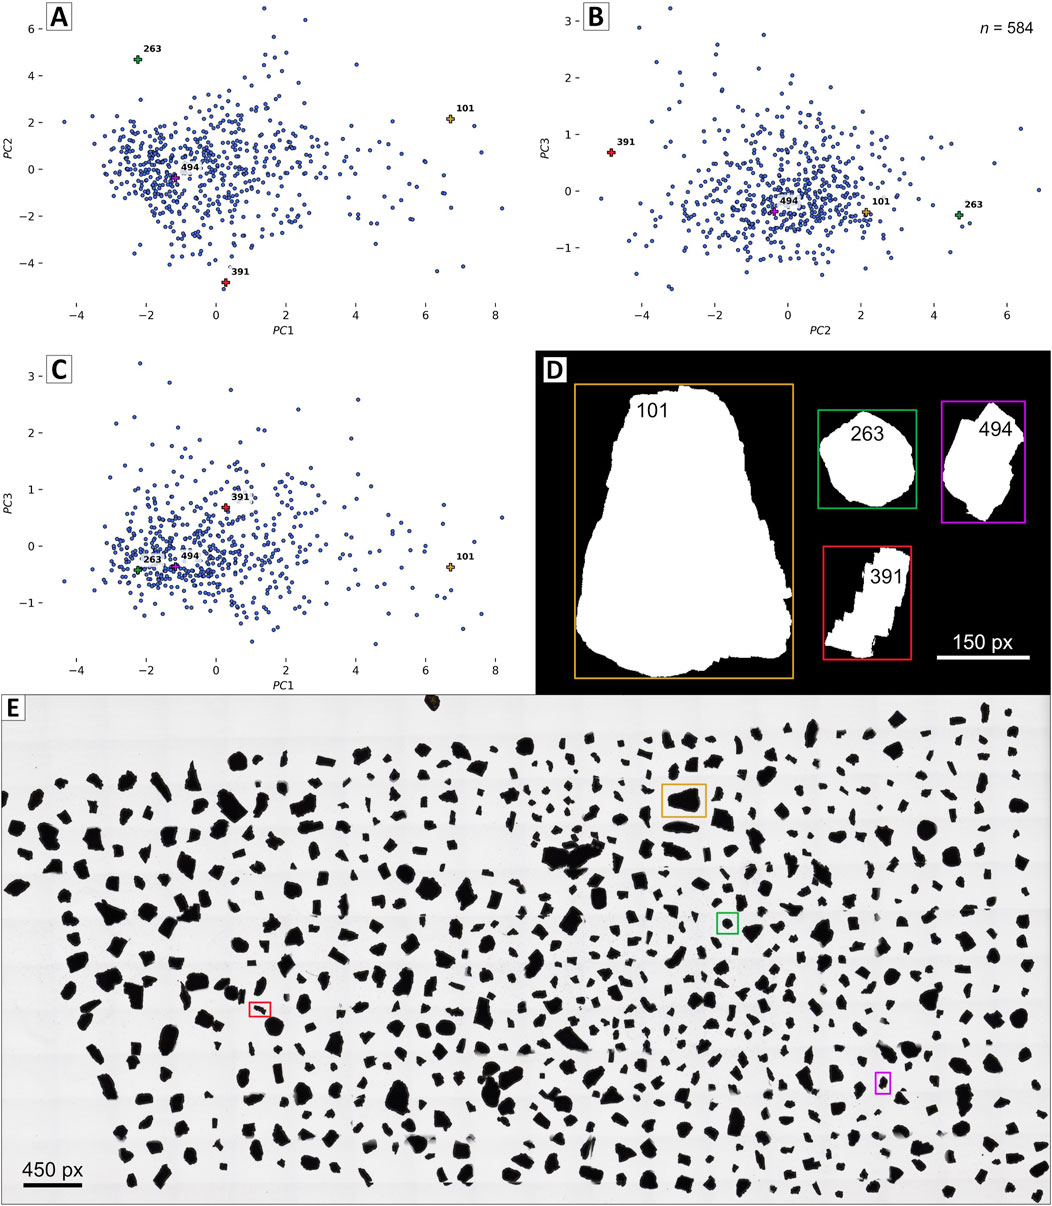
Figure 11. PCA plots obtained with galena grain images for the three principal components (A–C), showing both the training data (blue points) and testing data (plus signs), (D) alongside their binary images and (E) the transmitted light image of the entire galena data set.
In conclusion, the PCAs indicated that the galena grain population consisted mainly of small stubby rectangular subangular grains, such as grain 494, with a smaller proportion of grains that were either well rounded (263) or very elongated (391). This quantitative description of the grains aligned perfectly with the grain data set image showing the same patterns (Figure 11E). An interactive graph displaying each point within the PCA plots, along with the corresponding grain images, can be accessed at https://pca-grain-shapes.onrender.com. The loading of the webpage may take a while.
7 Discussion
This article aims to quantitatively describe the form of an object using PCA. It presents a framework for adapting this method to other studies and provides the formulas and Python functions.
7.1 Methodology
The objects used in this framework are binary images obtained from an image generation pipeline or a segmented transmitted light microscope image. This technique can be applied to any image as long as a precise contour of the object of study is obtained and transformed into a 2D-binary image. However, the image resolution must exceed a certain threshold to obtain unbiased results. This threshold can vary depending on the applied descriptor; for the tested form descriptors, a higher threshold of 130 pixels is set for object length (Sun et al., 2019). The segmentation technique must also be coherent with the image and mineral properties to ensure proper segmentation. Segmentation inaccuracies can produce significant errors in the shape descriptor results (Zheng and Hryciw, 2016).
Regarding the generated images, there are newer tools available for simulating more realistic grain images (Mollon and Zhao, 2013). However, evaluating the Fourier amplitudes on generated images using the same techniques and tools would be inappropriate, given their reliance on Fourier’s methods.
The most commonly used formula (see Appendix B) is used to compute circularity. However, there exists a wide range of formulas for circularity, differing in whether the circularity is squared or square-rooted. These equations describe the same concept, but the distribution of the function changes. This change highlights differences within certain intervals of x. For example, the square root exaggerates x values between 0 and 1, whereas the square exaggerates high values of x. Using PCA, we can determine which of those functions has a greater effect, providing valuable insights into a data set. If the square root of circularity has a more significant effect on the variance, it indicates that the differences in our data set lie in very low circularity values, illustrating the degree of roundness of the grains. Emphasizing these differences will assist with clustering in a later step.
7.2 Results
Form discrimination can be improved in several ways. First, the orientation of objects influences the results of the Fourier method because of the finite number of pixels (Wettimuny and Penumadu, 2004). Aligning all objects in the same direction would reduce this influence. Additionally, using the convex hull rather than the actual grain outline for rough shapes can minimize the roughness effect and improve form recognition. The form of the grain convex hull can be considered as the grain form. Finally, size difference affects PCA output. Scaling all images to the same height or width while maintaining the aspect ratio should, therefore, enhance form discrimination.
Our PCA output demonstrated that roundness and roughness significantly influence form descriptors, and the reverse should also be true. Therefore, including roundness and roughness descriptors in the PCA analysis will enhance form discrimination.
Regarding the analysis of real grain images, we focus on galena grains extracted from glacial sediments. Within this population, only a few grains are large (exceeding a value of 4 on PC1), and none exhibit a high degree of roundness. Additionally, many grains, such as grain 494, are medium-sized and exhibit a rounded side along with an angular one, leading to their classification as sub-rounded. Given galena’s perfect cleavage properties, it is plausible that large grains often fracture into smaller pieces, resulting in grains showing an angular and rounded side. These shape analysis results are consistent with a short distance of glacial transport for such minerals (Paulen et al., 2011). With extended transport, sub-rounded grains would likely become smaller, as they would result from the separation of medium-rounded grains and the number of medium-rounded grains would increase.
7.3 Future directions
Our results on real grain images (Figure 11) demonstrated that combining PCA with form descriptors can reveal shape patterns within the data set. The next step is to use clustering algorithms on the captured PCA data to automatically identify and quantify the number of distinct grain shape clusters and the number of grains in each category. However, a greater distance between points is required to cluster the data set more accurately and efficiently. In a future study, we will enhance these differences by including the roundness and roughness descriptors.
More advanced techniques, such as machine-learning algorithms (Li and Iskander, 2022), can be applied to the data generated by all form descriptors. Nevertheless, PCA retains the advantage of interpretability. The loadings indicate the role of each descriptor in shape discrimination, and the related formulas help understand the physical parameters underlying these variations.
7.4 Potential applications of the method
The quantitative framework for grain shape analysis proposed in this study has significant potential for applications in various real-world scenarios. The proposed method can be directly applied to geological problems where object shape is a critical factor. It has the potential to advance research applications, such as developing a quantitative zircon classification algorithm inspired by Pupin (1980), or addressing exploration challenges, like gold grain classification in till sediments, which relies on morphological characteristics (Girard et al., 2021).
This approach could also help in planetary science, where chondrule shape and size analysis provides valuable insights into the relationships among meteorite groups, the classification of ungrouped chondrites, and the temporal and spatial variability within the solar nebula (Ebel et al., 2024; Floyd et al., 2024). Moreover, the shape (or texture) of the corundum-bearing Ca–Al-rich inclusions found within chondrites could indicate different origins for these inclusions: condensation (rough and irregular) or crystallization from a melt (rounded inclusion with radiated corundum; Needham et al., 2017).
The method also holds potential for industrial applications. For instance, geometallurgy relies on a quantitative understanding of the characteristics of primary resources (Frenzel et al., 2023), with shape being a key factor. Improved measurement of roughness, and by extension, surface area could enhance understanding of grain flotation capacity (Wang and Zhang, 2020), aiding in the optimization of flotation processes. Additionally, more consistent size measurements would contribute to the improved design of gravimetric separation processes, where size plays a critical role (Andò, 2020).
The shape of soil grains plays a crucial role in determining various soil properties, significantly impacting geotechnical behavior. Studies have shown that grain shape influences factors such as compaction, permeability, and shear strength (Altuhafi et al., 2016; Lu et al., 2019). For instance, rough grains tend to interlock more effectively than rounded grains, resulting in higher shear strength (Lu et al., 2019) and better stability in soil structures. Additionally, the arrangement and packing of different grain shapes can affect the void ratio and porosity of the soil (Lu et al., 2019), which in turn influences water retention and drainage capabilities. As a result, understanding and analyzing grain shape is essential for predicting soil behavior in engineering applications, ensuring the reliability and safety of geotechnical projects.
Finally, by offering a reproducible and adaptable tool, this approach could enhance precision and standardize grain analysis practices across disciplines. Future studies should further explore these applications. It includes integrating the methodology with different imaging techniques and assessing its impact on existing practices in related fields. Such efforts will help fully realize the broader utility and influence of this framework.
8 Conclusion
The framework proposed in this study offers an alternative to the question, “What are the best descriptors?”. The idea is to identify and use the most meaningful descriptors to describe the shape data set. This approach involves three main steps: 1) obtaining the grain contours and calculating all form descriptors; 2) conducting a first PCA to select the appropriate descriptors using the eigenvectors and the total explained variance; and 3) conducting a second PCA using the selected descriptors.
The comprehensive literature review on shape descriptors enabled us to identify and compute meaningful size, orientation, and form descriptors (available on GitHub). The size measurements and PCA outputs clearly demonstrated that the most precise measurements for the long and short axes were the minimum circumscribed circle diameter and the maximum inscribed circle diameter, respectively (Figure 5; Tables 3, 4). However, the minimum enclosing rectangle also yielded excellent results for both size and orientation measurements using the long axis (Figures 5, 6). The advantage of this descriptor lies in directly measuring the object’s length rather than the longest distance, which could be a diagonal in the case of a rectangle. Selecting the appropriate size measurement enables the most accurate computation of form descriptors.
The form descriptors, when applied in PCA, successfully discriminated 8 of the 13 ideal shapes (Figure 10), showcasing the precision achievable with noiseless data. When applied to a real grain population, our method produced very promising results by effectively and quantitatively describing the shape tendencies within a galena grain population (Figure 11). These results also underscored the significant influence of roundness and roughness on form descriptors (Figures 8, 9, 11), elucidating the challenges in identifying the best descriptors. In conclusion, the capacity of PCA to discriminate shapes and the difficulty in finding ideal descriptors emphasize the relevance of our approach. The inclusion of descriptors dedicated to roughness and roundness, as a continuation of this study, will enhance the description and discrimination of grain shape.
Data availability statement
The original contributions presented in this study are included in the Supplementary Material, except for the images datasets which are available on the following GitHub repository: https://github.com/AL-Back/PCA_grain_shapes/tree/main/Image_datasets. The descriptors python library can be found on GitHub as well, in the following repository: https://github.com/Cyrilkt/Image-Processing-Descriptors. Further inquiries can be directed to the corresponding author.
Author contributions
ALB: Conceptualization, Formal Analysis, Methodology, Visualization, Writing–original draft, Writing–review and editing. CKT: Software, Validation, Writing–review and editing. LPB: Conceptualization, Funding acquisition, Methodology, Project administration, Supervision, Validation, Writing–review and editing. AB: Supervision, Validation, Writing–review and editing.
Funding
The author(s) declare that financial support was received for the research, authorship, and/or publication of this article. This research is funded by a Fonds de Recherche du Québec—Nature et Technologies (FRQ-NT) and Ministère des Ressources naturelles et Forêt du Québec (MRNF) grant to LPB. (Programme de recherche en partenariat sur le développement durable du secteur minier-II, grant number: 2020-MN-283346) with contributions from IOS Services Géoscientifiques Inc. ALB received fellowships from FUQAC, MAC and IAMG. The authors declare that this study received funding from IOS Services Géoscientifiques Inc. The funder was not involved in the study design, collection, analysis, interpretation of data, the writing of this article, or the decision to submit it for publication.
Acknowledgments
Réjean Girard is thanked for his valuable contributions and the energy he shared. Maxafeau editing services (Chicoutimi, Québec, Canada) verified the English of the second last version of this manuscript. We thank the reviewers and editor for their help in improving this manuscript.
Conflict of interest
The authors declare that the research was conducted in the absence of any commercial or financial relationships that could be construed as a potential conflict of interest.
Generative AI statement
The author(s) declare that Generative AI was used in the creation of this manuscript. For english verification and amelioration.
Publisher’s note
All claims expressed in this article are solely those of the authors and do not necessarily represent those of their affiliated organizations, or those of the publisher, the editors and the reviewers. Any product that may be evaluated in this article, or claim that may be made by its manufacturer, is not guaranteed or endorsed by the publisher.
Supplementary material
The Supplementary Material for this article can be found online at: https://www.frontiersin.org/articles/10.3389/feart.2025.1508690/full#supplementary-material
References
Abdi, H., and Williams, L. J. (2010). Principal component analysis. WIREs Comput. Stat. 2, 433–459. doi:10.1002/wics.101
Al Ibrahim, M. A., Kerimov, A., Mukerji, T., and Mavko, G. (2019). Particula: a simulator tool for computational rock physics of granular media. Geophysics 84, F85–F95. doi:10.1190/geo2018-0481.1
Al-Raoush, R. (2007). Microstructure characterization of granular materials. Phys. Stat. Mech. Its Appl. 377, 545–558. doi:10.1016/j.physa.2006.11.090
Al-Rousan, T., Masad, E., Tutumluer, E., and Pan, T. (2007). Evaluation of image analysis techniques for quantifying aggregate shape characteristics. Constr. Build. Mat. 21, 978–990. doi:10.1016/j.conbuildmat.2006.03.005
Altuhafi, F. N., Coop, M. R., and Georgiannou, V. N. (2016). Effect of particle shape on the mechanical behavior of natural sands. J. Geotech. Geoenvironmental Eng. 142, 04016071. doi:10.1061/(ASCE)GT.1943-5606.0001569
Andò, S. (2020). Gravimetric separation of heavy minerals in sediments and rocks. Minerals 10, 273. doi:10.3390/min10030273
Arasan, S., Akbulut, S., and Hasiloglu, A. S. (2011). The relationship between the fractal dimension and shape properties of particles. KSCE J. Civ. Eng. 15, 1219–1225. doi:10.1007/s12205-011-1310-x
Back, A. L., Bédard, L. P., Maitre, J., and Bouchard, K. (2023). From rocks to pixels: a protocol for reproducible mineral imaging and its applications in machine learning. Minerals 14, 51. doi:10.3390/min14010051
Banerjee, S., Chakraborti, P. C., and Saha, S. K. (2019). An automated methodology for grain segmentation and grain size measurement from optical micrographs. Measurement 140, 142–150. doi:10.1016/j.measurement.2019.03.046
Barrett, P. J. (1980). The shape of rock particles, a critical review. Sedimentology 27, 291–303. doi:10.1111/j.1365-3091.1980.tb01179.x
Benet, D., Costa, F., Widiwijayanti, C., Pallister, J., Pedreros, G., Allard, P., et al. (2024). VolcAshDB: a Volcanic Ash DataBase of classified particle images and features. Bull. Volcanol. 86, 9. doi:10.1007/s00445-023-01695-4
Bui, E. N., Mazzullo, J. M., and Wilding, L. P. (1989). Using quartz grain size and shape analysis to distinguish between aeolian and fluvial deposits in the Dallol Bosso of Niger (West Africa). Earth Surf. Process. Landf. 14, 157–166. doi:10.1002/esp.3290140206
Caple, J., Byrd, J., and Stephan, C. N. (2017). Elliptical Fourier analysis: fundamentals, applications, and value for forensic anthropology. Int. J. Leg. Med. 131, 1675–1690. doi:10.1007/s00414-017-1555-0
Chandan, C., Sivakumar, K., Masad, E., and Fletcher, T. (2004). Application of imaging techniques to geometry analysis of aggregate particles. J. Comput. Civ. Eng. 18, 75–82. doi:10.1061/(ASCE)0887-3801(2004)18:1(75)
Chen, Y., Yi, Y., Dai, Y., and Shi, X. (2024). A multiangle polarised imaging-based method for thin section segmentation. J. Microsc. n/a 294, 14–25. doi:10.1111/jmi.13261
Cho, G. C., Dodds, J., and Santamarina, C. J. (2006). Particle shape effects on packing density, stiffness, and strength: natural and crushed sands. J. Geotech. Geoenviron 132 (5), 591–602. doi:10.1061/(asce)1090-0241(2006)132:5(591)
Cox, M. R., and Budhu, M. (2008). A practical approach to grain shape quantification. Eng. Geol. 96, 1–16. doi:10.1016/j.enggeo.2007.05.005
Diepenbroek, M., Bartholomä, A., and Ibbeken, H. (1992). How round is round? A new approach to the topic ‘roundness’by Fourier grain shape analysis. Sedimentology 39, 411–422. doi:10.1111/j.1365-3091.1992.tb02125.x
Ebel, D. S., Weisberg, M. K., Hertz, J., and Campbell, A. J. (2024). Shape, metal abundance, chemistry, and origin of chondrules in the Renazzo (CR) chondrite.
Floyd, C. J., Benito, S., Martin, P.-E., Jenkins, L. E., Dunham, E., Daly, L., et al. (2024). Chondrule sizes within the CM carbonaceous chondrites and measurement methodologies. Meteorit. Planet. Sci. 59, 2769–2788. doi:10.1111/maps.14250
Folk, R. L. (1951). A comparison chart for visual percentage estimation. J. Sediment. Res. 21. doi:10.1306/d4269413-2b26-11d7-8648000102c1865d
Frenzel, M., Baumgartner, R., Tolosana-Delgado, R., and Gutzmer, J. (2023). Geometallurgy: present and future. Elements 19, 345–351. doi:10.2138/gselements.19.6.345
Fritz, M., Körsten, S., Chen, X., Yang, G., Lv, Y., Liu, M., et al. (2022). High-resolution particle size and shape analysis of the first Samarium nanoparticles biosynthesized from aqueous solutions via cyanobacteria Anabaena cylindrica. NanoImpact 26, 100398. doi:10.1016/j.impact.2022.100398
Garzanti, E., Resentini, A., Andò, S., Vezzoli, G., Pereira, A., and Vermeesch, P. (2015). Physical controls on sand composition and relative durability of detrital minerals during ultra-long distance littoral and aeolian transport (Namibia and southern Angola). Sedimentology 62, 971–996. doi:10.1111/sed.12169
Girard, R., Tremblay, J., Néron, A., Longuépée, H., and Makvandi, S. (2021). Automated gold grain counting. Part 2: what a gold grain size and shape can tell. Minerals 11, 379. doi:10.3390/min11040379
Goldstone, R. L. (1993). Feature distribution and biased estimation of visual displays. J. Exp. Psychol. Hum. Percept. Perform. 19, 564–579. doi:10.1037/0096-1523.19.3.564
Haffar, I., Flin, F., Geindreau, C., Petillon, N., Gervais, P.-C., and Edery, V. (2021). X-ray tomography for 3D analysis of ice particles in jet A-1 fuel. Powder Technol. 384, 200–210. doi:10.1016/j.powtec.2021.01.069
Han, Z., Zhang, Y., Zhang, W., Qiao, H., Feng, Q., Xue, C., et al. (2023). Study on comprehensive morphological parameters of manufactured sand based on CT scanning and entropy method and its application in rheology of manufactured sand mortar. Constr. Build. Mat. 370, 130628. doi:10.1016/j.conbuildmat.2023.130628
He, T., Cheng, J., Qin, J., Li, Y., and Gao, T. (2018). Comparative analysis of otolith morphology in three species of Scomber. Ichthyol. Res. 65, 192–201. doi:10.1007/s10228-017-0605-4
Hentschel, M. L., and Page, N. W. (2003). Selection of descriptors for particle shape characterization. Part. Part. Syst. Charact. 20, 25–38. doi:10.1002/ppsc.200390002
Hibbard, M. J. (1994). Petrographic classification of crystal morphology. J. Geol. 102, 571–581. doi:10.1086/629699
Higgins, M. (2000). Measurement of crystal size distributions. Am. Mineral. 85, 1105–1116. doi:10.2138/am-2000-8-901
Higgins, M. D. (2002). A crystal size-distribution study of the Kiglapait layered mafic intrusion, Labrador, Canada: evidence for textural coarsening. Contrib. Mineral. Pet. 144, 314–330. doi:10.1007/s00410-002-0399-9
Higgins, M. D. (2006). Quantitative textural measurements in igneous and metamorphic petrology. Cambridge: Cambridge University Press.
Huddart, D., Bennett, M. R., Hambrey, M. J., Glasser, N. F., and Crawford, K. (1998). Origin of well-rounded gravels in glacial deposits from Brggerhalvya, northwest Spitsbergen: potential problems caused by sediment reworking in the glacial environment. Polar Res. 17, 61–70. doi:10.1111/j.1751-8369.1998.tb00259.x
Huo, Y., Liu, T., Liu, H., Ma, C. Y., and Wang, X. Z. (2016). In-situ crystal morphology identification using imaging analysis with application to the L-glutamic acid crystallization. Chem. Eng. Sci. 148, 126–139. doi:10.1016/j.ces.2016.03.039
Igathinathane, C., Pordesimo, L. O., Columbus, E. P., Batchelor, W. D., and Methuku, S. R. (2008). Shape identification and particles size distribution from basic shape parameters using ImageJ. Comput. Electron. Agric. 63, 168–182. doi:10.1016/j.compag.2008.02.007
Jolliffe, I. T., and Cadima, J. (2016). Principal component analysis: a review and recent developments. Philos. Trans. R. Soc. Math. Phys. Eng. Sci. 374, 20150202. doi:10.1098/rsta.2015.0202
Krumbein, W. C. (1941). Measurement and geological significance of shape and roundness of sedimentary particles. J. Sediment. Res. 11, 64–72. doi:10.1306/D42690F3-2B26-11D7-8648000102C1865D
Kuo, C.-Y., and Freeman, R. B. (2000). Imaging indices for quantification of shape, angularity, and surface texture of aggregates. Transp. Res. Rec. 1721, 57–65. doi:10.3141/1721-07
Latif, G., Bouchard, K., Maitre, J., Back, A., and Bédard, L. P. (2022). Deep-learning-based automatic mineral grain segmentation and recognition. Minerals 12, 455. doi:10.3390/min12040455
Li, L., and Iskander, M. (2022). Use of machine learning for classification of sand particles. Acta Geotech. 17, 4739–4759. doi:10.1007/s11440-021-01443-y
Li, R., Lu, W., Chen, M., Wang, G., Xia, W., and Yan, P. (2021). Quantitative analysis of shapes and specific surface area of blasted fragments using image analysis and three-dimensional laser scanning. Int. J. Rock Mech. Min. Sci. 141, 104710. doi:10.1016/j.ijrmms.2021.104710
Lu, H., Ip, E., Scott, J., Foster, P., Vickers, M., and Baxter, L. L. (2010). Effects of particle shape and size on devolatilization of biomass particle. Fuel 89, 1156–1168. doi:10.1016/j.fuel.2008.10.023
Lu, Z., Yao, A., Su, A., Ren, X., Liu, Q., and Dong, S. (2019). Re-recognizing the impact of particle shape on physical and mechanical properties of sandy soils: a numerical study. Eng. Geol. 253, 36–46. doi:10.1016/j.enggeo.2019.03.011
Maerz, N. H. (2004). Technical and computational aspects of the measurement of aggregate shape by digital image analysis. J. Comput. Civ. Eng. 18, 10–18. doi:10.1061/(ASCE)0887-3801(2004)18:1(10)
Maroof, M. A., Mahboubi, A., and Noorzad, A. (2020a). A new method to determine specific surface area and shape coefficient of a cohesionless granular medium. Adv. Powder Technol. 31, 3038–3049. doi:10.1016/j.apt.2020.05.028
Maroof, M. A., Mahboubi, A., Noorzad, A., and Safi, Y. (2020b). A new approach to particle shape classification of granular materials. Transp. Geotech. 22, 100296. doi:10.1016/j.trgeo.2019.100296
Marsh, B. D. (1988). Crystal size distribution (CSD) in rocks and the kinetics and dynamics of crystallization. Contrib. Mineral. Pet. 99, 277–291. doi:10.1007/BF00375362
Medalia, A. I. (1971). Dynamic shape factors of particles. Powder Technol. 4, 117–138. doi:10.1016/0032-5910(71)80021-9
Mérigot, B., Letourneur, Y., and Lecomte-Finiger, R. (2007). Characterization of local populations of the common sole Solea solea (Pisces, Soleidae) in the NW Mediterranean through otolith morphometrics and shape analysis. Mar. Biol. 151, 997–1008. doi:10.1007/s00227-006-0549-0
Michot-Roberto, S., Garcia-Hernández, A., Dopazo-Hilario, S., and Dawson, A. (2021). The spherical primitive and purlin noise method to recreate realistic aggregate shapes. Granul. Matter 23, 41. doi:10.1007/s10035-021-01105-6
Mollon, G., and Zhao, J. (2013). Generating realistic 3D sand particles using Fourier descriptors. Granul. Matter 15, 95–108. doi:10.1007/s10035-012-0380-x
Murphy, C. P., and Kemp, R. A. (1984). The over-estimation of clay and the under-estimation of pores in soil thin sections. J. Soil Sci. 35, 481–495. doi:10.1111/j.1365-2389.1984.tb00305.x
Nédélec, A., and Bouchez, J. L. (2015). Granites: petrology, structure, geological setting, and metallogeny. Oxford University Press.
Needham, A. W., Messenger, S., Han, J., and Keller, L. P. (2017). Corundum–hipboneite inclusions and the environments of high temperature processing in the early Solar System. Geochim. Cosmochim. Acta 196, 18–35. doi:10.1016/j.gca.2016.04.022
Paulen, R. C., Paradis, S., Plouffe, A., and Smith, I. R. (2011). Pb and S isotopic composition of indicator minerals in glacial sediments from NW Alberta, Canada: implications for Zn-Pb base metal exploration. Geochem. Explor. Environ. Anal. 11, 309–320. doi:10.1144/1467-7873/10-IM-032
Perlin, K. (1985). An image synthesizer. ACM SIGGRAPH Comput. Graph. 19, 287–296. doi:10.1145/325165.325247
Persson, A.-L. (1998). Image analysis of shape and size of fine aggregates. Eng. Geol. 50, 177–186. doi:10.1016/S0013-7952(98)00009-X
Pirard, E. (2004). “Image measurements,” in Image analysis, sediments and paleoenvironments. Editor P. Francus (Netherlands, Dordrecht: Springer), 59–86.
Pupin, J. P. (1980). Zircon and granite petrology. Contrib. Mineral. Pet. 73, 207–220. doi:10.1007/BF00381441
Ren, Q., Tao, Y., Jiao, D., Jiang, Z., Ye, G., and De Schutter, G. (2021). Plastic viscosity of cement mortar with manufactured sand as influenced by geometric features and particle size. Cem. Concr. Compos. 122, 104163. doi:10.1016/j.cemconcomp.2021.104163
Rodieck, B. (2007). Best-fitting ellipse routines (Image J). Available at: https://imagej.nih.gov/ij/developer/source/ij/process/EllipseFitter.java.html.
Sandeep, C. S., He, H., and Senetakis, K. (2018). An experimental micromechanical study of sand grain contacts behavior from different geological environments. Eng. Geol. 246, 176–186. doi:10.1016/j.enggeo.2018.09.030
Savard, D., Dare, S., Bédard, L. P., and Barnes, S.-J. (2023). A new mapping protocol for laser ablation (with fast-funnel) coupled to a time-of-flight mass spectrometer (LA-FF-ICP-ToF-MS) for the rapid, simultaneous quantification of multiple minerals. Geostand. Geoanalytical Res. 47, 243–265. doi:10.1111/ggr.12482
Scharf, T., Kirkland, C. L., Daggitt, M. L., Barham, M., and Puzyrev, V. (2022). AnalyZr: a Python application for zircon grain image segmentation and shape analysis. Comput. Geosci. 162, 105057. doi:10.1016/j.cageo.2022.105057
Shang, Y., Kaakinen, A., Beets, C. J., and Prins, M. A. (2018). Aeolian silt transport processes as fingerprinted by dynamic image analysis of the grain size and shape characteristics of Chinese loess and Red Clay deposits. Sediment. Geol., Analysis sediment Prop. 375, 36–48. doi:10.1016/j.sedgeo.2017.12.001
Shelton, J. W., and Mack, D. E. (1970). Grain orientation in determination of paleocurrents and sandstone trends. AAPG Bull. 54, 1108–1119. doi:10.1306/5d25cba9-16c1-11d7-8645000102c1865d
Sun, Q., Zheng, J., Coop, M. R., and Altuhafi, F. N. (2019). Minimum image quality for reliable optical characterizations of soil particle shapes. Comput. Geotech. 114, 103110. doi:10.1016/j.compgeo.2019.103110
Suzuki, K., Fujiwara, H., and Ohta, T. (2015). The evaluation of macroscopic and microscopic textures of sand grains using elliptic Fourier and principal component analysis: implications for the discrimination of sedimentary environments. Sedimentology 62, 1184–1197. doi:10.1111/sed.12183
Tafesse, S., Robison Fernlund, J. M., Sun, W., and Bergholm, F. (2013). Evaluation of image analysis methods used for quantification of particle angularity. Sedimentology 60, 1100–1110. doi:10.1111/j.1365-3091.2012.01367.x
Ulusoy, U., Yekeler, M., and Hiçyılmaz, C. (2003). Determination of the shape, morphological and wettability properties of quartz and their correlations. Min. Eng. 16, 951–964. doi:10.1016/j.mineng.2003.07.002
Vaezi, M., Pandey, V., Kumar, A., and Bhattacharyya, S. (2013). Lignocellulosic biomass particle shape and size distribution analysis using digital image processing for pipeline hydro-transportation. Biosyst. Eng. 114, 97–112. doi:10.1016/j.biosystemseng.2012.11.007
van Eck, N. J., and Waltman, L. (2010). Software survey: VOSviewer, a computer program for bibliometric mapping. Scientometrics 84, 523–538. doi:10.1007/s11192-009-0146-3
Ventura, G., De Rosa, R., Colletta, E., and Mazzuoli, R. (1996). Deformation patterns in a high-viscosity lava flow inferred from the crystal preferred orientation and imbrication structures: an example from Salina (Aeolian Islands, southern Tyrrhenian Sea, Italy). Bull. Volcanol. 57, 555–562. doi:10.1007/BF00304439
Vernon, R. H., and Collins, W. J. (2011). Structural criteria for identifying granitic cumulates. J. Geol. 119, 127–142. doi:10.1086/658198
Wadell, H. (1932). Volume, shape, and roundness of rock particles. J. Geol. 40, 443–451. doi:10.1086/623964
Wadell, H. (1933). Sphericity and roundness of rock particles. J. Geol. 41, 310–331. doi:10.1086/624040
Wang, W. (2006). Image analysis of particles by modified Ferret method — best-fit rectangle. Powder Technol. 165, 1–10. doi:10.1016/j.powtec.2006.03.017
Wang, X., and Zhang, Q. (2020). Role of surface roughness in the wettability, surface energy and flotation kinetics of calcite. Powder Technol. 371, 55–63. doi:10.1016/j.powtec.2020.05.081
Wang, X. Z., Roberts, K. J., and Ma, C. (2008). Crystal growth measurement using 2D and 3D imaging and the perspectives for shape control. Chem. Eng. Sci., Control Part. Process. 63, 1173–1184. doi:10.1016/j.ces.2007.07.018
Wentworth, C. K. (1919). A laboratory and field study of cobble abrasion. J. Geol. 27, 507–521. doi:10.1086/622676
Wettimuny, R., and Penumadu, D. (2004). Application of fourier analysis to digital imaging for particle shape analysis. J. Comput. Civ. Eng. 18, 2–9. doi:10.1061/(ASCE)0887-3801(2004)18:1(2)
Xing, C., Liu, B., Sun, Z., Xu, H., Wang, D., and Tan, Y. (2023). The effect of particle shape on the meso-structure of mixture skeleton based on DIP and 3D DEM. Constr. Build. Mat. 384, 131445. doi:10.1016/j.conbuildmat.2023.131445
Yang, H., Xu, Z., and Cheng, Y. (2022). Multi-morphological characteristics of a crushed granitic rock of varying sizes. Minerals 12, 522. doi:10.3390/min12050522
Zheng, D., Wu, S., Ma, C., Xiang, L., Hou, L., Chen, A., et al. (2022). Zircon classification from cathodoluminescence images using deep learning. Geosci. Front. 101436, 101436. doi:10.1016/j.gsf.2022.101436
Zheng, J., and Hryciw, R. D. (2016). Segmentation of contacting soil particles in images by modified watershed analysis. Comput. Geotech. 73, 142–152. doi:10.1016/j.compgeo.2015.11.025
Appendix
Equivalent disc diameter (
Circularity (
Rectangularity perimeter (
Rectangularity area (
Ellipsoidity perimeter (
Ellipsoidity area (
Feret elongation (
Diameter elongation (
Polygon to circle area (
Keywords: quantitative descriptors, shape discrimination, computer vision, statistical analysis, image processing, petrography
Citation: Back AL, Kana Tepakbong C, Bédard LP and Barry A (2025) From rocks to pixels: a comprehensive framework for grain shape characterization through the image analysis of size, orientation, and form descriptors. Front. Earth Sci. 13:1508690. doi: 10.3389/feart.2025.1508690
Received: 09 October 2024; Accepted: 10 January 2025;
Published: 13 February 2025.
Edited by:
Ahmed E. Radwan, Jagiellonian University, PolandReviewed by:
Muhammad Jawad Munawar, University of the Punjab, PakistanRonaldo Herlinger Junior, Petrobras, Brazil
Copyright © 2025 Back, Kana Tepakbong, Bédard and Barry. This is an open-access article distributed under the terms of the Creative Commons Attribution License (CC BY). The use, distribution or reproduction in other forums is permitted, provided the original author(s) and the copyright owner(s) are credited and that the original publication in this journal is cited, in accordance with accepted academic practice. No use, distribution or reproduction is permitted which does not comply with these terms.
*Correspondence: A. L. Back, YXJuYXVkLWxvdWlzLWFiZWwuYmFjazFAdXFhYy5jYQ==