 Bin Lu
 Du-jie Hou2
 Zhen Qiu
- 1Research Institute of Petroleum Exploration and Development, China National Petroleum Corporation, Beijing, China
- 2School of Energy Resources, China University of Geosciences (Beijing), Beijing, China
- 3School of Geoscience and Technology, Southwest Petroleum University, Chengdu, China
The Ediacaran-Cambrian transition was one of the most important periods in Earth’s history. Based on the analysis of lithofacies, mineral composition, total organic carbon major and trace elements, we have studied the depositional environment and organic matter enrichment mechanism of Qiongzhusi Formation shale in the southern Sichuan Basin. The results show that V/Cr, Ni/Co, U/Th, Mo-EF and U-EF values suggest stronger reducing conditions in black shale compared to grey shale, with anoxic conditions decreasing from the interior of the faulted-sag to its exterior. Mo-TOC crossplots and U-Mo covariation analyses indicate a moderately restricted environment during the deposition of the Qiongzhusi Formation. Ba/Al and biogenic barium (Baxs) suggest that the black shale had higher paleoproductivity than grey shale, and the faulted-sag interior higher paleoproductivity compared to that of the slope and outside faulted-sag. The Ti/Al ratio indicates a stable terrigenous input during deposition. The chemical index of alteration (CIA) values in the Qiongzhusi formation range mostly from 50 to 70, indicating low chemical weathering under a cold and arid climate. The Cd/Mo ratio and Co (μg/g) × Mn (%) plot indicate that upwelling had a minor influence in general. Overall, the organic matter enrichment in the Qiongzhusi Formation was primarily controlled by the redox conditions, which were influenced by the Mianyang-Changning faulted-sag. We proposed two depositional models for the Qiongzhusi Formation shale in the southern Sichuan Basin: (1) OM-enriched black shale, deposited under anoxic-suboxic conditions, experiencing low chemical weathering, cold and arid climate and high paleoproductivity; (2) OM-lean grey shale, deposited under suboxic-oxic conditions, with low chemical weathering, a cold and arid climate and low paleoproductivity.
1 Introduction
The Ediacaran-Cambrian (∼540 Ma) transition marks one of the most important periods in Earth’s geological history, characterized by significant events such as the “Snowball Earth” and the “Cambrian Explosion”. These events triggered profound changes in Earth’s paleoclimate and paleoenvironment, setting the stage for major geological and biological transformations (Knoll and Walter, 1992; Kirschvink et al., 1997; Hoffman et al., 1998; Hyde et al., 2000; Guo et al., 2007; Maruyama and Santhosh, 2008; 2014; Payne et al., 2009; Zhang et al., 2014; Jin et al., 2016; Li et al., 2018). During the Early Cambrian, the breakup of the Rodinia supercontinent led to extensive marine transgressions and global sea-level rise. The Sichuan Basin and its surrounding areas were influenced by these two events. During the deposition of the Qiongzhusi Formation in the Early Cambrian, this region was characterized by a semi-restricted to semi-open deep-water shelf environment. This environment remained locally anoxic for extended periods, leading to deposition of organic-rich black shale, predominantly distributed in the Mianyang-Changning faulted-sag in the Sichuan Basin (Huang et al., 2012; Li et al., 2013; Zou et al., 2015). While considerable research has investigated the depositional environment and organic matter (OM) enrichment mechanisms in the Lower Cambrian black shale of the Middle and Upper Yangtze Plate, most studies have primarily focused on provinces such as Hunan, Hubei, Guizhou and Yunnan (Wang et al., 2015; Gao et al., 2016; Zhai et al., 2018; Li et al., 2018; Fang, 2019; Zhao et al., 2020; Fu et al., 2021). In contrast, less attention has been given to the southern Sichuan Basin, particularly regarding the role of the Mianyang-Changning faulted-sag in influencing the depositional environment of Qiongzhusi Formation.
A large quantity of black shale is extensively present in the Sichuan Basin and its surroundings, particularly during the Ordovician-Silurian and the Ediacaran-Cambrian transition. Black shales are important source rocks and reservoirs for hydrocarbons, playing a crucial role in the accumulation and preservation of conventional natural gas and shale gas. In recent years, significant breakthroughs have been made in the exploration of marine shale gas in the Longmaxi Formation in the Sichuan Basin and its periphery. Commercial development of shale gas has been concentrated in large shale gas fields in Changning, Weiyuan, Zhaotong and Fuling, with proven geological reserves exceeding hundreds of billions of cubic meters (Zou et al., 2021). The Qiongzhusi Formation, also known by regional names such as the Niutitang, Shuijingtuo, and Jiulaodong formations, has also emerged as a promising target for shale gas exploration (Dong et al., 2025). Initial breakthroughs suggest that this formation could become the second commercially significant shale gas reservoir in China, following the Longmaxi Formation (He et al., 2024). Therefore, research on the depositional environments and organic matter enrichment of Lower Cambrian black shale in the Sichuan Basin is crucial for guiding shale gas exploration and development in this region.
Given the economic and scientific importance of the Qiongzhusi Formation, understanding the depositional environments and factors controlling organic matter enrichment in the southern Sichuan Basin is crucial for guiding future exploration and development efforts. However, significant discrepancies remain regarding the mechanisms controlling for organic matter enrichment. It has been suggested that factors such as paleoproductivity, depositional environment, sedimentation rate, terrigenous input, sea-level fluctuations, volcanic activity, upwelling currents and hydrothermal processes influence the organic matter enrichment (Demaison and Moore, 1980; Pedersen and Calvert, 1990; Canfield, 1994; Gallego-Torres et al., 2007; Lash et al., 2014). However, the main controlling factor for organic matter (OM) accumulation is still debated, mostly focusing on primary productivity vs redox conditions. Our study tries to figure out this problem via the OM enrichment in the Lower Cambrian black shale in the Sichuan Basin. Previous studies have focused on the depositional environments and controlling factors of organic matter enrichment in Lower Cambrian black shale of the Middle and Upper Yangtze Plate, but the influence of Mianyang-Changning faulted-sag have not been discussed (Wang et al., 2015; Gao et al., 2016; Yin et al., 2017; Zhai et al., 2018; Li et al., 2018; Fang, 2019; Zhao et al., 2020; Fu et al., 2021). This paper aims to conduct a comparative study of the Qiongzhusi Formation shale in the intra-faulted-sag, slope and extra-faulted-sag areas of the Mianyang-Changning faulted-sag in the southern Sichuan Basin using geochemical methods. By doing so, the depositional environment and organic matter (OM) enrichment mechanisms of the Qiongzhusi Formation shale in the southern Sichuan Basin could be further elucidated, which is of great significance to understand the distribution of organic-rich black shale.
2 Geological setting
The Yangtze Block evolved from a rift basin to a passive continental margin basin during the Ediacaran-Cambrian transition (Wang and Li, 2003), which could be divided into carbonate platform, transitional belt and slope to deep basin. The sedimentary facies are usually shallow-water carbonate platform facies, transitional facies, and deep water slope and basinal facies from the northwest to southeast (Figure 1) (Chen et al., 2009).
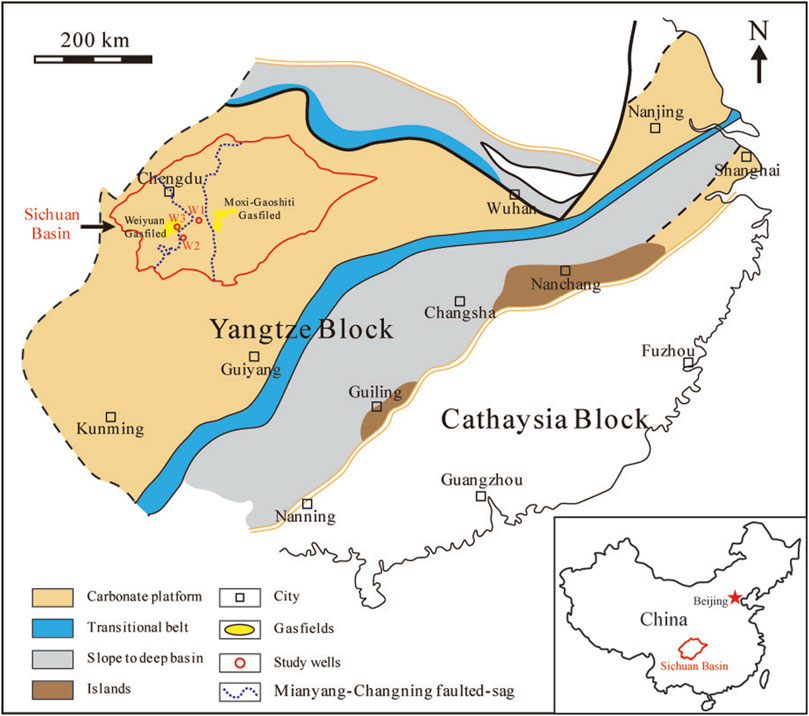
Figure 1. Sketch map showing the location of study area and the depositional facies and paleoenvironments of the South China Craton during the early Cambrian (modified from Gao et al., 2016).
The studied wells are located in the Sichuan Basin, which was situated in the transitional zone between the Gondwana and Laurasia continents, located in the western part of the Upper Yangtze Block and the eastern part of the Qinghai-Tibet Plateau (Figure 1). This area has been influenced by multiple stages of thrusting and nappe from mountain-building events, resulting in typical overlapping basin topography features observed today, surrounded by a complex basin-mountain system (Li et al., 2006; Liu et al., 2011). The Qiongzhusi Formation (∼520 Ma) in the Sichuan Basin and its surrounding areas has experienced multiple tectonic movements such as the Tongan, Xingkai Rift, Caledonian, Hercynian, Indosinian, Yanshan and Himalayan Movements. During the late Cambrian, the Tongan Movement caused a regional uplift of the Sichuan Basin, leading to erosion and the formation of incised valleys at the top of the Dengying Formation in the Mianyang-Changning area. The Xingkai Movement resulted in structural inversion, further extending and subsiding the incised valleys, forming the north-south trending Mianyang-Changning faulted-sag (Figure 1). The formation of this faulted-sag created accommodation space for the deposition of the Maidiping and Qiongzhusi formations black shales during the Early Cambrian. The Mianyang-Changning faulted-sag significantly controlled the deposition of the Qiongzhusi Formation in the southern Sichuan Basin (Zhong et al., 2013; Wang et al., 2016). In the Sichuan Basin, the Qiongzhusi Formation shale thickens gradually from north to south, ranging from 250 to 600 m. The thickest section is found in the Changning structural zone, reaching up to 650 m. The lowermost black shale of the Qiongzhusi Formation is 60–300 m thick (Huang et al., 2012).
3 Data and methods
This study analyzed a total of 140 fresh drilling core samples from three wells (W1, W2 and W3) in the southern Sichuan Basin, located inside, on slope and outside the Mianyang-Changning faulted-sag, respectively (Figure 1). The Qiongzhusi Formation predominantly comprises black and grey shale. Vertically, it can be classified into six members (M1 through M6, from bottom to top). M1, M3 and M5 are composed of OM-enriched (TOC ≥ 2%) black shale, while members M2, M4 and M6 comprise of OM-lean (TOC < 2%) grey shale (Tables 1 and 2).
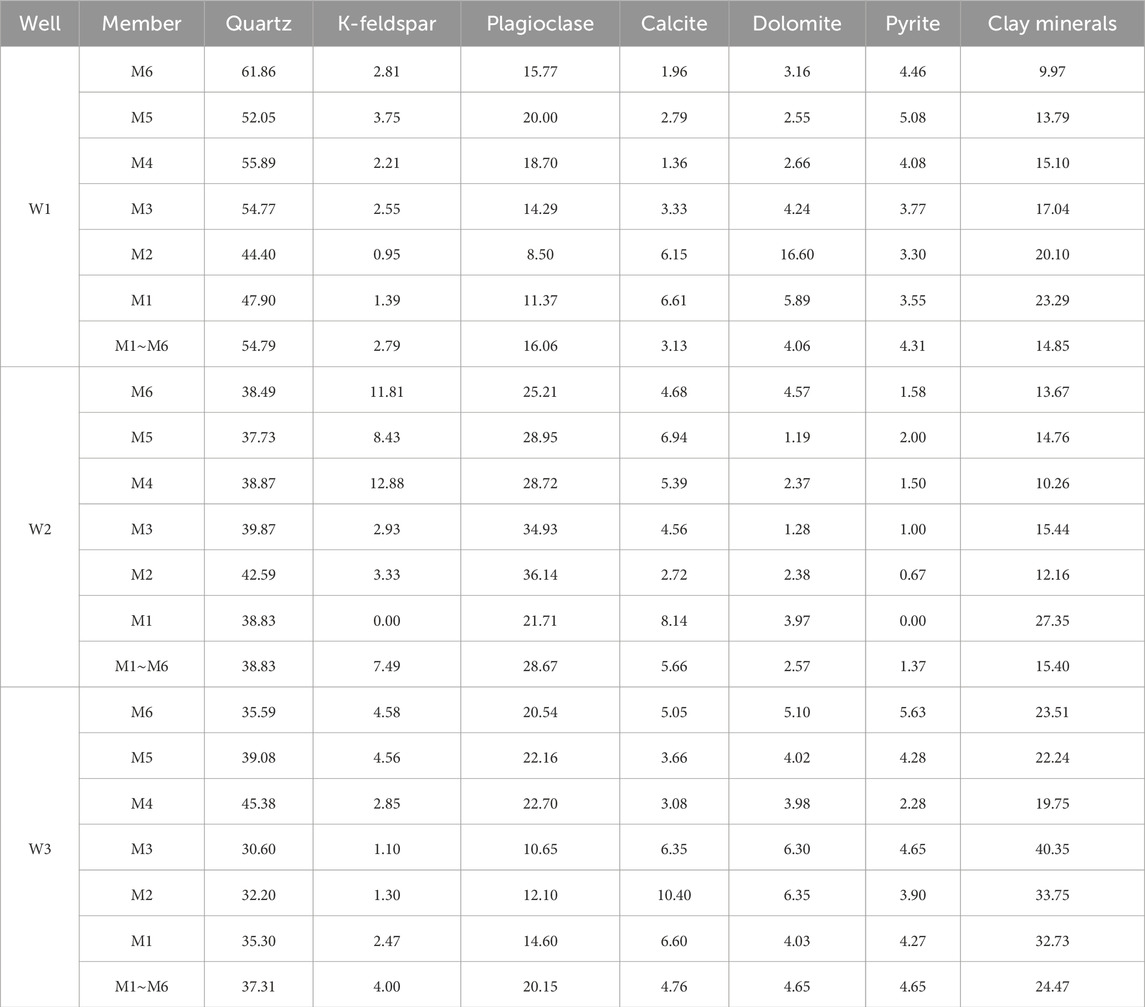
Table 1. Average mineralogical composition of the Qiongzhusi shale in Lower Cambrian from the wells in Sichuan Basin (%).

Table 2. TOC, major element contents and geochemical parameters of the Qiongzhusi shale in Lower Cambrian from the wells in Sichuan Basin.
The mineral composition, major and trace elements were conducted at the Institute of Geology and Geophysics, Chinese Academy of Sciences. The mineral composition of the shale samples were determined by the X-ray diffraction (XRD) technique (D/Max-IlB, Rigaku Co. Japan). CuKa radiation (35 kV × 30 mA) and a graphic mono-chrometer for diffractedbeams were used. Major element concentrations were determined using AXIOS Minerals made by PANalytical Corporation of Holland, with analytical precision better than 1%. Trace element concentrations were determined using element inductively coupled plasma mass spectrometry (ICP-MS) from FINNIGAN MAT Company, with analytical precision better than 3%.
Enrichment factors (EF) are used to show trace metal concentrations, excluding the effects of dilution by calcium carbonate and organic matter. EF for trace elements relative to upper continental crust (UCC) (McLennan, 2001) were calculated as: (Element/Al)sample/(Element/Al)UCC. Excess Ba (Baxs) was calculated as an indicator of biogenic barium, using the equation: Baxs = Batotal − (Ba/Al)detr × Alsample (Schoepfer et al., 2015).
The CIA can be calculated using the molar ratios of specific substances, according to the following formula:
The term CaO* refers specifically to the CaO present in silicates. The content of CaO* is primarily determined using the formula CaO_residual = CaO - P2O5 × (10/3). If CaO_residual is less than Na2O, then CaO* equals CaO_residual. If CaO_residual is greater than Na2O, then CaO* equals Na2O (Mclennan, 1993). The CIA value increases with greater chemical weathering intensity. During diagenesis, clay minerals are susceptible to potassium exchange, which requires assessing the degree of potassium exchange and correcting for it. Because plagioclase (Na and Ca) is more susceptible to weathering than potassium feldspar (K), (Nesbitt and Young, 1982), thus K and CIA need to be corrected. Nesbitt et al. (1996) proposed using an Al2O3-CaO + Na2O-K2O ternary diagram for this correction to obtain the corrected CIA*, reflecting the adjusted chemical weathering index.
4 Results
4.1 Shale lithofacies
Based on the observation of thin sections, the shale lithofacies of six members are analyzed. The black shales from M1, M3 and M5 have similar lithofacies, showing weakly laminated fine-grained mudstone with a lamina spacing ranging from 0.5 to 2 mm (Figures 2A,C,E), indicating a deep-water depositonnal environment. The grey shales from M2 and M6 show different lithofacies with weakly laminated and laminated mudstone (Figures 2B,D,F), respectively, indicating a shallow-water depositional environment. The grey shale from M4 shows homogeneous mudstone with a particle-size ranging from 20 to 50 um (Figure 2D), but appear as laminated mudstone in M6, with a lamina spacing of 0.1–0.5 mm (Figure 2F). Notably, the mud content of black shale is higher than that of grey shale, while the sand content of grey shale is higher than that of black shale, and the lamina in grey shale are more developed (Figure 2). Due to the shallower water and inceasing terrigenous input during the deposition of grey shale, a lamellar sedimentary structure with interlayers of sand and mud was formed.
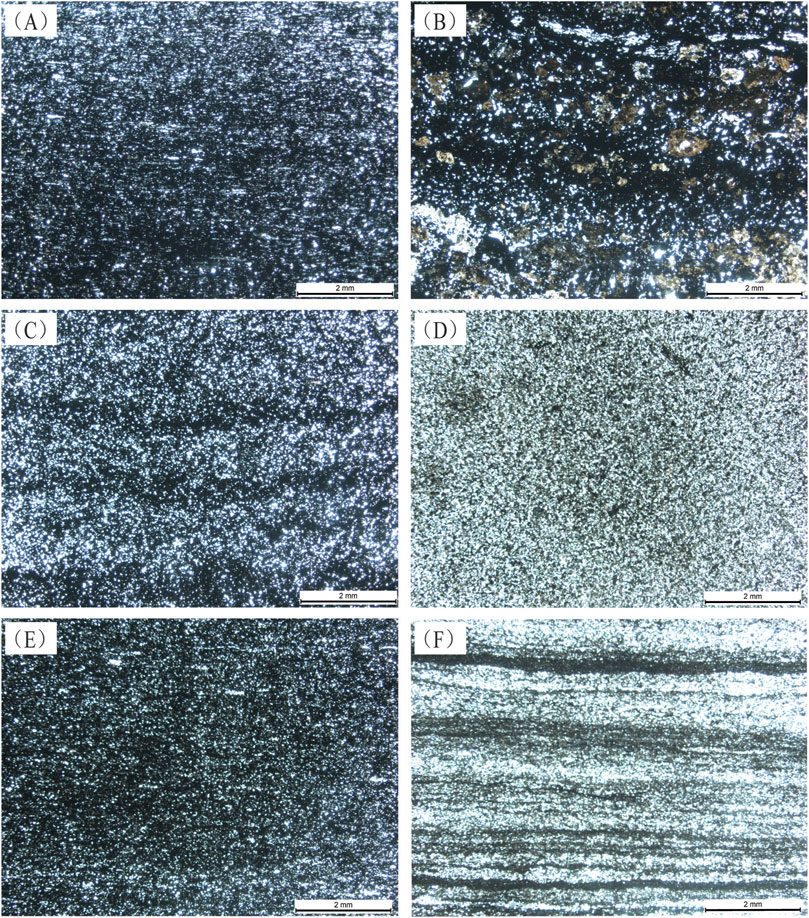
Figure 2. Thin sections from Well W1 showing shale lithofacies. (A) Weakly laminated black shale from Member 1. (B) Weakly laminated grey shale from Member 2. (C) Weakly laminated black shale from Member 3. (D) Homogeneous mudstone from Member 4. (E) Weakly laminated black shale from Member 5. (F) Laminated grey shale from Member 6.
4.2 Mineral compositions
Minerals in the studied samples consist of quartz, K-feldspar, plagioclase, calcite, dolomite, pyrite and clay minerals. Quartz, feldspar (K-feldspar + plagioclase) and clay minerals are the dominant components. There are clear distribution patterns of the shale mineral composition from Well W1 to W3 (Table 1). For example, the quartz content gradually decreases from W1 to W3, accounting for average of 54.79%, 38.83% and 37.31% of total mineral content, respectively (Table 1). Conversely, the clay minerals content gradually increases from W1 to W3, accounting for 14.85%, 15.40% and 24.47% of minerals on average, respectively (Table 1). These findings indicate that the water depth was gradually shallower from the interior of the faulted-sag to its exterior, resulting in the increase of terrigenous input, with a decrease in quartz content, and an increase in clay mineral content.
4.3 Total organic carbon contents
The total organic carbon (TOC) analysis results indicate significant lateral and vertical variations (Table 2). Laterally, the highest TOC content is observed in Well W1 located within the faulted-sag (average = 2.37%), followed by Well W2 on the slope of the faulted-sag (average = 1.55%), and Well W3, outside the faulted-sag, showing the lowest TOC content (average = 1.40%) (Table 2). These trends suggest a strong influence of the faulted-sag on organic matter deposition and preservation. The higher TOC content within the faulted-sag may reflect anoxic conditions and limited sediment dilution in this area. Within each well, the TOC content is notably higher in the black shale (M1, M3 and M5) compared to the grey shale (M2, M4 and M6) (Table 2). For instance, in Well W1, the average TOC values for M1, M3 and M5 are 4.45%, 3.27% and 2.26%, respectively, while M2, M4, M6 exhibit lower TOC averages of 2.95%, 0.22% and 1.09%, respectively. These findings suggest episodic variations in organic matter productivity and preservation conditions, with black shale likely corresponding to periods of enhanced organic productivity or restricted depositional environments.
4.4 Element variations
The analysis of major elements in the Qiongzhusi Formation shale indicates a dominance of SiO2, TiO2 and Fe2O3, with minimal variations across the studied wells (Table 2). In Well W1, the average contents of SiO2, Al2O3 and Fe2O3 are 67.01%, 12.99% and 4.91%, respectively. In Well W2, SiO2 content is slightly lower at 65.42%, while Al2O3 and Fe2O3 average 14.38% and 5.20%, respectively. Well W3 shows a further reduction in SiO2 (60.45%) and slightly elevated levels of Al2O3 (13.65%) and Fe2O3 (5.17%). SiO2 content exhibits a gradual decrease from the interior to the exterior of the faulted-sag. These trends indicate a progressive decrease in silica content from the faulted-sag interior to its exterior, likely linked to sediment input variations or diagenetic processes.
The trace element analysis reveals enrichment in several key elements, including Ba, V, Cr, Zn, Sr, and Rb, with Ba being particularly abundant (Table 2). Average Ba concentrations are highest in Well W1 (1,473 μg/g), followed by Well W3 (1,179 μg/g) and Well W2 (1,118 μg/g). All values significantly exceed the UCC average of 550 μg/g. Elements such as Mo, U, and V consistently exceed UCC levels across the wells, suggesting persistent anoxic conditions conducive to organic matter preservation. High Ba levels suggest high primary biogenic productivity, supporting the TOC trends observed in black shale.
5 Discussion
5.1 Paleo-redox conditions
Trace elements such as U, V, Cr, Th, Mo, Ni, Co along with ratios like U/Th, Ni/Co, V/Cr, V/Sc, V/(V + Ni) are widely used to infer redox conditions (Emerson and Huested, 1991; Jones and Manning, 1994; Li et al., 2018; Liu et al., 2021; Pipe et al., 2025). Previous studies suggest that V/Cr < 2.00 indicates oxic conditions; 2.00 < V/Cr < 4.25 suggests suboxic conditions; and V/Cr > 4.25 indicates anoxic conditions (Jones and Manning, 1994). Similarly, Ni/Co < 5.00 indicates oxic conditions; 5.00 < Ni/Co < 7.00 suggests suboxic conditions; and Ni/Co > 7.00 indicates anoxic conditions (Jones and Manning, 1994). Besides, U/Th < 0.75 indicates oxic conditions; 0.75 < U/Th < 1.25 suggests suboxic conditions; and U/Th > 1.25 indicates anoxic conditions (Tonger Liu and Xu, 2004).
Based on the values of V/Cr, Ni/Co and U/Th, significant differences in redox conditions are observed among the Qiongzhusi Formation shale from the three wells (W1, W2 and W3) located in different tectonic settings. Overall, the black shale (M1, M3 and M5) exhibit a stronger reducing (anoxic-suboxic) conditions compared to the grey shale (M2, M4 and M6), which suggest a suboxic-oxic enviroment (Figures 3–5). Among the wells, Well W1, located inside the faulted-sag, exhibits the strongest reducing (anoxic) conditions (Table 2). Well W2 on the slope of the faulted-sag shows slightly lower values (e.g., for M1, average values of V/Cr, Ni/Co and U/Th are 7.69, 8.09 and 2.76, respectively) (Table 2). The Well W3, located outside the faulted-sag, reflects a moderate reducing environment (Table 2). Thus, the redox conditions were significantly influenced by the Mianyang-Changning configuration.
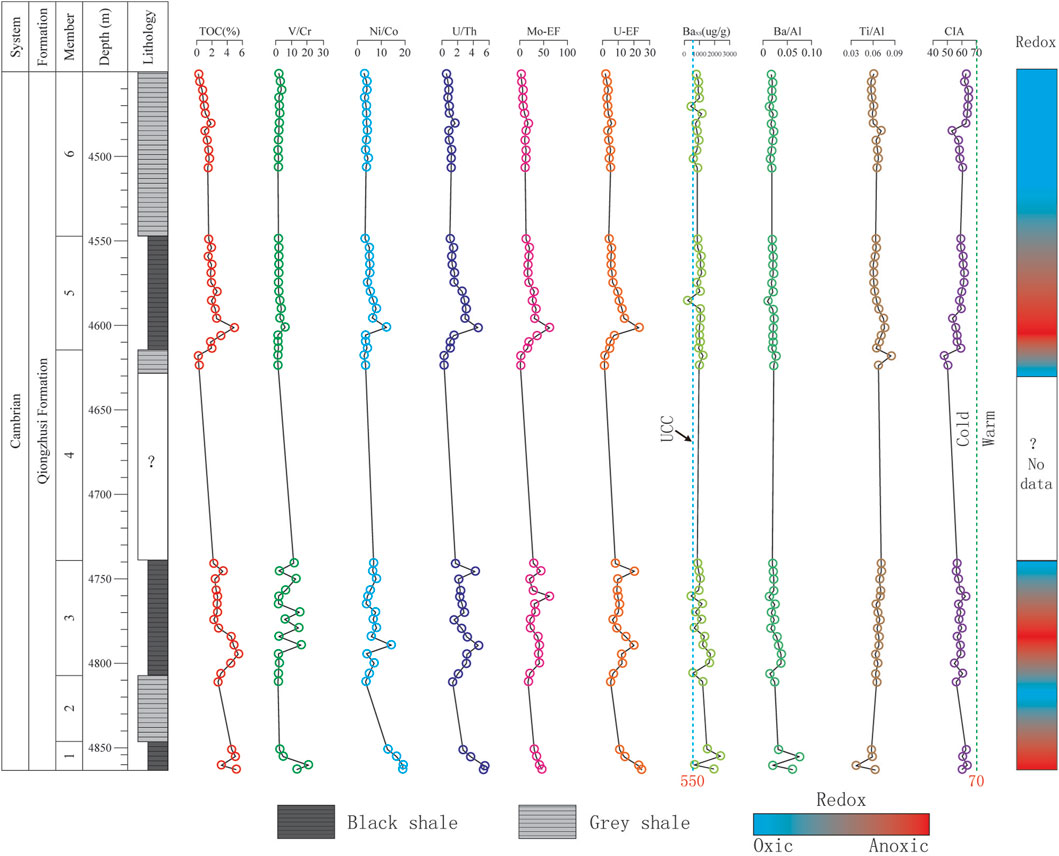
Figure 3. Vertical variations of TOC, V/Cr, Ni/Co, U/Th, Mo-EF, U-EF, Baxs, Ba/Al, Ti/Al and CIA of the Qiongzhusi Formation shale in the Lower Cambrian from the Well W1 in the Southern Sichuan Basin. Dashed blue line represents the upper continental crust (UCC) average. Dashed green line represents the boundary to separate cold from warm climate.
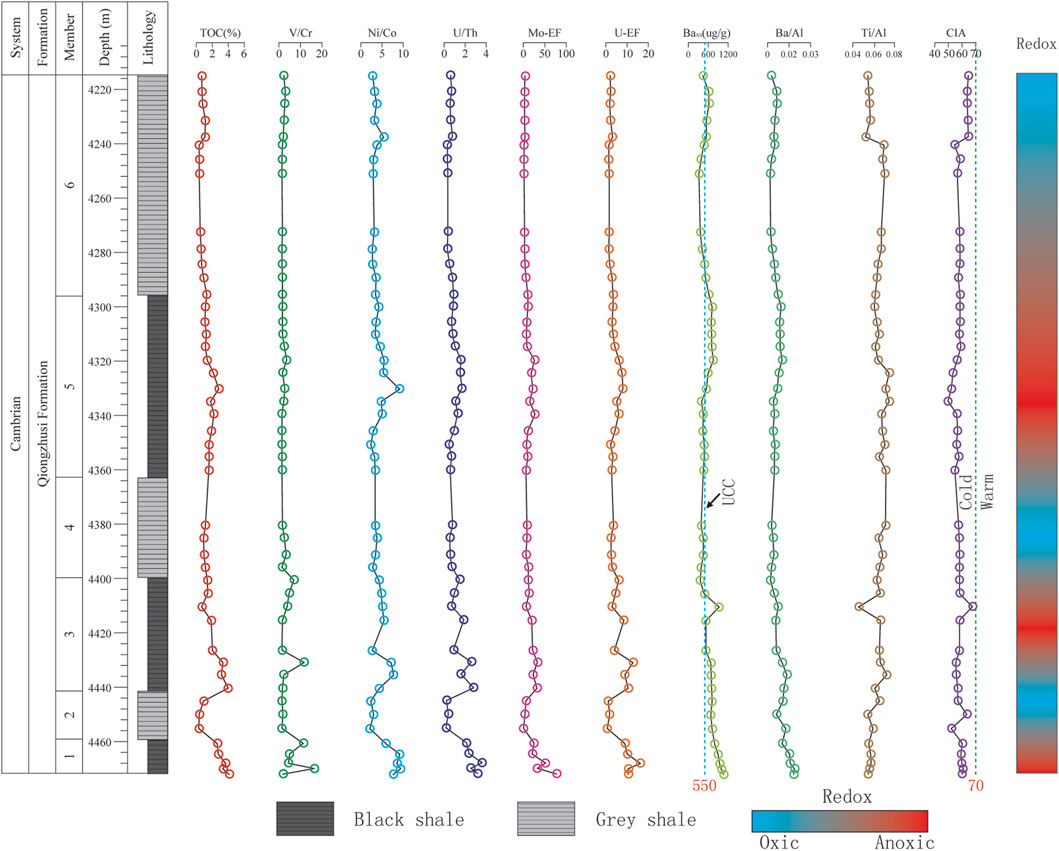
Figure 4. Vertical variations of TOC, V/Cr, Ni/Co, U/Th, Mo-EF, U-EF, Baxs, Ba/Al, Ti/Al and CIA of the Qiongzhusi Formation shale in the Lower Cambrian from the Well W2 in the Southern Sichuan Basin. Dashed blue line represents the upper continental crust (UCC) average. Dashed green line represents the boundary to separate cold from warm climate.
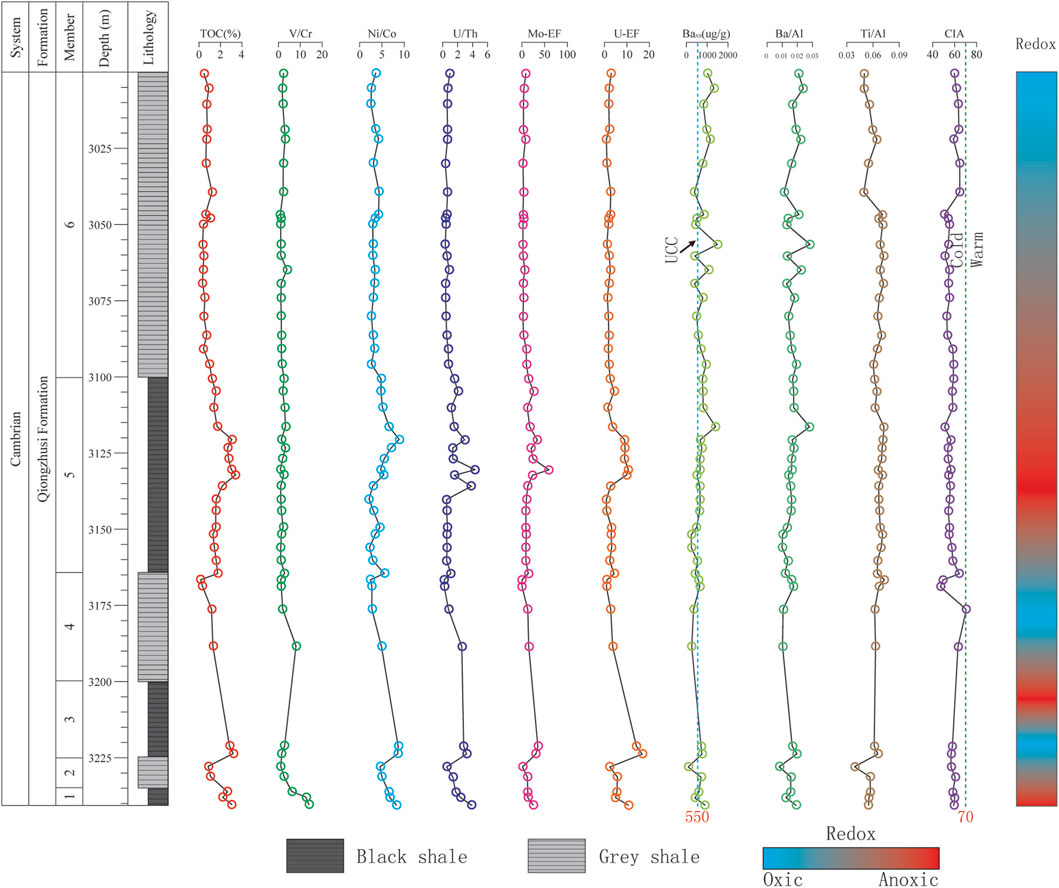
Figure 5. Vertical variations of TOC, V/Cr, Ni/Co, U/Th, Mo-EF, U-EF, Baxs, Ba/Al, Ti/Al and CIA of the Qiongzhusi Formation shale in the Lower Cambrian from the Well W3 in the Southern Sichuan Basin. Dashed blue line represents the upper continental crust (UCC) average. Dashed green line represents the boundary to separate cold from warm climate.
5.2 Water mass circulation
Trace elements such U and Mo are often used to study the degree of water mass restriction in modern and ancient marine environments. In oxic waters, both U and Mo exist in stable high-valence Species (U6+ and Mo6+), while in anoxic environments, they are reduced to low-valence Species (U4+ and Mo4+), leading to precipitation and enrichment in sediments (Algeo and Tribovillard, 2009; Tribovillard et al., 2012). However, the enrichment mechanisms of U and Mo are different. The uptake of U by sediments begins at the redox boundary between Fe (III) and Fe (II), whereas the uptake of Mo requires the presence of H2S (Zheng et al., 2000). Therefore, U begins to accumulate at relatively shallow-water depths and under weaker reducing conditions, meaning the uptake of U by sediments occurs earlier than that of Mo (Algeo and Tribovillard, 2009). Secondly, Mn and Fe hydroxides can act as carriers to adsorb Mo from seawater, thereby facilitating its incorporation into sediments, while U remains unaffected (Algeo and Lyons, 2006; Algeo and Tribovillard, 2009). Previous studies have used the Mo/TOC ratio and the U-Mo covariation patterns to assess the degree of water mass restriction (Algeo and Lyons, 2006; Rowe et al., 2008; Algeo and Maynard, 2008; Algeo and Tribovillard, 2009; Tribovillard et al., 2012; Zou et al., 2015; Wu et al., 2017; Li et al., 2017). The uptake of authigenic Mo and U may be influlenced by benthic redox condition, particulate shuttles and changes in the aqueous Mo/U ratio (Algeo and Tribovillard, 2009). Consequently, the U-Mo covariation pattern can simultaneously indicate both water mass restriction and the redox conditions of marine basins (Algeo and Lyons, 2006; Algeo and Tribovillard, 2009). Studies of modern marine basins have established three types of U-Mo covariation patterns corresponding to non-restricted, weakly restricted and strongly restricted marine environments (Tribovillard et al., 2012).
The Mo vs TOC crossplot provides insight into environmental restriction levels. Both black and grey shale of the Qiongzhusi Formation indicate a moderate restriction environment, similar to Framvaren Fjord (Algeo and Lyons, 2006) (Figures 6A–C). The U-Mo covariation pattern also supports a moderately restricted environment (Figures 6D–F). Within this context, the grey shales have lower Mo-EF and U-EF values and were more oxygenated conditions than black shale, consistent with previous interpretations.
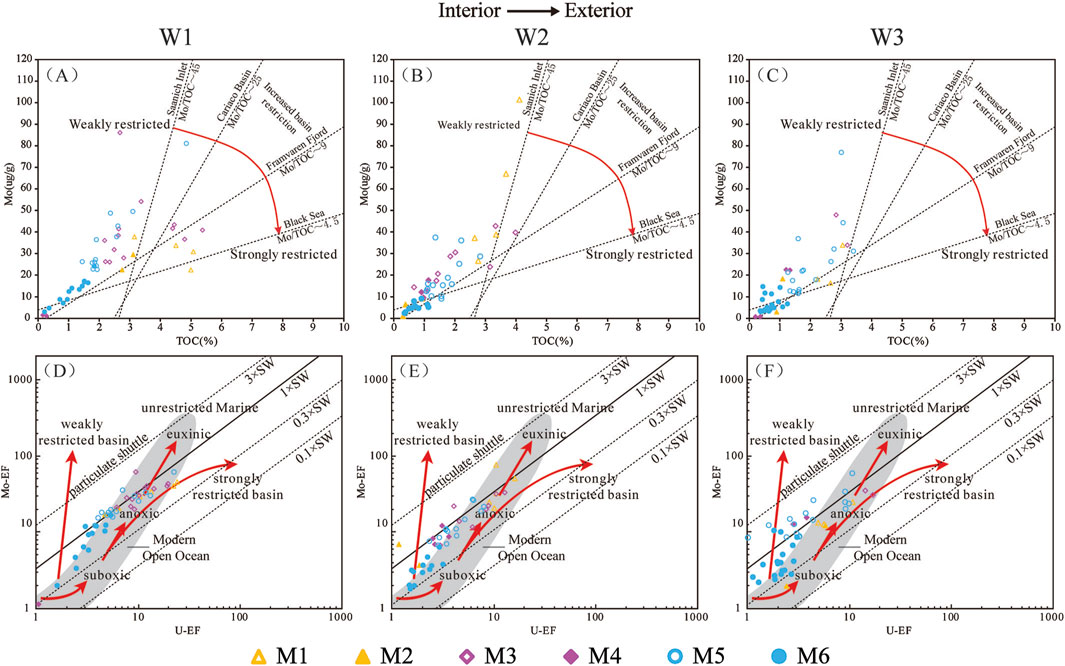
Figure 6. Crossplots of Mo concentration versus TOC for (A) Well W1; (B) Well W2; and (C) Well W3. Dashed lines represent the regression trends for four modern anoxic marine systems (Saanich Inlet, Cariaco Basin, Framvaren Fjord, and Black sea), indicating variable degrees of hydrographic restriction. Red arrows represent the restricted trends. Crossplots of Mo-EF versus U-EF for (D) Well W1; (E) Well W2; and (F) Well W3. Solid line shows Mo–U molar ratio equal to seawater value (1 × SW). Dashed lines indicate Mo–U molar ratios equal to fractions of seawater value (0.1 × SW, 0.3 × SW, 3 × SW). Grey field represents the “unrestricted marine” trend, characteristic of depositional systems with no limited trace metal renewal. Red arrows represent the restricted and reducing trends. M1, Member 1; M2, Member 2; M3, Member 3; M4, Member 4; M5, Member 5; M6, Member 6 (modified from Algeo and Lyons, 2006; Algeo and Tribovillard, 2009).
5.3 Paleoproductivity
The distribution of nutrient elements such as C, N, O, Si, P and Ba in the ocean is primarily regulated by biogeochemical metabolism processes. Typically, proxies such as P, Ba/Al and biogenic Ba (Baxs) are widely used to assess marine paleoproductivity (Dymond et al., 1992; Francois et al., 1995; Zhang et al., 2016; Wu et al., 2020; Qiu et al., 2022). Sedimentary Ba includes both biogenic Ba from biological sources and terristrial Ba conbined with silicate. Baxs, representing biogenic Ba in sediment, is calculated as total Ba in sediment minus terrigenous Ba, and serves a proxy for biological productivity in marine environments (Eagle et al., 2003).
Statistical analyses suggest that Baxs values exceeding 600 μg/g indicate high paleoproductivity, whereas values below 600 μg/g signify low productivity. Vertically, the Ba/Al and Baxs values in the Qiongzhusi Formation shale from the three Wells show a stable trend, with slightly higher values in the black shale intervals than in the grey shale ones (Figures 3–5). Laterally, the faulted-sag interior records higher paleoproductivity compared to that of the slope and the outside faulted-sag, which may be related to higher nutrient input from rifting activity in the northern South China block in the context of the Rodinia breakup (Wang et al., 2015) (Table 2).
5.4 Terrigenous input
It is generally believed that the major elements Al and Ti are very stable in seawater and can indicate the input of terrigenous debris. Al occurs only in clay minerals, while Ti occurs both in clay minerals and sand-sized or silt-sized minerals, The Ti/Al ratio is widely used as an indicator of terrigenous input and source provenance (Boström and Peterson, 1969; Adachi et al., 1986; Yamamoto, 1987; Murray, 1994; Murphy et al., 2000; Yeasmin et al., 2017; Liu et al., 2021).
The results of analysis suggest that the contents of Al and Ti and Ti/Al ratios in the Qiongzhusi Formation shale from study Wells show a stable trend, indicating relatively stable terrigenous input in the southern Sichuan Basin (Figures 3–5; Table 2). Vertically, the contents of Al from M2 to M6 are similar and slightly higher than that of M1. Laterally, the Al contents from Well W2 to W3 are similar and slightly higher than that of Well W1. In addition, the Ti contents from M2 to M6 are also similar and slightly higher than that of M1 and the Ti contents from Well W2 to W3 are similar and slightly higher than that of Well W1 too. The contents of Al and Ti indicate that there were relatively few terrigenous inputs in early Qiongzhusi Formation also in the faulted-sag. However, the Ti/Al ratios in the Qiongzhushi Formation shale from the three wells are similar and show a stable trend. For example, the averages of Ti/Al ratios are 0.065 for W1 located in the faulted-sag, 0.064 for W2 on the slope of the faulted-sag and 0.063 for W3 outside the faulted-sag, suggesting that terrigenous input in the Qiongzhushi Formation in the southern Sichuan Basin originated from a common source (Table 2).
5.5 Weathering
Nesbitt and Young (1982) proposed using the Chemical Index of Alteration (CIA) to assess the degree of chemical weathering of source rocks in the provenance area. The CIA can reflect the degree of weathering of sediment sources: when CIA is between 50 and 65, it indicates low weathering in a cold and arid climate; when CIA is between 65 and 85, it indicates moderate weathering in a warm climate; and when CIA is greater than 85, it indicates intense weathering in a hot and humid climate (Nesbitt and Young, 1982).
Our Al2O3-CaO+Na2O-K2O ternary diagram shows a deviation from the weathering trend (Figure 7), reflecting a certain extent removal of K-bearing from parent rock. We correct the K contents and CIA based on the weathering trend which is parallel to A-CN line, forming another trend toward illite and muscovite. This suggests addition of K2O to clays, i.e., K enrichment. A line from K apex through sample intersects the premetasomatized weathering trend at a point which represents its premetasomatized composition (Figure 7). A prematasomatized CIA value (i.e, CIAcorrected) can be read by extending a line from the point to the CIA apex, which is parallel to the CN-K line (Figure 7). Only two samples of Well W1 locate on the weathering line, indicating no K metasomatism (Figure 7). The CIA* values are similar to CIA (Figure 7), ranging mainly from 50 to 70, indicating that the Qiongzhushi Formation in the southern Sichuan Basin is predominantly experienced low weathering under a cold and arid climate. This conflicts with the tropical paleogeographic setting and the expected warm climate background. This deviation may be originated from provenance which is supported by variable Ti/Al ration in the study interval. Vertically, the CIA* values of the Qiongzhushi Formation shale from the three wells show minimal variation, with CIA* values mainly ranging from 50 to 70. This suggests that the weathering of the Qiongzhushi Formation shale in the southern Sichuan Basin is relatively stable and low intensity. Laterally, the shale from Well W1, located in the faulted-sag (average CIA* of 59), exhibits similar weathering intensity to Well W2 on the faulted-sag slope (average CIA* of 58) and Well W3 outside the faulted-sag (average CIA* of 57). This indicates a predominantly low degree of weathering and a cold and arid climate, likely influenced by the distance from the provenance (Table 2).
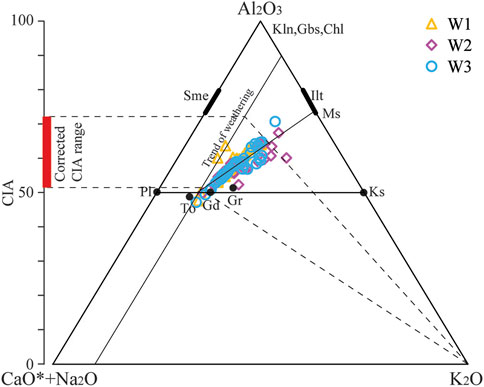
Figure 7. Ternary diagram of molecular proportions Al2O3—(CaO* + Na2O)—K2O of the Qiongzhusi Formation shale in the Lower Cambrian from W1 to W3 in the Southern Sichuan Basin. Data based on the method described by Nesbitt and Young (1982), (1984). Tonalite (To), granodiorite (Gd), and granite (Gr) data are from Condie (1993). Our Al2O3-CaO + Na2O-K2O ternary diagram shows a deviation from the weathering trend (Figure 7), reflecting a certain extent removal of K-bearing from parent rock. We correct the K contents and CIA based on the weathering trend which is parallel to A-CN line, forming another trend toward illite and muscovite. This suggests addition of K2O to clays, i.e., K enrichment. A line from K apex through sample intersects the premetasomatized weathering trend at a point which represents its premetasomatized composition (Figure 7). A prematasomatized CIA value (i.e., CIAcorrected) can be read by extending a line from the point to the CIA apex, which is parallel to the CN-K line (Figure 7). Only two samples of Well W1 locate on the weathering line, indicating no K metasomatism (Figure 7). CIA–Chemical Index of Alteration, CaO*–CaO incorporated in the silicate fraction of the sample, Pl–plagioclase, Kfs–K-feldspar, Sme–Smectite, Kln–kaolinite, Gbs–gibbsite, Chl–chlorite, Ms.–muscovite, and Ilt–Illite. The CIA* range mainly from 50 to 70, indicating that the Qiongzhushi Formation in the southern Sichuan Basin is predominantly experienced low weathering under a cold and arid climate.
5.6 Upwelling events
Sweere et al. (2016) proposed using Cd/Mo ratios and Co (ug/g) × Mn (%) to assess the influence of upwelling events in marine deposits. Their research indicated that high Cd/Mo ratios are characteristic of sediments deposited in continental margin upwelling environments, whereas environments within restricted ocean basins show higher concentrations of Co and Mn (expressed as Co × Mn) (Sweere et al., 2016). Cd/Mo > 0.1 and Co (ug/g) × Mn (%) < 0.4 indicate a continental margin open ocean environment associated with upwelling currents (e.g., Namibian Margin). Cd/Mo < 0.1 and Co (ug/g) × Mn (%) > 0.4 indicate a restricted water column environment in marginal ocean basins (e.g., Black Sea) (Sweere et al., 2016). Currently, Cd/Mo and Co (ug/g) × Mn (%) are widely used to identify upwelling events in marine deposits (Zhang et al., 2018; Lu et al., 2019; McArthur, 2019; Qiu et al., 2023).
Based on the analyses of Cd/Mo and Co(ug/g) × Mn (%) of the Qiongzhusi Formation shale in the southern Sichuan Basin, the shale samples mainly indicate weak to moderate restricted water column conditions (Figures 8A–C), consistent with the interpretations mentioned above. The Cd/Mo values of the black shale (M1, M3 and M5) are predominantly less than 0.1, while those of the grey shale (M2, M4 and M6) are predominantly greater than 0.1 (Figures 8A–C). The Co (ug/g) × Mn (%) values both black and grey shale are predominantly above 0.4 (Figures 8A–C). The low Cd/Mo ratio indicates a deposition in a low oxygen or restricted environment, with minimal influence from upwelling currents (Sweere et al., 2016). This may be due to the palaeogeography location of the basin, which faced southwards to the ocean near to the northern margin of the Gondwana continent. Thus, it can be inferred that black shale was primarily deposited under oxygen-deficient or restricted conditions with limited upwelling influence, enhancing OM preservation, consistent with the conclusion mentioned above.
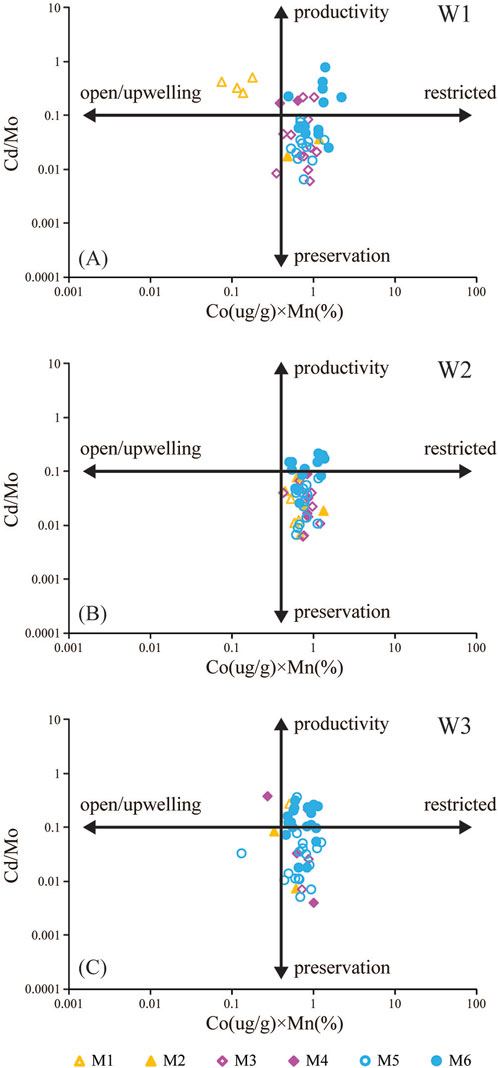
Figure 8. Crossplots of Cd/Mo against Co(ug/g) × Mn (%) of the Qiongzhusi Formation shale in the Lower Cambrian from W1 to W3 in the Southern Sichuan Basin (A) Well W1, (B) Well W2, (C) Well W3. M1, Member 1; M2, Member 2; M3, Member 3; M4, Member 4; M5, Member 5; M6, Member 6 (modified from Sweere et al., 2016)
5.7 Mechanism of organic matter enrichment
Previous studies indicate the enrichment of organic matter in modern and ancient marine sediments is influenced by such as primary productivity, depositional environment, terrigenous sediment supply, microbial activity, etc. These studies have proposed two genetic models: the preservation mode and the productivity mode (Demaison and Moore, 1980; Calvert, 1987; Pedersen and Calvert, 1990; Arthur and Sageman, 1994; Murphy et al., 2000; Lash et al., 2014). Two sedimentation models are proposed for the black shale and grey shale of the Qiongzhusi Formation in the southern Sichuan Basin. OM-enriched black shales (M1, M3, M5) (Figure 9A) were deposited under anoxic-suboxic conditions, experienced a low degree of chemical weathering, under cold and arid climate with high paleoproductivity, responding to organic matter enrichment with high TOC content. In contrast, the OM-lean grey shales (M2, M4, M6) (Figure 9B) were deposited under suboxic-oxic conditions with a similarly low degree of weathering but lower paleoproductivity, suggesting that strong reducing conditions contributed OM enrichment. The alternating deposition of black shale and grey shale during the E-C transition in South China is tightly linked with transgressive events (Zhang et al., 2020). The redox proxies in study interval show positive correlation with TOC, while primary productivity proxies show weak or no correlation with TOC (Figure 10). This indicates a main-controlling factor of redox conditions on OM accumulation mechanism. The relationship between marine redox conditions, primary productivity, and nutrient input is the key for the discussion understanding the mechanisms of OM enrichment. High primary productivity in surface waters can lead to increased oxygen demand during OM decomposition on the sea floor, and thus resulting in low-oxygen, reducing or anoxic conditions (Wei et al., 2016). Restricted water-mass circulations in a silled basin usually yield low-oxygen conditions in bottom waters. Previous studies have generated conflicting interpretations about the OM accumulation mechanism of the Early Cambrian shale from Yangtze Platform. For example, some geologists proposed that climate played an important role in the OM enrichment (Yeasmin et al., 2017; Zhai et al., 2018; Wang et al., 2020), while others found that upwelling, hydrothermal activity, primary productivity and redox conditions were the main control factors for OM enrichment of black shale in the Yangtze Block during the Early Cambrian (Gao et al., 2016; Zhou et al., 2017; Ma et al., 2019; Wu et al., 2020; Liu et al., 2021). However, the influence of Mianyang-Changning faulted-sag on the OM enrichment was not considered in the previous studies.
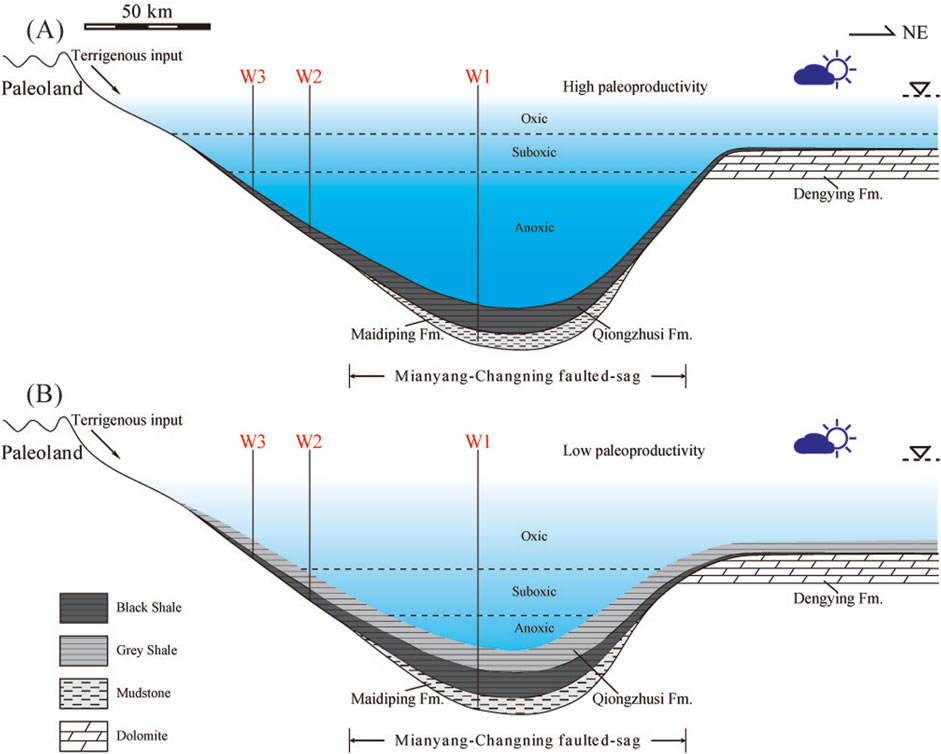
Figure 9. Organic matter accumulation model of the Qiongzhusi Formation shale in the Lower Cambrian from W1 to W3 in the Southern Sichuan Basin. (A) OM-enriched black shale, deposited under anoxic-suboxic conditions, experiencing a cold and arid climate and high paleoproductivity; (B) OM-lean grey shale, deposited under suboxic-oxic conditions, experiencing a cold and arid climate and low paleoproductivity
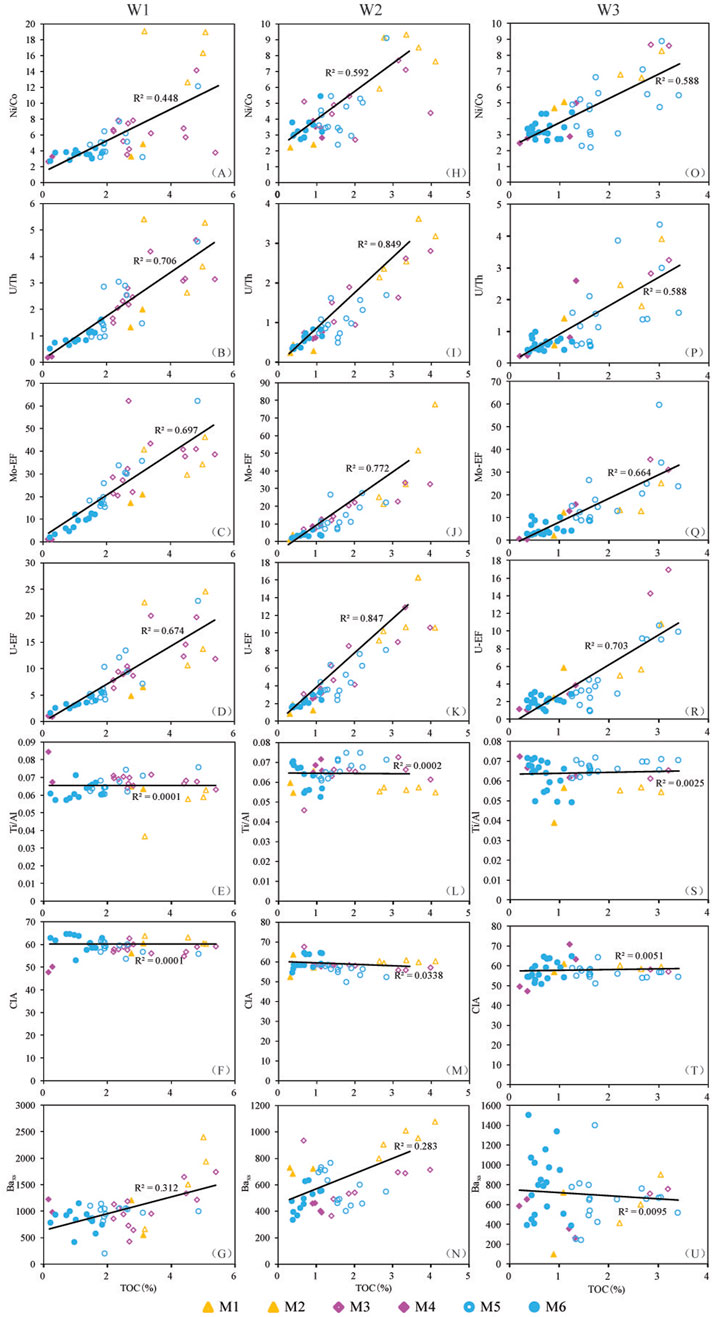
Figure 10. Crossplots of TOC against Ni/Co, U/Th, Mo-EF, U-EF, Ti/Al, CIA and Baxs for (A-G) Well W1; (H-N) Well W2; and (O-U) Well W3. M1, Member 1; M2, Member 2; M3, Member 3; M4, Member 4; M5, Member 5; M6, Member 6.
By examining the relationships between these factors and TOC, the main controlling factors influencing organic matter enrichment of the Qiongzhusi Formation shale can be inferred. Geochemical indicators reflecting paleo-redox conditions (Ni/Co, U/Th, Mo-EF and U-EF) show a strong positive correlation with TOC (Figures 3–5, 10A–D,H–K, O, P, Q, R). Conversely, geochemical indicators of paleoproductivity (Baxs, Ba/Al), terrigenous input (Ti/Al) and weathering effects (CIA) show weak correlation with TOC (Figures 3–5, 10E–G, L, M, N, S, T, U). Therefore, these findings suggest that the organic matter enrichment in the Qiongzhusi Formation shale in the southern Sichuan Basin was primarily controlled by paleo-redox conditions. Water circulation conditions show low to moderate restriction, in contrast with high OM enrichment observed (Figure 6). In addition, no significant difference in water circulation conditions is observed between OM-rich black shale and OM-lean grey shale. This may indicated a weak or egligible correlation between OM enrichment and water circulation in the study area.
Within the same lithostratigraphic unit, the Well W1, located in the inner faulted-sag, exhibits the highest TOC content, followed by the Well W2 on the slope of the faulted-sag while the Well W3, located outside the faulted-sag, shows the lowest TOC content. Additionally, the OM-enriched black shale generally has higher TOC content compared to the OM-lean grey shale. These findings indicate the redox conditions decreased gradually from the inner faulted-sag to the outer faulted-sag and the black shale experienced more reducing conditions compared to the grey shale. In summary, organic matter enrichment in the Qiongzhushi Formation shale in the southern Sichuan Basin was controlled by the redox conditions, which were influenced by the Mianyang-Changning faulted-sag. The strongest reducing (anoxic) conditions in the inner faulted-sag were most conducive to the enrichment of organic matter.
6 Conclusion
The depositional environment of the Qiongzhusi Formation shale in the southern Sichuan Basin exhibits the following six key characteristics: (1) The black shale shows stronger reducing conditions compared to grey shale, with redox conditions being more intense in the faulted-sag interior than on the slope and outside faulted-sag; (2) The Qiongzhusi Formation shale were deposited under moderate restricted conditions; (3) The paleoproductivity of black shale was higher than that of grey shale, and the shale in the faulted-sag interior indicates higher paleoproductivity compared to that of the slope and outside faulted-sag; (4) A stable terrigenous input persisted throughout the entire depositional period of study interval; (5) The Qiongzhusi Formation shale experienced a low degree of chemical weathering, under a cold and arid climate; (6) The influence of upwelling currents was minimal, with black shale exhibiting higher degree of restriction compared to grey shale.
The organic matter enrichment of the Qiongzhusi Formation shale was primarily controlled by the redox conditions, which were influenced by the Mianyang-Changning faulted-sag. In particular, the reducing (anoxic) conditions in the inner faulted-sag were most conducive to the organic matter accumulation. Two sedimentary models have been established for the Qiongzhusi Formation shale: (1) OM-enriched black shale was deposited under anoxic-suboxic conditions and experienced a low degree of chemical weathering, under a cold and arid climate and with high paleoproductivity; (2) OM-lean grey shale was deposited under suboxic-oxic conditions, and experienced a low degree of chemical weathering, a cold and arid climate and low paleoproductivity.
Data availability statement
The original contributions presented in the study are included in the article/supplementary material, further inquiries can be directed to the corresponding authors.
Author contributions
BL: Formal Analysis, Methodology, Writing–original draft. D-jH: Formal Analysis, Methodology, Writing–review and editing. C-nZ: Formal Analysis, Methodology, Writing–review and editing. X-zL: Data curation, Methodology, Writing–review and editing. R-sG: Data curation, Methodology, Writing–review and editing. H-yW: Methodology, Formal Analysis, Project administration, Writing–original draft, Writing–review and editing. ZQ: Data curation, Methodology, Writing–original draft.
Funding
The author(s) declare that financial support was received for the research and/or publication of this article. This work was supported by the National Natural Science Foundation of China (No. 42222209).
Acknowledgments
We thank Feng Liang, Qin Zhang, Xiang-yang Pei, Qi-min Guo, Long-yi Wang, Ji-chang Zhu, Yi-ze Huang and Nijun Qi for their assistance in the samples collection and geochemical analyses.
Conflict of interest
Authors BL, CZ, XL, RG, and ZQ were employed by China National Petroleum Corporation.
The remaining authors declare that the research was conducted in the absence of any commercial or financial relationships that could be construed as a potential conflict of interest.
Generative AI statement
The author(s) declare that no Generative AI was used in the creation of this manuscript.
Publisher’s note
All claims expressed in this article are solely those of the authors and do not necessarily represent those of their affiliated organizations, or those of the publisher, the editors and the reviewers. Any product that may be evaluated in this article, or claim that may be made by its manufacturer, is not guaranteed or endorsed by the publisher.
References
Adachi, M., Yamamoto, K., and Sugisaki, R. (1986). Hydrothermal chert and associated siliceous rocks from the northern Pacific their geological significance as indication od ocean ridge activity. Sediment. Geol. 47 (1-2), 125–148. doi:10.1016/0037-0738(86)90075-8
Algeo, T. J., and Lyons, T. W. (2006). Mo–total organic carbon covariation in modern anoxic marine environments: implications for analysis of paleoredox and paleohydrographic conditions. Paleoceanography 21 (1), 1016–1038. doi:10.1029/2004PA001112
Algeo, T. J., and Maynard, J. B. (2008). Trace metal covariation as a guide to water-mass conditions in ancient anoxic marine environments. Geosphere 4 (5), 872–887. doi:10.1130/ges00174.1
Algeo, T. J., and Tribovillard, N. (2009). Environmental analysis of paleoceanographic systems based on molybdenum-uranium covariation. Chem. Geol. 268 (3/4), 211–225. doi:10.1016/j.chemgeo.2009.09.001
Arthur, M. A., and Sageman, B. B. (1994). Marine Black Shales: depositional mechanisms and environments of ancient deposits. Annu. Rev. Earth Pl. S. C. 22 (1), 499–551. doi:10.1146/annurev.ea.22.050194.002435
Boström, K., and Peterson, M. N. A. (1969). The origin of aluminum-poor ferromanganoan sediments in areas of high heat flow on the East Pacific Rise. Mar. Geol. 7 (5), 427–447. doi:10.1016/0025-3227(69)90016-4
Calvert, S. E. (1987). Oceanographic controls on the accumulation of organic matter in marine sediments. Geol. Soc. Lond. Spec. Publ. 26 (1), 137–151. doi:10.1144/GSL.SP.1987.026.01.08
Canfield, D. E. (1994). Factors influencing organic carbon preservation in marine sediments. Chem. Geol. 114 (3-4), 315–329. doi:10.1016/0009-2541(94)90061-2
Chen, D., Wang, J., Qing, H., Yan, D., and Li, R. (2009). Hydrothermal venting activities in the Early Cambrian, South China: petrological, geochronological and stable isotopic constraints. Chem. Geol. 258 (3-4), 168–181. doi:10.1016/j.chemgeo.2008.10.016
Condie, K. C. (1993). Chemical composition and evolution of the upper continental crust: contrasting results from surface samples and shales. Chem. Geol. 104, 1–37. doi:10.1016/0009-2541(93)90140-E
Demaison, G. J., and Moore, G. T. (1980). Anoxic environments and oil source bed genesis. Org. Geochem 2 (1), 9–31. doi:10.1016/0146-6380(80)90017-0
Dong, Z. T., Tian, S. S., Xue, H. T., Lu, S. F., Liu, B., Erastova, V., et al. (2025). A novel method for automatic quantification of different pore types in shale based on SEM-EDS calibration. Mar. Petrol Geol. 173, 107278. doi:10.1016/j.marpetgeo.2024.107278
Dymond, J., Suess, E., and Lyle, M. (1992). Barium in deep-sea sediment: a geochemical proxy for paleoproductivity. Paleoceanography 7 (2), 163–181. doi:10.1029/92PA00181
Eagle, M., Paytan, A., Arrigo, K. R., Dijken, G. V., and Murray, R. W. (2003). A comparison between excess barium and barite as indicators of carbon export. Paleoceanography 18 (1), 2101–2113. doi:10.1029/2002PA000793
Emerson, S. R., and Huested, S. S. (1991). Ocean anoxia and the concentrations of molybdenum and vanadium in seawater. Mar. Chem. 34 (3), 177–196. doi:10.1016/0304-4203(91)90002-e
Fang, A. D. Q., Wu, L., Geng, A., and Deng, Q. (2019). Formation and evolution of the ediacaran to lower cambrian black shales in the Yangtze platform, south China. Palaeogeogr. Palaeoclimatol. Palaeoecol. 527, 87–102. doi:10.1016/j.palaeo.2019.04.025
Francois, R., Honjo, S., Manganini, S. J., and Ravizza, G. E. (1995). Biogenic barium fluxes to the deep sea: implications for paleoproductivity reconstruction. Glob. Biogeochem. Cy 9 (2), 289–303. doi:10.1029/95GB00021
Fu, Y., Zhou, W. X., Wang, H. J., Qiao, W. L., Ye, Y. T., Jiang, R., et al. (2021). The relationship between environment and geochemical characteristics of black rock series of Lower Cambrian in northern Guizhou. Acta Geol. Sin. 95 (2), 536–548. doi:10.19762/j.cnki.dizhixuebao.2021102
Gallego-Torres, D., Martínez-Ruiz, F., Paytan, A., Jiménez-Espejo, F. J., and Ortega-Huertas, M. (2007). Pliocene-Holocene evolution of depositional conditions in the eastern Mediterranean: role of anoxia vs. productivity at time of sapropel deposition. Palaeogeogr. Palaeoclimatol. Palaeoecol. 246 (2), 424–439. doi:10.1016/j.palaeo.2006.10.008
Gao, P., Liu, G. D., Jia, C., Young, A. L., Wang, Z. C., Wang, T. S., et al. (2016). Redox variations and organic matter accumulation on the Yangtze carbonate platform during Late Ediacaran-Early Cambrian: constraints from petrology and geochemistry. Palaeogeogr. Palaeoclimatol. Palaeoecol. 450, 91–110. doi:10.1016/j.palaeo.2016.02.058
Guo, Q. J., Shield, G. A., Liu, C. Q., Strauss, H., Zhu, M. Y., Pi, D., et al. (2007). Trace element chemostratigraphy of two Ediacaran-Cambrian successions in South China. Implications for organosedimentary metal ennchment and silic1Hcatlon in the early Cambnan. Palaeogeogr Palaeoclimatol Palaeoecol, 254, 194–216. doi:10.1016/j.palaeo.2007.03.016
He, X., Liang, F., Li, H., Zheng, M. J., Zhao, Q., Liu, Y., et al. (2024). Breakthrough and enrichment mode of marine shale gas in the Lower Cambrian Qiongzhusi Formation in high-yield wells in Sichuan Basin. China Petrol Explor 29 (1), 142–155. doi:10.3969/j.issn.1672-7703.2024.01.011
Hoffman, P. F., Kaufman, A. J., Halverson, G. P., and Schrag, D. P. (1998). A neoproterozoic snowball earth. Science 281 (5381), 1342–1346. doi:10.1126/science.281.5381.1342
Huang, J. L., Zou, C. N., Li, J. Z., Dong, D. Z., Wang, S. J., Wang, S. Q., et al. (2012). Shale gas generation and potential of the lower cambrian Qiongzhusi Formation in southern Sichuan Basin, China. Petrol Explor Dev. 39 (1), 69–75. doi:10.1016/S1876-3804(12)60017-2
Hyde, W. T., Crowley, T. J., Baum, S. K., and Peltier, W. R. (2000). Neoproterozoic “snowball Earth” simulations with a coupled climate/ice-sheet model. Nature 405 (6785), 425–429. doi:10.1038/35013005
Jin, C. S., Li, C., Algeo, T. J., Planaysky, N. J., Cui, H., Yang, X. L., et al. (2016). A highly redox-heterogeneous ocean in South China during the early Cambrian (∼529-514Ma): implications for biota-environment co-evolution. Earth Planet S. C. Lett. 441, 38–51. doi:10.1016/j.epsl.2016.02.019
Jones, B., and Manning, D. A. C. (1994). Comparison of geochemical indices used for the interpretation of palaeoredox conditions in ancient mudstones. Chem. Geol. 111 (1-4), 111–129. doi:10.1016/0009-2541(94)90085-X
Kirschvink, Z., Ripperdan, R. L., and Evans, D. A. (1997). Evidence for a large-scale reorganization of early cambrian continental masses by inertial interchange true polar wander. Science 277, 541–545. doi:10.1126/science.277.5325.541
Knoll, A. H., and Walter, M. R. (1992). Latest proterozoic stratigraphy and earth history. Nature 356 (6371), 673–678. doi:10.1038/356673a0
Lash, G. G., and Blood, D. R. (2014). Organic matter accumulation, redox, and diagenetic history of the Marcellus Formation, southwestern Pennsylvania, Appalachian basin. Mar. Petrol Geol. 57, 244–263. doi:10.1016/j.marpetgeo.2014.06.001
Li, J., Tang, S. H., Zhang, S. H., Xi, Z., Yang, N., Yang, G. Q., et al. (2018). Paleo-environmental conditions of the Early Cambrian Niutitang Formation in the Fenggang area, the southwestern margin of the Yangtze Platform, southern China: evidence from major elements, trace elements and other proxies. J. Asian Earth Sci. 159, 81–97. doi:10.1016/j.jseaes.2018.03.013
Li, T. J., Zhao, S. X., Huang, Y. B., Zhang, L. H., Zhang, K., and Tang, H. M. (2013). The sedimentary micro-facies study of the lower cambrian Qiongzhusi Formation in southern Sichuan Basin. Acta Geol. Sin. 87 (8), 1136–1148. doi:10.3969/j.issn.0001-5717.2013.08.008
Li, X. H., Li, Z. X., Sinclair, J. A., Li, W. X., and Carter, G. (2006). Revisiting the “Yanbian Terrane”: implications for neoproterozoic tectonic evolution of the western Yangtze block, south China. Precambrian Res. 151, 14–30. doi:10.1016/j.precamres.2006.07.009
Li, Y. F., Zhang, T. W., Ellis, G. S., and Shao, D. Y. (2017). Depositional environment and organic matter accumulation of upper ordovician-lower silurian marine shale in the upper Yangtze platform, south China. Palaeogeogr. Palaeoclimatol. Palaeoecol. 66 (15), 252–264. doi:10.1016/j.palaeo.2016.11.037
Liu, S. G., Deng, B., Li, Z. W., and Sun, W. (2011). The texture of sedimentary basin-orogenic belt system and its influence on oil/gas distribution: a case study from Sichuan basin. Acta Petol Sin. 27 (3), 621–635. doi:10.3724/SP.J.1011.2011.00415
Liu, Z. X., Yan, D. T., Du, X. B., and Li, S. J. (2021). Organic matter accumulation of the early Cambrian black shales on the flank of Micangshan-Hannan Uplift, northern upper Yangtze Block, South China. J. Petrol Sci. Eng. 200, 108378. doi:10.1016/j.petrol.2021.108378
Lu, Y. B., Jiang, S., Lu, Y. C., Xu, S., Shu, Y., and Wang, Y. X. (2019). Productivity or preservation? The factors controlling the organic matter accumulation in the late Katian through Hirnantian Wufeng organic-rich shale, South China. Mar. Petrol Geol. 109, 22–35. doi:10.1016/j.marpetgeo.2019.06.007
Ma, Y. Q., Lu, Y. C., Liu, X. F., Zhai, G. Y., Wang, Y. F., and Zhang, C. (2019). Depositional environment and organic matter enrichment of the lower Cambrian Niutitang shale in western Hubei Province, South China. Mar. Petrol Geol. 109, 381–393. doi:10.1016/j.marpetgeo.2019.06.039
Maruyama, S., and Santosh, M. (2008). Models on snowball earth and cambrian explosion: a synopsis. Gondwana Res. 14 (1-2), 22–32. doi:10.1016/j.gr.2008.01.004
Maruyama, S., Sawaki, Y., Ebisuzaki, T., Ikoma, M., Omori, S., and Tetsuya, K. (2014). Initiation of leaking Earth: an ultimate trigger of the Cambrian explosion. Gondwana Res. 25 (3), 910–944. doi:10.1016/j.gr.2013.03.012
McArthur, J. (2019). Early Toarcian black shales: a response to an oceanic anoxic event or anoxia in marginal basins? Chem. Geol. 522, 71–83. doi:10.1016/j.chemgeo.2019.05.028
Mclennan, S. M. (1993). Weathering and global denudation. J. Geol. 101 (2), 295–303. doi:10.1086/648222
McLennan, S. M. (2001). Relationships between the trace element composition of sedimentary rocks and upper continental crust. Geochem Geophy Geosy. 2 (4). doi:10.1029/2000GC000109
Murphy, A. E., Sageman, B. B., Hollander, D. J., Lyons, T. W., and Brett, C. E. (2000). Black shale deposition and faunal overturn in the Devonian Appalachian Basin: clastic starvation, seasonal water-column mixing, and efficient biolimiting nutrient recycling. Paleoceanography 15 (3), 280–291. doi:10.1029/1999PA000445
Murray, R. W. (1994). Chemical criteria to identify the depositional environment of chert: general principles and applications. Sediment. Geol. 90 (3-4), 213–232. doi:10.1016/0037-0738(94)90039-6
Nesbitt, H. W., and Young, G. M. (1982). Early Proterozoic climates and plate motions inferred from major element chemistry of lutites. Nature 299, 715–717. doi:10.1038/299715a0
Nesbitt, H. W., and Young, G. M. (1984). Prediction of some weathering trends of plutonic and volcanic rocks based on thermodynamic and kinetic considerations. Geochim. Cosmochim. Ac 48, 1523–1534. doi:10.1016/0016-7037(84)90408-3
Nesbitt, H. W., Young, G. M., McLennan, S. M., and Keays, R. R. (1996). Effects of chemical weathering and sorting on the petrogenesis of siliciclastic sediments, with implications for provenance studies. J. Geol. 104, 525–542. doi:10.1086/629850
Payne, J. L., Boyer, A. G., Brown, J. H., Finnegan, S., Kowalewski, M., Krause, R. A., et al. (2009). Two-phase increase in the maximum size of life over 3.5 billion years reflects biological innovation and environmental opportunity. P Natl. Acad. Sci. U. S. A. 106 (1), 24–27. doi:10.1073/pnas.0806314106
Pedersen, T. F., and Calvert, S. E. (1990). Anoxia vs. productivity: what controls the formation of organic-carbon-rich sediments and sedimentary rocks. AAPG Bull. 74 (4), 454–466. doi:10.1306/0C9B232B-1710-11D7-8645000102C1865D
Pipe, A. B., Leybourne, M. I., Johannesson, K. H., Hannigan, R. E., and Layton-Matthews, D. (2025). Trace and rare earth element geochemistry of black shales from the upper ordovician utica shale magnafacies. Chem. Geol. 672, 122507. doi:10.1016/j.chemgeo.2024.122507
Qiu, Z., Li, Y. F., Xiong, W., Fan, T. L., Zhao, Q., Zhang, Q., et al. (2023). Revisiting paleoenvironmental changes on the Upper Yangtze Block during the Ordovician-Silurian transition: new insights from elemental geochemistry. Sediment. Geol. 450, 106377. doi:10.1016/j.sedgeo.2023.106377
Qiu, Z., Zou, C. N., Mills, B. J. W., Xiong, Y. J., Tao, H. F., Lu, B., et al. (2022). A nutrient control on expanded anoxia and global cooling during the Late Ordovician mass extinction. Commun. Earth Environ. 3 (82), 82–89. doi:10.1038/s43247-022-00412-x
Rowe, H. D., Loucks, R. G., Ruppel, S. C., and Rimmer, S. M. (2008). Mississippian barnett formation, fort worth basin, Texas: bulk geochemical inferences and Mo-TOC constraints on the severity of hydrographic restriction. Chem. Geol. 257 (1/2), 16–25. doi:10.1016/j.chemgeo.2008.08.006
Schoepfer, S. D., Shen, J., Wei, H., Tyson, R. V., Ingall, E., and Algeo, T. J. (2015). Total organic carbon, organic phosphorus, and biogenic barium fluxes as proxies for paleomarine productivity. Earth-Sci Rev. 149, 23–52. doi:10.1016/j.earscirev.2014.08.017
Sweere, T., van den Boorn, S., Dickson, A. J., and Reichart, G. J. (2016). Definition of new tracemetal proxies for the controls on organic matter enrichment in marine sediments based on Mn, Co, Mo and Cd concentrations. Chem. Geol. 441, 235–245. doi:10.1016/j.chemgeo.2016.08.028
Tonger Liu, W. H., and Xu, Y. C. (2004). The discussion on anoxic environments and its geochemical identifying indices. Acta Sedimentol. Sin. 22 (2), 365–372. doi:10.3969/j.issn.1000-0550.2004.02.026
Tribovillard, N., Algeo, T. J., Baudin, F., and Riboulleau, A. (2012). Analysis of marine environmental condition based on molybdenum-uranium covariation-applications to Mesozoic paleoceanography. Chem. Geol. 324/325, 46–58. doi:10.1016/j.chemgeo.2011.09.009
Wang, J., and Li, Z. X. (2003). History of Neoproterozoic rift basins in South China: implications for Rodinia break-up. Precambrian Res. 122, 141–158. doi:10.1016/s0301-9268(02)00209-7
Wang, N., Li, M. J., Tian, X. W., Hong, H. T., Wen, L., and Wang, W. Z. (2020). Climate-ocean control on the depositional watermass conditions and organic matter enrichment in lower cambrian black shale in the upper Yangtze Platform. Mar. Petrol Geol. 120, 104570. doi:10.1016/j.marpetgeo.2020.104570
Wang, S. F., Zou, C. N., Dong, D. Z., Wang, Y. M., Li, X. J., Huang, J. L., et al. (2015). Multiple controls on the paleoenvironment of the Early Cambrian marine black shales in the Sichuan Basin, SW China: geochemical and organic carbon isotopic evidence. Mar. Petrol Geol. 66, 660–672. doi:10.1016/j.marpetgeo.2015.07.009
Wang, T., Xiong, L., Xu, M., Dong, X. X., Zhou, R. Q., and Fu, X. N. (2016). Shale reservoir characteristics of the lower cambrian Qiongzhusi Formation in the southern Sichuan Basin. Petrol Explor Dev. 38 (2), 197–203. doi:10.11781/sysydz201602197
Wei, H. Y., Wei, X. M., Qiu, Z., Song, H. Y., and Shi, G. (2016). Redox conditions across the G-L boundary in South China: evidence from pyrite morphology and sulfur isotopic compositions. Chem. Geol. 440, 1–14. doi:10.1016/j.chemgeo.2016.07.009
Wu, C. J., Zhang, L. F., Zhang, T. W., Tuo, J. C., Song, D. J., Liu, Y., et al. (2020). Reconstruction of paleoceanic redox conditions of the lower Cambrian Niutitang shales in northern Guizhou, Upper Yangtze region. Palaeogeogr. Palaeoclimatol. Palaeoecol. 538, 109457. doi:10.1016/j.palaeo.2019.109457
Wu, Y., Fan, T., Jiang, S., and Yang, X. Q. (2017). Lithofacies and sedimentary sequence of the lower cambrian Niutitang shale in the upper Yangtze platform, south China. J. Nat. Gas. Sci. Eng. 43, 124–136. doi:10.1016/j.jngse.2017.04.002
Wu, Y. W., Tian, H., Gong, D. J., Li, T. F., and Zhou, Q. (2020). Paleo-environmental variation and its control on organic matter enrichment of black shales from shallow shelf to slope regions on the Upper Yangtze Platform during Cambrian Stage 3. Palaeogeogr. Palaeoclimatol. Palaeoecol. 545, 109653. doi:10.1016/j.palaeo.2020.109653
Yamamoto, K. (1987). Geochemical characteristics and depositional environments of cherts and associated rocks in the Franciscan and Shimanto Terranes. Sediment. Geol. 52 (1-2), 65–108. doi:10.1016/0037-0738(87)90017-0
Yeasmin, R., Chen, D. Z., Fu, Y., Wang, J., Guo, Z., and Guo, C. (2017). Climatic-oceanic forcing on the organic accumulation across the shelf during the early cambrian (age 2 through 3) in the mid-upper Yangtze block, NE guizhou, south China. J. Asian Earth Sci. 134, 365–386. doi:10.1016/j.jseaes.2016.08.019
Yin, L. M., Borjigin, T., Knoll, A. H., Bian, L. Z., Xie, X. M., Bao, F., et al. (2017). Sheet like microfossils from hydrothermally influenced basinal cherts of the lower cambrian (terreneuvian) Niutitang formation, guizhou, south China. Palaeoworld 26 (1), 1–11. doi:10.1016/j.palwor.2016.01.005
Zhai, L. N., Wu, C. D., Ye, Y. T., Zhang, S. C., and Wang, Y. Z. (2018). Fluctuations in chemical weathering on the Yangtze Block during the Ediacaran-Cambrian transition: implications for paleoclimatic conditions and the marine carbon cycle. Palaeogeogr. Palaeoclimatol. Palaeoecol. 490, 280–292. doi:10.1016/j.palaeo.2017.11.006
Zhang, B., Yao, S., Wignall, P. B., Hu, W., Ding, H., Liu, B., et al. (2018). Widespread coastal upwelling along the eastern paleo-tethys margin (south China) during the Middle permian (Guadalupian): implications for organic matter accumulation. Mar. Petrol Geol. 97, 113–126. doi:10.1016/j.marpetgeo.2018.06.025
Zhang, J. P., Fan, T. L., Algeo, T. J., Li, Y. F., and Zhang, J. C. (2016). Paleo-marine environments of the early cambrian Yangtze platform. Palaeogeogr. Palaeoclimatol. Palaeoecol. 443, 66–79. doi:10.1016/j.palaeo.2015.11.029
Zhang, X. L., Shu, D. G., Han, J., Zhang, Z. F., Liu, J. N., and Fu, D. J. (2014). Triggers for the cambrian explosion: hypotheses and problems. Gondwana Res. 25 (3), 896–909. doi:10.1016/j.gr.2013.06.001
Zhang, X. L., Zhou, X., and Hu, D. P. (2020). High-resolution paired carbon isotopic records from the Meishucun section in South China: implications for carbon cycling and environmental changes during the Ediacaran-Cambrian transition. Precambrian Res. 337, 105561. doi:10.1016/j.precamres.2019.105561
Zhao, K., Li, T. T., Zhu, G. Y., Zhang, Z. Y., Li, J. F., Wang, P. J., et al. (2020). Geochemical characteristics and formation mechanism of high-quality Lower Cambrian source rocks: a case study of the Tianzhushan profile in western Hubei. Acta Petol Sin. 41 (1), 13–26. doi:10.7623/syxb202001002
Zheng, Y., Anderson, R. F., Geen, A. V., and Kuwabara, J. (2000). Authigenic molybdenum formation in marine sediments: a link to pore water sulfide in the Santa Barbara Basin. Geochim. Cosmochim. Ac 64 (24), 4165–4178. doi:10.1016/S0016-7037(00)00495-6
Zhong, Y., Li, Y. L., Zhang, X. B., Liu, S. G., Liu, D. J., Deng, X. J., et al. (2013). Features of extensional structures in pre-Sinian to Cambrian strata, Scichuan Basin, China. J Chengdu Univ Tech Sci. and Technol. Ed. 40 (5), 498–510. doi:10.3969/j.issn.1671-9727.2013.05.02
Zhou, L., Kang, Z. H., Wang, Z. X., Peng, Y. Y., and Xiao, H. F. (2017). Sedimentary geochemical investigation for paleoenvironment of the lower cambrian Niutitang formation shales in the Yangtze platform. J. Petrol Sci. Eng. 159, 376–386. doi:10.1016/j.petrol.2017.09.047
Zou, C. N., Dong, D. Z., Wang, Y. M., Li, X. J., Huang, J. L., Wang, S. F., et al. (2015). Shale gas in China: characteristics, challenges and prospects (Ⅰ). Petrol Explor Dev. 42 (6), 689–701. doi:10.11698/PED.2015.06.01
Keywords: sichuan basin, lower cambrian, qiongzhusi formation, shale, deposit ional environment, organic matter enrichment
Citation: Lu B, Hou D-j, Zou C-n, Li X-z, Gao R-s, Wei H-y and Qiu Z (2025) Depositional environment and organic matter enrichment mechanism of the lower cambrian shale in the southern Sichuan Basin. Front. Earth Sci. 13:1509332. doi: 10.3389/feart.2025.1509332
Received: 10 October 2024; Accepted: 20 March 2025;
Published: 04 April 2025.
Edited by:
Ángel Puga-Bernabéu, University of Granada, SpainReviewed by:
Luis Gago Duport, University of Vigo, SpainShansi Tian, Northeast Petroleum University, China
Bo Ran, Chengdu University of Technology, China
Tong Sun, Chengdu University of Technology, China
Copyright © 2025 Lu, Hou, Zou, Li, Gao, Wei and Qiu. This is an open-access article distributed under the terms of the Creative Commons Attribution License (CC BY). The use, distribution or reproduction in other forums is permitted, provided the original author(s) and the copyright owner(s) are credited and that the original publication in this journal is cited, in accordance with accepted academic practice. No use, distribution or reproduction is permitted which does not comply with these terms.
*Correspondence: Bin Lu, bHViaW4wOTIxQDE2My5jb20=; Zhen Qiu, cWl1emhlbjMxNkAxNjMuY29t