 Zhong-Yuan Liu
 Di-Quan Li
 Yecheng Liu
 Xian Zhang
- 1Key Laboratory of Metallogenic Prediction of Nonferrous Metals and Geological Environment Monitoring (Central South University), Ministry of Education, Changsha, China
- 2Key Laboratory of non-ferrous and geological hazard detection, Changsha, China
- 3School of Geosciences and Info-Physics, Central South University, Changsha, China
The wide-field electromagnetic (WFEM) method is widely used in resource exploration in complex geological environments due to its effectiveness in deep detection, interference resistance, and adaptability to various surface conditions. Noise interference remains a significant challenge in areas with high human activity, such as mining regions and urban environments. In these regions, electromagnetic noise is often complex, non-periodic, and pseudo-random, severely degrading the signal-to-noise ratio (SNR) and complicating subsurface interpretation. Traditional denoising methods struggle to effectively handle such complex, non-periodic noise. We propose a novel denoising approach that combines Particle Swarm Optimization (PSO) and Grey Wolf Optimization (GWO) to optimize a Convolutional Neural Network (CNN). This hybrid algorithm enhances CNN’s ability to extract nonlinear features and effectively separate multiple noise types, such as Gaussian white noise, impulse noise, and attenuation noise. The method was tested on WFEM data from the Sichuan Changning Block and the Shanxi Xinyuan Coal Mine area. Simulation results demonstrate that the PSO-GWO-optimized CNN effectively handles complex, non-periodic noise, improving signal clarity and successfully reducing noise interference, thereby enhancing data quality and enabling more accurate geological interpretations. The integration of CNN with PSO-GWO optimization not only improves the SNR but also enhances interpretative accuracy in resource exploration. The successful application of this method in regions with strong electromagnetic interference highlights its broader applicability and practicality.
1 Introduction
The Wide-Field Electromagnetic (WFEM) is a highly efficient geophysical exploration method commonly used in resource detection, such as shale gas and groundwater exploration. This technology provides strong deep-detection capabilities, high interference resistance, and adaptability to complex surface conditions. However, variations in electromagnetic noise characteristics across different geological blocks and exploration types severely affect data quality, posing a primary challenge for the effective application of WFEM technology (Zhu et al., 2022; Tian et al., 2024; Giannino and Leucci, 2021).
In shale gas and groundwater exploration, noise sources and characteristics vary by region, especially in areas with high human activity, such as mining zones and urban environments, where electromagnetic noise is complex and highly non-periodic (Wang and Cao, 2022). These noise factors reduce the signal-to-noise ratio (SNR), complicating the accurate interpretation of subsurface geological structures. Traditional denoising methods have limited effectiveness in handling complex, non-periodic, and pseudo-random noise, making it crucial to enhance WFEM data SNR and adaptability for various geological blocks in geophysical exploration applications (Bryakin et al., 2024; Wang et al., 2024).
In recent years, the combination of optimization algorithms with machine learning has offered new solutions for tackling complex noise problems. Particle Swarm Optimization (PSO) and Grey Wolf Optimization (GWO) have proven effective in optimizing model parameters, significantly improving the adaptability of denoising models (Kong et al., 2023; Amor et al., 2023; Gomez-Cabrera and Escamilla-Ambrosio, 2022; Nguyen and Wahab, 2023). Meanwhile, Convolutional Neural Networks (CNNs), with their strong nonlinear feature extraction capabilities, can effectively identify and separate valid signals amidst complex noise backgrounds (Jayakarthik et al., 2024; Chaupal and Rajendran, 2023; Ren et al., 2023; Xiang et al., 2022; Kord et al., 2024; Birnie and Alkhalifah, 2022). The integration of optimization algorithms and machine learning enables adaptive optimization of denoising strategies, improving electromagnetic data quality and geological interpretation accuracy (Li et al., 2024; Veluchamy et al., 2023; Zhu et al., 2023).
To address these challenges, this study proposes an innovative WFEM data denoising method that combines PSO and GWO to optimize CNN. By leveraging CNN’s ability to extract nonlinear features, the method effectively identifies and separates various types of noise (such as Gaussian white noise, impulse noise, and attenuation noise), enhancing denoising accuracy. The PSO-GWO hybrid algorithm adjusts CNN hyperparameters, improving model adaptability to diverse noise environments. A sample library was created, covering shale gas and groundwater exploration regions, from which typical signal features were extracted for noise identification and removal using the PSO-GWO-optimized CNN model. Simulation results indicate that this method significantly outperforms traditional techniques in terms of SNR enhancement and its ability to manage complex, non-periodic noise. Applied in the Sichuan Changning Block for shale gas exploration and the Shanxi Xinyuan Coal Mine for groundwater exploration, this denoising approach has notably improved WFEM data quality and geological interpretation reliability, providing a robust solution to noise challenges in geophysical exploration.
2 Theoretical basis
2.1 Principles of WFEM methods and noise analysis
2.1.1 Principles of WFEM methods
WFEM method is an innovative technique for artificial-source frequency-domain electromagnetic depth measurement, first introduced by Academician He Jishan. This method effectively integrates the advantages of CSAMT’s artificial fields to reduce field randomness, while also benefiting from MELOS’s non-far-field measurements. The WFEM observation device is shown in Figure 1.
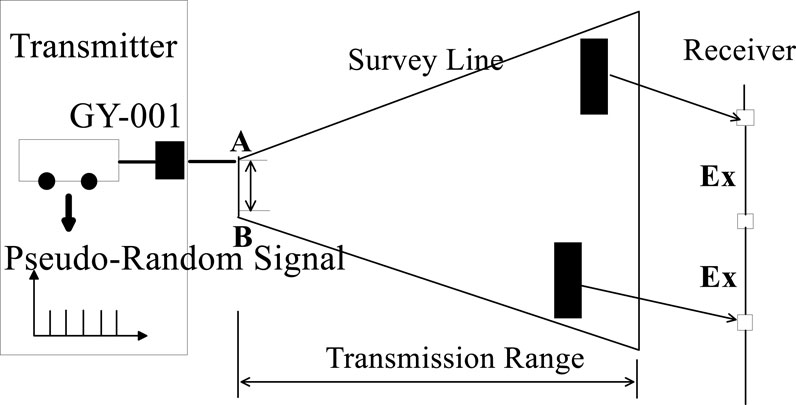
Figure 1. WFEM observation device schematic diagram.
WFEM meticulously defines the formula for calculating apparent resistivity, which is applicable across the entire field, thus expanding the observational range and enhancing the speed, precision, and efficiency of fieldwork. For a uniform surface, the expression for the electric field of a horizontal electric dipole source is given as follows (Equation 1). The apparent resistivity is then computed based on this electric field, as detailed in Equation 2. The relationship between the electric field and the voltage difference , necessary for the calculation, is shown explicitly in Equation 3.
The apparent resistivity over a wide field is expressed as:
Where: 'I' denotes the supply current; 'dL' is the length of the electric dipole source; 'i' represents the imaginary unit; 'k' is the wavenumber of the uniform half-space; 'r' is the transmission and reception distance, which is the distance from the observation point to the center of the dipole; 'σ' is the conductivity; 'φ' is the angle between the direction of the electric dipole source and the radius vector from the source’s midpoint to the reception point; 'ΔVMN' is the observed potential difference; 'MN' is the measurement electrode distance; 'KE-Ex' is the device coefficient; 'FE-Ex' is the electromagnetic response function. By conducting measurements over a vast area, including both far-field and non-far-field components, and observing parts of the artificial source electromagnetic field, we can apply iterative calculations to extract underground apparent resistivity information. This forms the fundamental principle of WFEM.
2.1.2 Analysis of noise types and their effects on electromagnetic signals
In electromagnetic exploration, noise significantly impacts signal processing and target identification. Common noise types include Gaussian white noise, impulse noise, decaying noise, square wave noise, and triangular wave noise. This section analyzes the characteristics of these five typical noise types in both the time and frequency domains and their interference with primary frequency information.
Gaussian White Noise: Gaussian white noise is a random noise type with a flat power spectral density, following a Gaussian distribution. Figure 2a shows that this noise causes random fluctuations in the time domain, reducing the smoothness of the signal.
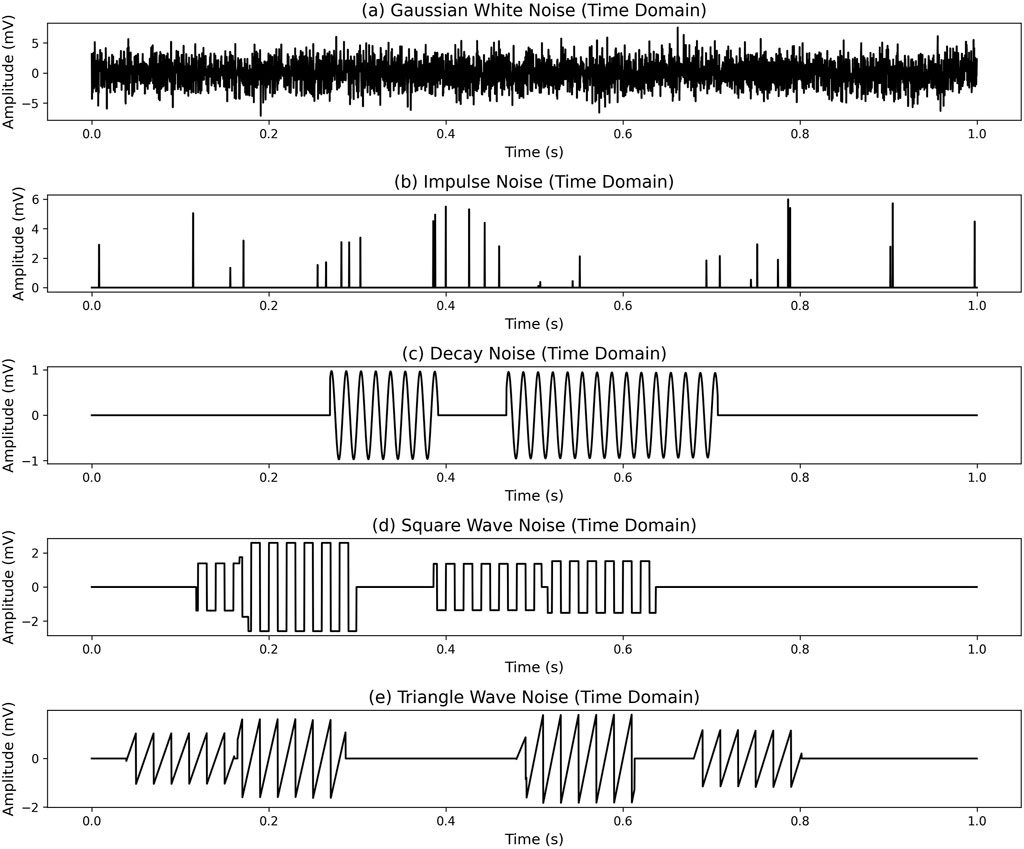
Figure 2. Time-domain analysis of noise types: (a) time-domain plot of Gaussian white noise, (b) time-domain plot of impulse noise, (c) time-domain plot of decay noise, (d) time-domain plot of square wave noise, (e) time-domain plot of triangular wave noise. The x-axis in the plots represents time (in seconds), and the y-axis represents amplitude (in millivolts, mv), showing how different noise types vary over time.
Impulse Noise: Impulse noise appears as brief, high-amplitude spikes. Figure 2b illustrates these sudden peaks in the time domain, which disrupt the amplitude and transient characteristics of the signal.
Decaying Noise: Decaying noise, often caused by power system interference, typically occurs around 60 Hz. Figure 2c shows its oscillatory waveform with decreasing amplitude over time.
Square Wave Noise: Square wave noise, a periodic noise, is characterized by rapid transitions between high and low levels, forming a regular alternating waveform. Figure 2d shows the periodic nature of square wave noise, which introduces repeating interference patterns in the time domain and alters the signal’s frequency characteristics.
Triangular Wave Noise: Triangular wave noise, another periodic noise, exhibits a linear rise and fall in the time domain. Figure 2e shows its smoother waveform compared to square wave noise, but its periodic nature still impacts the signal. Triangular wave noise significantly affects the signal’s frequency spectrum, similar to square wave noise.
Each noise type has unique interference mechanisms: Gaussian White Noise weakens frequency resolution due to its flat spectrum. Impulse Noise causes high-amplitude, short-duration disturbances, leading to frequency aliasing. Decaying Noise enhances instability in specific frequency ranges, especially around 60 Hz. Square and Triangular Wave Noise introduce periodic changes in the frequency spectrum, altering signal characteristics.
By analyzing these noise characteristics, we provide a theoretical basis for developing noise suppression algorithms, enhancing the accuracy and reliability of electromagnetic signal processing.
2.2 Integration of optimization algorithms and CNN
This study employs a hybrid approach combining Particle Swarm Optimization (PSO) and Grey Wolf Optimization (GWO) to optimize the parameters of machine learning models for denoising electromagnetic data across different geological blocks. PSO seeks to find a global optimum by simulating collaborative behaviors within a swarm, making it particularly effective for rapidly optimizing nonlinear parameters, especially during the initial hyperparameter tuning of machine learning models. The update equations for PSO are as follows (Equations 4, 5):
where ‘vi’ is the particle velocity, ‘xi’ is the particle position, ‘pi’ is the particle’s historical best position, ‘g’ is the global best position, ‘w’ is the inertia weight, ‘c1’ and ‘c2’ are learning factors, and ‘r1’ and ‘r2’ are random numbers. d.
In contrast, GWO optimizes parameters by simulating the hunting behavior of grey wolves, demonstrating strong global search capabilities. It is especially suited for deep optimization in complex noise environments. Its update equations are given as follows (Equations 6, 7):
where ‘D’ is the position vector, ‘C’ and ‘A’ are control parameters, and ‘Xleader’ is the current best position.
The combination of PSO and GWO integrates the advantages of fast convergence and robust global search. PSO performs an efficient initial search, quickly approaching optimal solutions, while GWO refines these solutions with detailed global searches in later stages, minimizing the risk of local optima. This hybrid approach allows the model to adapt more effectively to diverse noise characteristics, achieving optimal denoising performance.
Convolutional Neural Networks (CNNs) are deep feedforward networks based on convolutional operations. Initially developed in the 1980s with architectures like time delay networks and LeNet-5, CNNs gained widespread use in the 21st century, with advances in deep learning theory and computational hardware. Traditional CNN architecture includes an input layer, convolutional layers, pooling layers, fully connected layers, and an output layer. By alternating convolutional and pooling layers, CNNs can achieve higher training accuracy. Their primary strengths lie in their ability to extract key features from large datasets without complex manual feature extraction and their weight-sharing architecture, which reduces parameter requirements and improves processing efficiency. In this study, we use CNNs for signal-noise identification in WFEM data, adopting a multi-layer convolutional structure without pooling layers.
The proposed denoising method, integrating PSO, GWO, and CNN, is designed to address complex noise across various geological regions. Compared to single optimization algorithms, this hybrid approach offers several distinct advantages: First, the balance between global and local optimization reduces the likelihood of local optima, enhancing model adaptability in diverse noise environments. Second, the combined algorithm exhibits greater robustness against various noise types, enabling effective adaptation to a wide range of geological conditions. Finally, the model dynamically adjusts in complex conditions through parameter optimization at different stages, significantly improving the signal-to-noise ratio.
2.3 Technical approach
The proposed denoising method for WFEM data integrates PSO-GWO-CNN and consists of seven main stages (Figure 3):
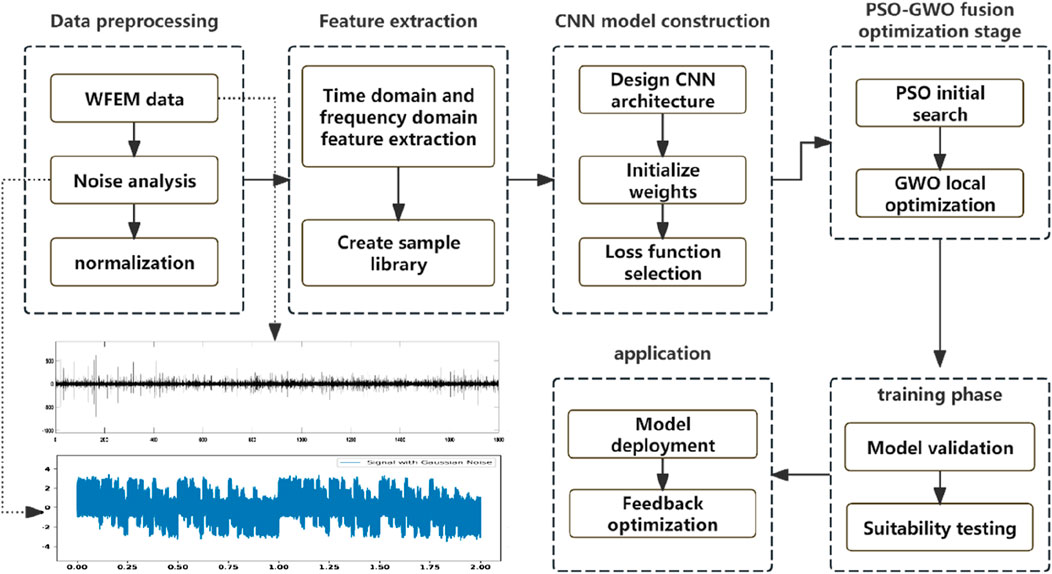
Figure 3. Flow chart of denoising method using integrated PSO and GWO with CNN.
Data Preprocessing: Raw EM data is collected, and noise characteristics are analyzed across geological blocks. The data is standardized to minimize variability and noise-induced distortions.
Feature Extraction: Time-domain and frequency-domain features are extracted to create a labeled dataset for training and validation, highlighting key signal and noise characteristics.
CNN Model Construction: An optimized CNN architecture is designed, with convolutional layers, fully connected layers, and a tailored loss function (MSE or Cross-Entropy Loss) to distinguish between noise and signal features.
PSO-GWO Hybrid Optimization:
PSO conducts a global search to quickly identify optimal configurations (kernel sizes, learning rates), aiding initial hyperparameter tuning.
GWO refines the solutions by applying a local optimization strategy, avoiding local optima and improving convergence.
PSO Parameters: The particle count and inertia weight (w) balance exploration and refinement. Learning factors (c1, c2) affect convergence speed.
GWO Parameters: Roles of alpha (α), beta (β), and delta (δ) wolves guide the search, while control parameters (A, C) adjust exploration and exploitation.
Training: Preprocessed data is fed into the CNN using PSO-GWO-optimized hyperparameters. Weights are fine-tuned via backpropagation to minimize the loss function and ensure convergence.
Testing and Validation: Performance is assessed with SNR and MSE, evaluating adaptability to different noise environments and geological settings (e.g., Sichuan Changning Block for shale gas, Shanxi Xinyuan Coal Mine for groundwater).
Deployment: The trained model is deployed in a real-time geological survey system, processing WFEM data on-site. Continuous feedback allows for iterative adjustments to handle new noise types or geological complexities.
3 Application study of electromagnetic data denoising method based on integrated optimization algorithms
3.1 Geological background and noise characteristics
This section introduces the geological background and noise characteristics of the study area, which serve as the foundation for data acquisition and the construction of denoising models for wideband electromagnetic methods. The geographical and stratigraphic characteristics of different geological blocks significantly influence the application of wideband electromagnetic techniques. The Longmaxi Formation in the southern Changning Block of Sichuan and the Xinyuan Coal Mine in the northwest of the Qinshui Coalfield are typical exploration targets for shale gas and groundwater, respectively. The geological features of each block determine their electromagnetic response and noise sources, requiring tailored denoising strategies for each region.
3.1.1 Shale gas exploration
The shale gas reservoir in the Longmaxi Formation is located in the Sichuan Basin, as shown in Figure 4a. This formation consists mainly of complex marine shale, including gray-black calcareous shale and black shale interbedded with pyrite and calcareous bands, exhibiting notably low resistivity. The burial depth ranges from 3,000 to 6,000 m. Figure 4b shows the survey line layout, with multiple survey lines deployed around well sites X1, X2, and X3 to support comprehensive subsurface characterization.
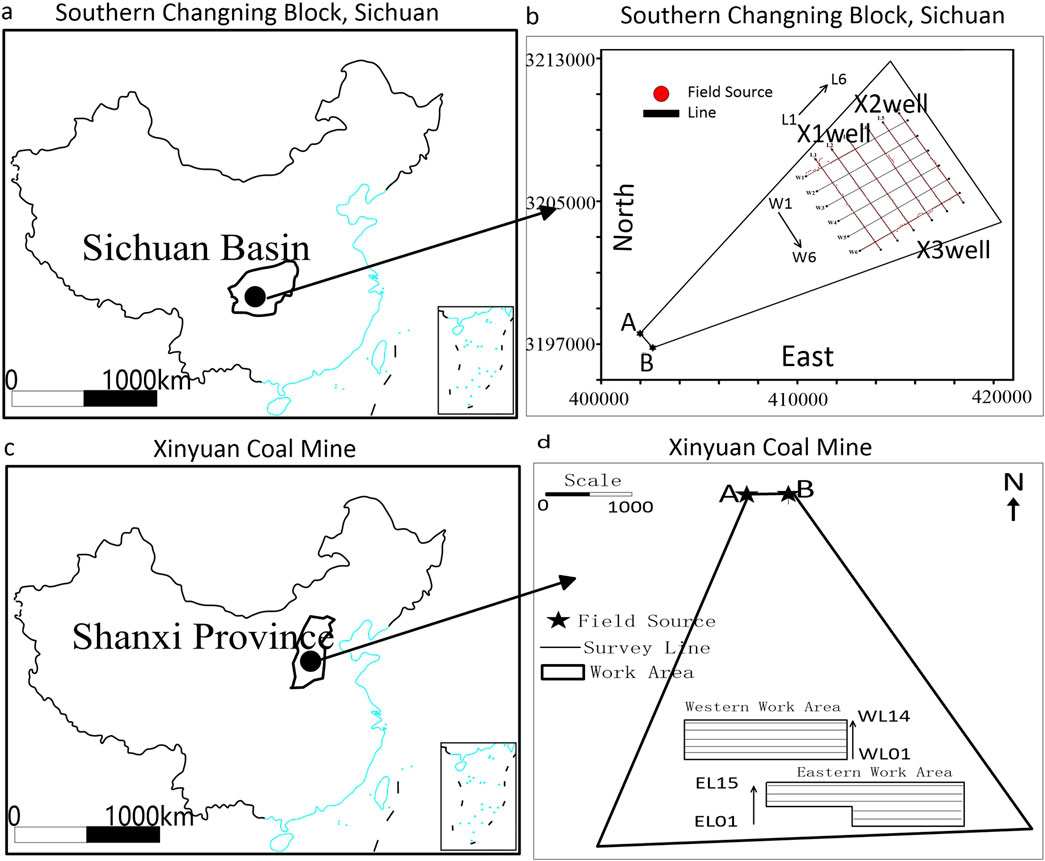
Figure 4. Geographical Location and Survey Line Layout Map of Sichuan Changning Block and Xinyuan coal mine: (a) Map showing the Sichuan Basin in southwestern China, (b) Detailed field source and line layout, (c) Map indicating the Xinyuan coal mine, (d) Survey line layout map of Xinyuan coal mine.
3.1.2 Groundwater exploration
The Xinyuan Coal Mine is located in the northwest of the Qinshui Coalfield, within the North China Carboniferous-Permian Basin, as indicated in Figure 4c. The region is covered by Quaternary strata, typical of loess hilly terrain. The main strata include Quaternary gravel layers and Permian and Carboniferous formations. The survey line layout for this block is shown in Figure 4d. Coal-bearing strata primarily occur in the Shanxi and Taiyuan formations, which exhibit relatively high resistivity. When saturated with groundwater, the high mineralization of mine water results in lower resistivity. There is a significant resistivity contrast between coal seams, surrounding rocks, and water-rich zones, effectively mapped using the deployed survey lines.
3.1.3 Noise characteristics
In shale gas and groundwater exploration, noise characteristics vary significantly. In the shale gas blocks, noise is mainly caused by topographic variations and industrial activities, while in the groundwater blocks, natural terrain changes and mining activities are the primary noise sources. To improve the signal-to-noise ratio (SNR) of electromagnetic data, it is essential to design adaptive denoising strategies tailored to the specific noise characteristics of each geological block.
3.2 Simulation experiments on the impact of noise types on electromagnetic signals
This section investigates the effects of different types of noise on electromagnetic signals through simulation experiments. To systematically evaluate the impact of noise on signal quality, five noise types—Gaussian white noise, impulse noise, attenuation noise, square wave noise, and triangular wave noise—are considered. Their characteristics in both time and frequency domains are analyzed.
The noise modeling uses the following parameter settings: Gaussian White Noise: Standard deviation of 0.5, simulating moderate background noise. Attenuation Noise: Initial frequency of 60 Hz, decay rate of 0.05, simulating typical interference from power systems. Square Wave Noise: Period of 1 m, amplitude ±1, simulating periodic equipment operation interference.
The simulation process consists of the following steps: generating an electromagnetic signal as the baseline signal; adding the five different types of noise to create signals under various noise environments; and analyzing the interference characteristics of each noise type through time-domain waveforms and frequency-domain spectra. The results indicate that different types of noise lead to distinct time-frequency characteristics, laying the groundwork for further studies on the noise resilience of electromagnetic signals.
Based on the analysis of the noise types and their impact on electromagnetic signals, the following conclusions are drawn: Gaussian White Noise (Figure 5) exhibits a uniformly distributed frequency spectrum. When added to the signal, it causes random fluctuations in the time-domain waveform, diminishing the signal’s regularity. In the frequency domain, the flat spectrum leads to spectrum expansion, reducing the signal-to-noise ratio (SNR) and making it more difficult to extract key frequency components. Attenuation Noise (Figure 6) presents a decaying sinusoidal oscillation in the time domain, with most energy concentrated around 60 Hz and its harmonics. In the frequency domain, it forms energy peaks. When the target signal’s main frequency overlaps with these noise frequencies, the signal stability is compromised. Square Wave Noise (Figure 7) has periodic voltage switching characteristics, generating rich high-order harmonic components in the frequency domain. This increases the complexity of frequency spectrum analysis and weakens the ability to identify high-frequency components of the signal.
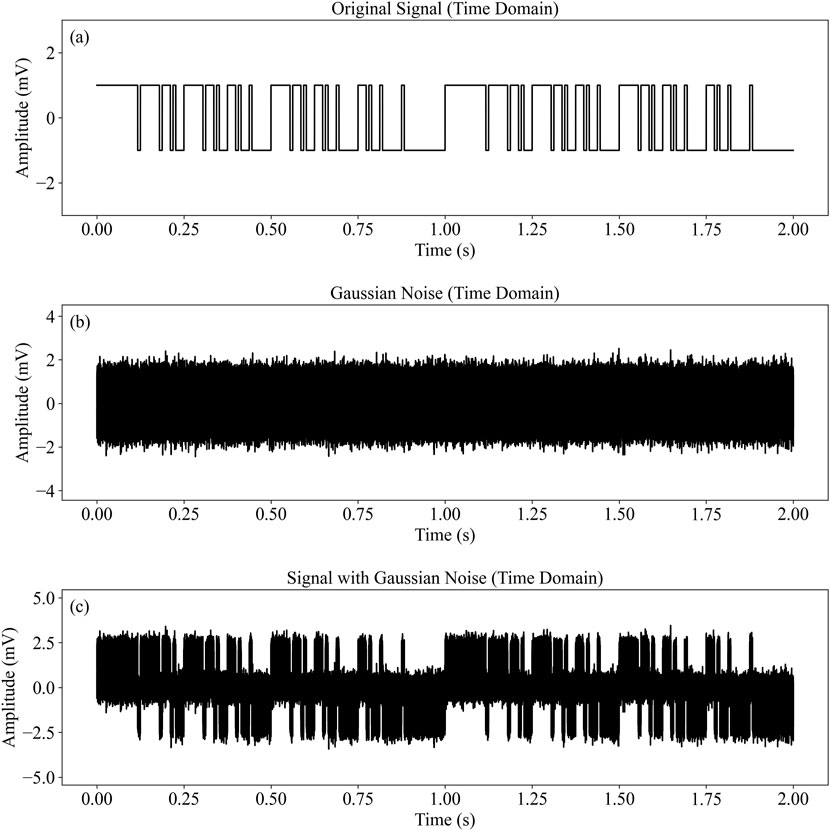
Figure 5. Time-domain and frequency-domain characteristics of the 7-2 frequency group with Gaussian white noise: (a) Original signal in time domain, (b) Gaussian noise in time domain, (c) Signal with Gaussian noise in time domain.
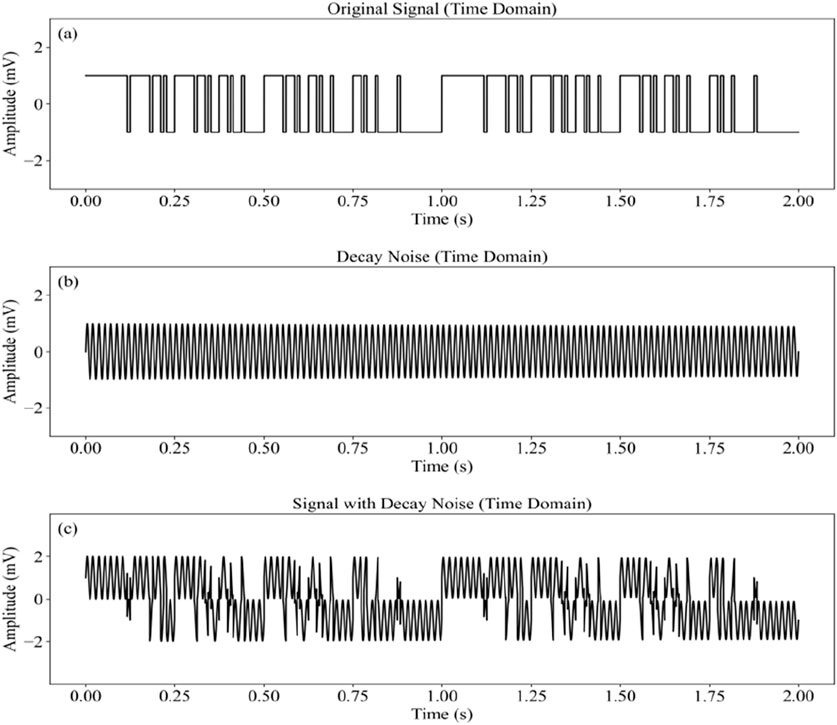
Figure 6. Time-domain and frequency-domain characteristics of the 7-2 frequency group with attenuation noise: (a) Original signal in time domain, (b) attenuation noise in time domain, (c) Signal with attenuation noise in time domain.
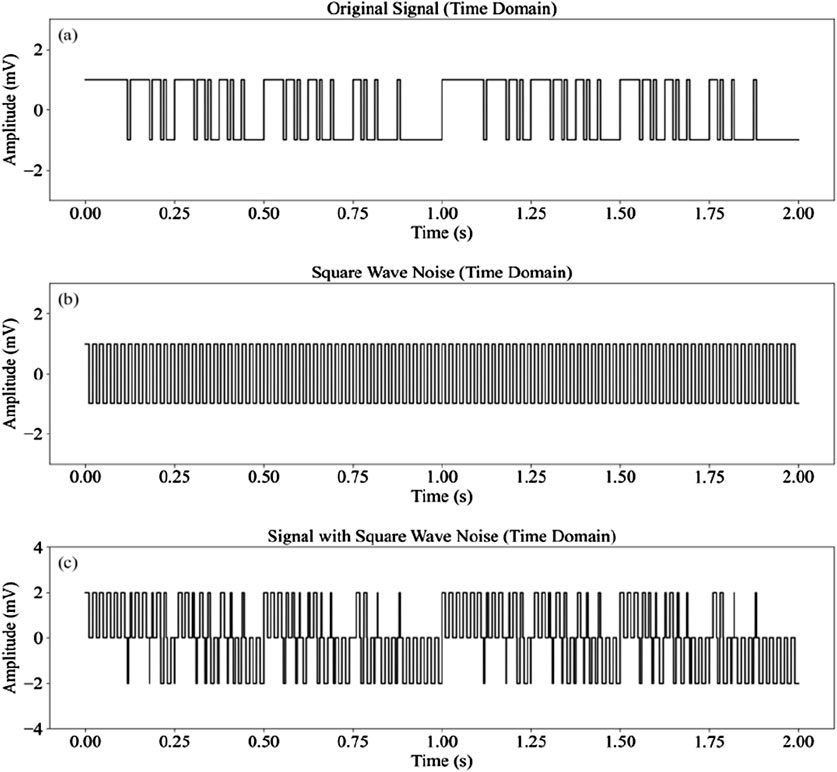
Figure 7. Time-domain and frequency-domain characteristics of the 7-2 frequency group with square wave noise: (a) Original signal in time domain, (b) square wave noise in time domain, (c) Signal with square wave noise in time domain.
Each type of noise interferes with the electromagnetic signal in different ways: Gaussian white noise reduces frequency resolution by uniformly covering the spectrum. Attenuation noise selectively interferes by concentrating energy at specific frequencies. Square wave noise impacts both high and low-to-mid frequency components through its harmonic components, complicating the identification of the signal’s frequency structure.
3.3 Construction and training of machine learning models with fusion optimization algorithms
3.3.1 Data source, sample construction, and noise type analysis
This study focuses on the Sichuan South Changning Block as the research area, where 60 high-quality Class 1 data points were collected. Figure 8 show two typical sampling points, where the data quality is good, with low time-domain noise and smooth frequency-domain curves. Each data point consists of 1800 samples with a sampling rate of 300 Hz. To analyze the impact of different noise types on the signal, all collected data were divided into 10 equal-length segments, generating a total of 600 data segments.
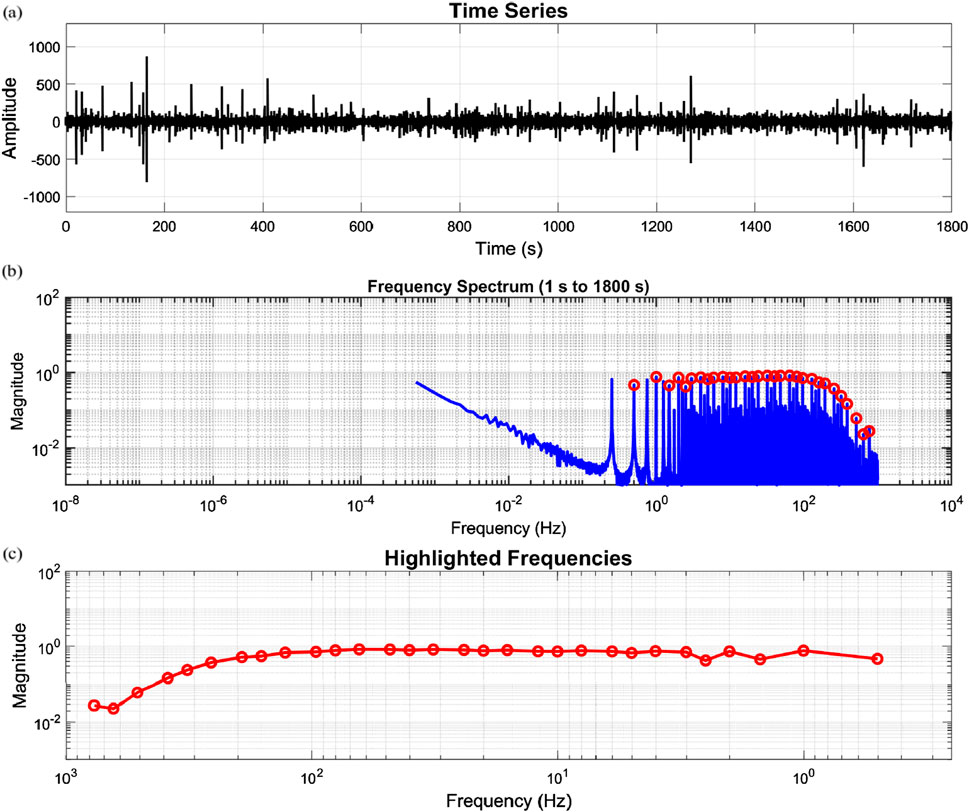
Figure 8. Type 1 points in Changning block: (a) Time series of the signal, (b) Frequency spectrum (1 s–1800 s), (c) Highlighted frequencies in the spectrum.
To simulate noise interference in real-world measurements, five noise types—Gaussian white noise, impulse noise, attenuation noise, square wave noise, and triangular wave noise—were introduced into each data segment. Thirty sets of data samples were generated for each noise type. After this process, each data segment with added noise produced 180 samples, resulting in a total of 108,000 samples from the 60 sampling points, thus constructing a comprehensive dataset encompassing multiple noise types.
The generated dataset was divided into training and validation sets in a 5:1 ratio, with the training set containing 90,000 samples and the validation set containing 18,000 samples. All samples are stored in a unified. dat file format. This simulation and sample generation method, based on multiple noise types, successfully created a dataset suitable for a variety of noisy environments, providing reliable data support for subsequent signal processing and analysis.
3.3.2 Multi-domain feature analysis
This section focuses on extracting key temporal statistical features from pseudo-random signals to quantitatively identify the signal-to-noise ratio (SNR). By analyzing parameters such as the signal’s maximum value, peak-to-peak value, peak factor, and impulse factor, we aim to better understand the relationship between wide-area electromagnetic signals and noise.
Figure 9 presents a comparison between the original signal and the signal after adding multiple types of noise. The blue curve represents the original signal, while the red curve shows the signal with combined noise, including Gaussian white noise, impulse noise, attenuation noise, triangular wave noise, and square wave noise. The comparison indicates that after the addition of noise, the signal fluctuations are significantly amplified, with an increase in amplitude peaks.
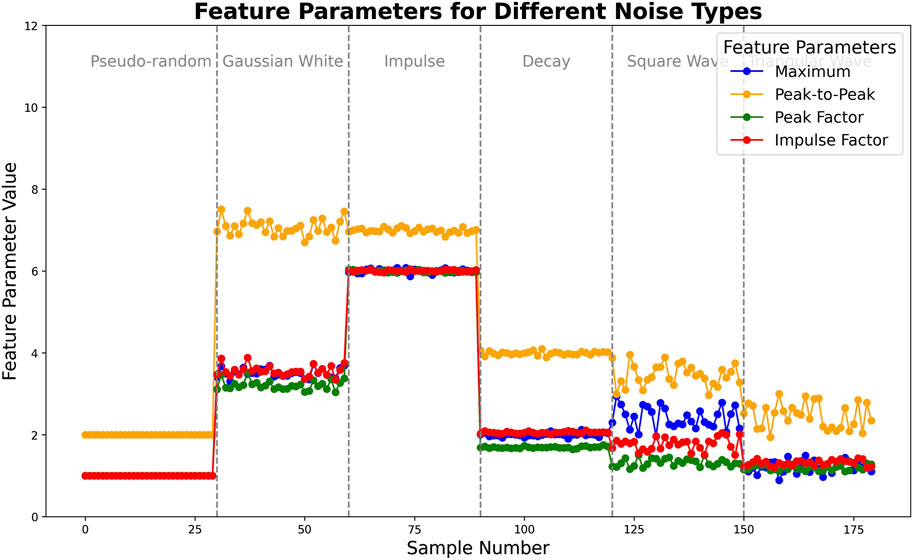
Figure 9. Feature parameters across different noise types over sample numbers: Maximum, peak-to-peak, peak factor, and impulse factor.
Figure 10 shows that the feature parameter values of the noisy signal are higher than those of the pseudo-random signal, which exhibits more stable and smaller amplitude values. In time-domain statistical features, such as maximum value, peak-to-peak value, peak factor, and impulse factor, significant differences in signal characteristics can be effectively reflected. These parameters show strong distinguishing ability in the sample library, accurately differentiating between pseudo-random signals and noisy signals. Through multi-level analysis of time-domain feature parameters, rich information is provided for signal characterization. Using these feature parameters in conjunction enhances the signal-to-noise separation ability in clustering analysis, thus improving the accuracy and effectiveness of noise identification.
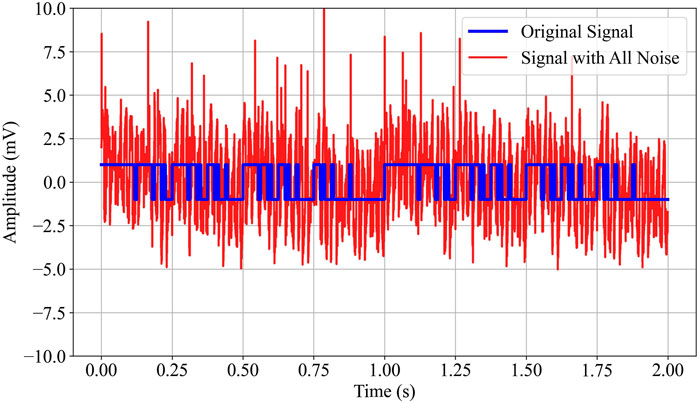
Figure 10. Time-domain comparison between the original signal and the signal with combined noise.
3.3.3 Model training
To enhance the denoising performance of the model, we combine Particle Swarm Optimization (PSO) and Grey Wolf Optimization (GWO). These well-established optimization algorithms each offer distinct advantages: PSO accelerates initial hyperparameter optimization by exploring the search space efficiently, while GWO refines solutions and avoids local optima, ensuring better convergence and adaptability in complex environments.
By leveraging the strengths of both, PSO quickly identifies near-optimal solutions, and GWO fine-tunes them for robust performance. This combined approach optimizes model hyperparameters, significantly improving denoising accuracy.
The model construction and optimization process, shown in Figure 11, starts with data preprocessing, followed by PSO-based initial optimization, GWO refinement, CNN model construction, and training. Figure 12 presents the convergence curves for PSO, GWO, and their combination, demonstrating that the PSO-GWO strategy outperforms PSO alone in terms of convergence speed and validation loss. This combined optimization leads to lower validation loss and improved stability during training, showing that the integrated approach ensures higher accuracy and reliability in noisy electromagnetic data processing.
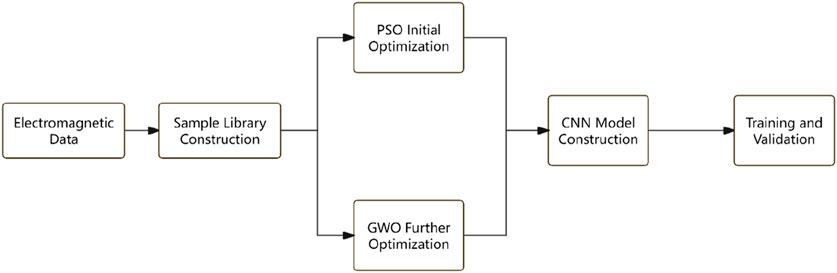
Figure 11. Model construction and optimization flowchart.
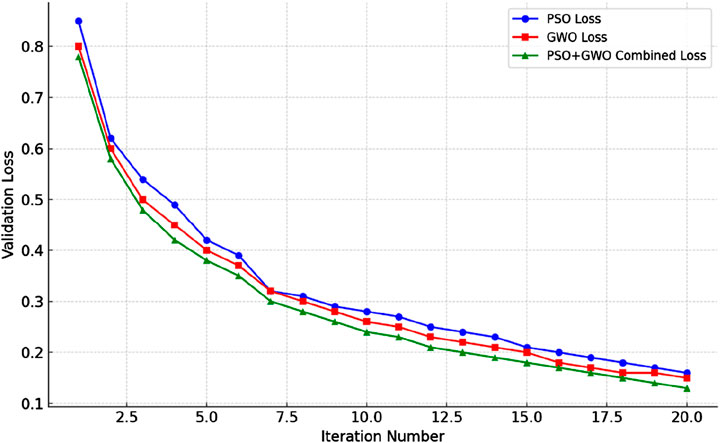
Figure 12. Validation loss curves for PSO, GWO, and PSO + GWO optimization.
We performed data preprocessing, including normalization, feature extraction, and segmentation, before training the Convolutional Neural Network (CNN). We used Mean Squared Error (MSE) as the loss function, optimizing hyperparameters such as learning rate, batch size, and epochs using the Adam optimizer to accelerate convergence. Training and validation loss curves were plotted to evaluate the model’s performance and check for overfitting.
We compared the performance of different models (U-Net, LSTM, CNN) in electromagnetic signal denoising, as shown in Figure 13. The CNN consistently outperforms both U-Net and LSTM, with lower loss curves, indicating superior denoising performance and better generalization. This suggests that the CNN model, optimized with PSO-GWO, provides more stable and effective denoising results than the other models.
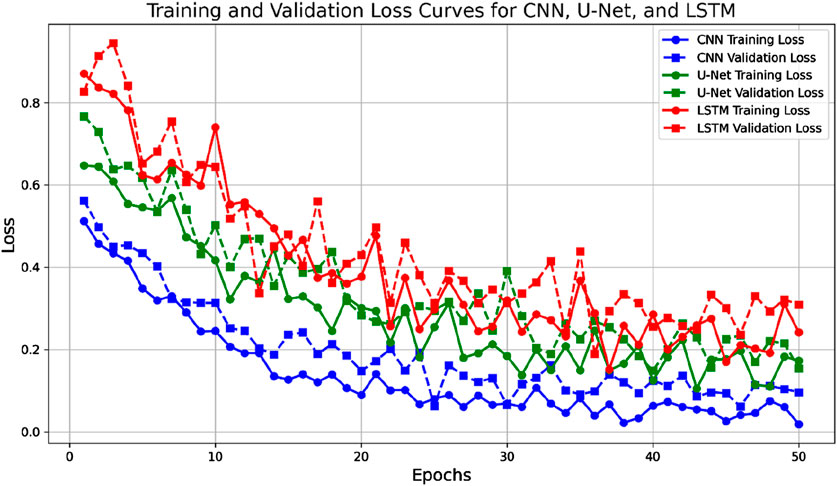
Figure 13. Training and validation loss curves of U-Net, LSTM, and CNN.
3.4 Denoising analysis of the fusion-optimized machine learning model for WFEM data
This section evaluates the denoising performance of the fusion-optimized machine learning model, focusing on its effectiveness in improving geological interpretation resolution. Through quantitative metrics and visualization techniques, we assess the model’s performance and its contribution to more accurate geological interpretation.
3.4.1 Quantitative metrics and comparisons
To evaluate the performance of the denoising algorithms, we use two key metrics: Signal-to-Noise Ratio (SNR) and Mean Squared Error (MSE). The SNR measures the relative strength of the signal compared to noise, and the MSE quantifies the deviation between predicted and actual values, indicating the denoising accuracy.
The proposed method was applied to 15 measurement points from both shale gas and groundwater blocks. Table 1 presents SNR and MSE values before and after denoising for LSTM, CNN, and the optimized CNN (Opti-CNN). The results show that Opti-CNN consistently outperforms other methods, achieving the highest SNR and the lowest MSE.
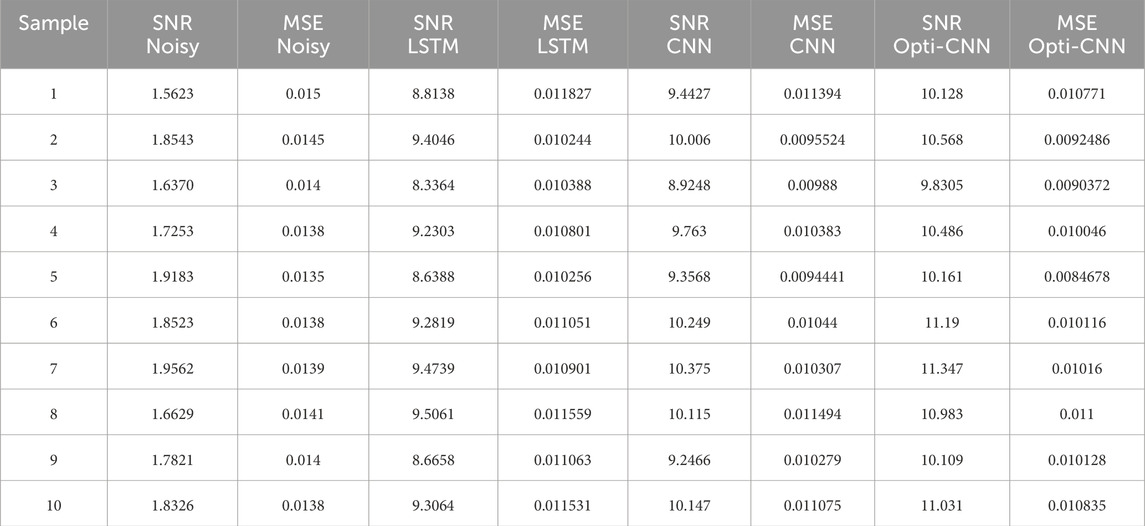
Table 1. Denoising performance data.
Figure 14 compares the denoising performance of different methods. The Opti-CNN method significantly improves signal clarity and reduces denoising error, contributing to more precise geological interpretations.
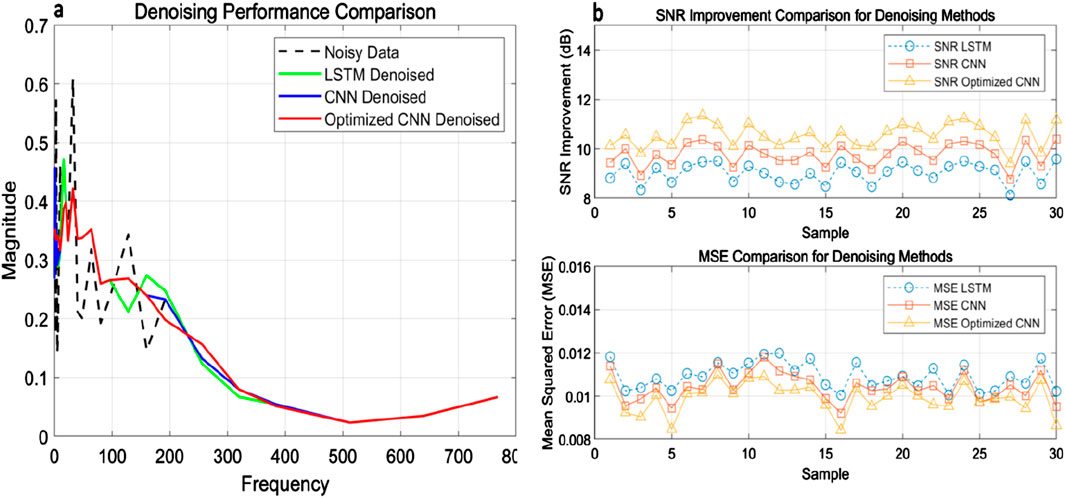
Figure 14. Denoising Performance Comparison with SNR and MSE Metrics for Various Methods. (a) Denoising performance comparison, (b) SNR and MSE comparison for denoising methods.
Figure 15 illustrates the denoising effects using PSO and GWO integrated with CNN. Subfigures a and b display results for different methods at two measurement points (Point 1 and Point 30), while subfigures c, d, e, and f focus on results for the optimized CNN at four other points (Point 13, 14, 19, and 24). The raw data (black triangles) show significant fluctuations, especially in the high-frequency range. After applying the LSTM (green stars), fluctuations are reduced, but residual noise remains. The CNN method (blue squares) improves smoothness, particularly in mid-to-high frequencies. The optimized CNN (red circles) provides the best performance, producing smooth curves that closely match the original signal trend with minimal residual noise.
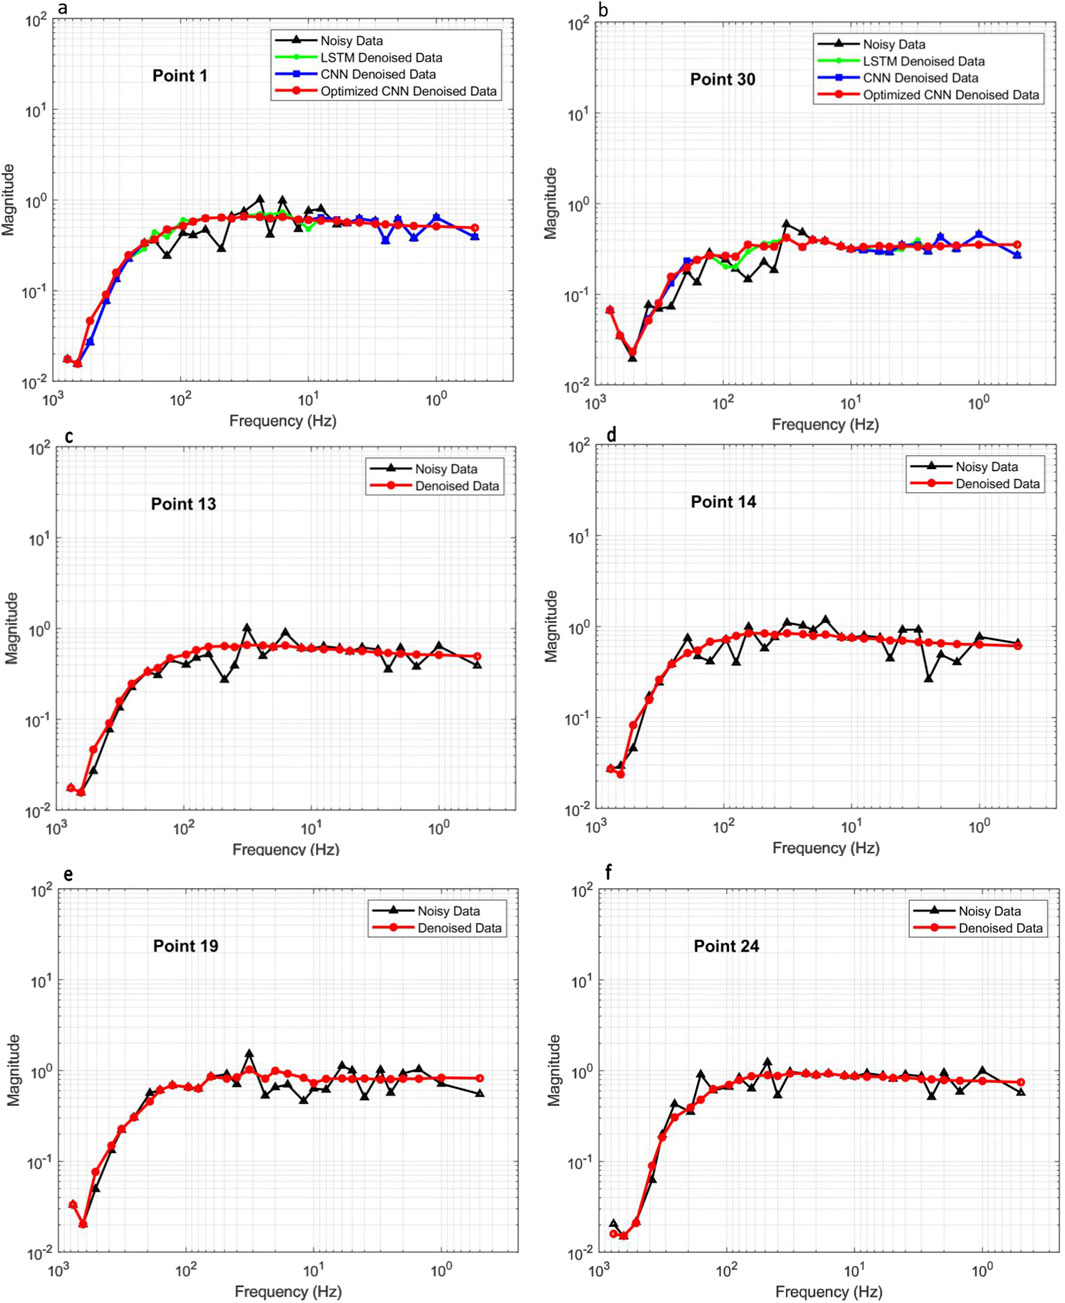
Figure 15. Impact of Integrating Optimization Algorithms (PSO + GWO) with CNN on the Denoising Effect of Measured Data. (a-f) show the resistivity vs. frequency curves for measurement points 1, 30, 13, 14, 19, and 24, respectively.
The integration of PSO and GWO significantly enhances the CNN model by optimizing hyperparameters for improved denoising. PSO explores the hyperparameter space quickly, while GWO refines the model to avoid local optima, ensuring superior denoising performance and better generalization.
3.4.2 Inversion results and analysis
To assess the practical effectiveness of the proposed model, we apply a one-dimensional inversion algorithm to wide-area electromagnetic data, comparing results before and after denoising. Consistent conditions are maintained throughout the inversion process:
Initial Model: A resistivity model is constructed based on geological background information. Inversion Parameters: Iteration count, damping coefficient, and regularization parameters are kept constant to ensure consistency. Data Processing: Both raw and denoised data undergo identical preprocessing steps (normalization and frequency selection) to ensure reliable comparison.
Figure 16d shows the interpreted cross-sectional profile based on apparent depth-apparent resistivity data from line EL8. The profile reveals four low-resistivity zones, indicative of electrical discontinuities, which are identified as fault structures based on geological data. Figures 16a–c show inversion results from conventional processing, CNN denoising, and the optimized CNN model (PSO + GWO), respectively. A comparison with well log data reveals discrepancies in resistivity depth for both conventional processing and CNN-denoised results. However, the optimized CNN model significantly enhances both vertical and horizontal resolution, aligning better with well log data and improving geological interpretation accuracy.
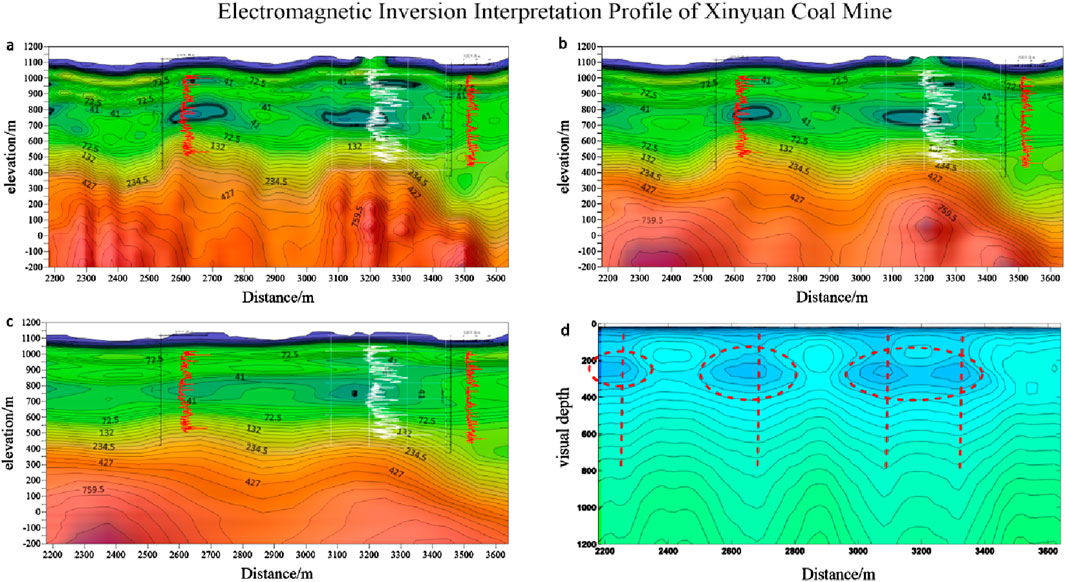
Figure 16. Electromagnetic Inversion Interpretation Profile of Xinyuan Coal Mine. (a) Electromagnetic inversion profile using conventional processing, (b) Electromagnetic inversion profile with CNN denoising, (c) Electromagnetic inversion profile with optimized CNN model (PSO + GWO), (d) Cross-sectional interpretation based on apparent depth-apparent resistivity data.
Similarly, Figures 17a, b show inversion results for the Changning Block, following the same trend. The CNN-based denoising method offers superior resolution and accuracy, refining inversion results and better aligning with geological and well log data. This improves the overall interpretation of electromagnetic survey data.
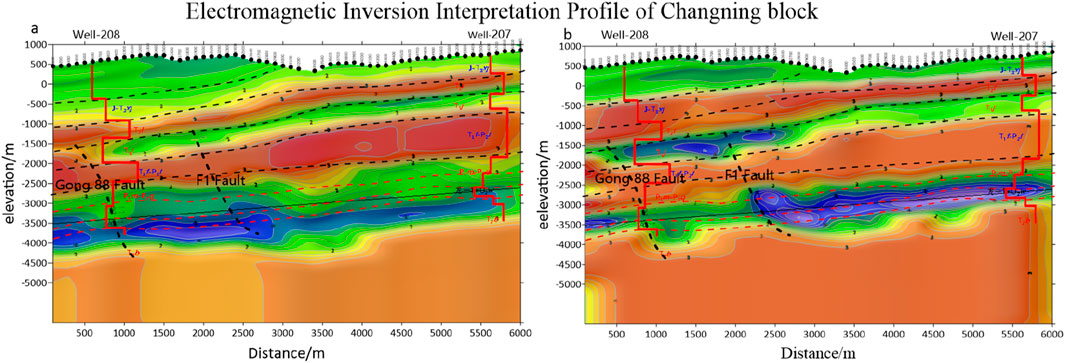
Figure 17. Electromagnetic Inversion Interpretation Profile of Changning block. (a) is the Electromagnetic Inversion Interpretation Profile of the Changning block for survey line L1, and (b) is the Electromagnetic Inversion Interpretation Profile of the Changning block for survey line L2.
The denoised data enhances target layer identification and anomaly detection. Specifically:
Shale Gas Block: The denoised inversion profile clearly delineates the low-resistivity zones of the Longmaxi Formation, providing a reliable basis for well placement and resource assessment. Groundwater Block: The inversion results clearly outline the distribution of aquifers, supporting groundwater extraction, management, and helping decision-makers develop more scientifically sound resource utilization plans.
These findings highlight the significant benefits of the fusion-optimized CNN model (integrating PSO and GWO) in enhancing inversion interpretation accuracy. The model improves data quality, strengthens signal features, reduces fitting errors, and enhances the ability to resolve subsurface structures. In conclusion, the fusion-optimized CNN model not only improves the signal-to-noise ratio of electromagnetic data but also substantially enhances the precision of inversion results and the reliability of geological interpretations.
4 Discussion
In this study, we propose a denoising method for wideband electromagnetic (WFEM) data, leveraging a hybrid optimization algorithm combining Particle Swarm Optimization (PSO) and Grey Wolf Optimization (GWO). This method is specifically designed to address the complexities of noise in diverse geological environments. By integrating the global search capabilities of PSO with the local optimization strengths of GWO, the proposed approach enhances the optimization of model parameters, significantly improving the adaptability and accuracy of the denoising model under noisy conditions.
4.1 Optimization method description and scientific innovation
One of the key innovations of our approach lies in the combination of PSO and GWO. Traditional denoising techniques generally rely on static noise models or simple filtering methods that are ineffective when dealing with non-periodic or pseudo-random noise. In contrast, the hybrid PSO-GWO algorithm efficiently balances global exploration with local refinement. PSO accelerates the search for potential solutions by rapidly identifying candidate parameter configurations, while GWO fine-tunes these solutions through a more detailed, local search, preventing the model from falling into local optima. This unique hybrid strategy results in faster convergence and a more robust solution, significantly improving denoising accuracy in complex geological settings.
Furthermore, Convolutional Neural Networks (CNNs) enhance this method by providing powerful nonlinear feature extraction capabilities. CNNs are particularly effective in extracting meaningful features from complex and noisy data, ensuring the preservation of signal integrity even in highly distorted environments. By combining CNNs with the PSO-GWO optimization, the model becomes adept at identifying and removing various types of noise—such as Gaussian white noise, pulse noise, and attenuation noise—resulting in substantial improvements in the signal-to-noise ratio (SNR).
4.2 Comparison with previous research
Compared to existing methods, our approach offers several clear advantages. Most traditional techniques utilize single optimization algorithms or basic filtering methods that struggle with complex noise environments. In contrast, our hybrid PSO-GWO algorithm integrates the advantages of both PSO and GWO, ensuring superior robustness and adaptability. The combination of global and local optimization allows for a more comprehensive search of the parameter space, which is essential when dealing with complex noise patterns in wideband electromagnetic data.
Moreover, the introduction of CNNs distinguishes our method from prior research. While CNNs have been widely applied in other fields (Liu et al., 2023), their integration with PSO and GWO for electromagnetic data denoising is a novel contribution. The ability to adaptively extract features while optimizing parameters with PSO and GWO provides a significant enhancement over conventional techniques. This dual-layer optimization approach allows our method to flexibly handle various types of noise, offering a more precise and adaptable denoising solution.
4.3 Theoretical validation and performance
Simulation experiments conducted in this study validate the theoretical basis of our model by demonstrating the effects of different noise types on electromagnetic signals. Gaussian white noise, pulse noise, and attenuation noise were shown to have distinct disruptive effects on signal characteristics. Gaussian white noise introduces random fluctuations, pulse noise generates transient high-amplitude spikes, and attenuation noise distorts signal components at specific frequencies. Our optimization strategy accounts for these unique noise characteristics, effectively enhancing the denoising performance.
The introduction of a custom-built sample library and the use of simulation experiments further bolster the robustness of the model. This design not only improves the generalization capability of the model but also ensures that the denoising method performs reliably in real-world applications, even in the presence of complex and diverse noise types.
This research represents a significant step forward in addressing the challenges of electromagnetic data denoising in complex geological environments. The hybrid PSO-GWO optimization algorithm, combined with CNN-based feature extraction, provides a powerful and versatile solution for tackling various types of noise. The ability to dynamically adjust model parameters based on noise characteristics ensures that our method can effectively handle a wide range of noise environments. Our approach outperforms traditional methods in both robustness and adaptability, making it a promising tool for practical applications in geological exploration and other fields that rely on electromagnetic data.
5 Conclusion
We introduced a novel denoising method for wideband electromagnetic (WFEM) data based on a hybrid optimization algorithm combining Particle Swarm Optimization (PSO) and Grey Wolf Optimization (GWO). This method significantly enhances the signal-to-noise ratio (SNR) in complex noisy environments, thereby improving the accuracy and reliability of geological exploration. By integrating the global search capabilities of PSO with the local optimization strengths of GWO, our approach offers an adaptive solution to the challenges posed by multi-noise environments, effectively overcoming the limitations of traditional methods in handling non-periodic and pseudo-random noise.
We demonstrated demonstrates substantial improvements over previous research in terms of both denoising precision and adaptability, particularly across different geological settings. It efficiently removes noise interference from various sources, including industrial activities, natural terrain variations, and environmental disturbances, making it more versatile in real-world applications. This hybrid optimization algorithm stands out by providing a robust solution to electromagnetic data denoising, ensuring reliable results even in the presence of diverse noise types.
With the experimental results, we showed that the combination of PSO and GWO significantly improves the quality of electromagnetic data, particularly when dealing with Gaussian white noise, pulse noise, and attenuation noise. The method enhances the SNR and preserves essential signal features, leading to more accurate geological structure interpretations. Moreover, the integration of Convolutional Neural Networks (CNNs) further boosts the model’s ability to extract nonlinear features, enabling the denoising process to preserve the integrity of signals even in challenging noisy environments.
Compared to traditional denoising techniques and previous studies, our method’s ability to optimize hyperparameters through PSO and GWO, combined with CNN’s feature extraction capabilities, represents a significant advancement in the field. The proposed approach not only improves the denoising performance but also enhances the adaptability and generalization of the model, making it a promising tool for diverse applications in geological exploration and resource assessment.
In conclusion, this study presented a cutting-edge denoising approach for wideband electromagnetic exploration. By addressing complex noise challenges and optimizing both model parameters and noise recognition strategies, the method lays a solid foundation for future advancements in geological data processing. Its ability to handle a wide range of noise environments ensures its potential for practical applications in geological exploration, resource management, and other fields that require high-quality electromagnetic data interpretation.
Data availability statement
The original contributions presented in the study are included in the article/supplementary material, further inquiries can be directed to the corresponding author.
Author contributions
Z-YL: Conceptualization, Data curation, Formal Analysis, Investigation, Methodology, Resources, Software, Validation, Visualization, Writing – original draft, Writing – review and editing. D-QL: Formal Analysis, Funding acquisition, Project administration, Resources, Validation, Visualization, Writing – review and editing. YL: Data curation, Methodology, Supervision, Writing – original draft. XZ: Methodology, Resources, Validation, Visualization, Writing – original draft.
Funding
The author(s) declare that financial support was received for the research and/or publication of this article. This research was financially funded by Open Research Fund Program of Key Laboratory of Metallogenic Prediction of Nonferrous Metals and Geological Environment Monitoring (Central South University), Ministry of Education (2022YSJS05, 2022YSJS20), Central South University Postgraduate Research Innovation Project (1053320222512).
Conflict of interest
The authors declare that the research was conducted in the absence of any commercial or financial relationships that could be construed as a potential conflict of interest.
Generative AI statement
The author(s) declare that Generative AI was used in the creation of this manuscript. The author(s) verify and take full responsibility for the use of generative AI in the preparation of this manuscript. Generative AI was used to assist with English translation and language refinement.
Publisher’s note
All claims expressed in this article are solely those of the authors and do not necessarily represent those of their affiliated organizations, or those of the publisher, the editors and the reviewers. Any product that may be evaluated in this article, or claim that may be made by its manufacturer, is not guaranteed or endorsed by the publisher.
References
Amor, N., Noman, M. T., Petru, M., Sebastian, N., and Balram, D. (2023). A review on computational intelligence methods for modeling of light weight composite materials. Appl. Soft Comput. 147, 110812. doi:10.1016/j.asoc.2023.110812
Birnie, C., and Alkhalifah, T. (2022). Transfer learning for self-supervised, blind-spot seismic denoising. Front. Earth Sci. 10: 1053279. doi:10.3389/feart.2022.1053279
Bryakin, I. V., Bochkarev, I. V., and Khramshin, V. R. (2024). Subsurface exploration systems for Shallow geophysics. IEEE Trans. Geoscience Remote Sens., 1205–1210. doi:10.1109/icieam60818.2024.10553657
Chaupal, P., and Rajendran, P. (2023). A review on recent developments in vibration-based damage identification methods for laminated composite structures: 2010–2022. Compos. Struct. 311, 116809. doi:10.1016/j.compstruct.2023.116809
Giannino, F., and Leucci, G. (2021). Electromagnetic methods in geophysics: applications in GeoRadar, FDEM, TDEM, and AEM. Electromagn. Methods. doi:10.1007/978-3-030-76578-5
Gomez-Cabrera, A., and Escamilla-Ambrosio, P. J. (2022). Review of machine-learning techniques applied to structural Health Monitoring systems for Building and Bridge structures. Appl. Sci. 12, 10754. doi:10.3390/app122110754
Jayakarthik, R., Chandrashekhara K.T, , Sampath, O., Kumar, D., Biban, L., Maroor, J. P., et al. (2024). Climate impact prediction: Whale-optimized Conv-XGBoost with Remote Sensing and Sociological data. Remote Sens. Earth Syst. Sci. 7, 443–456. doi:10.1007/s41976-024-00136-w
Kong, Q., Ji, K., Gu, J., Chen, L., and Yuan, C. (2023). A CNN-integrated percussion method for detection of FRP–concrete interfacial damage with FEM reconstruction. Struct. Health Monit. 22, 216–231. doi:10.1177/14759217221082007
Kord, S., Taghikhany, T., Madadi, A., and Hosseinbor, O. (2024). A novel triple-structure coding to use evolutionary algorithms for optimal sensor placement integrated with modal identification. Struct. Multidiscip. Optim. 67, 58. doi:10.1007/s00158-024-03772-4
Li, P., Liu, Y., Liu, T., Yan, X., Zhao, C., Ruan, F., et al. (2024). Pre-calculated space-ground integrated structure (P-SGIS) against link cut set (LCS) failures in space-ground integrated optical networks. Opt. Express 32, 47757–47782. doi:10.1364/OE.541873
Liu, S., Birnie, C., and Alkhalifah, T. (2023). Trace-wise coherent noise suppression via a self-supervised blind-trace deep-learning scheme. Geophysics 88 (6), V459–V472. doi:10.1190/geo2022-0371.1
Nguyen, D. H., and Wahab, M. A. (2023). Damage detection in slab structures based on two-dimensional curvature mode shape method and Faster R-CNN. Adv. Eng. Softw. 176, 103371. doi:10.1016/j.advengsoft.2022.103371
Ren, J., Liu, W., Du, W., Zheng, J. l., Wei, H., Zhang, K. y., et al. (2023). Identification method for subgrade settlement of ballastless track based on vehicle vibration signals and machine learning. Constr. Build. Mater. 369, 130573. doi:10.1016/j.conbuildmat.2023.130573
Tian, H. J., Gu, Z. W., Zhang, G. D., Zhao, D. D., Zhou, H., Zhang, J., et al. (2024). Exploration of anomaly separation technology of wide-field electromagnetic method. Pet. Geophys. 21, 343–357. doi:10.1007/s11770-021-0965-4
Veluchamy, S., Mahesh, K. M., and Sheeba, P. T. (2023). DeepDrive: a braking decision making approach using optimized GAN and Deep CNN for advanced driver assistance systems. Eng. Appl. Artif. Intell. 123, 106111. doi:10.1016/j.engappai.2023.106111
Wang, J., Cao, Y., Yang, M., Nie, W., Feng, H., and Xi, Z. (2024). Design of MEMS thermal actuator by CNN and PSO. IEEE Conf., 1–5. doi:10.1109/nems60219.2024.10639549
Wang, X., and Cao, H. (2022). Improved VMD-ELM algorithm for MEMS gyroscope of temperature compensation model based on CNN-LSTM and PSO-SVM. Micromachines 13, 2056. doi:10.3390/mi13122056
Xiang, C., Gu, J., Luo, J., Qu, H., Sun, C., Jia, W., et al. (2022). Structural damage identification based on convolutional neural networks and improved hunter–prey optimization algorithm. Buildings 12, 1324. doi:10.3390/buildings12091324
Zhu, H., Gong, D., and Zhang, B. (2023). A multi-scale geological–engineering sweet spot evaluation method for tight sandstone gas reservoirs. Nat. Gas. Ind. B 10, 522–532. doi:10.1016/j.ngib.2023.09.007
Keywords: wide-field electromagnetic, Particle Swarm Optimization, Grey Wolf Optimization, Convolutional Neural Networks, electromagnetic data denoising
Citation: Liu Z-Y, Li D-Q, Liu Y and Zhang X (2025) Denoising of electromagnetic data from different geological blocks using a hybrid PSO-GWO algorithm and CNN. Front. Earth Sci. 13:1526527. doi: 10.3389/feart.2025.1526527
Received: 12 November 2024; Accepted: 07 April 2025;
Published: 25 April 2025.
Edited by:
Tariq Alkhalifah, King Abdullah University of Science and Technology, Saudi ArabiaReviewed by:
Kirill Zeyde, University of Genoa, ItalyJamel Seidu, University of Mines and Technology, Ghana
Copyright © 2025 Liu, Li, Liu and Zhang. This is an open-access article distributed under the terms of the Creative Commons Attribution License (CC BY). The use, distribution or reproduction in other forums is permitted, provided the original author(s) and the copyright owner(s) are credited and that the original publication in this journal is cited, in accordance with accepted academic practice. No use, distribution or reproduction is permitted which does not comply with these terms.
*Correspondence: Di-Quan Li, bGlkaXF1YW5AY3N1LmVkdS5jbg==