 Geli Li1Jianbin Zhao1
 Yuejiao Liu2*Zhanshan Xiao1Shitao Cui1Bo Wei1Chenjun Zhang1Yakun Mao1Yang Xia1Lei Xu2
 Jianmeng Sun2Zuzhi Hu1
- 1China Petroleum Logging Company Limited, Xi’an, Shaanxi, China
- 2School of Geosciences, China University of Petroleum, Qingdao, Shandong, China
Carbonate reservoirs characterized by fractures and caves exhibit a complex spatial distribution and significant heterogeneity. The establishment of precise and reliable three-dimensional geological models is imperative to elucidate the influence mechanism of fracture and cave parameters on macroscopic petrophysical properties from a micro scale. This is the foundation and prerequisite for the efficient development of such reservoirs. In this paper, dual-scale CT core scanning data is utilized to adjust the segmentation threshold of high-resolution (small-scale) cores to the segmentation of low-resolution (large-scale) cores. This approach enables the comprehensive characterization of multi-scale porosity in large-scale cores and the realization of multi-scale digital core fusion. A 3D fracture digital core model was generated using a Slice-GAN neural network model and SEM images. A well-developed cave was extracted from low-resolution CT data and used as a cave digital core. Through model superposition, a multi-scale digital core containing fractures and caves was constructed. The reliability of the constructed digital core was verified based on four parameters: aperture distribution, coordination number, porosity, and resistivity. The research outcomes establish a foundation for subsequent simulations, which aim to assess the resistivity response of the digital core under varied fracture size, angle, and cave size conditions. This provides a technical foundation for advancing the fundamental theoretical research of carbonate rocks.
1 Introduction
Carbonate formations hold significant importance in global oil and gas resources (Jiménez et al., 2024; Aghdam et al., 2024). Globally, the discovered large-scale carbonate oil and gas fields are mainly concentrated in North America, the Middle East, Siberia and the Asia-Pacific region, and the data show that about 52% of the world’s proven oil and gas reserves and 60% of the world’s oil and gas production data show that about 52% of the world’s proven oil and gas reserves and 60% of the world’s oil and gas production are derived from carbonates (Wen et al., 2023; Mahamuda et al., 2023; Ma et al., 2024). In recent years, carbonates in China have become a key area in oil and gas exploration and development, showing great potential and value. China’s carbonate gas reserves have grown significantly over the past 2 decades and are expected to account for 40% of total domestic reserves by 2030 (Loucks et al., 2023; Zhou et al., 2024). Carbonate oil and gas reservoirs in China are mainly distributed in deep to ultra-deep strata in Tarim, Sichuan and Ordos basins (Zhang et al., 2024), with buried depths exceeding 4,500 m (Sun et al., 2023). The pore structure of carbonate reservoir is much more complex than that of clastic reservoir, mainly because carbonate reservoir is controlled by sedimentation, diagenesis and tectonics, especially diagenesis. Later diagenetic transformation (compaction, cementation, dissolution and dolomitization) can lead to the increase or decrease of porosity, and can also change the original pore geometry and distribution by changing the original sediment mineral composition. So, carbonate reservoirs are characterized by diverse pore types, complex pore structure evolution patterns, strong heterogeneity, and low matrix porosity and permeability (Tian et al., 2020; Yao et al., 2024). Therefore, the petrophysical evaluation of carbonate rocks also faces many technical and theoretical challenges, which need to be further studied and tackled.
The exploration practice has confirmed that deep-ultra-deep carbonate reservoirs are dominated by dolomite reservoirs and tuff reservoirs containing fractures and caves (Lyu et al., 2024; Shen et al., 2024). The spatial distribution of this type of reservoirs is complex and non-homogeneous. Therefore, the establishment of accurate and reliable three-dimensional geologic models is the basis and prerequisite for the efficient development of this type of reservoirs (Chi et al., 2022; Wang et al., 2024). Compared with clastic reservoir, carbonate fracture and cave reservoirs are formed by the superposition of karst and tectonic fracture and other late modification effects, with holes, caves, and fractures as the main reservoir space, and the development of their reservoirs is not subject to the constraints of sedimentary isochronous interfaces (Liu et al., 2021; Wang et al., 2021; Hou et al., 2013), and the spatial distribution of the reservoirs is extremely complex and random. Its reservoir development is not constrained by sedimentary isochronous interfaces, and the spatial spreading of the reservoir is highly complex and stochastic, so the traditional clastic reservoir modeling technique is not applicable to this type of carbonate reservoirs (Lai et al., 2022; Franck et al., 2023; Bisdom et al., 2014). Moreover, the porosity of carbonate rocks is often accompanied by the filling of clay and asphalt (Liu et al., 2022), which further increases the variability of rock physical properties. These complex pores, fractures and caves lead to great challenges in the effective evaluation of carbonate reservoirs.
Accurate calculation of resistivity is an important basis for the evaluation of physical property parameters of carbonate reservoirs. However, experimental results show that due to the development of fractures and caves in carbonate reservoirs, the resistivity usually presents obvious non- Archie phenomenon (He et al., 2020), which is because the Archie formula was proposed for clastic rocks, it is necessary to meet the conditions of uniform spatial distribution of porosity and saturation and isotropic electrical properties (Archie, 1952). Obviously, the evaluation of the electrical characteristics of carbonate reservoirs cannot be described by the traditional Archie equation. Although there are researches on the resistivity of carbonate rocks at home and abroad (Wang et al., 2017; Tariq et al., 2020; Tian et al., 2020), however, few studies have been conducted to quantitatively study reservoir resistivity by constructing network models combined with pore structure characteristics of carbonate reservoir rocks. The characteristics of rock fractures and caves are usually not considered (Xiong et al., 2018) or the models constructed are simple (Zhang et al., 2014), which cannot reflect the influence of pore structure characteristics such as pore distribution and pore ratio on reservoir resistivity in reservoirs with fractures and caves.
Therefore, for carbonate rocks, it is an important means to improve reservoir evaluation accuracy to construct a multi-scale digital core that comprehensively considers the characteristics of pores, fractures and caves, and clarify the influence mechanism of matrix pore, fracture and cave parameters on macroscopic rock physical properties from the micro-scale. This paper describes in detail the construction process of this multi-scale digital core, and focuses on how to reflect the fracture and cave characteristics, and verifies the reliability of the constructed model by combining numerical simulation and experimental data comparison. The implementation of this set of methods and technical processes can not only effectively guide the construction and simulation of carbonate rock digital cores in the study area, but also help to promote the effective exploitation and utilization of carbonate rock oil and gas resources.
2 Samples and methods
2.1 Preparation of samples
In this study, a carbonate rock sample from Dengying Formation in X area of Sichuan Basin, China was selected. Three-dimensional core images with different resolutions were obtained by X-ray CT scanning of rock samples. Avizo software was used to divide the core scanning samples into 300 × 300 × 300 voxel unit samples, and one unit sample was selected for study. Core samples for CT imaging included centimeter and millimeter plunger cores (Figure 1), and centimeter plunger cores were cylinders with a diameter of 2.54 cm and a height of 3.82. NMR experiment aperture distribution analysis results show that the pore radius of the sample is mainly distributed in the range of 5–600μm, and presents a “double peak” feature, large-scale pores are mainly distributed in the range of 10–600μm, and small-scale pores are mainly distributed in the range of 5–10 μm. It can reflect the large-scale structural characteristics of the core (fractures, large pores, caves), so for low resolution scanning, we qualitatively set the scanning resolution at 27μm, and the scanning results are shown in Figure 1A. Under the condition of low resolution, fractures, large pores, and caves in the rock can be identified, but a large number of small pores are lost at the same time, which will lead to calculation errors of key parameters such as pore connectivity and throat size distribution, and the omission of small pores will directly reduce the calculation results of total porosity, thus affecting the calculation accuracy of reservoir parameters. To more accurately image the small pores in the core, a millimeter plunger sample with a diameter of 4 mm and a height of 6 mm was drilled in a 2.54 cm cylinder using a millimeter drill bit. Smaller sample sizes have better X-ray penetration and can be imprinted with higher-precision micron CT or even nanometer CT. Figure 1B shows a high-precision micron CT scan image of a drilled 4 mm plunger with a resolution of 4 μm. At higher resolution, micro-fractures and smaller pores can be accurately identified, and the boundaries of different mineral particles are more pronounced.
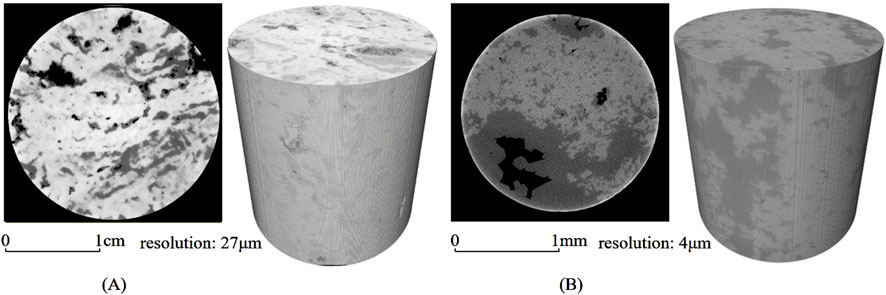
Figure 1. (A) Cross section and 3D of CT scan of centimeter scale plunger core. (B) Cross section and 3D of CT scan of millimeter scale plunger core. Centimeter-scale plunger cores and millimeter-scale plunger cores with resolutions of 27 μm and 4 μm, respectively.
2.2 Construction of a multiscale digital core based on dual-scale CT
The pore space in carbonate rocks mainly includes matrix pores, fractures and caves. Matrix pores refer to interparticle and intraparticle pores, mainly intergranular pores, which are determined by diagenesis; fractures are larger voids caused by stress and geological movements; and caves are larger voids formed by chemical dissolution and other effects. In the study of digital core construction, in order to simultaneously consider the effects of matrix pores, fractures and caves on macroscopic physical parameters in carbonate rocks, we need to construct digital cores of matrix pores, fractures and caves, and then integrate the three kinds of pore spaces by superposition.
Due to the wide range of pore size distribution in the matrix pores of carbonate rocks, the pore space of carbonate rocks cannot be fully characterized by X-ray CT scanning based on a single resolution. Therefore, in this paper, we first refer to the multi-scale fusion method of Cui et al. (2020), Liu et al. (2023) and other researchers, and use the grayscale segmentation threshold value of the high-resolution image to adjust the segmentation of the low-resolution image, so that the multi-scale pore space of the low-resolution image can be characterized more completely. The basic process is based on the two different scales of CT scan core image data obtained in the sample preparation stage, high-resolution images correspond to small-size cores and low-resolution images correspond to large-size cores, and then the original grayscale image (Figure 2A) is processed by filtering (Figure 2B), alignment (Figure 2C), threshold adjustment (Figure 2D) and segmentation (Figure 2E), so that the pore information of the core with different resolutions is fused to construct a multi-scale 3D digital core (Figure 2F). The image filtering process can reduce the influence of noise in the original gray-scale image; image alignment can spatially align the image information of different resolution cores, thus facilitating the purpose of fusing the small pore information in the high-resolution cores into the large pores in the low-resolution cores; and the purpose of image segmentation is to distinguish the pores from the skeleton information in the core image.
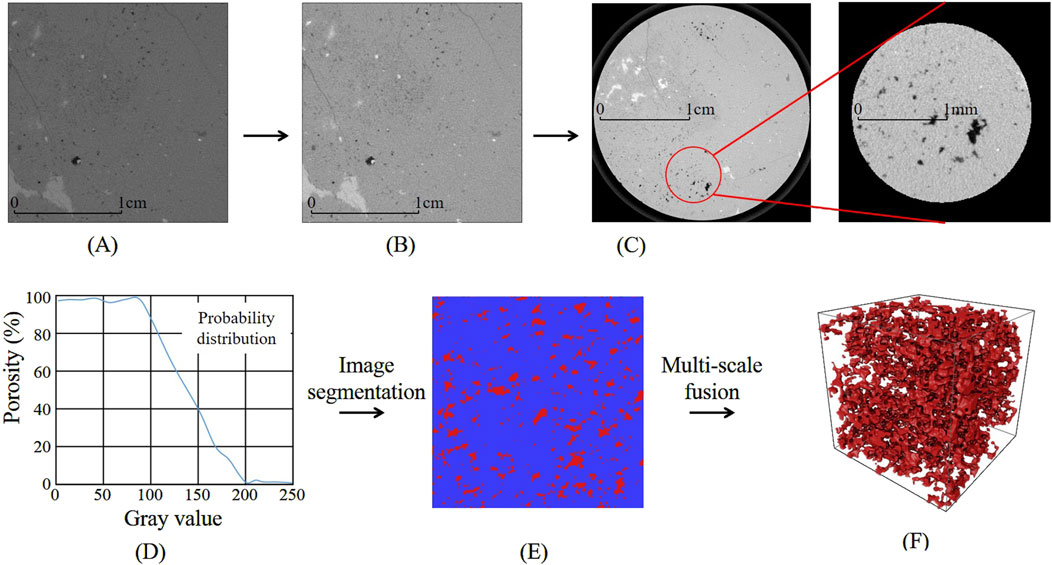
Figure 2. (A) Grayscale images. (B) Binary images after image filtering. (C) Image registration (left resolution: 27 μm; right resolution: 4 μm). (D) Porosity-gray distribution curve. (E) Red: poros, blue; skeleton. (F) Multi-scale digital core with 27 μm and 4 μm resolution pores. Multi-scale fusion process of digital core.
The pore characteristics of different resolution cores are illustrated in Figure 3. A multi-scale digital core constructed based on the data in this study area is shown in Figure 4. This multi-scale core is a square intercepted from the multi-scale core after multi-scale fusion. The square is intercepted for the purpose of facilitating the processing and analysis of the data. This contributes to the spatial utilization and standardization of the measurements. It also facilitates the comparison of the data between different samples.
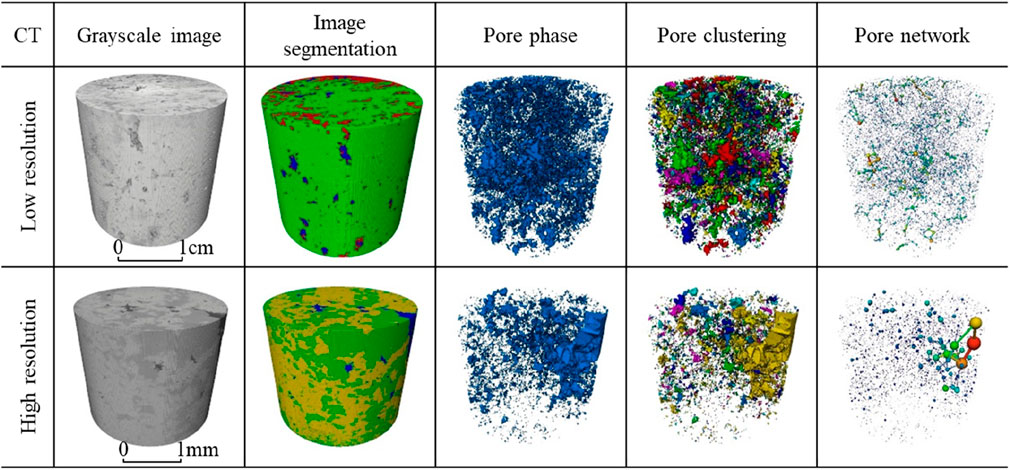
Figure 3. Pore segmentation results of cores with different resolutions.
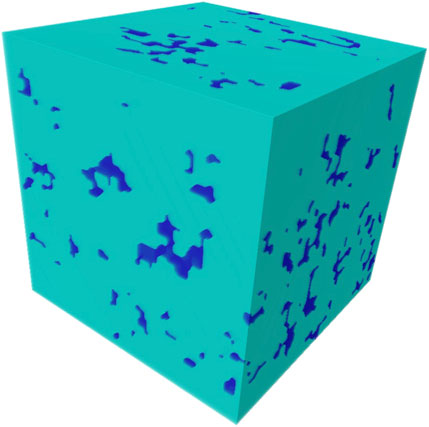
Figure 4. Reconstructed multi-scale digital core.
2.3 Multi-scale digital core construction with fracture and cave
The lithology and pore structure of carbonate rocks are extremely complex, and this complexity is manifested in the development of multiple media such as matrix pores, fractures and caves at different scales. The construction of multi-scale digital cores has already laid the foundation for the study of matrix pores, but in order to further study the response law of macro-physical properties such as rock resistivity under the superposition of multiple effects of fractures and caves, it is necessary to construct digital cores with different fracture parameters and cave parameters on the basis of multi-scale digital cores.
For the construction of fractures, in this study, the slice images with more developed fractures in the SEM images (Figure 5A) were selected and pore segmentation was performed in Avizo (Jing et al., 2023) (Figure 5B), and the Slice-GAN neural network model (Figures 5C, D) was used to generate the 3D fracture digital cores (Figure 5E), and then the ones with regular shapes that were easy to adjust were extracted as the final fracture digital core model (Figure 5F).
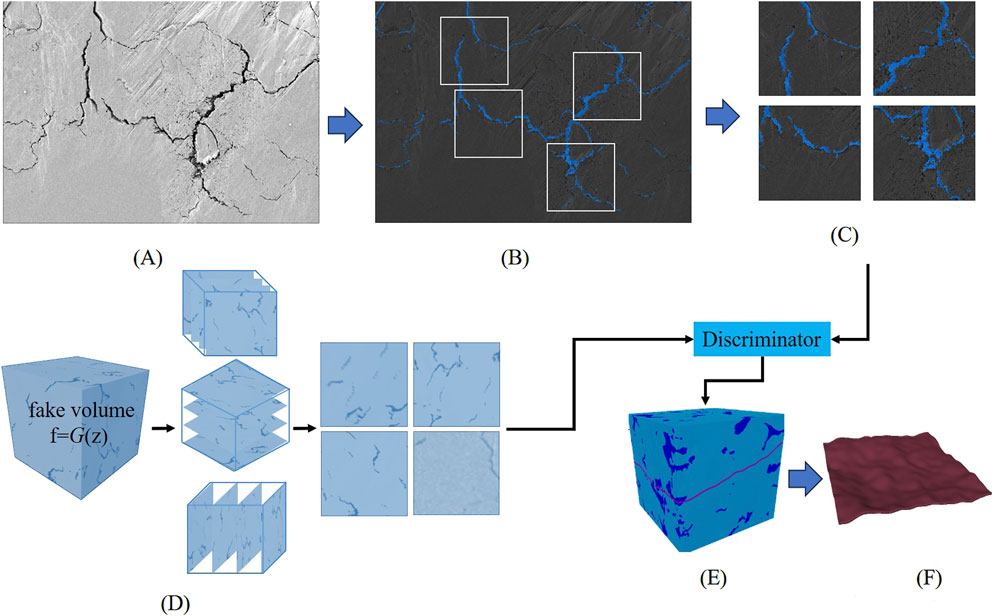
Figure 5. (A) Original SEM image. (B) Fracture segmentation. (C) Sampling from training data of Slice-GAN (real slices). (D) Generation and Slicing (fake slices). (E) Reconstruction of digital core. (F) Extracted 3D fracture body. Digital core construction for fracture.
Traditional 3D digital core model construction methods are mainly divided into two types: physical experimental method (such as X-ray CT scanning) and numerical reconstruction method (such as simulated annealing method, process simulation method). The former is limited by the contradiction between equipment resolution and sample size, and the latter is difficult to reproduce complex pore topology. With the development of deep learning technology, 3D reconstruction methods based on generative adversarial networks (GAN) have gradually emerged (Li et al., 2023; Wang et al., 2023). Traditional 3D GAN algorithms generate volumetric data directly through 3D convolutions, but require extensive high-quality 3D training samples (Wu et al., 2017), which constrains their application in petrophysical domains. Compared with 3D digital core imaging data, which is difficult to obtain, imaging data such as 2D scanning electron microscopy often has the advantages of high efficiency and high precision, stronger phase recognition ability, and wider application range. It is of great significance to consider the construction of 3D images based on 2D imaging data. Steve and Samuel (2021) proposed a generation adduction network architecture Slice-GAN, which can build three-dimensional high-fidelity images based on two-dimensional images. The advantage of Slice-GAN algorithm is that it introduces spatial consistency loss function to realize the coordinated mapping of two-dimensional features and three-dimensional structures, laying a foundation for the construction of three-dimensional images. Especially suitable for small sample rock data. The fundamental algorithm of Slice-GAN originates from Generative Adversarial Networks (GAN) (Bostanabad, 2020). A GAN framework comprises two neural networks (Arjovsky et al., 2017): a generator (G) that produces synthetic samples (f), and a discriminator (D) that evaluates the discrepancy between f and real samples (r). Through iterative parameter updates during model training, the discrepancy between f and r is progressively minimized. The principle of the Slice-GAN algorithm is implemented by introducing a slicing step before the generator (G) sends fake images to the discriminator (D) (Figure 5C). For a generated three-dimensional volume with length l voxels, during the training of discriminator D, slicing operations are performed along the x, y, and z directions at l-voxel intervals to obtain three fake two-dimensional slices fed back to D (Figure 5D). Concurrently, real two-dimensional slices are sampled and input to the discriminator, enabling D to learn equally from both real and synthetic instances. Ultimately, the algorithm generates the final three-dimensional volume under the condition that the discrepancy between synthetic (f) and real (r) data is minimized (Steve and Samuel, 2021).
Due to this study primarily aims to construct a three-dimensional fractured digital rock model and integrate it into multi-scale porous digital rocks for numerical simulations under varying fracture parameters, it does not require extensive training samples to validate model accuracy. The principal objective focuses on successfully generating three-dimensional undulating fracture geometries. In this study, Slice-GAN demonstrates significant applicability. In comparison with the planar fracture configurations constructed by Liu et al. (2023), the Slice-GAN-based fractures exhibit undulating characteristics that better align with fundamental geological principles, more closely resembling natural fracture morphologies.
For the construction of the caves, this study extracted a better-developed cave in the low-resolution (large-scale) CT scan data. In carbonate reservoirs, more caves are developed, and single or multiple caves can be extracted by visualizing the location of the caves through three-dimensional imaging of the CT scan data. After finding the location of a cave, the discrete and isolated small pores around the cave are removed, and the smooth and single cave is retained as the cave digital core (Figure 6).
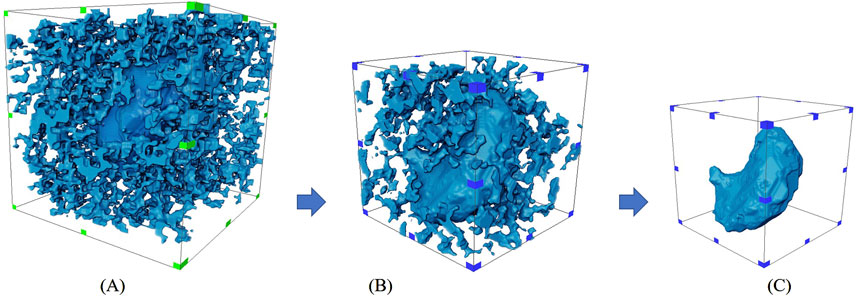
Figure 6. (A) Finding a cave. (B) Remove the pores around the cave. (C) Cave. Cave digital core extraction.
By restricting the constructed fracture digital cores and extracted cave digital cores to the middle of the grid of multi-scale matrix pore digital cores, a multi-scale digital core model with fracture and cave can be obtained (Figure 7). By scaling up or down and adjusting the angle, we can obtain digital cores of fractures and caves with different fracture sizes, different fracture angles and different cave sizes. This will lay an important foundation for the study of the macroscopic physical response of carbonate rocks under different fracture and cave parameters.
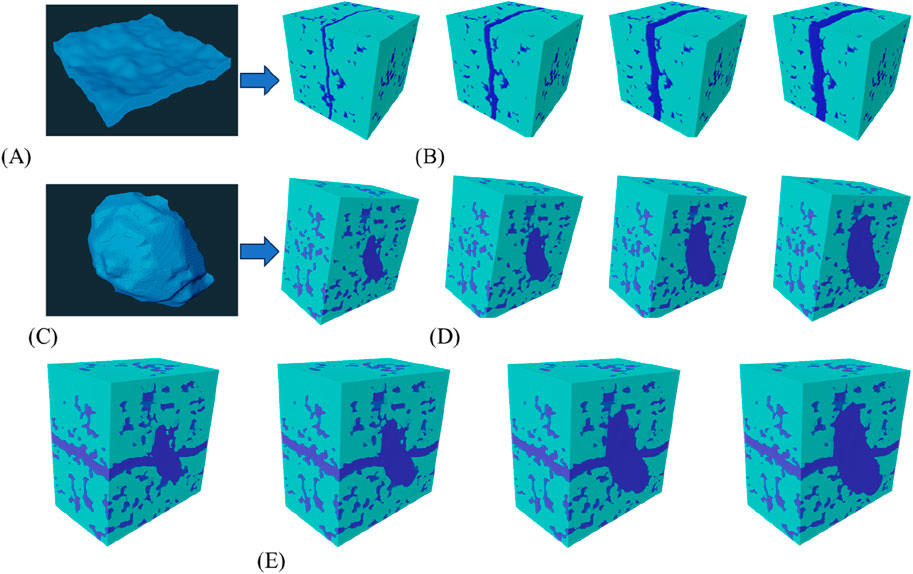
Figure 7. (A) GAN reconstruction fracture. (B) Multi-scale digital core with fracture. (C) Cave extracted by CT. (D) Multi-scale digital core with cave. (E) Multi-scale digital core with fracture and cave. Multi-scale digital core containing fractures and caves.
2.4 Principles of rock resistivity simulation by the finite element method
For a current in steady state, the following relation exists between current density
Further based on the relationship between current density and electric field strength, combined with conductivity σ (Equation 2):
In general, the conductivity is a constant, and since
Equation 3 is the Laplace equation (Song et al., 2014), and solving the Laplace equation under the condition of applying a stable electric field e to the homogeneous model, the corresponding electric potential, and thus the conductivity, can be calculated. However, for 3D digital cores, there are multiphase conductivities of the skeleton and fluid in the core, and the complex pore structure results in a complicated shape of the calculation area, making it difficult to find an exact solution to the problem. To address this problem, the finite element method (FEM) is commonly used in 3D digital core simulations (Calo et al., 2011). The FEM method is based on the variational principle, given the conductivity of each component of the core, the variational method is used to convert the electric field problem into a problem of solving the very small value of the overall energy En function of the digital core.
where p and q correspond to the x and y components of the electric field e, and σpq denotes the conductivity tensor normal to the xoy plane. r denotes the node number, and each voxel cell in the digital core possesses nodes numbered from 1 to 8.
The voltage function U is expressed as:
where ur denotes the voltage at the r-node.
For a given voxel, the component of the electric field e in its p-direction is expressed as:
Substituting Equation 5 into Equation 7, the components transform into:
Substitute Equation 8 into Equation 4, get Equation 9:
where us is the nodal voltage within the voxel cell that is centrally symmetric to node r. In the finite element method, the single voxel energy En is expressed as (Equation 10):
Drs is a strength matrix with a specification of eight rows and eight columns in the finite element method. According to the variational principle, the problem of solving the voltage distribution on each pixel is transformed into the problem of solving the energy extremum of the system. When En of any node um takes an extreme value, its partial derivative should be equal to 0 or the limit is close to 0:
By solving Equation 11, the power consumed by the whole system can be obtained by finally summing up the minimum energy of all voxel points. Then the resistivity of the core can be obtained by dividing the difference between the current direction of the core and the voltage at the inlet and outlet ends by the current density. Regarding the present study, the principle of the above method, i.e., the process, is realized by COMSOL physical field simulation software (Xie et al., 2023).
3 Results and discussion
3.1 Consistency analysis of digital core and NMR data
Quantification and characterization of the pore structure of multi-scale digital cores based on Aviao image processing software and comparison with the results of NMR experiments can indirectly indicate whether the model is reliable or not. Using the algorithm of the PNM module of Aviao software, the distribution of coordination number (the number of individual pores in a state of connection with their neighboring pores), the distribution of pore radius, and the porosity of the pore network model can be obtained. Comparing the quantified coordination number, pore radius and porosity of the multi-scale digital core with the NMR experiment of this sample core, we can analyze whether the multi-scale digital core has reliability.
As shown in Figures 8, 9, the pore radius of the low-resolution pore network model is basically distributed in 10–600 μm, with an average pore radius of 46.5 μm, which mainly describes the pore characteristics of the dissolution pores; the pore radius of the high-resolution pore network model is basically distributed in 1–40 μm, with an average pore radius of 7.3 μm, which mainly describes the pore characteristics of the matrix pores. The pore network model pore radius distribution of the multi-scale digital core after multi-scale fusion generally follows the bimodal distribution, which is in good agreement with the pore radius distribution extracted from the NMR experimental data, and contains both pores and cavities, which is in line with the multi-scale characteristics of the pore distribution of pore-type carbonate rocks. The coordination number of the pore network model is mainly distributed between 0 and 5, and the percentage of pores with a coordination number of 0 in the pore network of low-resolution digital cores is 57%, which indicates that the connectivity is poor, and the consistency of the distribution of the coordination number of the pore network of high-resolution digital cores and multi-scale digital cores is better, which also indicates that the large-scale digital cores with a low resolution directly can not accurately characterize the pore structure of the reservoir, which reflects the importance of the multi-scale fusion. The importance of multi-scale fusion is demonstrated. The porosity of the sample core is 4.26% in the NMR experiment, and the porosity of the multi-scale digital core model is 4.09%, which further shows that the multi-scale digital core and the NMR data are in good agreement, and the pore structure of the reservoir can be more accurately characterized.
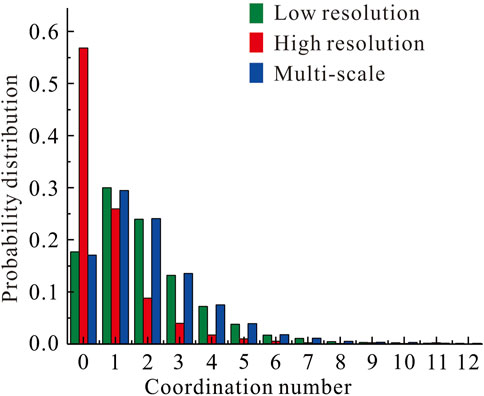
Figure 8. Distribution of coordination number of the model.
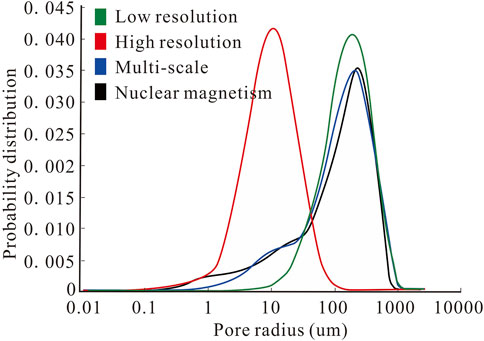
Figure 9. Pore radius distribution of the model.
3.2 Consistency analysis between experimental and simulated values of resistivity
Importing the reconstructed multi-scale digital core into COMSOL multiphysics field simulation software for resistivity simulation and comparing it with the experimental resistivity results can show whether the rock physics simulation is reliable. The basic process of resistivity simulation based on COMSOL is as follows: importing the multi-scale digital core, defining the resistivity of the material (the data can be found according to the rock type), configuring the current input, configuring the boundary conditions and voltage source, and running the resistivity simulation.
The digital core was constructed as a 300 × 300 × 300 grid (Figure 10A), each grid to correspond to each voxel of the digital core. Each cell within the grid corresponds to a different component assigned a different conductivity, and after applying an external electric field E, the voltage distribution of the model is calculated using the finite element method so that the resistivity is finally derived from the relationship between voltage and current, and the potential distribution and current flow paths during the calculation of resistivity by COMSOL are shown in Figures 10B, C. In order to facilitate the comparison with the experimental data, after obtaining the resistivity of the core, the resistivity increase coefficient of the rock can be calculated by Equation 12:
where, I is the coefficient of resistivity increase; Rt is the rock resistivity; Ro is the resistivity of the rock at 100% water content; b is a constant related to lithology; and n is the saturation index.
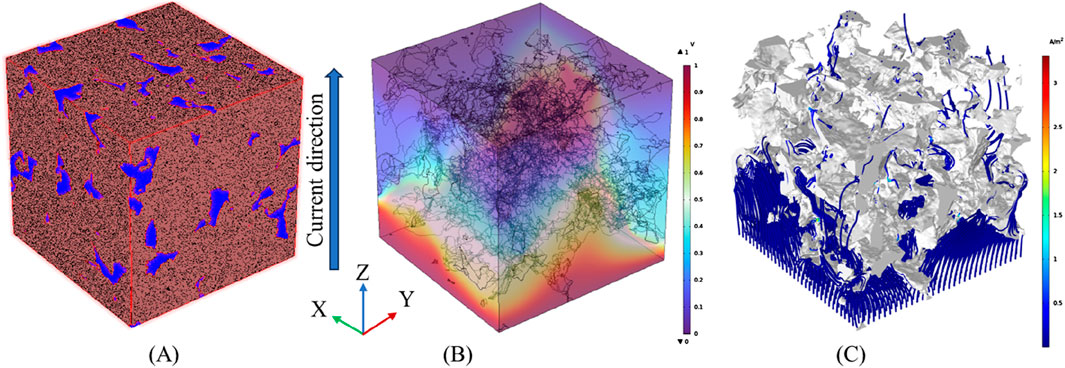
Figure 10. (A) Grid diagram. (B) Potential distribution diagram. (C) Current flow diagram. Mesh diagram and potential-current diagram in COMSOL.
Figure 11 shows the resistivity increasing coefficients of rock under different water saturation conditions calculated by using the finite element method module in COMSOL. The numerical simulation results are in good agreement with the experimental results. The average relative error is 9.4% and the correlation coefficient (R2) is 0.88. Combined with the results of the above comparative analysis of pore size distribution, coordination number and porosity, we believe that the constructed multi-scale digital core model has a strong reliability, and the process method of digital core submission is reasonable. Based on the constructed digital core, it can lay a good foundation for the subsequent simulation and evaluation of carbonate rock physical property parameters.
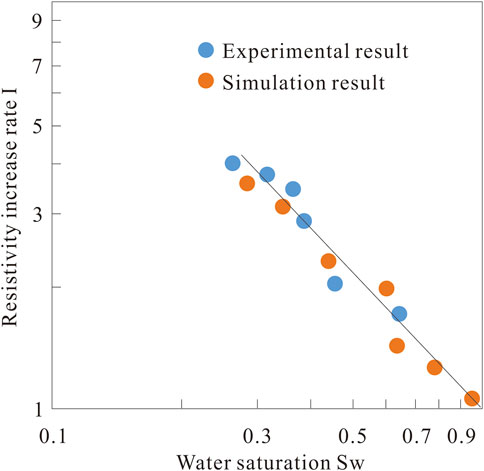
Figure 11. Numerical simulation results of resistivity index of rock core.
4 Conclusion
(1) Multi-scale digital core construction was realized based on dual-scale core CT core scanning data and multi-scale fusion technology.
(2) A 3D fracture digital core model was generated based on scanning electron microscope images and Slice-GAN neural network model, and a better-developed cave were extracted from low-resolution CT data as cave digital cores, and multi-scale digital cores containing fractures and caves were constructed by model superposition.
(3) Comparing the pore size distribution, coordination number, porosity and resistivity of the multi-scale digital core with the experimental data, the reliability of the constructed digital core is verified. The research results can lay the foundation for the next step to realize the simulation of the response law of resistivity of the digital core under the conditions of different fracture sizes, different fracture angles and different cave sizes, which will provide technical support for the basic theoretical research of carbonate rocks.
Data availability statement
The original contributions presented in the study are included in the article/supplementary material, further inquiries can be directed to the corresponding author.
Author contributions
GL: Writing – review and editing, Writing – original draft. JZ: Writing – original draft, Writing – review and editing. YL: Data curation, Investigation, Writing – review and editing. ZX: Data curation, Investigation, Writing – review and editing. SC: Data curation, Investigation, Writing – review and editing. BW: Formal Analysis, Investigation, Methodology, Writing – review and editing. CZ: Formal Analysis, Investigation, Methodology, Writing – review and editing. YM: Formal Analysis, Investigation, Methodology, Writing – review and editing. YX: Data curation, Investigation, Software, Writing – review and editing. LX: Data curation, Investigation, Software, Writing – review and editing. JS: Data curation, Investigation, Software, Writing – review and editing. ZH: Data curation, Investigation, Software, Writing – review and editing.
Funding
The author(s) declare that financial support was received for the research and/or publication of this article. This work was supported by the National Natural Science Foundation of China (No. 42174143), Petrochina Science and Technology Project “Multi-Physical Field High-precision Oil and Gas Geophysical Exploration Technology and Equipment” Project “Research on Multi-physical Field Joint Monitoring and Evaluation Method of Oil and Gas Reservoirs” (No. 2023ZZ05), and Scientific Research and Technology Development Project of CNPC Well Logging Co., LTD. “Well Logging Reservoir and Geology Research” (No. CNLC 2024-8B04).
Acknowledgments
This paper has been strongly supported by the engineers of CNPC Logging Co., Ltd. and the scholars of China University of Petroleum (East China). Thank you again for your efforts.
Conflict of interest
Authors GL, JZ, ZX, SC, BW, CZ, YM, YX, and ZH were employed by China Petroleum Logging Company Limited.
The remaining authors declare that the research was conducted in the absence of any commercial or financial relationships that could be construed as a potential conflict of interest.
The authors declare that this study received funding from PetroChina Company Limited. The funder had the following involvement in the study: study design, data collection, interpretation of data, and data analysis. The authors declare that this study received funding from CNPC Well Logging Co., LTD. The funder had the following involvement in the study: data collection, financial support, the writing of this article, and the decision to submit it for publication.
Generative AI statement
The author(s) declare that no Generative AI was used in the creation of this manuscript.
Publisher’s note
All claims expressed in this article are solely those of the authors and do not necessarily represent those of their affiliated organizations, or those of the publisher, the editors and the reviewers. Any product that may be evaluated in this article, or claim that may be made by its manufacturer, is not guaranteed or endorsed by the publisher.
References
Aghdam, A. M., Riahi, S., and Khani, O. (2024). Experimental study of the effect of oil polarity on smart waterflooding in carbonate reservoirs. Sci. Rep. 14 (1), 22190. doi:10.1038/s41598-024-72604-8
Archie, G. E. (1952). Classificationof carbonate reservoir rocks and petrophysical considerations. AAPG Bull. 36 (2), 278–298. doi:10.1306/3d9343f7-16b1-11d7-8645000102c1865d
Arjovsky, M., Chintala, S., and Bottou, L. (2017). Wasserstein gan. arXiv Prepr. arXiv 1701, 07875. doi:10.48550/arXiv.1701.07875
Bisdom, K., Cauthier, M. D. B., Bertotti, G., and Hardebol, N. (2014). Calibrating discrete fracture-network models with a carbonate three-dimensional outcrop fracture network: implications for naturally fractured reservoir modeling. AAPG Bull. 98 (7), 1351–1376. doi:10.1306/02031413060
Bostanabad, R. (2020). Reconstruction of 3D microstructures from 2D images via transfer learning. Computer-Aided Des. 128, 102906. doi:10.1016/j.cad.2020.102906
Calo, M. V., Pardo, D., and Paszyński, R. M. (2011). Goal-oriented self-adaptive hp finite element simulation of 3D DC borehole resistivity simulations. Procedia Comput. Sci. 4 (C), 1485–1495. doi:10.1016/j.procs.2011.04.161
Chi, P., Sun, J. M., Wang, Z. Y., Ju, R., Wei, B., and Duan, Y. (2022). Simulation of flow characteristics and development of permeability model in fractured-vuggy carbonate reservoir. J. Petroleum Sci. Eng. 219, 111098. doi:10.1016/j.petrol.2022.111098
Cui, L. K., Sun, J. M., Yan, W. C., and Dong, H. M. (2020). Multi-scale and multi-component digital core construction and elastic property simulation. Appl. Geophys. 17, 26–36. doi:10.1007/s11770-019-0789-7
Franck, K. A. K., Lin, P., Xiao, W., Wang, Z., Mulashani, A. K., James, F., et al. (2023). Identification of karst cavities from 2D seismic wave impedance images based on gradient-boosting decision trees algorithms (GBDT): case of ordovician fracture-vuggy carbonate reservoir, tahe oilfield, tarim basin, China. Energies 16 (2), 643. doi:10.3390/en16020643
He, J. H., Li, M., Zhou, K., Yang, Y., Xie, B., et al. (2020). Effects of vugs on resistivity of vuggy carbonate reservoirs. Petroleum Explor. and Dev. 47 (3), 527–535. doi:10.1016/s1876-3804(20)60070-2
Hou, J. G., Ma, X. Q., and Hu, X. Y. (2013). Key issues of 3D geological modeling of paleokarst-cave carbonate reservoir. Geol. J. China Univ. 19 (01), 64–69. Available online at: https://geology.nju.edu.cn/EN/abstract/abstract9493.shtml
Jiménez, G., Latiff, A. H. A., Habel, B. W., and Poppelreiter, M. (2024). Effective application of geological process modeling for unravelling carbonate build-up complexity: a case study from the EX-Carbonate build-up in central Luconia Province, Malaysia [J]. Mar. Petroleum Geol. 170, 107117–107117. doi:10.1016/j.marpetgeo.2024.107117
Jing, H., Dan, H., Shan, H., and Liu, X. (2023). Investigation on three-dimensional void mesostructures and geometries in porous asphalt mixture based on computed tomography (CT) images and Avizo. Materials 16 (23), 7426. doi:10.3390/ma16237426
Lai, F. Q., Liu, Y. J., and Zhang, H. J. (2022). Fracturing properties model of deep shale gas reservoir based on digital core simulation. J. China Univ. Petroleum Edition Nat. Sci. 46 (05), 1–11. doi:10.3969/j.issn.1673-5005.2022.05.001
Li, X. B., Li, B. K., Liu, F. Z., Li, T., and Nie, X. (2023). Advances in the application of deep learning methods to digital rock technology. Adv. Geo-Energy Res. 8 (1), 5–18. doi:10.46690/ager.2023.04.02
Liu, S. G., Li, Z. Q., Deng, B., Sun, W., Ding, Y., et al. (2022). Occurrence morphology of bitumen in Dengying Formation deep and ultra-deep carbonate reservoirs of the Sichuan Basin and its indicating significance to oil and gas reservoirs. Nat. Gas. Ind. B 9 (1), 73–83. doi:10.1016/j.ngib.2022.01.001
Liu, Y. J., Lai, F. Q., Zhang, H. J., ZhouJie, T., Yifei, W., Xiaotian, Z., et al. (2021). A novel mineral composition inversion method of deep shale gas reservoir in Western Chongqing. J. Petroleum Sci. Eng. 202, 108528. doi:10.1016/j.petrol.2021.108528
Liu, Y. J., Wang, H. T., Lai, F. Q., Wang, R., Zhang, H., Zhang, X., et al. (2023). Analysis of influencing factors of Poisson’s ratio in deep shale gas reservoir based on digital core simulation. Petrophysics 64 (01), 67–79. doi:10.30632/pjv64n1-2023a5
Loucks, R. G., Reed, R. M., Zeng, H. L., and Periwal, P. (2023). Carbonate sedimentation and reservoirs associated with a volcanic mound in an open-marine, deep-water, drowned platform setting, Elaine field area, Upper Cretaceous Anacacho Formation, South Texas U.S.A. Mar. Petroleum Geol. 154, 106314. doi:10.1016/j.marpetgeo.2023.106314
Lyu, X., Ju, B., Wang, B., Wu, X., and Ding, Y. (2024). Mechanism, mode, and prediction of karst caves collapse in the deep marine carbonate fracture-cavity reservoir. Mar. Petroleum Geol. 167, 106978. doi:10.1016/j.marpetgeo.2024.106978
Ma, Y. S., Cai, X. Y., Li, M. W., Li, H., Zhu, D., Qiu, N., et al. (2024). Research advances on the mechanisms of reservoir formation and hydrocarbon accumulation and the oil and gas development methods of deep and ultra-deep marine carbonates. Petroleum Explor. Dev. Online 51 (4), 795–812. doi:10.1016/s1876-3804(24)60507-0
Mahamuda, A., Ajayi, O. E., Adesina, M. A., and Asiedu, D. K. (2023). The implication of sedimentary facies, petrography, and palynofacies of shales and carbonates of the Oti-Pendjari and Kwahu-Bombouaka Groups on the hydrocarbon potential of the Voltaian Basin of Ghana. Arabian J. Geosciences 16 (10), 558. doi:10.1007/s12517-023-11671-z
Shen, A. J., Hu, A. P., and Qiao, Z. F. (2024). Development and preservation mechanism of deep and ultra-deep carbonate reservoirs. Sci. Sin. (Terrae). 54 (11), 3403–3420. doi:10.1007/s11430-023-1417-8
Song, Y. J., Li, X. J., and Tang, X. M. (2014). Matrix-conducting resistivity model for clean sands based on connectivity conductance theory and HB equation. J. China Univ. Petroleum Ed. Nat. Sci. 38 (05), 66–74. doi:10.3969/j.issn.1673-5005.2014.05.009
Steve, K., and Samuel, S. C. (2021). Generating three-dimensional structures from a two-dimensional slice with generative adversarial network-based dimensionality expansion. Nat. Mach. Intell. 3 (4), 299–305. doi:10.1038/s42256-021-00322-1
Sun, T. J., Luo, X. P., Mi, W. T., Woods, A., Chiarella, D., Qing, H., et al. (2023). Characterization of ultra-deeply buried middle Triassic Leikoupo marine carbonate petroleum system in the Western Sichuan depression, China. Mar. Petroleum Geol. 150, 106099. doi:10.1016/j.marpetgeo.2023.106099
Tariq, Z., Mahmoud, M., Al-Youssef, H., and Rasheed Khan, M. (2020). Carbonate rocks resistivity determination using dual and triple porosity conductivity models. Petroleum 6 (01), 35–42. doi:10.1016/j.petlm.2019.04.005
Tian, H., Wang, G. W., and Wang, K. W. (2020). Study on the effect of pore structure on resistivity of carbonate reservoirs. Chin. J. Geophys. 63 (11), 4232–4243. doi:10.6038/cjg2020O0110
Wang, B., Wang, J., and Liu, Y. (2023). 3D carbonate digital rock reconstruction by self-attention network and GAN structure. Appl. Sci. 13 (24), 13006. doi:10.3390/app132413006
Wang, B. W., Zhang, S. D., and Ji, R. (2017). Application of microscope high resolution LWD resistivity image logging in carbonate reservoir in Sichuan Basin. Well Logging Technol. 41 (3), 358–363. doi:10.16489/j.issn.1004-1338.2017.03.020
Wang, Q., Zhang, Y. T., and Zhang, J. (2024). Advance in geological modeling methods of fracture-cavity carbonate reservoirs. Mar. Orig. Pet. Geol. 29 (01), 99–112. doi:10.3969/j.issn.1672-9854.2024.01.009
Wang, R. Y., Hu, Z. Q., and Zhou, T. (2021). Characteristics of fractures and their significance for reservoirs in Wufeng - longmaxi shale, Sichuan Basin and its periphery. Oil and Gas Geol. 42 (6), 1295–1306. doi:10.11743/ogg20210605
Wen, Y. C., Hou, J. R., Xiao, X. L., Qu, M., Zhao, Y. J., et al. (2023). Utilization mechanism of foam flooding and distribution situation of residual oil in fractured-vuggy carbonate reservoirs. Petroleum Sci. 20 (3), 1620–1639. doi:10.1016/j.petsci.2022.11.020
Wu, J. J., Zhang, C. K., and Xue, T. F. (2017). Learning a probabilistic latent space of object shapes via 3D generative-adversarial modeling. Arxiv. 1610.07584. doi:10.48550/arXiv.1610.07584
Xie, J., Cui, Y. A., and Chen, H. (2023). 3D DC resistivity numerical modeling by natural-infinite element coupling method. Chin. J. Geophys. 66 (06), 2670–2684. doi:10.6038/cjg2022Q0064
Xiong, J., Zhang, C. Y., and Liu, X. J. (2018). “The influence of confining pressure on the cementation index m and the saturation index n of carbonate reservoir,” in Beijing: 2018 international geophysical conference, 1228–1231. doi:10.6038/cjg2022Q0064
Yao, Y. T., Zeng, L. B., Dong, S. Q., Huang, C., Cao, D., Mao, Z., et al. (2024). Using seismic methods to detect connectivity of fracture networks controlled by strike-slip faults in ultra-deep carbonate reservoirs: a case study in northern tarim basin, China. J. Struct. Geol. 180, 105060. doi:10.1016/j.jsg.2024.105060
Zhang, Z. H., Gao, C. Q., and Gao, Y. D. (2014). Theoretical simulation and analysis factors of resistivity in vuggy reservoir. J. Southwest Petroleum Univ. Sci. and Technol. Ed. 36 (2), 79–84. doi:10.11885/j.issn.1674-5086.2012.08.30.14
Zhang, Z. L., Zhao, L. Z., Zhang, D. W., Li, Q., Chen, H., Wen, L., et al. (2024). Diagenetic evolution and cementation mechanism in deep Carbonate reservoirs: a case study of Dengying Fm. 2 in Penglai, Sichuan Basin, China. Mar. Petroleum Geol. 170, 107084. doi:10.1016/j.marpetgeo.2024.107084
Keywords: carbonate rock, multi-scale digital cores, fractures, caves, resistivity
Citation: Li G, Zhao J, Liu Y, Xiao Z, Cui S, Wei B, Zhang C, Mao Y, Xia Y, Xu L, Sun J and Hu Z (2025) Research on multi-scale digital core construction of carbonate rock with fractures and caves characteristics: a case study of Dengying formation carbonate rocks in Sichuan Basin. Front. Earth Sci. 13:1528829. doi: 10.3389/feart.2025.1528829
Received: 15 November 2024; Accepted: 07 April 2025;
Published: 17 April 2025.
Edited by:
Giovanni Martinelli, National Institute of Geophysics and Volcanology, ItalyCopyright © 2025 Li, Zhao, Liu, Xiao, Cui, Wei, Zhang, Mao, Xia, Xu, Sun and Hu. This is an open-access article distributed under the terms of the Creative Commons Attribution License (CC BY). The use, distribution or reproduction in other forums is permitted, provided the original author(s) and the copyright owner(s) are credited and that the original publication in this journal is cited, in accordance with accepted academic practice. No use, distribution or reproduction is permitted which does not comply with these terms.
*Correspondence: Yuejiao Liu, bGl1LXl1ZWppYW9AcXEuY29t