 S. J. Elliott1*‡
 S. R. Forstner1,2
 Q. Wang1‡
 R. Corrêa1,2,3‡†M. Shakiba3
 S. A. Fulcher4‡N. J. Hebel6B. T. Lee3S. T. Tirmizi3
 J. N. Hooker6‡A. Fall1J. E. Olson3,5‡
 S. E. Laubach1,6‡
- 1Bureau of Economic Geology, The University of Texas at Austin, Austin, TX, United States
- 2Department of Geological Sciences, The University of Texas at Austin, Austin, TX, United States
- 3Department of Petroleum and Geosystems Engineering, The University of Texas at Austin, Austin, TX, United States
- 4Department of Earth and Atmospheric Sciences, Cornell University, Ithaca, NY, United States
- 5Energy and Earth Resources program, The University of Texas at Austin, Austin, TX, United States
- 6Department of Atmospheric Science, Environmental Science, and Physics, University of the Incarnate Word, San Antonio, TX, United States
Exceptionally large, well-exposed sandstone outcrops in New York provide insights into folds, deformation bands, and fractures that could influence permeability, heat exchange, and stimulation outcomes of geothermal reservoir targets. Cambrian Potsdam Sandstone with <5% porosity contains decimeter-scale open, angular-limbed monoclines <0.5 km apart with associated low-porosity mm-wide cataclastic deformation bands. Crossing and abutting relationships among sub-vertical opening-mode fractures show four chronological Sets A–D, striking NNW, NE, NW, and ENE, respectively. Fracture lengths and heights range from millimeters to tens of meters. Sets A and C macro-fractures, and possibly B and D, contain quartz deposits. All sets have abundant associated quartz cemented microfractures that also record set orientations and crosscutting relations. Quartz cement deposits—evidence of diagenesis—are the key to identifying attributes of outcrop fractures suitable for extrapolation to geothermal targets in sandstones because they show which fractures formed in the subsurface. Set A fluid inclusion homogenization temperatures (120°C–129°C) are compatible with fracture at >3 km depth. Fractures are stiff and those ≥0.05 mm (Set C) and ≥0.1 mm (Set A) are open and potentially conducive to flow. Sets A and D are abundant in outcrops with close fracture spacing—0.18 m and 0.68 m, respectively—and define a rectangular connectivity network dominated by crossing and abutting X and Y nodes. Set A aperture distributions follow a power law with slope −0.8 up to 0.15 mm; other sets have lognormal distributions. Set A and D microfractures are weakly clustered, while macro-fractures commonly have 1D anticlustered (regular or periodic) arrangements at shorter length scales (<0.2 m). Sub-horizontal fractures are barren and may have formed near the surface. Fracture heights, lengths, and spatial arrangements show good trace connectivity but low open connectivity. For geothermal applications, outcrop results predict low initial well-test permeabilities owing to quartz disconnecting open fractures, but stimulation of closely spaced microfractures and partly open macro-fractures could yield high surface area for heat exchange. Quantitative extrapolation of key fracture attributes like abundance, orientation, spatial arrangement, length, and open fracture connectivity is possible from outcrops to fractured reservoirs if differing thermal histories and diagenesis are accounted for.
1 Introduction
To produce hot water or create an efficient circulation system, low-enthalpy geothermal reservoirs need effective heat exchange within the host rock and sustained high flow rates with no fast-paths for water breakthrough (Watanabe and Takahashi, 1995; Anderson and Rezaie, 2019; GeoVision, 2019). Geothermal appraisals can effectively account for ambient temperature (Muffler and Cataldi, 1978; Barbier, 2002; Ghassemi, 2012; Gee et al., 2021) and, in sandstone, host-rock porosity and permeability (Lander et al., 2008; Taylor et al., 2022). However, optimal stimulation of enhanced geothermal (EGS) reservoirs may depend on the size, openness, stiffness, strength, abundance, surface area, arrangement, and connectivity of naturally occurring fractures that are hard to sample or accurately predict.
Finite wellbore size and orientation impose limits on what subsurface fracture attributes can be sampled effectively (Garg et al., 2007; Laubach et al., 2019; Boersma et al., 2021). Consequently, assessment based on subsurface observations may be supplemented by inspection of exposed rocks that are judged to be appropriate analogs for the subsurface target (Agosta et al., 2010; Sanderson, 2016; Ukar et al., 2019). A range of factors go into selecting a good analog for a subsurface geothermal target, including matching rock types and—broadly—structural history (Bauer et al., 2017; Busch et al., 2022) (Table 1). Some studies have questioned the viability of using outcrops for making specific predictions about key subsurface parameters like fracture abundance or connectivity (Peacock et al., 2022), but as we show here, this is a pessimistic view.
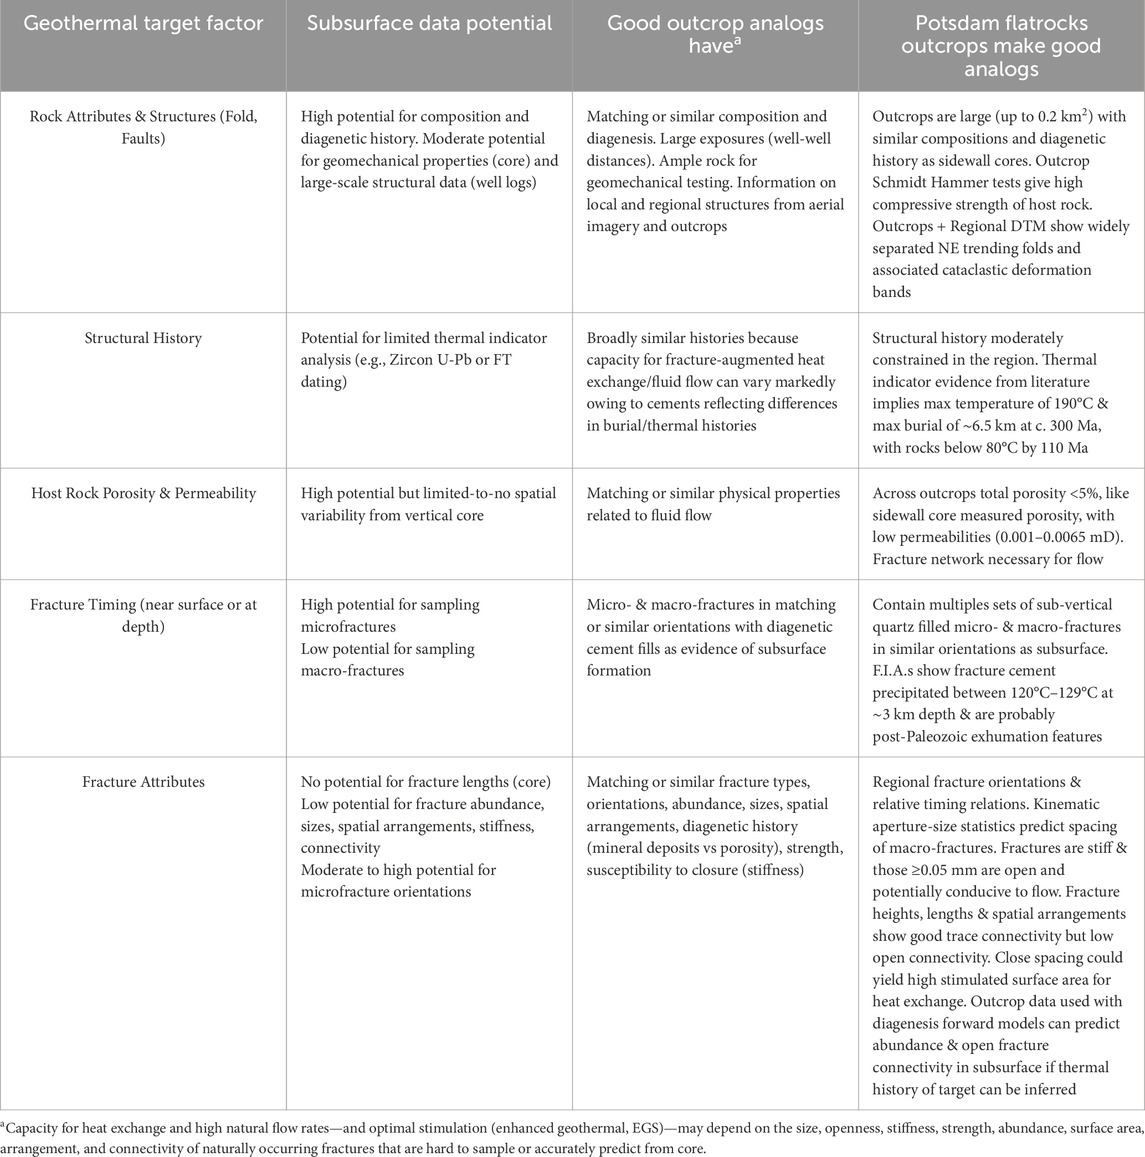
Table 1. Attributes of a suitable outcrop analog for subsurface geothermal targets.
Fractured sandstones are geothermal targets worldwide (Vidal and Genter, 2018). In New York (Jordan et al., 2020; Fulcher et al., 2023) and elsewhere in North America (Somma et al., 2021; Chong et al., 2022; Tai and Gates, 2024), lower Paleozoic sandstones are targets for geothermal development, yet the attributes of fractures in these rocks are poorly known. For geothermal prospects in New York the potential importance of fracture-augmented permeability has long been recognized (Pferd, 1981; Plumb and Hickman, 1985), and evidence of fractures has been found in subsurface cores and image log data (Lynch and Castor, 1983; Hickman et al., 1985; Fulcher et al., 2023).
Outcrops provide information relevant to geothermal targets in the eastern United States including fracture types, strike directions, abundance, size, arrangement, porosity, diagenesis (mineral deposits), strength, and susceptibility to closure (stiffness). Using large, exceptionally well exposed outcrops of Cambrian Potsdam Sandstone in northeastern New York (Figures 1, 2)—a regional geothermal target—we describe structural assemblages and fracture patterns and present diagenetic evidence that most fractures formed at least 3 km deep, within the current depth range for geothermal prospects in this unit. Regional fracture orientations and relative timing are inferred, and we show that for rocks containing microfracture populations, kinematic aperture-size statistics can accurately predict spacing of larger open fractures. We show that even centimeter-scale samples (of the dimension of sidewall cores) may provide site-specific fracture information if thermal history and associated diagenesis is accounted for between the target and outcrop. Quartz cement is key to the strength and capacity of these fractures to conduct fluid flow, and the degree of quartz fill—and the size of open fractures in terms of aperture and length—will depend on thermal exposure in predictable ways (Lander and Laubach, 2015). With host rock diagenesis and microstructural information from outcrop analogs and subsurface targets, quantitative comparison of fracture surface area and likely flow pathways is feasible. Our study also provides insights into the general issue of how to use outcrops to characterize subsurface prospects under the inherent limitations of fracture sampling.
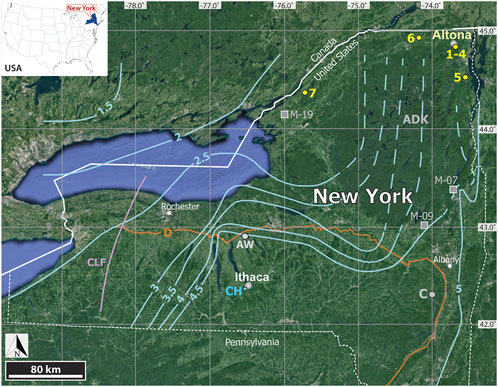
Figure 1. Regional context of Cambrian Potsdam Group sandstone outcrops (1-4) within Flat Rock State Forest and Miner Institute Preserve, (5) Ausable Chasm, (6) High Falls (44°54′34.88″N; 74° 5′14.16″W), (7) Hammond pavement (44°23′14.00″N; 75°44′42.00″W). Well locations are (CH) Earth Source Heat Well No. 1, Cornell University Borehole Observatory near Ithaca, and (AW) Auburn well. Structural references are the Clarendon-Linden Fault Zone (CLF) and the center of Adirondack dome (ADK). Contour D is the northern limit of Devonian strata. Location C represents coalified plant debris in upper Devonian strata interpreted as buried to 6.5 km (Friedman and Sanders, 1982). Solid blue contours are conodont alteration index (CAI) isograds for Silurian to Middle Devonian rocks (Harris et al., 1978; Weary et al., 2000; Repetski et al., 2014) - dashed blue lines are speculative projections of isograds across the ADK. Gray Squares are Zircon U-Pb and FT analysis of Potsdam (M-07, M-19) and Galway (M-09) Formations indicating no sustained temperatures >200°C since deposition (Montario and Garver, 2009). State borders are dashed white lines.
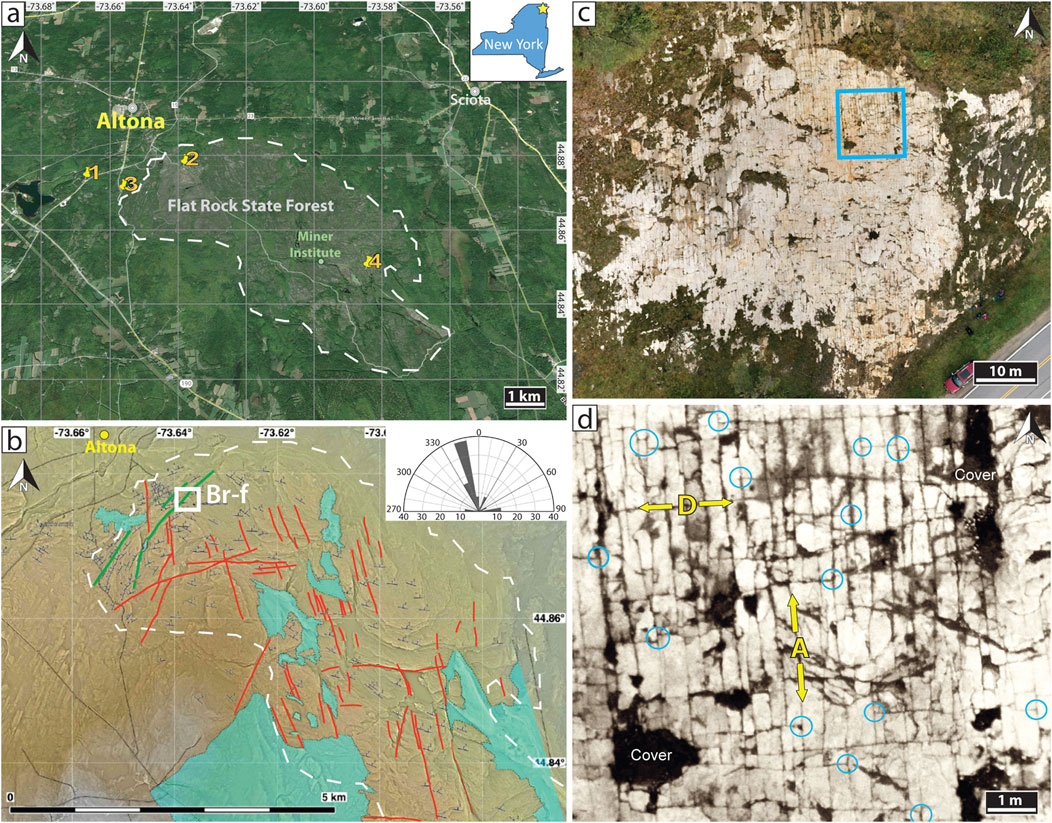
Figure 2. Flat Rocks area outcrops near Altona, NY. (A) Google Earth image: 1, Route 16 (Rt16); 2, Brunell Road (BR); 3, Rock Road (RR); 4, Cold Brook Lake (CBL). Well field of Hawkins et al. (2017) is near CBL. White dashed line marks well-exposed areas (grey tones, pavement exposure). Inset: location map, New York. (B) Flat Rocks structures on regional texture shaded 1 m LiDAR DTM (pers. comm., R. W. Allmendinger 2022). White box (Br-f) is BR fold locality in Figure 5. Red lines, fracture traces; green lines, monocline axial traces. White dashed line marks well-exposed area from A. Blue shading indicates obscuring Quaternary cover. Inset: Rose diagram of length-weighted fracture frequencies from DTM; dominant trend NNW. (C) 30-m elevation drone image of Rt16 outcrop (5,534 m2). (D) Color-modified boxed area in C highlighting opening-mode fracture Sets A and D. Note abutting relations of Set D against Set A (blue circles).
2 Methods
See Supplementary Data Sheet 1 for more information on Methods.
2.1 Microstructural image acquisition
We document rock and fracture deposit mineralogy and textures using transmitted light microscopy, SEM cathodoluminescence imaging (SEM-CL), and variable pressure secondary electron imaging (VPSE) that reveals textures and quartz luminescence intensities and colors reflecting trace elements and mineral lattice defects (Götze et al., 2001; Stokes, 2008). We point counted correlative image stacks (SEM-CL and EDS) in JMicrovision® for compositional analysis. Strip-shaped multi-thin section image mosaics were collected using SEM-CL images to record microfracture populations.
Fluid inclusion assemblage microthermometry was performed using a microscope-mounted gas-flow heating-freezing stage. Two-phase aqueous fluid inclusion assemblages at room temperature were heated to homogenization (Th) to single-phase liquids (Goldstein and Reynolds, 1994; Fall and Bodnar, 2018) and minimum trapping temperatures (Tt) were inferred.
2.2 Rock mechanical properties
In situ rock mechanical properties were tested using an N-type Silver Schmidt Hammer that allows rapid non-destructive measurement of rebound of a spring-loaded mass impacting against the outcrop surface (Aydin and Basu, 2005). Measurements were taken at 10 localities including deformation bands, sandstone adjacent to bands, and sandstone far from bands with qualitatively different fracture patterns. 10–16 tests were conducted within the same bedding horizon per locality.
2.3 1D and 2D size and spatial arrangement and connectivity
We describe fractures based on maps and on scanlines oriented at high angle to fracture strike for each set, measuring true inter-fracture distances and kinematic apertures. We used continuous bed-parallel multi-thin section microscanlines from oriented samples (Gomez and Laubach, 2006) for microstructural analysis. We characterized 1D spatial arrangement with coefficient of variation (Cv) (Gillespie et al., 2001; Hooker et al., 2023b) and open-access CorrCount software for normalized correlation count (NCC) metrics (Marrett et al., 2018) validating results with a statistical envelope obtained from randomizations.
Two-dimensional fracture distribution data was acquired from a texture-shaded 1-m LiDAR bare earth digital terrane model (DTM) (pers. comm., R. W. Allmendinger 2022; Allmendinger and Karabinos, 2023), from a camera-equipped drone flown at 20 or 30 m elevation covering areas of as much as 0.2 km2, from iPhone 12 Pro 1–2 m elevation LiDAR (Scaniverse, Polycam, and 3dScanner software) covering 40–1,000 m2, and from high-resolution SEM-CL and VPSE photomontages covering as much as 3,800 mm2.
Trace lengths, intersections, and terminations were mapped at different scales and trace patterns were analyzed with FracPaQ2D (Healy et al., 2017) and ArcGIS. For length and network connectivity analysis, terminations were classified as isolated (I), connected (Y and X) (e.g., Sanderson and Nixon, 2015), or scale-dependent rule-based contingent (C) nodes (Forstner and Laubach, 2022) that identify diagenesis-sensitive connections and continuity.
3 Geologic setting
3.1 Regional setting
In New York, the mid to upper Cambrian Potsdam Group comprises alluvial, fluvial, locally eolian, and shallow marine siliciclastic onlap deposits that unconformably overlie Precambrian crystalline rocks (Wiesnet, 1961; Landing et al., 2009; 2024; Lowe et al., 2015). The Potsdam Group conformably transitions upward into the mixed sandstone-dolostone facies of the Cambrian Galway Formation (Fisher, 1968; Hersi et al., 2021) which are overlain by Cambrian to Lower Ordovician siliciclastic and carbonate rocks (Otvos, 1966; Hersi et al., 2021).
The Potsdam Group is thickest to the north, e.g., 750 m thick in southern Canada (Landing et al., 2009), thinning to c. 160 m near Plattsburgh, NY (Hagadorn and Belt, 2008) (Figure 1), and continues thinning west- and southwards toward the southern Lake Champlain Valley (Selleck, 1997). The studied Potsdam Group outcrops in northeastern New York’s Flat Rocks State Forest (Figure 1) consist of two main lithostratigraphic units: the Ausable Formation and the unconformably overlying Keeseville Formation (Fisher, 1968; Landing et al., 2009; Lowe et al., 2015). Compositionally, the Potsdam in this area grades upward from feldspathic and argillaceous deposits to a homogeneous, well-indurated quartz arenite (Landing et al., 2007).
Structurally, Potsdam sandstone in northeastern New York experienced Paleozoic shallow burial in platform to passive margin settings (e.g., Landing et al., 2009; 2024; Hersi et al., 2021) followed by three pulses of subsidence and sedimentation in foreland settings associated with the Taconic (∼450 Ma), Acadian (∼360 Ma), and Alleghanian (∼300 Ma) Orogenies (e.g., Robinson et al., 1998; Montario and Garver, 2009) (Figure 1). Our study area c. 20 km west of the foreland thrust front likely experienced Paleozoic deformation (Bradley and Kidd, 1991) and local intrusion by hydrothermal fluids (Smith, 2006).
The uplift history lacks strong constraints. Friedman and Sanders, 1982 interpreted coalified plant debris in Upper Devonian strata as buried to 6.5 km with a maximum temperature of 190°C. This depth is compatible with burial beneath about 6.4 km of Carboniferous strata that may have extended over the region (Wood et al., 1969), as well as possible burial by Paleozoic thrust sheets (Friedman and Sanders, 1982). Zircon U-Pb and FT analysis of Potsdam and Galway Formation samples indicate no reset of fission track ages, i.e., no widespread sustained temperatures >200°C since deposition (Montario and Garver, 2009). Conodont alteration index (CAI) isograds of Silurian to Middle Devonian rocks (Harris et al., 1978; Repetski et al., 2014) extrapolated across the Adirondack Dome (Figure 1) suggest high paleotemperatures associated with either deep burial beneath now eroded overburden or an elevated geothermal flux associated with Cretaceous-age ultramafic intrusions in central and eastern New York (Weary et al., 2000). Based on thermal modeling, the Alleghanian orogeny may have caused slow uplift followed by gradual Mesozoic exhumation (Heizler and Harrison, 1998). Taylor and Fitzgerald (2011) infer stable tectonic and thermal conditions in the Middle Jurassic followed by regional heating, an elevated geothermal gradient ca. 130–120 Ma, and rapid cooling c. 105–95 Ma. Using a geothermal gradient of ∼20 °C/km, and with exhumation of ∼25 m/m.y. from c. 160 to 115 Ma, Potsdam rocks may have been at temperatures less than 80°C by 110 Ma.
Faults with diverse movements and timing are documented in central New York (Jacobi et al., 2021). Eastern New York and Vermont contain north, northeast, and east-striking lineaments (Isachsen, 1975; Isachsen and McKendree, 1977; Valentino et al., 2016) and faults (e.g., Engelder and Sbar, 1976; Stanley, 1980; Pferd, 1981; Bradley and Kidd, 1991; Hayman and Kidd, 2002). Some faults reflect Carboniferous to Jurassic extension related to rifting (e.g., Manspeizer, 1988; Heaman et al., 2003). Other regional features include post-rift uplift related to erosional unloading (Anders et al., 2022) and doming of the Adirondacks (partly ongoing) (Isachsen, 1974; Amidon et al., 2022). The modern reverse fault (compressional) stress state features maximum horizontal principal stress (SHmax) trending ENE (Snee and Zoback, 2022).
Potsdam sandstone has been the focus of mechanical property research (e.g., Engelder and Sbar, 1977; Copuroglu, 2010), is widely used as a building stone (Lawrence, 2001), and is a regional aquifer (Nastev et al., 2008). Regionally flow pathways based on well tests are along bed-parallel fractures with subsidiary flow on some vertical joints (Williams et al., 2010a; b; Hawkins et al., 2017).
3.2 Outcrop attributes
Our fracture measurements are primarily from the Flat Rocks outcrops southeast of Altona, NY (Figures 1, 2), which have been interpreted as either Ausable (Williams et al., 2010a) or Lower Keeseville Formation (Sanford and Arnott, 2010) of the Potsdam Group. We follow Sanford and Arnott and interpret the exposures as lower Keeseville.
The Flat Rocks area generally has low relief and thin cover. Exposures of 5,500 m2 to 0.2 km2 (Figure 2) are the result of Pleistocene glacial scour along bed surfaces and subsequent erosion by flooding from failure of late glacial ice dams (Rayburn et al., 2005; Rayburn et al., 2007). Although nearly vegetation-free bed-parallel outcrops as large as 32 km2 are present, many surfaces are obscured by lichen and surface biofilms, so we restricted high-resolution fracture analysis to pristine bed surfaces of tens to ∼5,000 m2 (Figure 2C) within an approximately 19 km2 area of generally good exposure. Serial Google Earth images show year-to-year variation in surface cover suggesting local lack of biofilms may be in part anthropogenic (vehicle use). Cold Brook Lake (CBL) and Rock Road (RR) mainly have narrow (c. 2 m) exposure strips along unimproved roads, whereas Brunell Road (BR) and Route 16 (Rt16) outcrops are large and equant. BR is ∼187,329 m2 (0.19 km2) and Rt16 ∼5,534 m2. BR is subdivided by covered areas and, owing to differential weathering, the stratigraphic level of exposed rocks shifts gradually, so only smaller areas are both fully exposed and demonstrably within the same horizon. In contrast, Rt16 is continuously exposed mostly within the same horizon. Although it probably exposes slightly higher parts of the section, the c. 3,000 m long, 45 m deep ravine at Ausable Chasm, about 35 km south of Altona (Figure 1), provides cross-sectional views of Potsdam sandstone (Keeseville) fracture height patterns. We also inspected and sampled other Potsdam outcrops around the margin of the Adirondacks (Figure 1).
4 Results
See Supplementary Data Sheet 1 for more information on Results.
4.1 Sandstone properties
Outcrops are gray to tan, parallel-to cross-laminated subarkosic arenites with little-to-no bioturbation (classification of McBride, 1963). Sandstone samples are medium to fine, with moderately-to well-sorted and rounded grains. Quartz is the most abundant grain type (avg. 65% of total volume; avg. 87% of detrital volume) (Figure 3; Table 2). Most quartz grains are monocrystalline with straight or slightly undulose extinction. Polycrystalline quartz is negligible and rare metaquartzite grains were counted within total quartz grain volume. Detrital potassium-feldspar comprises 8%–10% of total rock volume (12% of detrital volume). Labile lithic fragments were not observed. Minor accessory minerals, mostly iron-oxides, titanium-oxides, zircon, and apatite, comprise ∼0.5% of whole rock volume (Table 2).
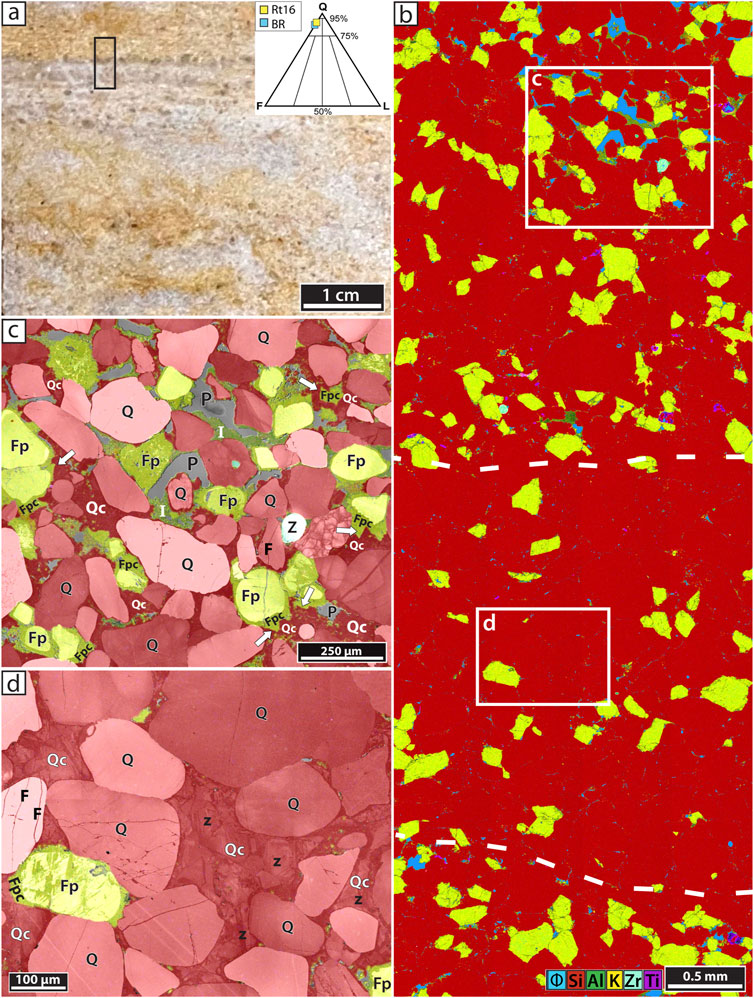
Figure 3. Potsdam sandstone host rock. (A) Rt16 hand sample cut orthogonal to finely laminated beds with mottled iron-oxide stain. Box, area shown in B-D. Inset: QFL ternary diagram; Rt16 and BR are subarkosic arenites. (B) SEM-EDS image of boxed area in (A). Image modified to highlight bed-to-bed porosity variation (Φ–blue). Dashed white lines, bed interface. Quartz, red; K-Feldspar, yellow; Clay minerals, green; Zircon, teal; Ti-oxide, purple. Middle more quartz-rich layer has less porosity. (C) SEM-CL-EDS composite image, box c in B. Q, quartz grain; Fp, K-feldspar grain, Qc, quartz cement; Fpc, K-feldspar cement; I, illite; Z, zircon; P, porosity; F, subvertical quartz-filled transgranular microfracture. Arrows, eu- to subhedral coeval interpenetrating quartz and K-feldspar cements. (D) SEM-CL-EDS composite image, box d in B. Primary intergranular volume filled with quartz (Qc), some with growth zoning, z. F, subvertical quartz-filled transgranular microfracture.
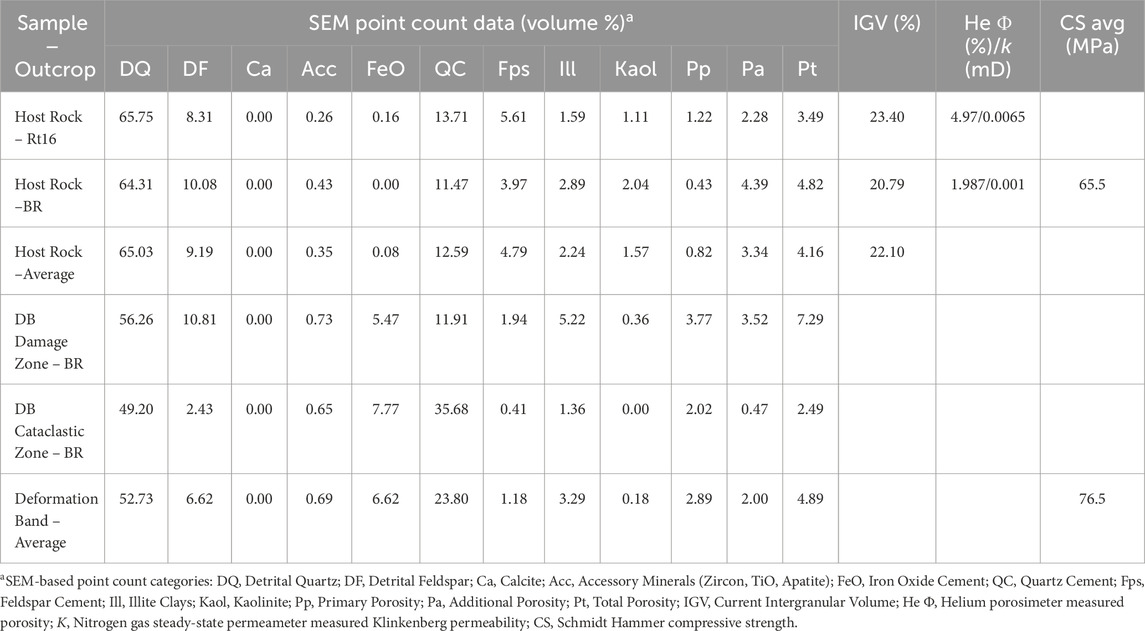
Table 2. Point count and rock property measurements.
Potsdam sandstone here and elsewhere is strongly indurated by quartz and feldspar cements (e.g., Selleck, 1997). Quartz is the most abundant cement averaging 12.6% of total rock volume (60% of authigenic volume). Based on morphology, overlap relations, and CL response, quartz cement is subdivided into older Qc1 and younger Qc2 textural zones (Figure 4). Older Qc1 luminesces orange-red and comprises subhedral microcrystals (0.0007–0.006 mm; avg. 0.0027 mm) forming detrital grain rims 0.002–0.01 mm thick (locally up to 0.04 mm). Qc1 contains nano- and microporosity (primary or secondary) and is about a third of total quartz cement. Younger Qc2 comprises large syntaxial, mostly blue-luminescing crystals (0.0085–0.139 mm; avg. 0.0347 mm) with facets facing primary pores. Qc2 locally has growth zones marking progressive quartz accumulation, distinguished by SEM-CL contrasts (Figures 3D, 4), and commonly fully occludes primary pores.
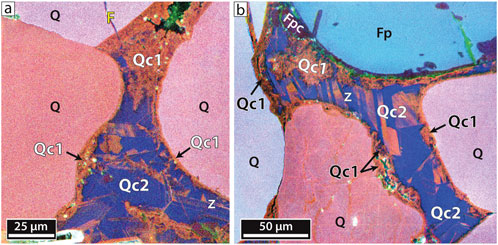
Figure 4. Color SEM-CL showing textures and colors of primary pore-filling quartz cements. (A) Older red-orange Qc1 and younger blue Qc2, Rt16. Q, quartz grain; F, quartz-filled transgranular microfracture; z, zoning; clays, black; porosity, green. (B) Older red-orange Qc1 and younger blue Qc2, BR. Fp, K-Feldspar grain.; Fpc, K-feldspar cement; Porosity, green.
Potassium-feldspar cement is the second most abundant authigenic mineral (avg 4.8% of total rock volume; 23% of authigenic volume) and forms sub-to euhedral overgrowths on K-feldspar grains. Detrital K-feldspar grains contain rare secondary macropores >0.03 mm (intragranular dissolution voids); K-feldspar cement commonly contains sporadic secondary nano- and microporosity. Overlap relations in beds show localized post-cementation alteration of K-feldspar cement to kaolinite (1%–2%). Other cements include clay minerals (illite, ∼2.5%) and late iron oxide deposits (<0.2%).
Porosity, documented in one sample each from Rt16 and BR by SEM-based point count inspection, is uniformly low. Average primary porosity is <1%. Excluding fracture porosity, additional porosity (2.3%–4.4%) comprises both nano- and microporosity localized within K-feldspar cement, clays, and Qc1, as well as secondary dissolution macroporosity within detrital K-feldspar grains (Table 2). Nano to micropores avg. 0.0028 mm in diameter but range from the minimum resolution of SEM-CL (a few hundred nm/pixel) up to 0.016 mm. Rare secondary macropores average 0.0305 mm diameter. Total point count porosity is 4.82% for BR and 3.49% for Rt16. Helium porosity laboratory measurements found total porosities of 1.99% (BR) and 4.97% (Rt 16), and low Klinkenberg permeabilities of 0.001 mD (BR) and 0.0065 mD (Rt16). Lab measurements are comparable to point count values but record higher porosity at Rt16 by ∼1.5% and lower porosity at BR by ∼2.8%, reflecting differences in prevalence of micro- and secondary porosity. Regardless of method or outcrop, total porosity measurements for Potsdam sandstone in this area are <5% (Table 2).
Current Intergranular Volume (IGV) in our Rt16 and BR samples averages 22.1% (Table 2). Assuming an initial IGV of 40% (Paxton et al., 2002), average compactional porosity loss (COPL) is 23.0%, average cementational porosity loss (CEPL) is 16.4%, and the index of compaction (Icomp) is 0.58 indicating compaction is the predominant contributor to porosity loss (Lundegard, 1992; Makowitz and Milliken, 2003). Because the Potsdam sandstone in our outcrops is a clean (minor feldspar, no lithics), uniform, rigid and densely packed rock (Figure 3), pressure solution must have played a role along with mechanical grain rearrangement for the Potsdam to have reached 22% IGV (Lundegard, 1992). Low IGV values are compatible with cement accumulation in primary pores postdating most compaction, but quartz-filled fractures and stylolitic, interdigitated grain contacts mark compaction (and lateral, tectonic shortening) broadly contemporaneous with some cement deposits. Mutually penetrating/overlapping quartz and feldspar cement is compatible with coeval precipitation in Potsdam sandstone as noted elsewhere (Kastner and Siever, 1979). See Supplementary Data for analysis of IGV and solutional porosity loss.
Most outcrops are massive to cross-bedded, and although IGV tends to be nearly filled with cements, grain size, composition, and diagenetic alteration vary slightly with stratigraphic position. For example, finely laminated beds containing more detrital K-feldspar, feldspar cement, and clay alteration result in less quartz cement and higher primary porosity (avg. 3.9%; locally up to 4.5%) (Figure 3). Random oversized pores are probably due to grain plucking during sample preparation.
Schmidt Hammer tests show Potsdam sandstone is a strong, brittle rock with high compressive strength (mean 65.5 MPa, range 44–80.5 MPa, n = 81) (Supplementary Figure S1, L1). We measured seven areas (∼5 m2 each) distant from deformation bands and adjacent rock representing four localized, qualitatively different fracture patterns to test if differences correspond to mechanical property variation. Rock with an orthogonal fracture pattern (Supplementary Figure S1, L2-3) has the highest strength (mean 72.3 MPa), while rock with fracture clusters (mean 56.5 MPa) has the lowest strength (Supplementary Figure S1, L4-5). Rock with sparse fractures separated by >2 m distances (Supplementary Figure S1, L6-7; mean 65.0 MPa) is like areas with Fe-stained fracture clusters (mean 65.3 MPa) (Supplementary Figure S1, L8). Differential weathering marks slight variations with bed composition, grain size, and locally resistant deformation bands, but there is little evidence for mechanical variations in terms of differential weathering.
4.2 Monoclines and cataclastic bands
Potsdam outcrops near Altona are nearly flat lying, with dips of 1°–9° to the NW, N, and NE (Figures 2B, 5A). Most outcrops are distant from mapped folds or faults, but open monoclines having angular hinges and straight limbs are locally present. Between RR and BR, regional texture-shaded 1 m LiDAR DTM reveals bed dips that locally exceed 3°–4° (pers. comm., R. W. Allmendinger 2022) marking NE-striking, NW-vergent narrow monoclinal steep limbs up to 100 m wide. Their sparsity on regional DTM (Figure 5), their absence at Rt16, much of RR, and CBL exposures, and their circumscribed occurrence within the BR area show that folds are widely separated (∼200–500 m). Correlation of dip patterns on regional DTM suggests fold traces persist for as much as 2.5 km.
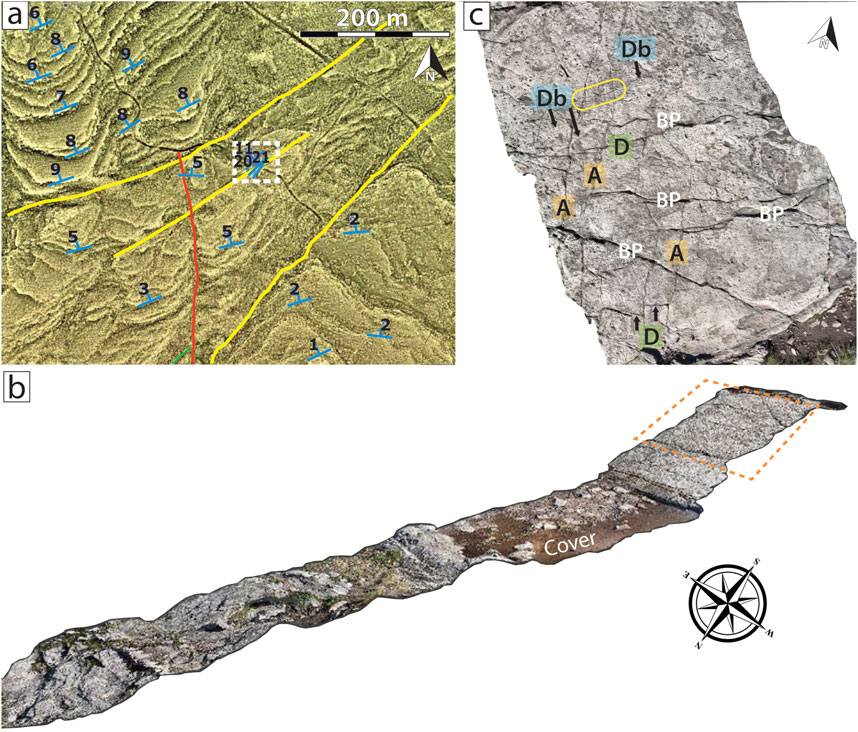
Figure 5. Monoclines near Altona. (A) Texture shaded 1 m LiDAR DTM subarea, BR (Br-f in Figure 2B for context). Note visible bed dips. Red lines, fracture traces; yellow lines, axial surface traces trending NE. Blue T symbols: three-point calculated bed strikes and dips (pers. comm., R. W. Allmendinger 2022; Allmendinger and Karabinos, 2023). Access road is dark sinuous line. Dashed box, fold with deformation bands. (B) iPhone 3D LiDAR image, BR northeast-trending open, angular limbed monocline (yellow line through dashed box in a). LiDAR image view ∼ SE. (C) Rotated-to-North plan view iPhone 3D LiDAR image of hinge (dashed area in B) showing fracture Sets A and D, deformation band (Db) traces, and subtle shifts in exposed bedding plane horizons (BP) due to differential weathering. Yellow circle, Set A fractures crosscut older deformation bands.
At BR a well-defined N35E-trending, NW-vergent monocline with kink geometry has a steep axial surface separating gently dipping beds (3°–4°) to the SE from several panels to the NW representing the steepest dips in the region (locally up to 20°) (Figure 5B). The width of the tilted zone is about 100 m. Another area of steep dip crosses RR, but exposures record contrasts in bed dip rather than fracture attributes.
The BR outcrops preserve fracture attributes within the steep monocline limb and in adjacent rocks with regional dips. Topographically positive (resistant) tabular deformation bands in parallel arrays with mildly anastomosing traces of as much as several meters (censored by outcrop width) are associated with the BR monocline. Bands are primarily found within kink-fold steep limbs, localized within tilted rocks and the hinge (Figures 5, 6). We found only one instance of bands in unkinked rock, and this exposure is along trend from another kink fold seen on DTM.
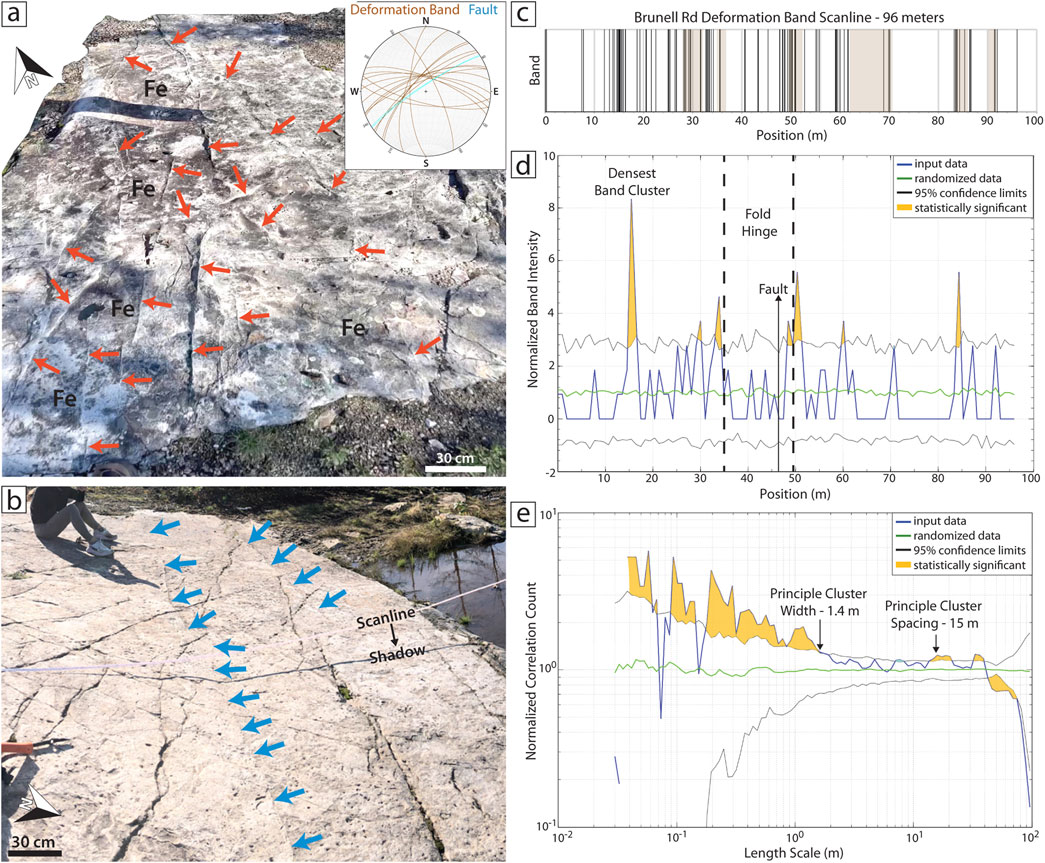
Figure 6. Deformation bands at BR and spatial analysis using CorrCount (Marrett et al., 2018). (A) Oblique view 3D LiDAR of deformation bands with positive relief localized within fold limb (arrows). Inset: Stereonet of band orientations across fold. (B) Band abundance and strike dispersion decreases near the fold hinge (arrows). (C) Stick plot showing bands along 96 m scanline. Highlighted areas, covered sections filled by randomized bootstrap analysis. (D) Normalized band intensity plot with several significant peaks, most notably at 15 m in limb. Band clusters are mostly located in fold limbs. Intensity is number per unit length scanline (Ortega et al., 2006). (E) Normalized correlation count logarithmic plot shows high numbers of closely spaced bands at sub-meter scale, with a principal cluster width of 1.4 m and a weak average cluster spacing of 15 m. Highlighted areas mark statistically significant parts of curve exceeding 95% confidence interval.
Bands dip steeply (avg 71°) and are lighter colored than surrounding sandstone (Figures 5C, 6). Bands are oriented mostly NE to ENE within the monocline limbs, with a few striking NNE, NS, and NNW (Figure 6A). Strike dispersion decreases near the hinge with NE to ENE-striking bands only (Figure 6B). Most bands are a few mm to ∼1 cm wide, but the largest band observed near the fold hinge was 100 mm wide (Figure 6; Supplementary Figure S1). Adjacent rock is locally Fe-stained in asymmetric patterns with more stain on one side of bands than the other (Figure 6A). Bands are crosscut, and thus predate, all later fracture sets (Figure 6B).
NCC analysis of a 96 m 1D scanline drawn normal to the hinge shows prominent spatial clusters located within the limbs, and high intensity values near the hinge where the widest band is located (Figure 6D). The NCC spatial pattern consists of high numbers of closely spaced bands at sub-meter scale, with a principal cluster width of 1.4 m and a weak signal indicating ∼15 m cluster spacing (Figure 6E). A randomized spatial bootstrap approach used measured values in exposed areas to generate band locations in covered areas (Figure 6C; Shakiba et al., 2022). We found no visible offset across bands at both outcrop and microscale (Figures 6, 7).
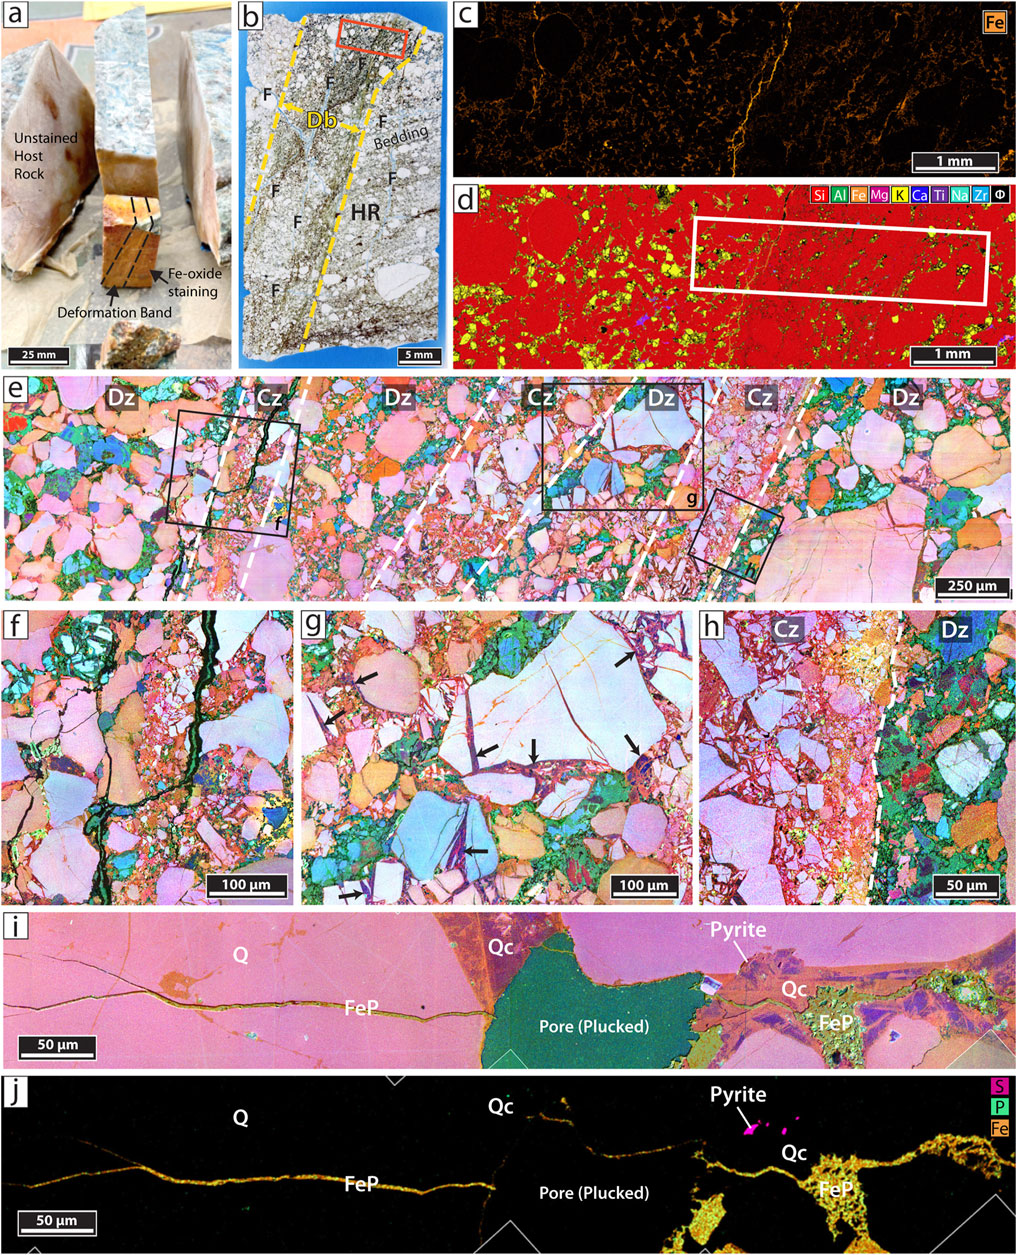
Figure 7. Deformation band composition and microtextures. (A) BR hand sample with increased iron-staining (orange) surrounding band. (B) Blue epoxy-stained bed-perpendicular thin section of band in A. Fe-oxide cement is black or brown in plane light. F, localized late fractures in various orientations. (C) SEM-EDS iron elemental map of boxed area in B. (D) SEM-EDS of same area as C. Quartz, red; detrital K-Feldspar, yellow; clays, green; accessory minerals, purple or blue; porosity, black. (E) Color SEM-CL of boxed area in D illustrating alternating damage (DZ) and cataclastic (CZ) zones. Detrital quartz, pinkish orange or light-medium blue; detrital K-feldspar, darker blue or orange-red; Clays/Fe-oxide, black; Porosity, green. Quartz cement is mostly red Qc1. (F) Box f in E, Iron-oxide (black) lined fracture cutting across band; porosity, green. (G) Box g in E, Blue Qc2 cements larger grains in damage zones (arrows). (H) Box h in E, Abrupt transition within band from tight cataclastic foliation to porous damage zone; porosity, green. (I) Color SEM-CL-EDS composite image of later microfracture adjacent to band with phosphatic iron (FeP) cemented tip. Pore is oversized probably from grain plucking during sample preparation. (J) SEM-EDS Fe, S, and P elemental map of same area as I showing pyrite and pore-filling phosphatic iron deposits in host rock near bands.
The greatest contrast in our Schmidt Hammer results is between deformation bands and adjacent host rock (Supplementary Figure S1, L9-11). Resistant deformation bands have markedly higher compressive strength values (mean 76.5 MPa, range 72.5–82 MPa, n = 10) than most rocks we tested (Supplementary Figure S1). In contrast, compressive strength values of sandstone directly adjacent to bands are the lowest measured (mean 49.5 MPa, range 39–61.5 MPa, n = 22).
SEM-CL imaging reveals bands comprise multiple millimetric zones of alternating highly comminuted cataclasis and damage (mostly intact and fractured or sutured grains), with gradual transition into undamaged host rock at band edges (Figure 7). Overall, grains within bands range from intact survivor grains (<1% by area), grains with one or a few fractures, to fragments with a wide range of mostly small sizes (>75%). Within cataclastic zones, degree of comminution varies both gradually and abruptly, and includes narrow foliated zones (0.038–0.218 mm) where particles are reduced from well-rounded c. 0.1–0.2 mm to very angular or tabular fragments averaging 0.003 mm, with ∼20% of measured particles <0.001 mm in diameter. Bands are mostly quartz and detrital K-Feldspar (K-feldspar concentrated in damage zones), with increased amounts of clays and accessory minerals versus the host rock away from bands (Figure 7D).
Interparticle porosity is present: 2.5% in cataclastic zones, 7.3% in damage zones (avg. 4.9% for entire band). In cataclastic zones microporosity is within foliations c. 0.2 mm wide where clay minerals are concentrated. Using CL colors to track strain by identifying particles belonging to single original grains (Figure 7E) suggests considerable localized flattening in the plane of cataclasis (>50%) but no obvious shear offset.
Quartz cement in bands is mostly orange-red Qc1, with minor blue Qc2 locally present on survivor grains in damage zones (Figure 7G). Quartz cement surrounds and rims broken particles but is itself unbroken suggesting precipitation after most deformation ceased. Cataclastic zones with abundant fresh surface area from grain crushing contain 36% quartz cement versus 11.9% in damage zones and 11.5% in undamaged BR host rock. K-feldspar cement is negligible in cataclastic zones (0.4%) and low in damage zones (1.9%) versus the host rock.
Increased iron-oxide deposits within and around bands (7.0% vs 0.08% in undeformed rock) overlap and postdate quartz and feldspar cements (Figures 7C, D). Later microfractures formed locally around and through deformation bands in a variety of orientations (Figure 7B). These fractures generally retain porosity and are 0.01–0.03 mm wide. Some are barren (lack mineral deposits) or contain iron-oxide cement linings (Figure 7F), while others have thin quartz cement rinds and phosphatic iron-oxide filled tips (Figure 7I). Minor deposits of pyrite, iron-rich chlorite, and pore-filling blocky phosphatic iron oxides are found in the host rock near bands (Figure 7J) suggesting introduction of hydrothermal fluids.
4.3 Opening-mode fractures
4.3.1 Fracture sets
Subparallel sets of fractures are visible as traces on bed surfaces in outcrops (Figures 2C, D, 8–10) (Table 3). Fractures have steep dips (≥80°) normal to bedding. Opening is marked by wall-normal-displacement offsets on cut grains and locally by plumose structures (Hodgson, 1961; Pollard and Aydin, 1988). Fracture walls are sharply defined and smooth with tabular to lens-shaped profiles that abruptly diminish in width near I-node tips. Fractures have small maximum aperture/length (aspect ratio of less than 0.002); i.e., they are long and thin (Figures 8, 9). Fractures are segmented in en echelon and right and left stepping arrays (Figure 8C).

Table 3. Outcrop fracture aperture and spatial results.
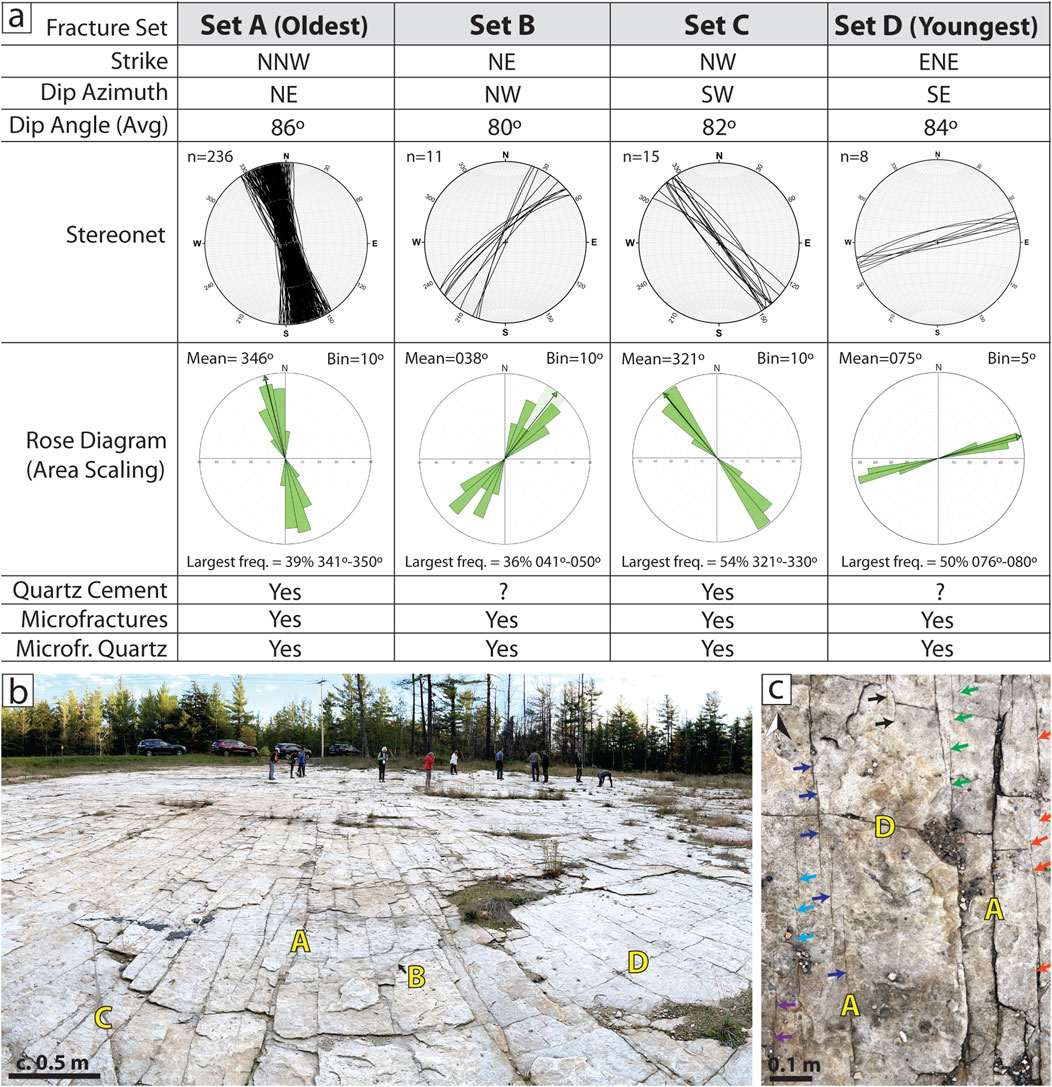
Figure 8. Attributes of subvertical fracture Sets A – D. (A) Fracture characteristics from Rt16, CBL, and BR combined. Sets A and C macro-fractures have quartz cement rinds and all sets have associated quartz-cemented microfractures. We separately describe quartz deposits and fill patterns. (B) Rt16 iPhone panorama showing Sets A – D (letters). Prominent Sets A and D fractures divide the outcrop into rectangular blocks. View south; image edges curved due to camera panorama settings. (C) Rt16 outcrop image showing overlapping right and left en echelon segments (color-coded arrows) comprising fracture traces.
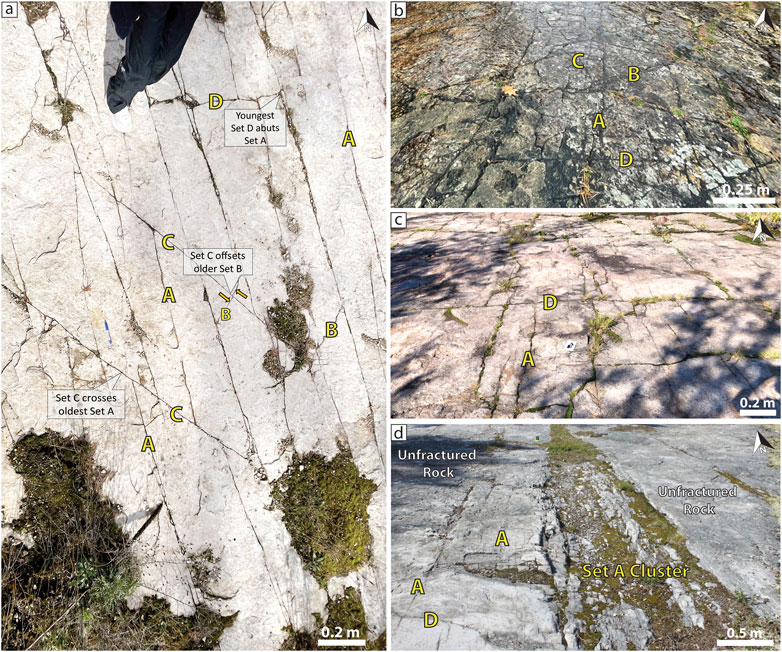
Figure 9. Outcrop fracture trace patterns showing crossing and abutting relationships. (A) Rt16 with typical trace patterns and crossing relationships of fracture Sets A – D. (B) Ausable Chasm pavement ∼35 km SE with Sets A – D in a similar pattern. (C) BR with Sets A and D in typical checkerboard pattern. Sets B and C are present but sparse and not visible in the image. (D) Fracture Sets A – D occur in comparable patterns within most RR exposures, but this area contains a dense Set A fracture cluster surrounded by mostly unfractured rock. Sets B and C are absent in this section of RR.
We subdivide fractures into Sets A through D based on narrow strike ranges (preferred orientations), cross-cutting and abutting relations, and mineral fill (Figures 8, 9). Although abutting relations are clearest at outcrop scale, crossing relations are locally evident but may not be diagnostic of timing if the relations are ambiguous (i.e., two open fractures). However, at micro-scale where cement deposits are visible, crossing relations are definitive. Relationships show sets formed A→D from oldest to youngest (Figures 8–10). Set A, prominent as dark linear features on regional 1 m LiDAR DTM and drone imagery, is the most abundant (Figures 2B, 5A, 10). Set A fracture tips dominantly taper to I- or Y nodes and these fractures are crossed or abutted by other sets. Using 30 m-elevation drone imagery at Rt16, we investigated abutting and crossing relations of Sets A and D within a ∼600 m2 area (Figures 10A, B). Regardless of individual fracture length, Set D fracture tips (n = 322) consistently terminate (abut) against Set A fractures (Figures 2D, 8B, 9, 10). Set D fractures tend to have tabular shapes owing to these abutments. Set A fractures (NNW) have ∼30° strike dispersion across the Altona area but narrower ranges within individual outcrops. Set B has the widest strike dispersion (NE; ∼40°), while Set C (NW) and D (ENE) strikes vary by only ∼10°. We designate these structures opening-mode fractures rather than joints (e.g., Williams et al., 2010a) because these fractures have two attributes—quartz deposits and contemporaneous microfracture arrays—that are not characteristic of joints. All Sets transect and thus post-date compaction textures.

Figure 10. Outcrop drone images of fracture patterns and trace lengths. (A) Rt16 30-m elevation drone image with fracture Sets A (blue) and D (pink) partially traced at this resolution. Stickplots, Sets A (Rt16-1a), C (Rt16-2), and D (Rt16-3) macroscanlines; see Table 3 for details. Red line indicates cluster of iron-stained Set A fractures. Set B is too sparse for scanline analysis. Center inset: Hand-held LiDAR and trace patterns for connectivity analysis (see Figure 20). Corner inset: stereonet of Rt16 bedding (green) and fractures. (B) Fracture length trace map of Sets A (yellow) and D (pink) within ∼600 m2. Set A fractures are more abundant, more closely spaced, and have longer trace lengths than Set D, which abut Set A. (C) BR 20-m elevation drone image. Stickplots, Scanlines 1 and 2 capture all fractures at high angle regardless of set; see Table 3 and Supplementary Data sheet 1 for details. Red lines indicate iron-oxide-stained fractures (see Figure 13G for details). Inset: stereonet of BR bedding (green) and fractures.
4.3.2 Quartz and other cements
Documenting quartz fill in outcrop fractures is challenging, particularly if traces rather than fracture faces are exposed, and definitive cement identification requires microscopy. Some of our microanalysis hand samples have edges along Set A and C macro-fracture faces showing mm-scale or thinner quartz rind deposits (Figure 11), e.g., faceted overgrowths on individual substrate quartz grains and pre-fracture quartz cement (Lander and Laubach, 2015). Fracture-fill quartz luminesces mostly blue like host rock Qc2 and contains zoning textures consistent with crystal growth into open cavities. Here rind thickness provides minimum open fracture widths. Faceted rinds are as much as 0.04 mm thick for Set A and 0.03 mm thick for Set C (Figure 11), implying minimum fracture apertures of 0.06 mm (Set C) to 0.08 mm (Set A).
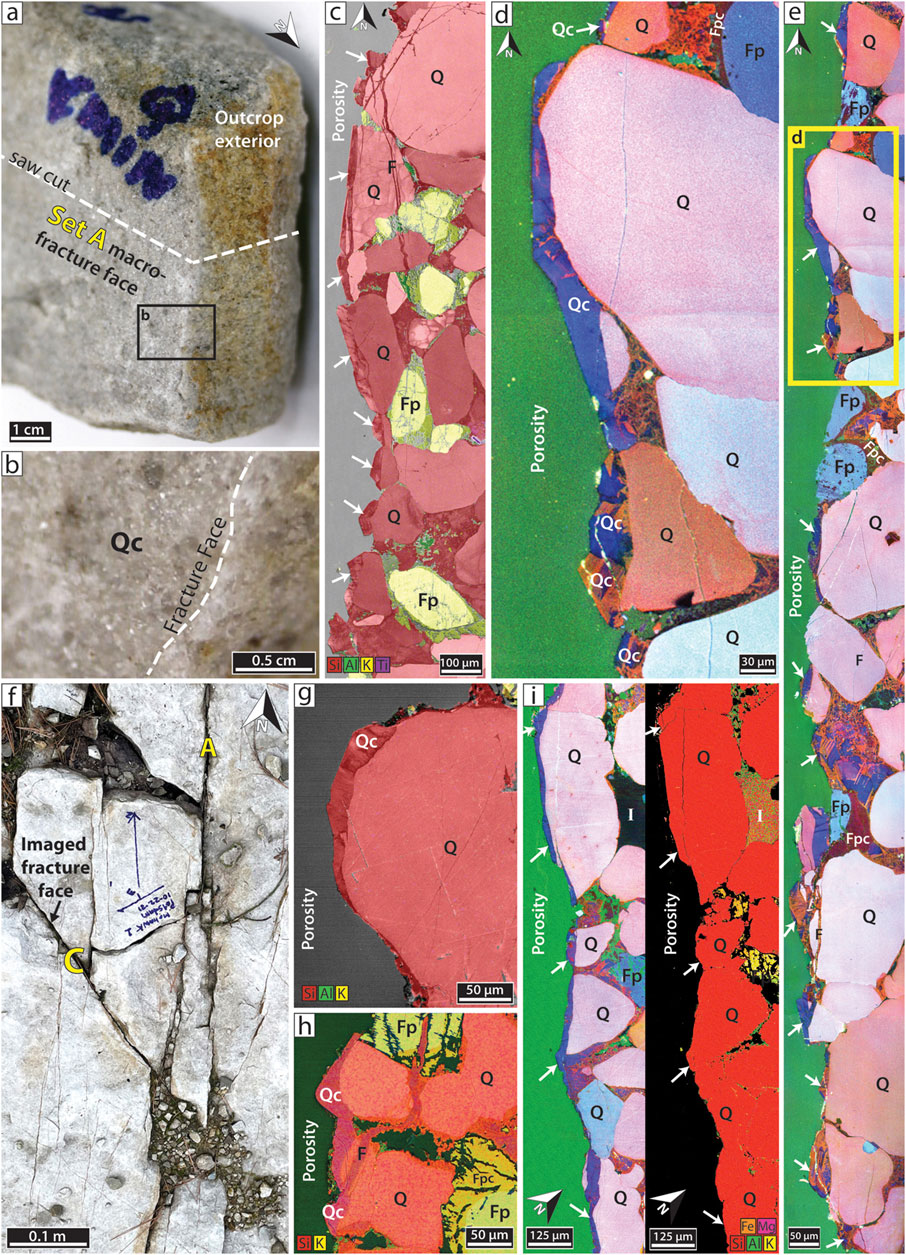
Figure 11. Macro-fracture quartz rind deposits. (A) Set A macro-fracture face with quartz cement rind, BR. Thin section cut perpendicular to fracture face. (B) DSLR macrolens image of boxed area in A; quartz cement crystals (Qc) are visible on fracture face. (C) SEM-CL-EDS composite image reveals sub-to euhedral quartz cement crystals on individual grains (arrows) parallel to cemented Set A transgranular microfracture, F. (D) Color SEM-CL image (boxed area in E) of another section of the fracture face with mostly blue-luminescing euhedral quartz cement (Qc). (E) Color SEM-CL image of fracture wall showing quartz cement (arrows) precipitating on detrital quartz grains but not detrital K-feldspar. Set A rind thickness averages 0.04 mm. (F) Rt16 hand sample R16-21-3 in situ. Bottom edge (arrow) is the north face of a Set C macro-fracture imaged in G-I. (G) SEM-CL-EDS composite image of subhedral quartz cement (Qc) on quartz grain along macro-fracture face. (H) Color SEM-CL-EDS composite image of euhedral quartz overgrowths (Qc) on Set C macro-fracture face. F, Set C quartz-filled microfracture. (I) Color SEM-CL (left) and EDS (right) images along another section of the Set C macro-fracture face showing mostly blue-luminescing quartz cement (arrows). Set C rind thickness averages 0.03 mm. Q, quartz grain; Fp, K-feldspar grain; Qc, quartz cement; Fpc, K-feldspar cement; I, illite.
Petrography also reveals quartz rind deposits ∼0.002–0.02 mm thick along narrow-aperture macroscopic Sets A and C fractures in thin section (Figure 12). Within narrow fractures or with more quartz accumulation, rind facets coalesce and may span fractures, bridging or filling them (Figure 12L). Although quantified in only two instances, Set C macro-fractures have less quartz cement than older Set A fractures. Some narrow macroscopic fractures have ambiguous internal structure. For example, Set A fractures ∼0.12–0.4 mm wide can be barren or quartz-lined but with quartz-sealed tips or they can contain quartz linings plus mixed phosphatic-iron oxide cements and clay minerals (Figures 12D–I). In another narrow Set A macro-fracture, areas of brecciated quartz could mark localized shear after the fracture formed, but the lack of other shear indicators like wing cracks suggests that in these outcrops post-fracture shearing is minor. Set C narrow macro-fractures contain quartz cement rinds and bridges, as well as later deposits of likely-hydrothermal phosphatic-iron oxide cement like Set A (Figure 12J-p). Quartz crystals are euhedral and therefore precipitated into open fractures at depth. For Sets B and D fractures, some surfaces are barren or have iron oxide coating (Figure 13). Quartz-filled microfractures parallel to Sets B and D suggest that lack of quartz in larger fractures could be due to local vehicle use, sample damage, or fracture weathering.
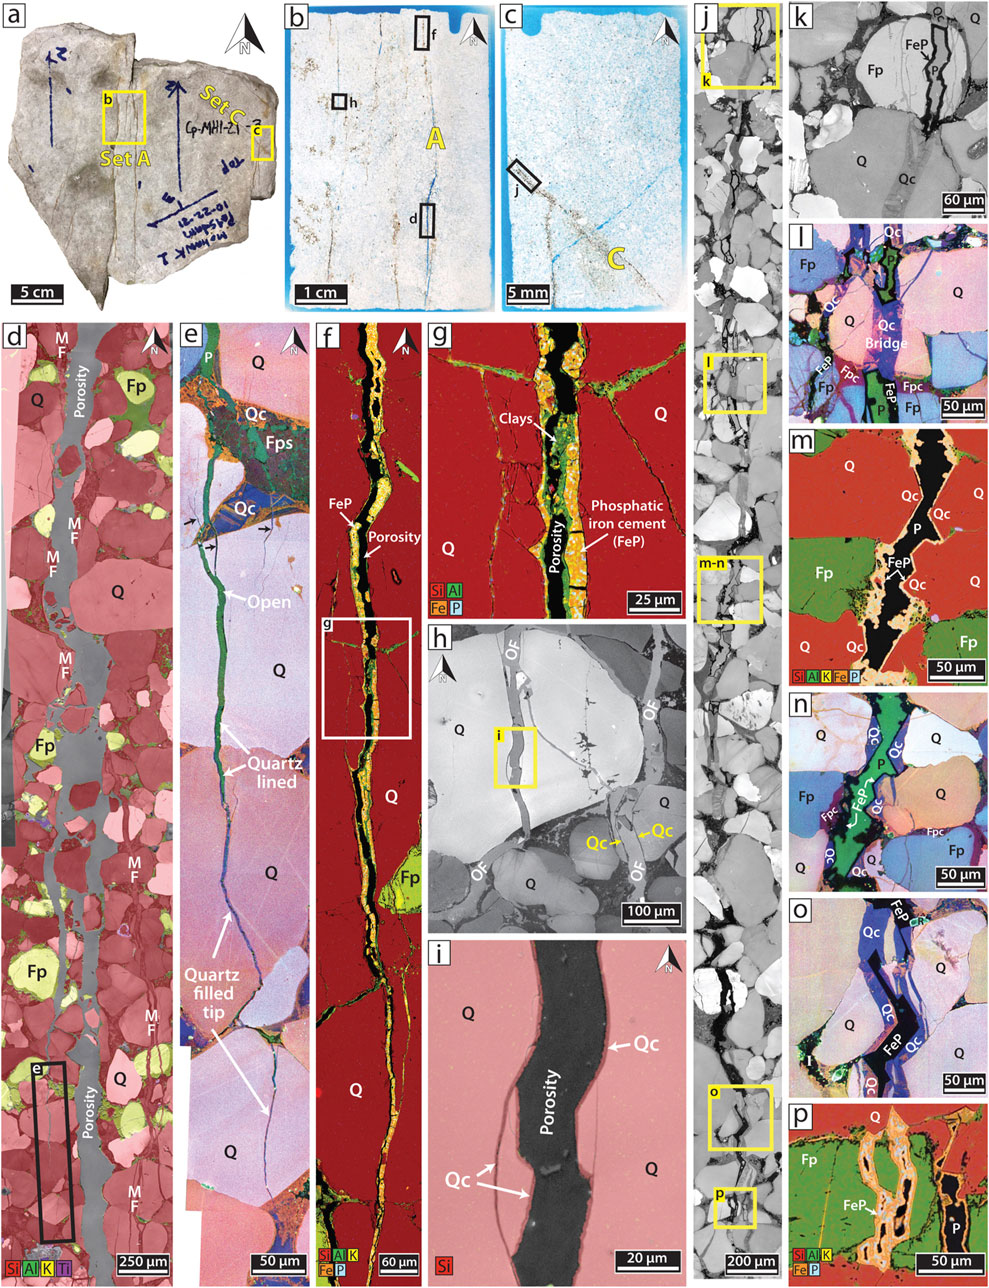
Figure 12. Narrow-aperture macro-fracture cements. (A) Rt16 hand sample R16-21-3 with visible Sets A and C macro-fractures. (B) DSLR macrolens image of large thin section (50 × 76 mm) capturing Set A fractures, box b in A. (C) DSLR macrolens image of thin section (27 × 46 mm) capturing Set C fractures, box c in A. (D) SEM-CL-EDS composite image of 0.2 mm wide porous Set A macro-fracture with some possible minor breccia fill, box d in B. The macro-fracture cuts across (potentially reactivates) an older sealed Set A microfracture (MF). (E) Color SEM-CL image showing Set A macro-fracture transitioning from barren to quartz lined to fully cemented at fracture tip, box e in D. Black arrows, other quartz-filled fracture tips in overlapping patterns. Porosity, green. (F) SEM-EDS image of narrow-aperture Set A macro-fracture with porosity (black), clay minerals (green), and likely-hydrothermal phosphatic iron cement (FeP; orange-blue), box f in B. These minerals occur along a section of the mostly barren fracture seen in D illustrating their sporadicity. (G) SEM-EDS closeup showing details of clays (green) and phosphatic-iron cement (orange/light blue), box g in F. (H) SEM-CL image of two open Set A macro-fractures (OF) with darker quartz cement linings (arrows), box h in B. (I) SEM-CL-EDS composite image detailing thin quartz cement lining on fracture walls, box i in H. (J) SEM-CL image of 0.1 mm wide porous Set C macro-fracture with euhedral quartz cement rind, quartz bridges, and FeP cement, box j in C. (K) SEM-CL image shows FeP lining on feldspar substrate preserves fracture porosity (P), while adjacent fracture porosity is completely occluded by quartz cement (Qc), box k in J. (L) Color SEM-CL image of fracture-spanning quartz cement bridges nucleating on favorably oriented crystallographic substrates, box l in J. (M) SEM-EDS image and (N) Color SEM-CL image (box m,n in J) illustrating blue-luminescing euhedral quartz crystals, followed by later FeP cement. (O) Color SEM-CL image of completely occluded fracture porosity, box o in J. (P) SEM-EDS closeup of FeP cement; texture appears hydrothermal, box p in J. Q, quartz grain; Fp, K-feldspar grain; Qc, quartz cement; Fpc; K-feldspar cement; FeP, phosphatic iron cement; C, clay; R, rutile; P, porosity.
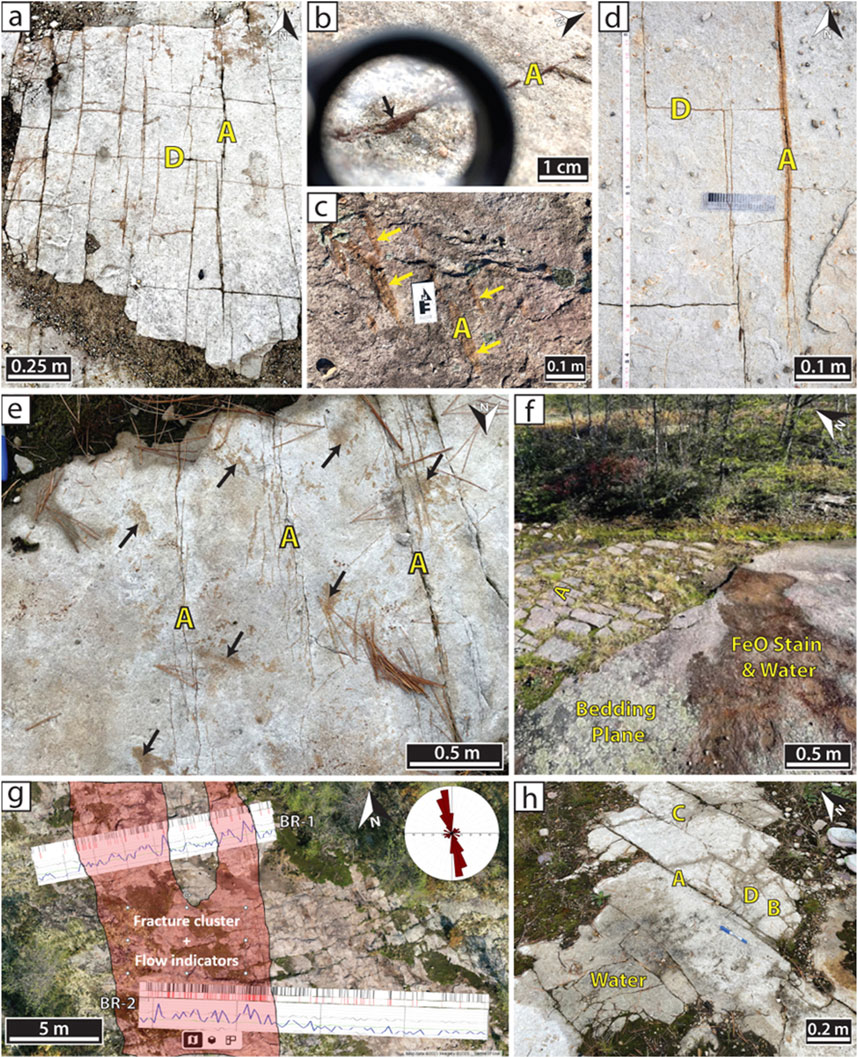
Figure 13. Evidence of contemporaneous fluid flow (water) and paleoflow (iron-oxide stains) along fractures and bedding planes. (A) Iron stains localized along fracture walls are commonly limited to parts of individual traces, Sets A and D, Rt16. (B) Iron-oxide cement in fracture with positive relief seen through a 10x hand lens, Set A, CBL. (C) Stains may extend 10–20 mm on either side of fracture, Set A, BR. (D) Iron-oxide stains occur along fractures having a range of apertures, Sets A and D, Rt16. (E) Set A fractures with an array of iron-stained en echelon fracture tips. Small patchy stains occur within host rock near fractures (arrows), Rt16. (F) Unfractured bedding plane with iron-oxide stain on bedding interface and modern groundwater seeps over stained rock, BR. (G) 20-m elevation drone image, BR (see Figure 10C for details). Red overlay: Extrapolation of paleoflow based on clustered iron-stained fractures (see Supplementary Figures S2-S6 for more details). Inset: stereonet of BR iron-stained fracture strikes comprised mostly of Set A. (H) c. 2 m2 area where fractures are conduits for active, if minor, groundwater seepage, Sets A – D, Rt16.
Sparse, localized red-orange iron oxide stains are present along some or parts of fractures having a range of apertures from all sets, likely marking late fluid flow (Figure 13). Stains primarily coat fracture walls and are commonly limited to parts of individual traces (typically ≤ 1 m along strike) (Figure 13A). Stains generally extend out a few mm, locally up to 2 cm, from fracture walls (Figures 13C, D). Some stained areas have positive relief (Figure 13B). Stains are rare within host rock away from fractures, typically occurring in small patches (Figure 13E) or along bed interfaces (Figure 13F). Fe-oxide stains are located where fracture spacing is close (Figure 13G). Also present at Rt16 is one c. 2 m2 area where several fractures from all four sets are conduits for active, if minor, groundwater seepage (Figure 13H). See Supplemental Material for a survey of stain occurrence along fracture scanlines from Rt16 and BR.
4.3.3 Microfractures
Thin sections contain quartz-filled microfractures from Sets A–D (Figure 14). Most microfractures are only visible using SEM-CL but a few longer and wider microfractures are also visible under transmitted light as steeply dipping fluid inclusion planes (Anders et al., 2014). Microfractures are categorized based on crosscutting relations with grain boundaries and orientation patterns (classification: Laubach, 1997). Categories are inherited, marked by quartz filled microveins truncated at grain margins; radial, marked by grain-scale localization and generally triangular shapes (likely the result of compaction or shear); and transgranular, marked by shapes and orientations that resemble those of much larger ‘regional’ macro-fractures. Fluid inclusion planes that lack CL signature are likely inherited from grain source areas.
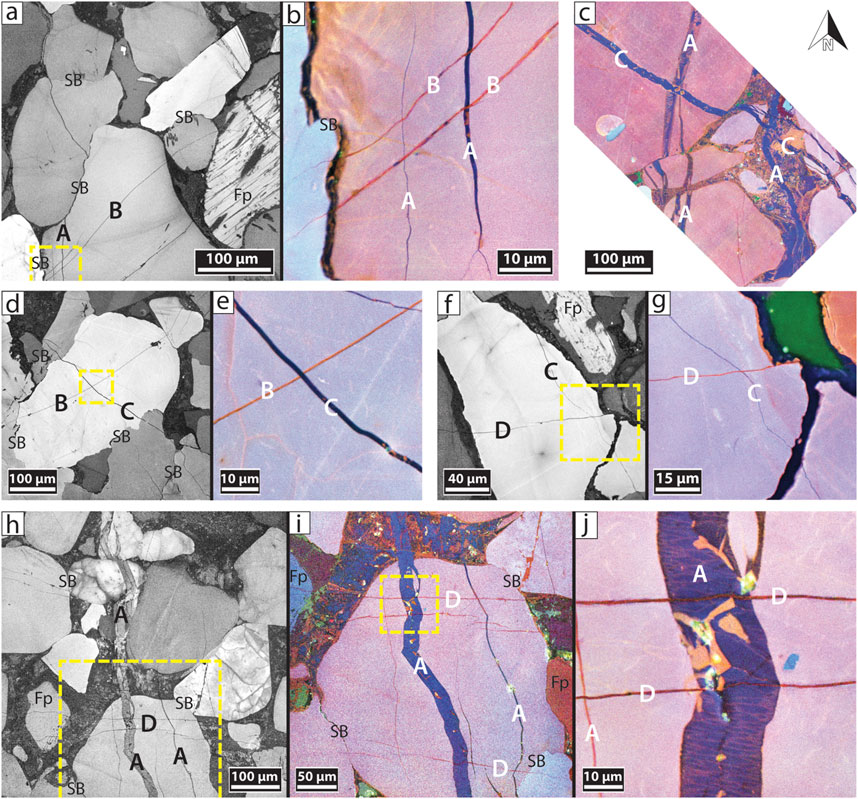
Figure 14. Microfracture crosscutting relationships parallel those of associated macro-fractures. All images are plan view, oriented north-up. All grains are quartz unless labeled Fp (K-Feldspar). SB, sutured boundaries between detrital grains from mixed compaction and pressure solution during burial. (A) SEM-CL overview of Sets A and B transgranular microfractures, Rt16. (B) Color SEM-CL of Set B microfractures crossing older Set A microfractures, boxed area in A. (C) Color SEM-CL of Set C transgranular microfracture crossing multiple older Set A transgranular microfractures, Rt16. Note normal grain offset by microfractures. (D) SEM-CL overview of Sets B and C transgranular microfractures, RR. (E) Color SEM-CL of Set C microfracture crossing older Set B microfracture, boxed area in D. (F) SEM-CL overview of Sets C and D transgranular microfractures, BR. (G) Color SEM-CL of Set D microfracture crossing older Set C microfracture, boxed area in F. (H) SEM-CL overview of Sets A and D transgranular microfractures, Rt16. (I) Color SEM-CL highlighting common aperture size disparity between Sets A and D, boxed area in H. (J) Color SEM-CL of Set D microfractures crossing much wider Set A microfracture, boxed area in I.
In thin section we focus on transgranular microfractures that transect two or more grains and intervening cement, thus postdating compaction and at least part of quartz cement accumulation. Some transgranular fractures crosscut inherited or compaction-related quartz filled fractures. Sets of transgranular microfractures have steep dips and share the same strikes and crosscutting relations as macro-fractures Sets A–D (Figures 9, 14). We interpret them to be the small size fraction of Sets A–D. Like macro-fracture cement, microfracture quartz luminesces mostly blue and contains zoning textures consistent with crystal growth into open cavities (Figure 15). Microfractures have closely spaced en echelon tips and locally contain K-feldspar cement where they pass through a feldspar substrate (Figure 15).
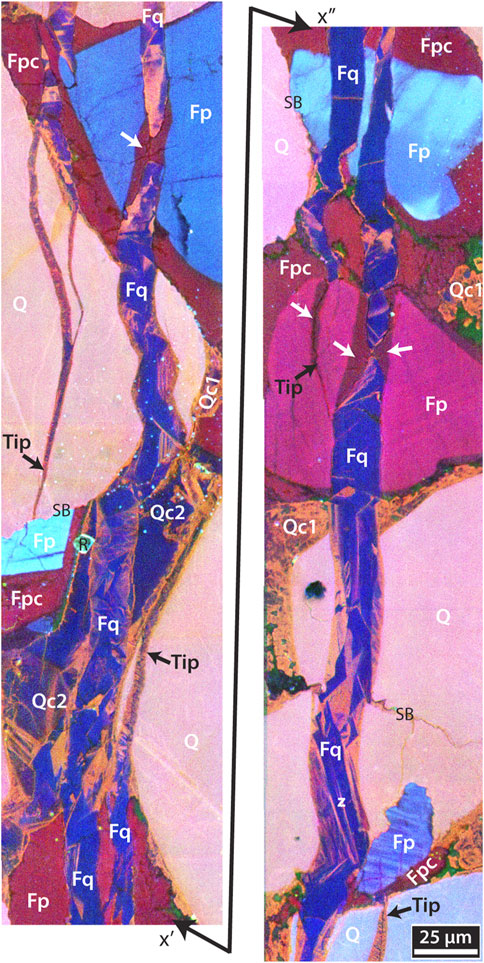
Figure 15. Microfracture cements. Color SEM-CL image of ∼0.02 mm wide, transgranular, quartz cemented Set A microfracture, Rt 16. x′-x″ marks image continuation. Fracture-fill quartz (Fq) luminesces mostly blue like host rock Qc2; microfractures from all Sets have similarly uniform CL response. Textures are mainly CL zones consistent with crystal growth into open cavities (z). Locally, fractures contain K-feldspar cement where they pass through a feldspar substrate (white arrows). Fractures cut through pore-filling quartz (Qc1, Qc2) and feldspar (Fpc) cements. Individual microfracture traces are composed of multiple en echelon segments with overlapping tips (black arrows). Q, quartz grain; Fp, K-feldspar grain; Qc1-2, quartz cement; Fpc; K-feldspar cement; r, rutile; green, porosity. SB, sutured boundaries between detrital grains from mixed compaction and pressure solution during burial.
In long thin section transects, transgranular microfractures vary in abundance from absent to 5.9/mm (Set A, Rt16) (Table 4). Microfractures also occur in Potsdam sandstone at High Falls, 35 km west of the Flat Rocks area (Figure 1). Here, an SEM-CL image mosaic from a matrix-rich, quartz cement-poor Potsdam sandstone has sparse, small microfractures but records two near orthogonal strike sets (Supplementary Material).
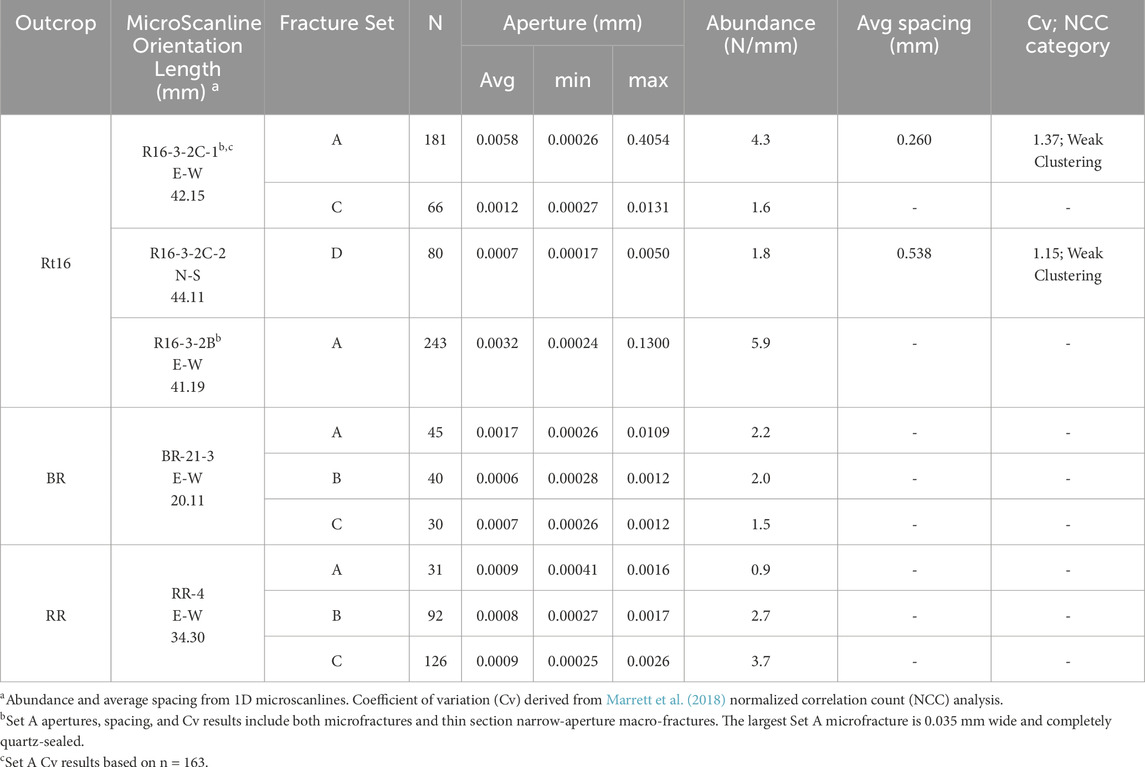
Table 4. Thin section-scale fracture aperture and spatial results.
4.3.4 Fracture size
4.3.4.1 Height and length
Sets A and D have broad size ranges that include tall and long examples but also microfractures. Heights are not well exposed in nearly flat lying bedding pavements. Sparse vertical exposures at CBL and BR have a range of heights censored by outcrop size. At Ausable Chasm, where exposures are c. 30 m, the heights of some individual traces penetrate nearly the entire exposure (Figure 16). For Set A the tallest fully exposed fractures terminate at interbeds (typically siltstones or fine sandstones) or unit boundaries, but most fractures do not end at the same stratigraphic position likely owing to insufficient mechanical contrasts to halt fracture growth at sand-on-sand contacts. A range of shorter heights (meter scale) are present. For Sets A and D, fractured layer thickness ranges from 1 to >5 m, although if the pattern is top-bounded as at Ausable Chasm, these are underestimates of maximum height due to censoring (Figures 16A, B). Top-bounded height patterns typify microfractures and are common in core fracture patterns (e.g., Laubach et al., 2009, their Figure 1).
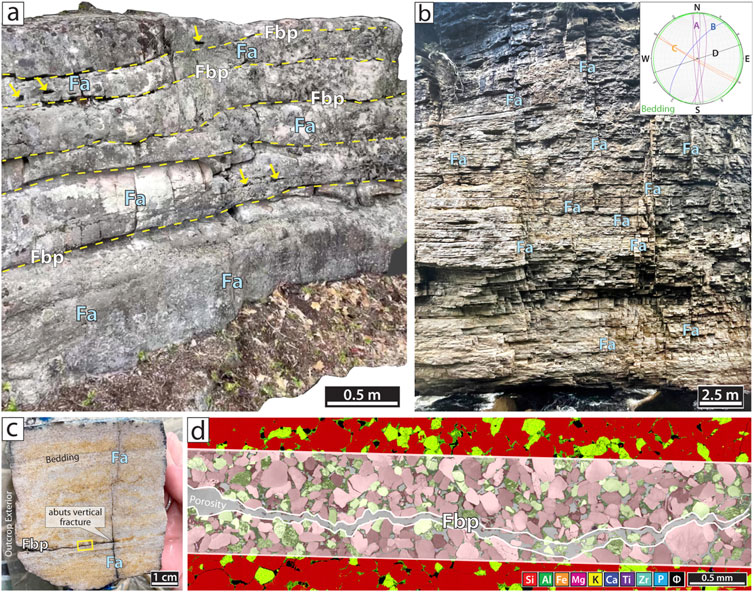
Figure 16. Vertical exposures showing fracture heights and bed-parallel fractures. (A) iPhone LiDAR image of a few meters of vertical exposure, CBL. View NE. Dashed lines, bed trace; Fa, Set A fracture; Fbp, bed-parallel joint; Arrows, vugs. (B) c. 25 m vertical exposure at Ausable Chasm showing mostly Set A (Fa) heights. View south. Inset: stereonet of bedding and fracture Sets A – D measured on nearby bed-parallel pavements. (C) Rt16 hand sample cut normal to bedding showing bed-parallel fracture (Fbp) abutting vertical Set A fracture (Fa). (D) SEM-EDS of boxed area in C. SEM-CL overlay shows no quartz cement within bed-parallel fracture indicating near-surface formation.
In plan view, fractures have lengths comprised of shorter, linked, or echelon segments (Figures 8C, 15). Sets B and C range from sparse to absent across outcrops, and where present typically have short trace lengths (c. 0.2 m and c. 0.2–2.5 m, respectively), so lengths were only analyzed for the more ubiquitous Sets A and D fractures. Over 3,400 Set A and D fracture lengths were measured at various scales on 30-m elevation drone images, 1-m elevation LiDAR images, 1D outcrop scanlines, and microscanlines on large 50 × 76 mm thin sections (Figure 17). Set A has the widest variety of lengths ranging from lineaments >300 m visible on regional texture shaded 1 m LiDAR DTM (Figure 5) to traces <0.01 mm visible on SEM-CL images. Maximum Set A traces are nearly 3× greater than maximum Set D traces. Average length values for Set A more than double on drone images compared to 1D outcrop scanlines (Figures 17A, B), whereas Set D lengths nearly double from outcrop to drone scale (Figures 17C, D).
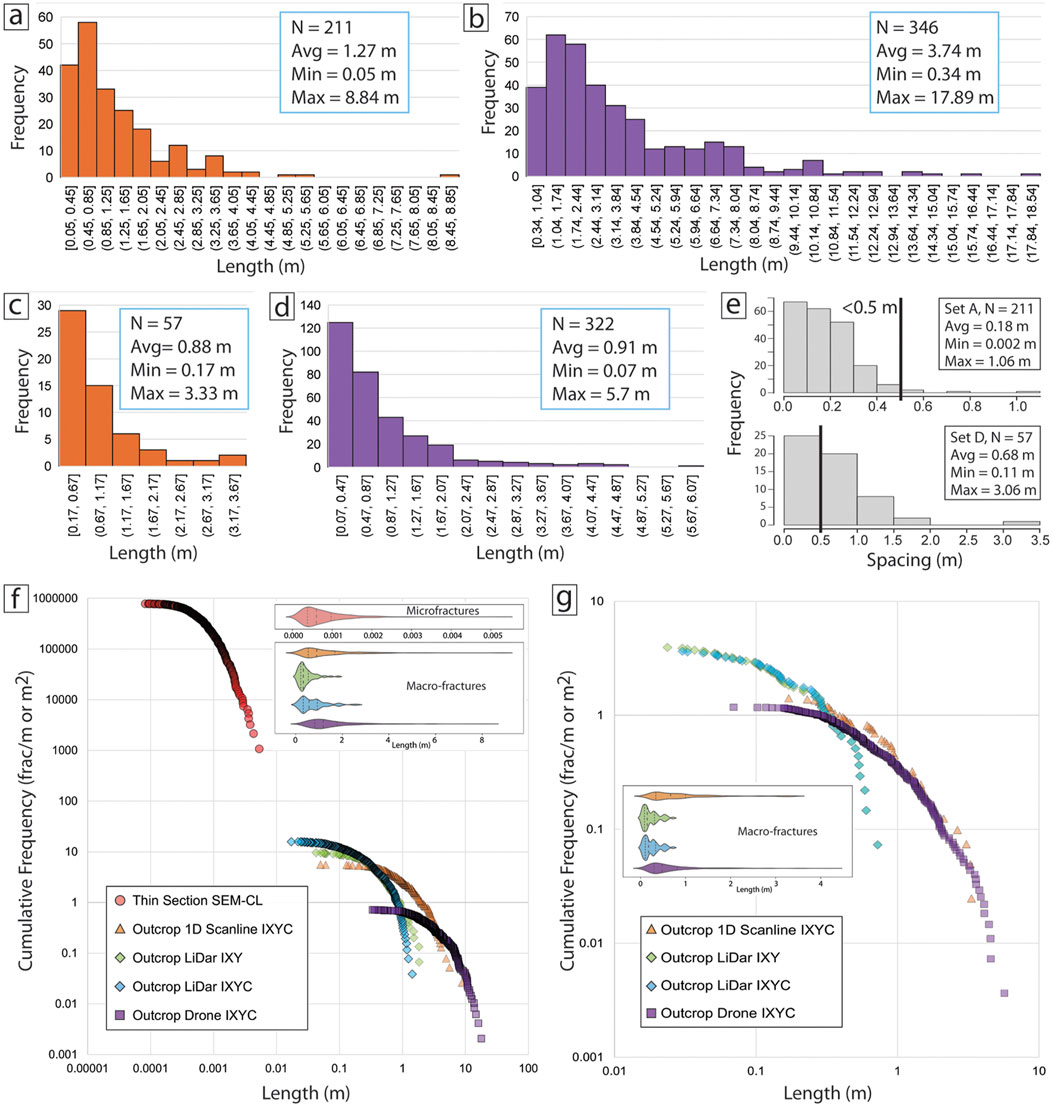
Figure 17. Sets A and D fracture spacing and length distributions measured at various scales. (A) Set A lengths from 1D outcrop scanline, Rt16 (see Figure 10A for details). (B) Set A lengths from 30-m drone image, Rt16 (see Figure 10B for details). (C) Set D lengths from 1D outcrop scanline, Rt16 (see Figure 10A for details). (D) Set D lengths from 30-m drone image, Rt16 (see Figure 10B for details). (E) Sets A and D fracture spacing frequencies from 1D scanlines (see Figure 10A for details). Solid vertical lines mark spacing of 0.5 m. (F, G) Set A (F) and Set D (G) fracture trace length cumulative frequencies over four and three scales of observation, respectively. Both are best fit by negative exponential functions. Insets: corresponding violin plots showing data density distribution, mean (long dash), and inner quartile (short dash). Violin area is proportional to the number of datapoints and are not normalized.
Combining measurements at all resolution scales with systematic measurements, Set A lengths range from 0.0085 mm to 17.9 m, spanning five orders of magnitude, and more if traces from DTM are included. At drone-scale, some long Set A traces extend beyond outcrop limits, precluding measurement of maximum length. Set D commonly has short lengths dictated by fracture tip abutments against Set A. Set D lengths range from 0.369 mm to 5.7 m, spanning just over two orders of magnitude.
Length distributions are best fit by negative exponential (Figure 17F) or lognormal distributions, but some can be fit by power law distributions (purple curve, Figure 17G). Like the cumulative frequency plots, violin plots show more short fractures relative to longer fractures (Figures 17F, G insets). The width of each violin plot represents the fracture trace length density. Although not normalized, these plots allow a visual comparison of fracture length variability across different scales of observation. Violin plots show both Sets A and D produce multimodal length distributions at the LiDAR scale, but more unimodal length distributions at the drone, scanline and thin section scales.
4.3.4.2 Kinematic aperture size, predictive spacing, and emergent threshold
Fracture kinematic apertures, or opening displacements irrespective of fill, have a wide range skewed toward narrow fractures. The widest fractures are >1 mm. Microfracture opening displacements from all sets are small (Table 4). Set A macro-fractures along a Rt16 scanline 13.48 m long, n = 78, have mean aperture of 0.43 mm and maximum aperture of 1.75 mm. Another CBL Set A scanline 5.6 m long, n = 52, has mean aperture of 0.23 mm and maximum of 0.75 mm. Set A narrow-aperture macro-fractures in thin section and outcrop macro-fractures overlap in size, ranging from 0.05–1.75 mm, and can have porosity. Set A microfractures range from 0.00024–0.035 mm (Figure 18A) and are completely quartz cemented. Set B microfractures from BR and RR have a limited aperture-size range from 0.0002–0.0017 mm (Figure 18C), spanning less than an order of magnitude. Both populations are completely cemented and dominated by tiny 1-micron-scale widths. Rt16 Set C macro-fractures along a 41.60 m long scanline, n = 24, have a mean aperture of 0.44 mm and maximum of 1.15 mm (Table 3). Set C macro-fractures range from 0.175–1.15 mm and can have porosity. Set C microfractures range from 0.00025–0.0131 mm (Figure 18B) and are completely quartz cemented. Set D microfracture apertures range from 0.00017–0.0050 mm (Figure 18D), spanning approximately 1.5 orders of magnitude and are completely sealed.
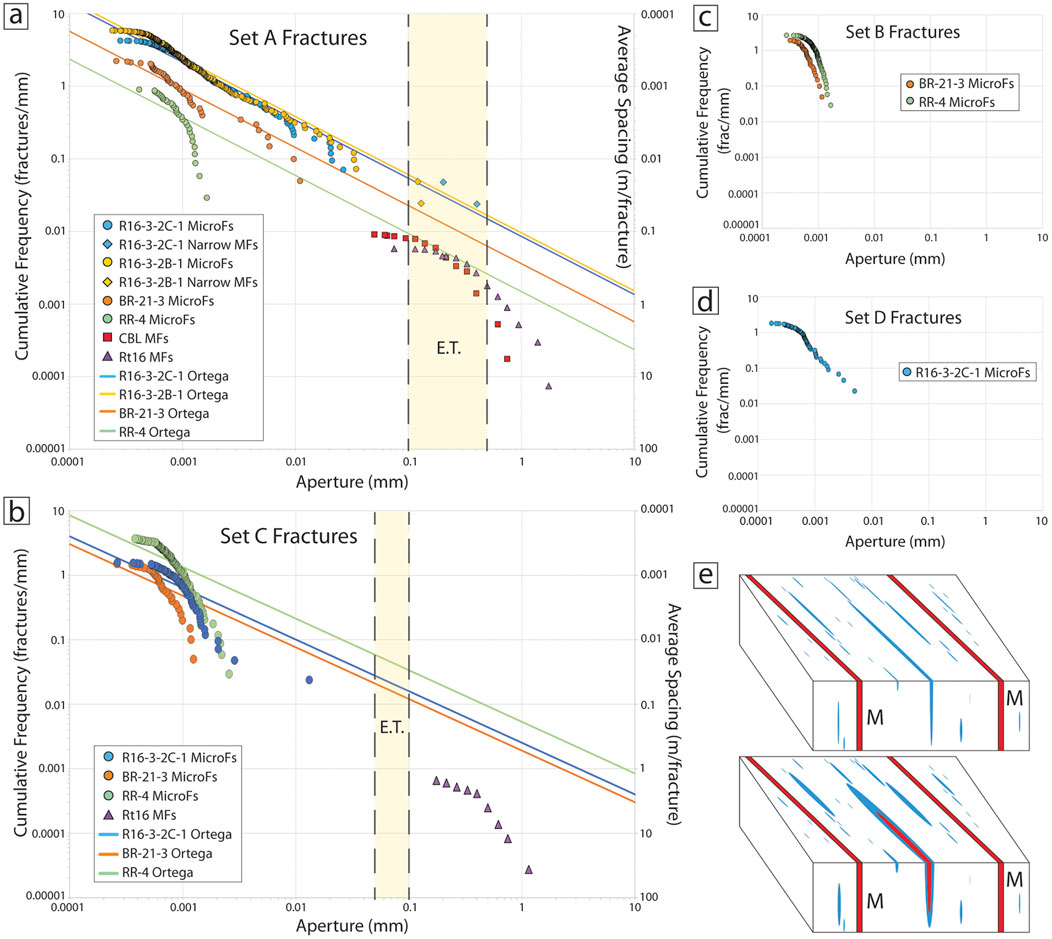
Figure 18. Sets A – D cumulative frequency versus kinematic aperture. (A) Set A microfractures (MicroFs) from Rt16, BR, and RR, narrow-aperture macro-fractures in thin section (narrow MFs) from Rt16, and outcrop macro-fractures (MFs) from Rt16, CBL. The interpreted emergent threshold (E.T.) for Set A is 0.1–0.5 mm. Ortega-constant power law extrapolation lines with slope −0.8 are added to predict average spacing of macro-fractures (Ortega et al., 2006). (B) Set C microfractures (MicroFs) from Rt16, BR, and RR and outcrop macro-fractures (MFs) from Rt16. The interpreted emergent threshold (E.T.) for Set C is 0.05–0.1 mm. Ortega-constant power law extrapolation lines with slope −0.8 are added to predict average spacing of macro-fractures (Ortega et al., 2006). (C) Set B microfractures from BR and RR have limited aperture-size ranges spanning less than an order of magnitude. (D) Set D microfracture apertures from Rt16 span just 1.5 orders of magnitude with a limited power law from ∼0.01–0.001 mm and a lognormal distribution below that. (E) Schematic of possible microfracture-macro-fractures relations given observed parallel strike (Figures 9, 12). M, macro-fracture. Microfractures contain abundant quartz cement (blue) and size-dependent porosity (red). Macro-fractures are mostly porous, containing only thin cement linings, omitted for clarity. Top: Macro-fractures are larger than the largest microfractures present. Bottom: Macro-fractures are the same size or smaller than the largest microfractures present.
Aperture size distributions show systematic patterns of cumulative frequency versus aperture size (Figure 18). Cumulative frequency is size rank (1 for the largest, 2 for the second largest, and so-on) divided by scanline length. Each fracture population was best-fit with power law, exponential, normal, and lognormal equations, and relative quality of fit of each equation was evaluated using the chi-squared error (e.g., Hooker et al., 2014):
where Oi is the observed frequency of each size and Ei is the modeled (best-fit) frequency. The fit producing the lowest error is the closest fit to the data. All ten aperture size distributions are best fit by power law or lognormal distributions (Supplementary Table S1). Of the four power laws, three comprise Set A populations with microfracture apertures spanning 2-3 orders of magnitude. The best-fit power laws have slopes of −0.87 to −0.99 (Figure 18A). The Set A lognormal population from RR has the fewest total fractures (n = 31) and smallest maximum fracture size (0.002 mm). Conversely, the Set C population from Rt16 having a single widest fracture (0.013 mm) about 4.6 times as large as its second widest fracture is the only non-Set-A population best-fit by a power law (Figure 18B; R16-3-2C-1). The remaining populations: two from Set B, two from Set C, and one from Set D are best fit by lognormal distributions. Both Set Bs and the two lognormal Set C populations have limited aperture sizes spanning less than an order of magnitude, with similar minimum sizes to that of Set A microfractures, but a smaller maximum size (≤0.003 mm) (Figures 18B, C). The single Set D population qualitatively resembles that of the lone Set C population best-fit by a power law (Figures 18B, D). These Set C and D populations are from Rt16. While the Rt16 Set C microfractures feature the outlying large maximum fracture size, the Set D size distribution has a concave-downward (lognormal) trend among the smallest fractures but a limited power law with steep slope from ∼0.01–0.001 mm (Figure 18D). No data points were removed for this analysis. We address the potential for sampling biases in the Discussion.
For each Set A and Set C data set, Ortega-constant power law extrapolation lines with slope −0.8 were added to predict average spacing (the inverse of cumulative frequency; secondary y-axis) of macro-fractures (Ortega et al., 2006). Obtaining the normalized intensity or average spacing for a given fracture-size threshold involves using the power law distribution and reading the corresponding frequency, or number of fractures per unit length of scanline, for a given fracture size, and an average spacing estimate using inverse frequency values (i.e., average spacing) for that size fracture and larger. Even where microfractures are best fit by power laws, they tend to overpredict macro-fracture frequency.
These kinematic aperture measurements do not account for mineral deposits in the fractures. The degree of mineral fill varies with fracture width and with fracture set. Microfractures are filled, but wider fractures may be partly open. The characteristic aperture size range at which fractures transition from filled to partly open is called the emergent threshold (Laubach et al., 2000; Laubach et al., 2003) and must be separately determined for each set. Based on observations of quartz cement deposits, the emergent thresholds for Sets A and C are 0.1–0.5 mm and 0.05–0.1 mm, respectively (Figures 18A, B).
4.3.5 Fracture spatial arrangement
4.3.5.1 Spacing
Sets A and D are closely spaced and abundant in all outcrops, subdividing outcrops into rectangular blocks (Figures 2D, 8B, 9, 13). Sets B and C are sparse and may be absent (Figure 9). Average fracture spacing from 1D outcrop scanlines is 0.18 m for Set A and 0.68 m for Set D (Figure 17E; Table 3), both of which are close relative to fracture height (Figures 10, 16). Mean spacings from 1D microscanlines for Sets A and D transgranular microfractures are 0.26 mm (n = 163) and 0.54 mm (n = 80), respectively (Table 4).
Rt16 outcrops are long and continuous enough to allow 1D spatial analysis using Normalized Correlation Count (NCC) (Marrett et al., 2018). Data sets are shown on both linearly graduated length scale NCC plots, which are best for identifying and quantifying regularly spaced fractures, and NCC logarithmic plots which best reveal clustering behavior (Figure 19). The spacing coefficient of variation (Cv, standard deviation divided by mean) is 0.77–0.9 for Set A and 0.76 for Set D (Table 3). Cv for both sets is lower than the 99% confidence interval defined for random arrangements by Hooker et al. (2023b) and are therefore compatible with anticlustering (either regular or periodic arrangement). Set A macro-fractures NCC patterns are primarily anticlustered with an anticlustering signal that diminishes at longer length scales caused by slight variations in spacing values (Figures 19B, D, F). Thus, across length scales, patterns are regularly spaced (anticlustered) at short distances (<10 cm) and randomly arranged at longer distances (>10 cm). Set D macro-fractures show a similar behavior to Set A, i.e., at small length scales anticlustering is evident, but the pattern becomes indistinguishable from random with increasing length scales (Figures 19I–K).
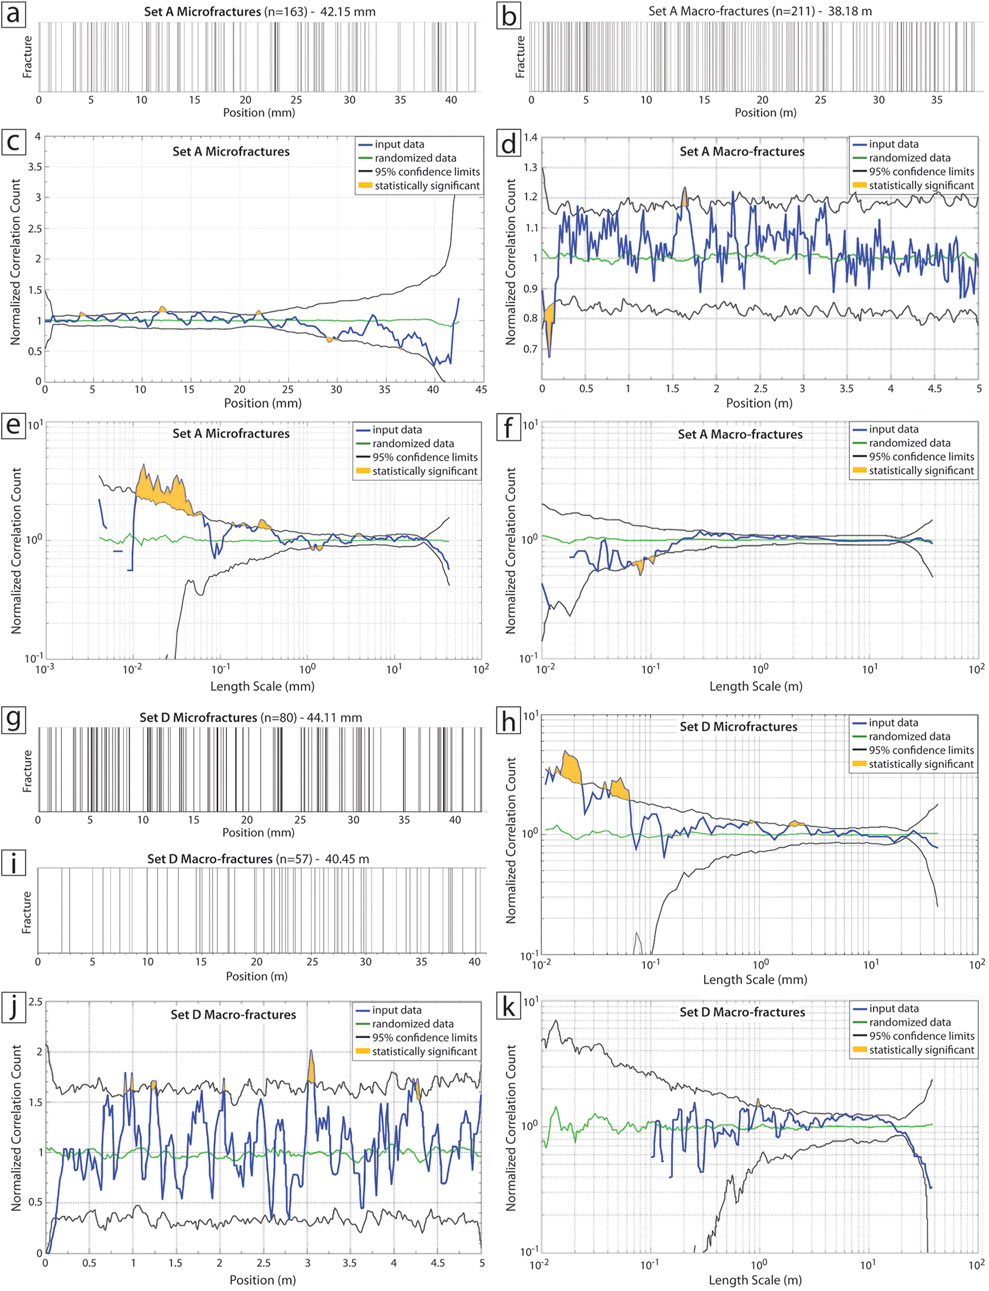
Figure 19. Sets A and D fracture spatial analysis using CorrCount (Marrett et al., 2018), Rt16. (A–F) Set A fractures. (A) Stickplot of microfracture microscanline spacing positions (n = 163, 42.15 mm). (B) Stickplot of macro-fracture scanline spacing positions (n = 211, 38.18 m). (C) Microfracture NCC linear plot. Spacing Cv is 1.37 indicating weak clustering. Highlighted areas mark parts of curve exceeding 95% confidence interval. (D) Macro-fracture NCC linear plot. Spacing Cv is 0.77 indicating random to anticlustering behavior. (E) Microfracture NCC log plot showing weak clustering. (F) Macro-fracture NCC log plot shows anticlustering behavior at small distances (<10 cm) with a random arrangement at long distances (>10 cm). (G–K) Set D fractures. (G) Stickplot of microfracture microscanline spacing positions (n = 80, 44.11 mm). (H) Microfracture NCC log plot. Spacing Cv is 1.15 indicating weak clustering. (I) Stickplot of macro-fracture scanline spacing positions (n = 57, 40.45 m). (J) Macro-fracture NCC linear plot. Spacing Cv is 0.76 suggesting anticlustering behavior, especially at scales <10 cm. (K) Macro-fracture NCC log plot shows random spacings at long length scales with anticlustering at smaller scales.
Microfracture Cv is markedly higher (Set A = 1.37, Set D = 1.15) than for macro-fractures (Table 4), agreeing with 1D NCC analysis showing arrangements statistically more clustered than random, albeit weakly (Figures 19A, C, E, G, H) (Marrett et al., 2018; Hooker et al., 2023b). Set A microfractures show multiple statistically significant clusters with identifiable principal cluster widths and spacing (Figures 19C,E). At smaller length scales, minimum cluster width is 0.08 mm with cluster spacing of 0.3 mm, while at larger scales, minimum cluster width is 0.5 mm and cluster spacing is 4 mm. Unlike Set A, Set D microfracture NCC analysis shows only one statistically significant fracture cluster with a minimum cluster width of 0.07 mm (Figure 19H). For both Set A and D microfractures, NCC analysis shows spacings between 0.01–0.05 mm are systematically more abundant than in a random arrangement for the observed scanline lengths and number of features.
The pattern of generally pervasive, apparently relatively evenly spaced Set A and D fractures is broken at one RR locality. Here, Set A fractures occur in a tight cluster (swarm or corridor) within a largely unfractured bed (Figure 9D) that is slightly higher stratigraphically than the main bed at nearby BR. Spacing within the cluster is < 0.15 m. The cluster is > 1.5 m wide and at least 10 m long, with the actual length limited by outcrop extent. The cluster is not associated with a visible fold or fault and the orientation is oblique to the older monoclines.
Considering Set A alone, a two-dimensional analysis using a version of correlation count that accounts for fracture location and length (NCC 2D) shows that trace center points (barycenters) are mostly distributed in a pattern indistinguishable from random (Corrêa et al., 2022; see Supplementary Figure S2). 2D analysis weighted for size and strike dispersion shows heterogeneity for long fractures distant from each other (>9 m) and although mostly parallel, spatial strike variability of a few degrees mostly at selected distances (<1 m, 2.5 m, 8 m).
4.3.5.2 Connectivity
Trace maps of prominent Set A and D fractures show differences in trace connectivity, length distributions, and frequencies depending on how nodes are defined. We mapped traces on a handheld LiDAR image from Rt16 (Figure 20; see Figure 10A) with and without special nodes that identify where narrow-width fracture connections may exist (contingent or C nodes; Forstner and Laubach, 2022). Scale-dependent, rule-based C-nodes identify diagenesis-sensitive connections by denoting areas where fracture tip offset distance is equal to or less than a specified value. C-nodes are placed at the centroid of the offset and overlap and denote a continuation of fracture trace. C-nodes for Set A required ≤1 cm segment offset and for Set D ≤3 cm offset because outcrop and petrographic observations indicate such distances are commonly linked by microfractures at the hand-lens to SEM-CL scale.
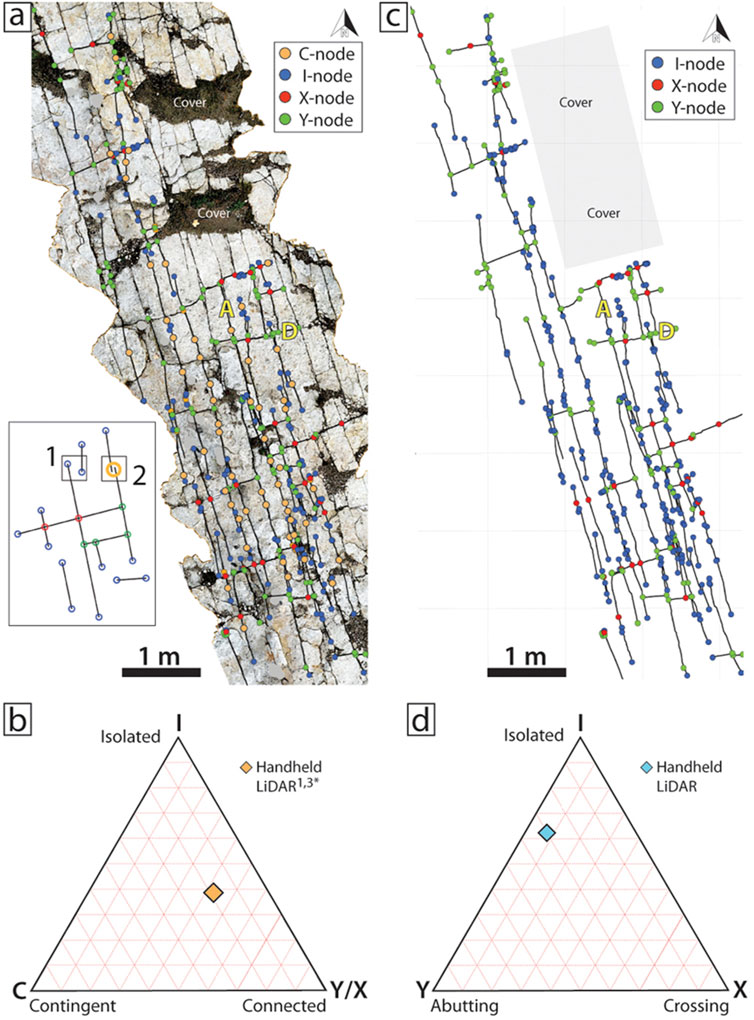
Figure 20. Sets A and D outcrop fracture connectivity, Rt16. (A) Connectivity trace map from handheld LiDAR image (see Figure 10A inset) using IXYC nodes after Forstner and Laubach (2022). Contingency rules were 1 cm for Set A and 3 cm for Set D (1,3*). Inset: schematic of fracture trace configurations and node types observed at outcrop. Box 1, en echelon traces designated as I-nodes where contingency rule is not met; Box 2, en echelon traces designated as C-nodes where contingency rule is met. (B) C-node modified ternary diagram shows relatively high connectivity of Sets A and D. (C) Connectivity trace map of same area using conventional IXY nodes. (D) Conventional IXY ternary diagram shows lower connectivity.
Using traditional IXY-nodes, Set A trace lengths are 0.04–1.84 m, while IXYC-node trace lengths increase to 0.04–2.62 m. The conventional IXY trace map shows Set A trace lengths 0.04–0.48 m occur more frequently per square meter compared to IXYC trace maps. Using traditional IXY-nodes, Set D trace lengths are 0.024–0.723 m, while contingent IXYC-node lengths are similarly 0.030–0.723 m. The use of C-nodes finds slightly longer trace lengths overall, especially for Set A. Fracture traces for both sets are shorter without contingency rules because C-nodes connect traces that are separable at a given image resolution, as described by Forstner et al. (2025). The total number of traces decreases from 197 without C-nodes to 131 with C-nodes (Figures 20A, C). The near-orthogonal pattern of Sets A and D fractures have high overall trace connectivity using C-nodes, like outcrop observations indicate, compared with results from the classic IXY method (Figures 20B, D).
4.3.6 Fluid inclusions
Fluid inclusion assemblages (FIAs) are present in quartz-filled microfractures, most clearly in Set A (Figure 21). In transmitted light, FIA trails mark the microfractures that appear either isolated or in small fracture clusters of up to five. Based on a strict petrographic context, each microfracture represents an individual fracturing and cementation event, but all are part of the same fracture Set A. The fluid inclusions are semi-rounded to irregularly shaped with their long diameters up to 20 µm aligned with microfracture planes (Figure 21B). Aqueous inclusions are liquid dominated and have similar liquid-vapor ratios (Figure 21C). Exceptions are a few inclusions with large vapor bubbles close to the thin section surface, most likely the result of decrepitation during sample preparation. These inclusions were avoided during microthermometry.
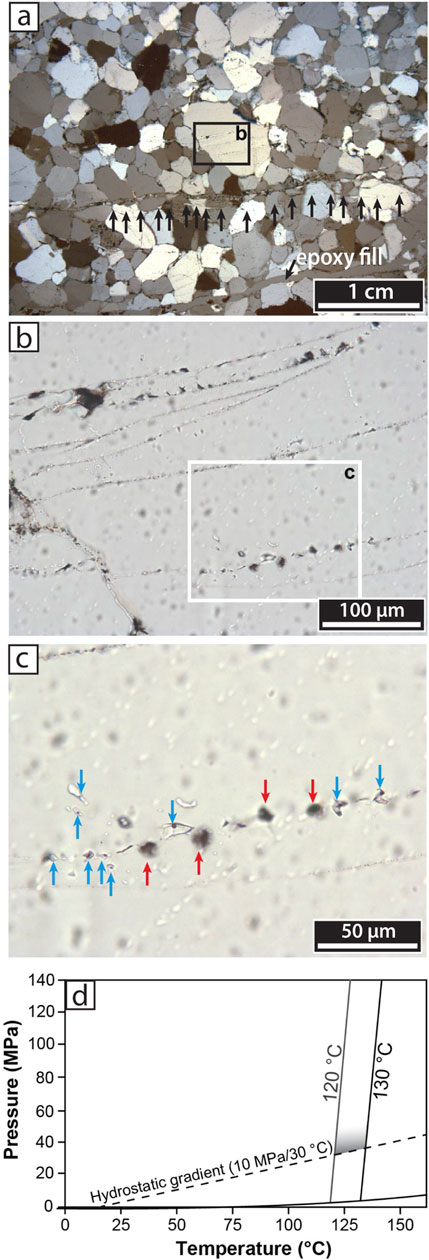
Figure 21. Set A fluid inclusions, Rt16. (A) Fluid inclusion plane (microfracture), indicated by black arrows. Partly crossed polars, transmitted light. (B) Fluid planes (darker lines) and examples of inclusion sizes and shapes. Boxed area in A. (C) Fluid inclusions with liquid-vapor ratios (blue arrows) and damaged inclusions (red arrows). Boxed area in B. (D) Pressure-Temperature phase diagram showing trapping conditions for fluid inclusions with a salinity of 21 wt% NaCl equivalent that homogenize between 120°C and 129°C. Corrected minimal trapping conditions indicated by gray shading. If the hydrostatic and thermal gradient is correct, the temperature correction might be lower.
Inclusions homogenize in a relatively narrow range from 120°C to 129°C, with similar or smaller ranges within individual FIAs (see Supplementary Table S2), giving minimum trapping temperatures. Ice melting behavior indicates the presence of a H2O-NaCl-dominated fluid, with no evidence of dissolved gases (Fall 2020). Final ice melting temperatures of −19.2°C to −17.6°C correspond to salinities of 20.6–21.7 wt% NaCl equivalent (Steele-MacInnis et al., 2012). Substantial regional salt horizons extend into the Appalachian Basin (Rickard, 1975) and our FIA salinity values are compatible with compositions of deep brines. These are the first fluid inclusion results from fracture quartz cement in this region.
4.3.7 Bed-parallel fractures
Visible in some outcrops are rare barren low-dip joints (Figures 16A, C, D) that crosscut or abut, and thus postdate, subvertical fracture sets. Although mostly planar, some have undulating traces and extend discontinuously for meters along outcrop faces (Figure 16A). Opening displacements are generally ≤1 mm, although apertures of a few to tens of millimeters are present. Some penetrate less than 0.5 m into the outcrop face. SEM-CL analyses found no evidence of quartz or other mineral deposits in bed-parallel fractures and no associated bed-parallel quartz-filled microfractures (Figure 16D). Some bed-parallel fractures are marked by iron oxide stains or active groundwater flow. Joints are subparallel to bedding and are generally challenging to separate from weathered beds except where associated with large weathered out pores (vugs). Vugs are irregular to ellipsoidal cavities that exist locally along bed-parallel fracture traces (Figure 16A). The long dimension of ellipsoids parallels bedding. No quartz deposits were found in vugs. Given limited vertical exposures and challenges separating bed-parallel fractures from weathered bed interfaces, we did not quantify abundance or spatial arrangement of these features.
5 Discussion
Analysts use fracture data from outcrops—reservoir analogs—to guide engineering planning (Agosta et al., 2010; Sanderson, 2016; Bauer et al., 2017; Ukar et al., 2019; Peacock et al., 2022). Regional and local fracture attributes are among the factors relevant to assessment of geothermal resources (e.g., Muffler and Cataldi, 1978), yet they are commonly challenging to obtain for subsurface targets owing to inherent sampling challenges (Table 1). A lack of knowledge of fractures negatively impacts estimation of heat exchange surface area and the prevalence of fast pathways for flow, as well as increasing the uncertainty in stimulation design. Even core and image log data, for example, rarely provide adequate fracture abundance information, may not delineate all fracture sets, typically do not document fracture size and spatial arrangement patterns, cannot systematically document connectivity, and cannot measure length distribution. Although our outcrops are most relevant to low-enthalpy targets in the eastern United States where district heating is the goal (Jordan et al., 2020), the challenge of fracture characterization is general (Laubach et al., 2019) as is the problem of assessing what attributes can be reliably inferred from outcrop for a subsurface target. What attributes from these outcrops can be extrapolated to the subsurface and how?
A key step in the use of analogs is determining what attributes in the outcrop, if any, are relevant to the subsurface target, which is at depth and may be distant from the analog outcrop. One question is: did the outcrop fractures form at depth? If they reflect one of the many processes that can form fractures during uplift, near-surface exposure, or weathering (e.g., Eppes et al., 2023) their inclusion in reservoir models may be highly misleading and so should be discounted. Outcrops, by virtue of having been uplifted to the surface, always differ from deep-seated rock to some extent, and the disparity impedes rigorous extrapolation from analog to target. Large outcrops are also rare. Cautions of concern for use of the Potsdam Group outcrops at Flat Rocks State Forest exist in the literature. For example, at Ausable Chasm (Figures 1, 16), orthogonal joints were interpreted as coeval, barren, and formed in the near-surface environment due to the potentially negative Poisson's ratio of arenitic sandstone at low confining pressures (i.e. auxetic properties; Li and Ji, 2021), and regionally some fractures in Potsdam Sandstone have been linked to near-surface stresses (Engelder and Sbar, 1976; Engelder and Sbar, 1977).
Outcrop fracture analogs can provide general guidance for the types and attributes of fractures in reservoirs, but a more ambitious aim for analogs is to provide specific guidance on key parameters like number of fracture sets, length distributions, and connectivity that cannot be reliably measured using site-specific subsurface information. If some attributes from the analog can be matched to data from the subsurface target, the analog attribute predictions can be tested (validated), allowing more accurate discrete fracture models for the reservoir and improved decision making. Two attributes from our outcrops are likely to be sampleable within subsurface targets for this purpose: diagenesis information and microstructures (microfractures). In favorable circumstances, these attributes can be obtained with relatively inexpensive wireline methods (Laubach and Gale, 2006). We explore this question below.
In using the Altona Flat Rocks outcrops as guides to subsurface targets, thermal and loading histories need to be considered because contrasts between the subsurface target and outcrop analog can lead to differences in fracture openness and other attributes. We show how these differences can be addressed. The thermal histories of both our outcrops and potential targets to the southwest are currently uncertain, but other specific aspects of rock attributes and fracture set orientations and size scaling can be established as the basis for eventual comparison with subsurface targets. Next, we discuss elements of outcrop geology that support this specific use of outcrop observations.
5.1 Attributes relevant to regional targets
5.1.1 Regional fracture patterns
The relevance of fractures in Potsdam outcrops to distant (>300 km) geothermal targets depends on whether fracture sets are part of regional patterns or are of local origins. Aerial imagery of Flatrocks outcrops shows very long fractures, compatible with opening-mode fractures tens to hundreds of meters long in other sedimentary outcrops (Laubach and Diaz-Tushman, 2009; Ellis et al., 2012; Laubach et al., 2016; Forstner and Laubach, 2022). Consistent fracture patterns over widespread regions reflect past and potentially current stress states, regional-scale stress fields, and basin-scale variations in pore fluid pressure. In isotropic rock, opening-mode fractures propagate along the plane perpendicular to the least compressive principal stress, making them indicators of stress orientations at time of fracture. Consistent patterns resembling those in Potsdam outcrops have been documented in other rocks in the northeastern United States, e.g., in Upper Devonian shale outcrops in the Appalachian Plateau over 300 km in central and western New York (N-NNW and ENE-ESE strikes, e.g., J1, J2, Engelder et al., 2009), although Devonian rocks are separated from underlying Paleozoic rocks by a detachment (Mount, 2014). Similar strike maxima are also found in core from other lower Paleozoic sandstones in the eastern United States (Dutton et al., 1993). Potsdam Sets A–D are not obviously associated with local structures such as folds or faults, and observed close spacing relative to height (narrow aspect ratios) typifies many joints in the Appalachian Plateau (Engelder and Geiser, 1980). This close spacing pattern is interpreted as consistent with hydraulic fracture at depth (Fischer et al., 1995).
Potsdam Sets A–D have characteristics typical of fractures extending over tens to hundreds of km2 across the Appalachian basin (Hodgson, 1961; Engelder and Geiser, 1980) and are inferred to be regionally distributed based on similar patterns from the Flat Rocks outcrops, Ausable Chasm to the southeast, and outcrops about 190 km to the west northwest (Figure 1, near Hammond, NY). These widespread patterns suggest that Flat Rocks fracture Sets A and D especially may be good guides to orientations and abundance over regional distances (100+km) to the west and south where subsurface geothermal targets are located. Further investigation of Potsdam exposures around the margins of the Adirondack uplift and further north would allow testing of this inference. Regionally consistent strikes and set populations of this scale are unsurprising. Elsewhere in Laurentian Cambrian sandstones fractures have strike patterns of regional extent, e.g., ∼100 km in Flathead Sandstone (Wyoming; Forstner and Laubach, 2022) and ∼200 km in Eriboll Sandstone (Scotland; Laubach and Diaz-Tushman, 2009; Hooker et al., 2011). As is the case with our Potsdam samples, these other Cambrian rocks also contain systematic microfracture strike patterns at regional scale.
Determining the cause of fracture sets is another way to assess the likelihood of persistent regional patterns. Our observations are not sufficient to pin down when and why Sets A–D formed. Several potential regional drivers of fracture formation are compatible with bed-normal opening-mode fracture arrays including combinations of strain (which could result from tectonic events) and pore pressure (Hancock, 1985; Pollard and Aydin, 1988), although as low-strain features such sets do not necessarily correspond with tectonic events (e.g., Olson et al., 2009). Strike patterns are commonly used to link sets to regional events, e.g., ENE-striking fractures in Devonian rocks in New York are interpreted to reflect Paleozoic convergence of Gondwana and Laurentia (Engelder et al., 2009), despite some of these fractures aligning with modern SHmax. Orientation and kinematic compatibility with potential orogenic movements provide ambiguous fracture dating without independent timing information. Set A strikes are congruent with Paleozoic shortening (i.e., J1) or Jurassic to Cretaceous extension. Likewise, Set D could be due to Paleozoic events (J2) or the modern stress regime.
Knowledge of fracture timing relative to both burial history and amongst fracture sets themselves can narrow down possible causes of fracturing. Crossing and abutting relations at Flat Rocks outcrops provide relative timing of Sets A–D, defining a sequential orientation pattern through time (Figures 9, 14). A given Set D fracture may cross several Set A fractures, but the Set D tips consistently abut Set A fractures. Rather than coeval formation the prevalence of these patterns is compatible with Set A being mostly filled at sub-millimeter-scale when Set D propagated.
Observed sparse, large, and seemingly barren fractures show that Potsdam outcrops may be overprinted to some extent with fractures that formed later in the same orientation, possibly during late uplift or in the near subsurface owing to modern stresses (Figure 12). Pre-existing partly open fractures are susceptible to reactivation. Macro-fractures may be unrelated to microfractures and coincidentally parallel or may have nucleated from pre-existing microfractures. Alternatively, macro-fractures might represent the large-size equivalent of microfractures, in which case their relative openness and homogeneous spacing stand in enigmatic contrast to their small-scale counterparts. Conversely, macro-fractures can be the same size or smaller than the largest microfractures present and again might be unrelated to microfractures and coincidentally parallel or may have nucleated from older microfractures (Figure 18E). Possible evidence of this overprinting includes some minor brecciated fill in Set A fractures (Figure 12D) however, this could be ex situ sediment because even these seemingly barren fractures have quartz-cemented tips (Figure 12E) and extremely thin (c. 2 μm) localized quartz cement lining (Figures 12H, I). New fractures, if formed at shallow depths (<80°C) would lack quartz deposits.
If thermal history is known, quartz cement volumes and fluid inclusion trapping temperatures can constrain fracture timing (e.g., Becker et al., 2010; Fall et al., 2012). Although lacking a well-constrained thermal history curve for Potsdam rocks, we nevertheless can make some inferences regarding timing of Sets A–D. Regionally some lower Paleozoic rocks may have been as deep as 6 km at c. 300 Ma but were below 80°C by 110 Ma (Figure 1). Set A fractures contain quartz deposits typically requiring elevated temperatures of >80°C to form (e.g., Lander and Laubach, 2015) and have minimum fluid inclusion assemblage homogenization temperatures of 120°C–129°C. Given the uncertain burial history, we lack the pressure history information to calculate true Set A trapping temperatures, but for high-salinity inclusions pressure corrections are likely minimal (Figure 21D). For a common geothermal gradient of 25 °C/km our results are compatible with Set A fracture formation at 3 km depth or more, which is in the depth range for geothermal prospects in the eastern United States.
The trapping temperatures of Set A could have formed on a burial trajectory, but subsequent deep burial and quartz accumulation would likely have filled Set A fractures, as was the case for early, deeply buried fractures in another Cambrian sandstone (Laubach and Diaz-Tushman, 2009). Sets A and C are partly open, but younger Set C fractures, and some possibly overprinted Set A fractures, contain less quartz (thinner cement rinds) implying lower thermal exposure, probably during gradual exhumation. All fractures postdate host rock compaction and cementation, as well as monoclines and cataclastic bands possibly associated with Paleozoic deformation. Together, the evidence is compatible with Sets A – D forming after maximum burial. Persistence of fracture growth during exhumation has been attributed to unloading and thermoelastic contraction, especially for quartz-rich rocks with higher Young's modulus, although the relationships cannot be rigorously estimated (English and Laubach, 2017).
5.1.2 Quartz cement and fracture attributes related to fluid flow
Observations of quartz cement deposits show that at Flat Rocks most, if not all, Sets A–D sub-vertical fractures formed in the subsurface and are suitable guides into fracture patterns at depth in prospective reservoirs. Fractures are either sealed or have small open apertures in outcrop. Quartz deposits are present in macroscopic Sets A and C fractures and in parallel microfractures for all sets (Figures 11, 12, 14, 15). Facet sizes vary with the substrate dimension (length of cut grain or cement deposit) substrate crystallographic orientation, or substrate composition (less or no quartz on feldspar or clay minerals).
Because sets formed sequentially rather than coevally, early fractures impeded the propagation of later ones and were exposed to diagenetically reactive fluids for longer and likely hotter time intervals. Consequently, earlier and later-formed parts of the network may have differing fluid flow capacities. Although quartz lined or locally filled, residual porosity shows that the cumulative thermal exposure experienced by the oldest Set A fractures was insufficient to seal them. Quartz rinds on Set A and C macro-fracture walls imply NNW-oriented fractures ≥0.08 mm wide and NW-oriented fractures ≥0.06 mm could be incompletely sealed. These observations are compatible with the inferred emergent thresholds of 0.1–0.5 mm for Set A and 0.05–0.1 mm for Set C. Overall, fractures with widths greater than these values are conducive to fluid flow and likely have higher reactivation potential from geothermal stimulation due to lack of cement. Persistence of fracture porosity is compatible with reconstructed porosity histories in other sandstones showing that quartz-lined fractures remain open at temperatures of >150°C for tens of millions of years (Becker et al., 2010) and with models of quartz accumulation in fractures (Lander and Laubach, 2015). Fracture and host-rock diagenesis make such fractures stiff and resistant to closure (Olson et al., 2007; Laubach et al., 2016), a useful attribute for flow persistence in geothermal applications.
Extensive quartz in fractures and host rock, and the lack of evidence for flow in Set A fractures from local flow tests (e.g., Hawkins et al., 2017), imply that the fractures visible in outcrop are not prolific flow conduits. Yet these mostly sealed fractures may still be useful analogs for open fractures elsewhere with less thermal exposure because the degree of quartz fill, and the size of open fractures in terms of aperture and length, will depend on thermal exposure in predictable ways (Lander and Laubach, 2015). Quartz textures are consistent with models for gradual quartz accumulation governed by precipitation rate dictated by temperature (Lander and Laubach, 2015). In these settings, narrow fractures seal first. Consequently, microfractures are completely cemented and narrow connections within and among fractures of otherwise interconnected networks are also preferentially sealed with cement. Older fractures will be more sealed than younger fractures, in agreement with our observations from Flat Rocks samples. Thus, areas that have slightly less thermal exposure than the Altona area outcrops would be expected to have proportionally more open fracture pore space.
For geothermal applications, Potsdam outcrop results predict low well-test permeabilities owing to quartz disconnecting open fractures, but stimulation of the closely spaced microfractures and partly open fractures could yield high surface area for heat exchange. In other similar sandstones, microfractures are associated with strength anisotropy and induced fracture opening preferentially aligns with natural fracture strikes and the maximum horizontal stress (Clift et al., 1992). The Potsdam sandstone as a building stone already utilizes this breakage susceptibility creating naturally rectangular blocks and is thus a good candidate for either advanced or enhanced geothermal applications capitalizing on the natural fractures.
5.2 Using microfracture scaling to assess open fracture average spacing and length
Outcrops having similar rock types and structures are self-evidently valuable for assessing geothermal targets (e.g., Peacock et al., 2022), although for the purpose of making specific predictions about the subsurface, additional parameters are required to infer the presence and geometry of open fractures, fracture porosity, connectivity, or susceptibility to closure (stiffness). Essential from the outcrop is evidence that structures formed or existed in the subsurface, a finding best made by comparing fracture diagenesis and microfracture populations (Ukar et al., 2019). For rigorous comparison, key attributes must be measurable in both outcrop analog and subsurface target, for example, via core samples.
Abundance is characterized by intensity (cumulative frequency) or average spacing (inverse of cumulative frequency). Cumulative frequency-aperture size distributions obviate scale bias in intensity or spacing determinations because they are a measure of abundance that explicitly varies according to size, allowing for comparison of data sets collected at different scales of observation. The challenges of sampling and interpreting power law distributions are discussed by Pickering et al. (1995). For most data sets, sizes at the large-scale end of the distribution are generally poorly constrained and are subject to censoring, with deviation up or down from best-fit line. The small end of the distribution likely has truncation artifacts owing to missed or unresolved small fractures. If long scanlines and large amounts of data are available, calculation of intensity or average spacing of small fractures is more reliable (Ortega et al., 2006).
Within the 0.0001–0.001 mm aperture size range, Rt16 has nearly an order of magnitude more Set A microfractures than RR (Figure 18A), even though these locations are only 1 km apart, at close to the same stratigraphic level with no major differences in rock type, and no known structures in between. The difference may, however, be due to subtle differences in rock type. The co-occurrence of low intensity and lognormal best fit among Set A microfractures from RR is consistent with that population representing the fracture distribution during early evolution, while the power law size distribution exhibited at Rt16 exemplifies continued fracturing over time as larger fractures dynamically interact with existing smaller fractures (Hooker et al., 2018) (Figure 18E). Even where microfractures show a good fit to the predicted −0.8 slope, they tend to overpredict the macro-fracture frequency observed in outcrops. This could mean that microfractures are clustering near macro-fractures, and so our (near-macro-fracture) microfracture samples are overpredicting the far-field macro-fractures frequency. Outcrop microfracture populations predict close spacing of large (>1 mm) fractures (Figures 18A, C), agreeing with outcrop observations (Table 3). If rocks in target horizons contain microstructures, rigorous comparison is possible of fracture intensity between analog and subsurface targets. The dense spacing patterns we describe are compatible with high surface area for heat exchange.
For a power law size distribution like our examples, the largest fractures are least common in a fractured volume of rock, yet these are the structures of interest for reservoir simulation. The significance of quartz-sealed microfractures in a power law population is that they can potentially be used to assess the abundance and spacing of large fractures in settings like subsurface geothermal targets where systematically measuring abundance of large fractures is precluded by inherent sampling limitations (Laubach et al., 2000). Our outcrop results suggest that the likely size of subsurface samples (∼5–10 cm) may be too short to rigorously define aperture size distributions, but with the assumption of a −0.8 slope that is common in many sandstones (Hooker et al., 2014), even limited microfracture data can be used to infer the abundance and average spacing of larger fractures.
Overall, the 1D spatial analyses for both Sets A and D show anticlustered (regular or periodic) arrangements of fractures, distinguished with 95% confidence at small distances (∼10 cm), while the 2D analysis for Set A reveals a random arrangement of fracture barycenters, likely reflecting the initial random distribution of starter flaws for fracture nucleation (Correa et al., 2022; see Supplementary Figure S2). In this scenario, the lack of organization indicates sporadic activation of flaws with no mechanical interaction during early fracturing. Mechanical interaction and inhibition of new fractures would have begun through expanding stress shadows as fractures continued growing, creating the observed non-random anticlustering pattern along 1D scanlines. The resulting mechanical interactions among growing fractures also promoted the development of longer fracture traces at regular distances (>9 m) and eventual hard linkage causing variability in strike at certain length scales.
Fracture height is a parameter that is challenging to measure in the subsurface. Extensive core data sets show that top-bounded height patterns are common in the subsurface (Laubach et al., 2009). Shorter fractures in a top-bounded pattern end at various locations within a sandstone whereas longer fractures are bound by bedding contacts, i.e., fractures have a range of heights while confined within a given rock type (Hooker et el., 2013). This pattern was observed in the river-cut Potsdam outcrops at Ausable Chasm (Figure 16B) where heights are best exposed. For Sets A and D, average spacing is narrow relative to heights (Figures 9, 16, 17E). Overall, these results suggest that top-bounded height patterns are likely to prevail in subsurface targets.
Fracture length is a key parameter for flow models (e.g., Einstein, 1993; Philip et al., 2005; de Dreuzy et al., 2012; Cañamón et al., 2022) but determining the correct distribution from outcrop data for modeling has challenges (e.g., Cladouhos and Marrett, 1996; Forstner et al., 2025; Benedetti et al., 2024). Lower resolution imagery results in traces that likely commingle multiple parallel and neighboring fractures and may inherently employ a type of contingent rule. For example, the drone imagery used here cannot resolve features <10 cm apart. Therefore, two neighboring parallel fractures with traces and/or tips occurring <10 cm apart will more than likely be mapped as a single trace. Fracture length distributions best fit by exponential functions are characterized by a high frequency of short fractures and a low frequency of longer fractures. It is difficult to predict the frequency of fracture lengths from small to large with exponential distributions because the trendline slope changes. However, if power laws are used to bracket the lower and upper bounds of the exponential length distributions, one could use length measurements from the microscopic scale to predict the frequency of lengths at larger scales of observation (Forstner et al., 2025, their Figures 8A, 9A). Error bars, of course, increase the further out one predicts.
Fracture sets formed by combinations of tectonic loading and elevated fluid pressure may share common attributes of orientation and abundance over wide areas, aiding extrapolation from outcrop to subsurface. But the distribution of open fractures—and therefore the capacity for fracture-augmented heat exchange and fluid flow—can vary markedly owing to the accumulation of cement deposits that reflect differences in thermal history (e.g., Lander and Laubach, 2015). In sandstone, empirical evidence and modeling show that quartz tends to systematically and gradually fill narrow fractures first (Laubach, 2003; Lander and Laubach, 2015), thus the actual open length of fractures is likely to decrease as quartz cement increases with more thermal exposure (Forstner et al., 2025). Owing to the segmented character of Potsdam fracture lengths, where traces are connected by zones of narrow apertures, the sizes of open fractures (effective fractures) are much less than the traces lengths measurable on the outcrop. Thus, the outcrop measured trace length distributions (Figure 17) are likely maximum values. The appropriate values to extrapolate to a given subsurface setting would depend on the thermal history of that setting. In other words, if the subsurface target were to contain the same fracture set that exists in the outcrop (for instance, Set A), the open length distribution would need to be adjusted down from the measured trace pattern according to the diagenetic/thermal history of the target. Such an extrapolation can be made using standard burial history analysis practices and diagenetic modeling (e.g., Taylor et al., 2022).
Analogs that are hundreds of kilometers from subsurface targets are unlikely to be exact matches to subsurface targets, but even if only limited rock information is available from the target, diagenetic and microstructural information (orientations, size scaling) can be used to evaluate how close the analog resembles the target. Mismatches between analog and target arise because outcrops and rocks at depth differ in thermal history, and open fracture length and aperture distribution, connectivity, and spacing gradually change with the temperature-history-dependent accumulation of mineral deposits (Hooker et al., 2023a). Consequently, outcrop data collection needs to focus on the size distribution of fractures and the sizes of connections between fractures (Forstner and Laubach, 2022). If the thermal history of the subsurface target can be inferred, fracture size data from the outcrop can be used together with diagenesis forward models (Lander and Laubach, 2015; Taylor et al., 2022) to predict the abundance of open fractures and open fracture connectivity in subsurface locations.
5.3 Other reservoir analog features
5.3.1 Host rock
Similar rock types and structures are requisite for analogs. Owing to Paleozoic marine transgression over the paleocontinent Laurentia, correlative and lithologically similar Cambrian sandstones extend across North America (Lochman-Balk and Wilson, 1958), where they are commonly the deepest and hottest sedimentary units. Cambrian sandstones are geothermal prospects in Saskatchewan (Somma et al., 2021) and New York, where targets include the Potsdam and Galway Formations (e.g., Auburn well, Plumb and Hickman, 1985; Cornell well; Jordan et al., 2020; Fulcher et al., 2023; Pinilla et al., 2023) (Figure 1). Some stratigraphically higher sandstones, including some in the Galway Formation (Mazzullo et al., 1978; Hersi et al., 2021), have similar depositional settings and composition to the Potsdam, but are not as well exposed. Extrapolation from our outcrop to a specific target would involve quantitative comparison of thermal/diagenetic history because this is a main control on quartz accumulation in host rocks and fractures (e.g., Lander and Walderhaug, 1999; Lander and Laubach, 2015). Differences in diagenetic history can be evaluated with minimal samples because host rock diagenesis is readily and reliably sampled (e.g., sidewall cores, Laubach and Gale, 2006; Gale et al., 2023).
In sandstones, core data show a correlation between depositional facies and fracture stratigraphy (Dutton et al., 1993). Because sandstone composition and layer thickness influence fracture attributes as well as host rock porosity and permeability, stratigraphic similarities and differences are important for judging analogs. The Potsdam Group has been called a blanket marine sandstone (e.g., Wilson, 1946) but lower Potsdam facies likely comprise interfingering of sand-rich shoreline (marine) environments and fluvial deposits (Bjerstedt and Erickson, 1989) and there is potential for considerable local relief on sub-Cambrian topography (Otvos, 1966). The fracture stratigraphy associated with the facies in our outcrop is likely relevant for compositionally similar sandstones elsewhere including parts of the stratigraphically higher Galway Formation (Mazzullo et al., 1978; Fulcher et al., 2023), but careful assessment is needed of the stratigraphic and diagenetic characteristics of the target. A separate manuscript detailing Potsdam fracture outcrop characteristics compared to retrieved Potsdam sandstone and Galway Fm sidewall cores is in preparation.
Attributes of host sandstones are essential to understanding how fractures affect fluid flow because flow in the host rock is a component of overall permeability. Outcrop Schmidt Hammer data show a strong, brittle rock and our observations show that quartz cement is extensive in the outcrop sandstone and is likely to interrupt porosity continuity in fractures. Where open fractures do not physically interconnect, disconnected open fractures may nevertheless markedly augment overall permeability if they are connected by narrow soft links of porous sandstone (Olson et al., 2009). The porosity of host sandstone in the subsurface is a key element in predicting how the fracture-host rock permeability system is likely to work, and this is an aspect of fluid flow that can be accounted for in current flow modeling (Olson et al., 2007; 2009; 2010; Lander et al., 2008; Sweeney et al., 2023; Huang et al., 2024).
In Flat Rocks outcrops, primary porosity of <1% due to compaction and quartz and K-feldspar cementation, and total porosity of c. 5% from secondary processes, is low compared with as much as 12% reported for Paleozoic sandstones in central and western New York (Pferd, 1981). However, local variations in Potsdam Sandstone porosity controlled by paleotopography of the Precambrian surface have been documented (Lombard, 1983). In our outcrops, high quartz cement amounts likely reflect protracted or deep Paleozoic burial of as much as 6.5 km under younger strata and by Paleozoic thrust sheets (Figure 1) (Friedman and Sanders, 1982). To the extent this inferred deep burial is specific to rocks near and beneath the overthrust belt in eastern New York, the outcrops likely overestimate quartz abundance relative to less deeply buried rocks further west but are a useful starting point for calibrating porosity/permeability predictions using site-specific thermal histories and appropriate process-based models (Lander et al., 2008; Taylor et al., 2022).
5.3.2 Monoclines and cataclastic bands
The isolated character and kink-like geometry of monoclines implies marked bed-parallel mechanical layer contrast and potential for bed-parallel slip during fold formation (Hardy and Finch, 2007), indicating these structures formed prior to extensive quartz cementation that now pervasively indurates the sandstone. West and northwest-vergent folds are kinematically compatible with shortening in nearby Paleozoic orogenic belts. Our outcrops are within 25 km of Paleozoic thrust fronts (Figure 1), and folds may be localized near the thrust front. The likelihood that these structures occur further west and south is uncertain. On the other hand, subtle N- and NE-trending fold- and fault zones of considerable lateral extent, such as the Clarendon-Linden Fault Zone, are found further west (Jacobi and Fountain, 2002) (Figure 1).
Within monoclines, tabular, resistant structures have the field characteristics of deformation bands (Fossen et al., 2018), with microstructures dominated by cataclasis and damage zones (Figure 7A). The abnormally large width of the largest band observed within the BR fold suggests that it is a band cluster where strands have progressively coalesced over time to accommodate strain (e.g., Ballas et al., 2012). Early quartz cement (Qc1) surrounds and rims broken particles in bands, but is itself unfractured, suggesting these structures formed early with deformation ceasing before the host rock became indurated with cements. Crosscutting relations show that monoclines and cataclastic bands pre-date fracture Sets A–D. Asymmetric iron staining suggests bands formed prior to flows depositing these minerals (Figure 6A).
Cataclastic bands localize pyrite, iron-rich chlorite, and blocky crystals of phosphatic iron oxides (Figures 7I, J) that imply temperatures and fluid compositions of hydrothermal origin. Chlorite typically forms >200°C (Bentabol et al., 2003). Their localization near band margins suggests these deposits postdate band formation, possibly localized by lower porosity and permeability in bands versus the host rock at the time. Hydrothermal activity is associated with Paleozoic faulting (Smith, 2006).
Folds and deformation bands are structures that could affect reservoir behavior. Monoclines and associated variation in bed dip are considerations for directional drilling and stimulation design. Cataclastic deformation bands are also commonly baffles or barriers to fluid flow in sedimentary rocks (Ogilvie et al., 2001). However, differences here between deformation bands and the highly cemented Potsdam Sandstone are muted relative to overall high strength (avg. 65.5 MPa rock; 76.5 MPa band) and low porosity (avg < 5% rock; avg 4.9% band). If bands exist elsewhere, where host sandstones are less diagenetically altered, the contrast between bands and host may be greater as is the case for deformation bands in more porous sandstones (e.g., Ogilvie et al., 2001; Fossen et al., 2018). Iron stain patterns suggest Potsdam bands were flow barriers in the past. If folds and bands are of regional extent and they exist in less quartz-cemented hosts, their significance could be as low porosity flow barriers or baffles. Monocline size and separation (∼0.2–0.5 km), dip changes, the prevalence of bands within fold limbs, locally wide bands (c. 100 mm), and mechanical property contrast with host rocks suggest narrow monocline steep limbs and bands may be identifiable with high-frequency geophysical methods (e.g., Ogali and Orodu, 2022). Band distributions can be incorporated into models by using measured values in exposed areas and a randomized spatial bootstrap approach to generate locations of bands in models or in covered areas, as we demonstrate for our outcrop example (Shakiba et al., 2022) (Figure 6C).
5.3.3 Bed parallel fractures
Regionally in Potsdam sandstone, bed-parallel fractures are essential flow conduits (Nastev et al., 2008). Shallow wells in the Flat Rocks area show that in the shallow subsurface gently dipping fractures extend laterally over tens of meters at least, where they are conduits for fluid flow (Castagna et al., 2011; Williams et al., 2010b; Hawkins et al., 2017), compatible with regional hydrologic evidence for these structures (Williams et al., 2010a). At Flat Rocks, well tests show that subvertical fractures are relatively ineffective (e.g., Williams et al., 2010a; b; Castagna et al., 2011; Hawkins et al., 2017). Bed parallel fractures and vugs we found in outcrop are likely representative of this flow system, which is mostly attested for shallow groundwater flow.
Regionally, deep bed parallel fractures are associated with gas generation in shales (Engelder and Gross, 2018), and in some basement rocks in outcrop (Nadan and Engelder, 2009), but the bed parallel fractures and associated vugs in our outcrops are not necessarily features that exist at depth. The lack of quartz deposits in our samples suggests fractures formed in a cool (<80°C) possibly near-surface setting. If such fractures had resided long at elevated temperatures, mineral deposits like those in Sets A and C would be expected. Abutting relations suggest that outcrop bed parallel fractures formed after Set D. This relative timing is compatible with bed parallel fractures forming during uplift and/or post-glacial unloading in the contractional tectonic setting that persists currently across the basin (Snee and Zoback, 2022). The bed parallel fractures may be a form of sheeting joint (Martel, 2017). Vugs along bedding are late features apparently spatially associated with bed parallel fractures. Quartz-cemented sandstone is not highly soluble, but surface-related bioweathering is a possible cause (Potysz and Bartz, 2022).
Our results do not rule out a role for bed-parallel fractures for flow at greater depth elsewhere. Such fractures are common at depth in some rocks and could form in foreland and mid-plate shortening settings like those affecting the Potsdam Group.
5.4 General lessons from these outcrops
How representative are Flat Rocks outcrops for other parts of the regional sedimentary section? Potsdam Group sandstone outcrops sample only a limited part of the lower Paleozoic siliciclastic stratigraphic section, but they may provide adequate analogs for other, younger sandstones such as the conformable Galway Formation, as these rocks share similar thermal histories and modern-day petrophysical properties.
The Potsdam Flat Rocks exposures provide general guidance on fractures in other quartz-rich lower Paleozoic sandstones throughout the eastern and central United States because of the brittle, fracture prone character of these rocks. The Potsdam fracture quartz deposits, size distributions, and spatial arrangements closely resemble regionally persistent patterns with high fracture surface area in other Cambrian sandstones of Laurentia including the Mesón Group of Argentina (Hooker et al., 2013), the Flathead Formation sandstone of Wyoming (Forstner and Laubach, 2022), and the Eriboll Formation sandstone of northwestern Scotland (Laubach and Diaz-Tushman, 2009; Hooker et al., 2011).
On the other hand, fracture sets within the Potsdam outcrop, and more broadly within Cambrian sandstones of Laurentia, vary in the degree of porosity and connectivity preserved depending primarily on quartz deposits which reflect thermal histories. Generally, older fractures have experienced longer thermal exposures and thus more time for cements to fill wider fractures, whereas younger fractures can have less thermal exposure (either lower temperature or less time at higher temperatures) allowing smaller fractures to retain porosity. For example, in the Flathead sandstone, with short duration but deep burial, some microfractures preserve porosity where opening displacements are mere microns, whereas some wide macro-fractures in the Mesón and Eriboll are sealed due to protracted deep burial. Similar patterns are found in sandstone core data sets (Laubach et al., 2023). Thus, despite the likely general similarities in structural style regarding fracture sets and abundance of the Potsdam Flat Rocks exposures to other subsurface lower Paleozoic sandstones, differences in fracture attributes like openness to fluid flow necessitates tailoring subsurface predictions to the specific subsurface target, particularly in terms of thermal history.
If some of Sets A–D fracture strike patterns persist over hundreds of km2, knowledge of the specific loading and fluid pressure pathway for each set may not be needed to make general predictions about orientation patterns away from our area of study. However, orientation may remain constant while many attributes that control fluid flow and strength, such as openness, spacing, and connectivity can vary as these are affected by the diagenesis of the fracture network and need to be accounted for.
6 Conclusion
Cambrian Potsdam Group sandstone outcrop analogs provide essential information about likely fracture attributes in geothermal targets, such as spacing of open fractures and their porosity, connectivity, or susceptibility to closure (stiffness). Outcrops near Altona are large, comparable to likely geothermal interwell development distances, and contain open monoclines with cataclastic deformation bands, four sets of subvertical opening-mode fractures (A–D) with broad aperture size ranges including microfractures, and barren bed-parallel joints. Based on fluid inclusion evidence, opening-mode fracture sets formed at about 3 km depth after max burial, possibly during the mid-to late Cretaceous.
Compared with similar fracture sets elsewhere, Sets A–D are typical of regional fractures with patterns that are likely to persist over tens to hundreds of km2. Fractures sequentially young from Set A→D and strikes shift from NNW, NE, NW, ENE. Sets A and C contain quartz, local quartz-lined porosity, and populations of quartz-filled microfractures. Sets B and D fractures have quartz deposits in associated microfractures. Sets A and D have broad size ranges. Set A microfracture aperture scaling fits a power law with slope −0.8 for up to about 0.15 mm, compatible with observed close spacing of wide Set A fractures of 0.1–0.2 m. Microfractures for other sets have lognormal distributions. Similar quartz-lined porosity in fractures of about 0.05–0.1 mm wide in other rocks has been shown to lasts for millions of years despite protracted burial and to be associated with high fracture stiffness (resistance to closure). Set A and D microfractures are weakly clustered, while macro-fractures commonly have 1D anticlustered (regular or periodic) arrangements at shorter length scales (<0.2 m). These spatial attributes are compatible with high surface area for heat exchange after stimulation. We infer that Sets A–D are likely to manifest in the subsurface over comparable distance to the west and south, probably with variations in strike, prominence of sets, and abundance. If some attributes from the analog can be matched to data from the subsurface target, the analog attribute predictions can be tested (validated), allowing more accurate discrete fracture models for the reservoir and improved decision making. Two attributes from our outcrops are likely to be sampleable within subsurface targets for this purpose: diagenesis information and microstructures (microfractures).
Owing to generally low host-rock permeability, naturally occurring fractures are valuable reservoir elements in lower Paleozoic low enthalpy geothermal targets in North America, especially if they increase surface area for heat exchange and augment fluid flow. Consequently, fracture information is invaluable. Quartz cement deposits—evidence of diagenesis—are the key to identifying the attributes of outcrop fractures suitable for extrapolating to geothermal targets in sandstones because they show which fractures formed in the subsurface and how fracture attributes are likely to vary with thermal history. Quartz deposits together with comparisons of outcrop and geothermal target temperature histories show how key fracture attributes like abundance, aperture and length distributions, and connectivity need to be modified (increased or decreased) from outcrop to target allowing for accurate site-specific predictions. Diagenesis information in the form of cement amounts, relative timing, and quartz-filled microfracture populations allow predictions to be tested with limited and relatively inexpensive subsurface sampling. With calibration from diagenetic and microstructural data from core, such outcrops allow quantitative extrapolation of fracture abundance (average spacing) and orientation patterns.
Sandstone diagenesis is a useful metric for judging the suitability of sandstone outcrops as analogs for subsurface geothermal targets and as a tool for interpreting and modifying outcrop data to match the subsurface for accurate reservoir simulation. Points of comparison are rock type and structural setting as well as quartz cement amounts, sandstone porosity, microstructures, and rock mechanical properties. Potentially valuable structural markers include quartz-filled microfractures, which may provide measures of macroscopic fracture orientations and abundance even from small subsurface samples, and degree of quartz fill in fractures having apertures of about 0.05–0.1 mm which can inform assessment of network connectivity and discrete fracture models for decision making.
Data availability statement
The original contributions presented in the study are included in the article/Supplementary Material, further inquiries can be directed to the corresponding author.
Author contributions
SE: Conceptualization, Data curation, Formal Analysis, Investigation, Methodology, Visualization, Writing–original draft, Writing–review and editing. SRF: Formal Analysis, Investigation, Methodology, Visualization, Writing–review and editing. QW: Formal Analysis, Investigation, Methodology, Visualization, Writing–review and editing. RC: Formal Analysis, Investigation, Methodology, Visualization, Writing–review and editing. MS: Formal Analysis, Investigation, Methodology, Writing–review and editing. SAF: Investigation, Writing–review and editing. NH: Investigation, Writing–review and editing. BL: Validation, Writing–review and editing. ST: Validation, Writing–review and editing. JH: Formal Analysis, Methodology, Visualization, Writing–original draft, Writing–review and editing. AF: Formal Analysis, Writing–review and editing. JO: Investigation, Methodology, Resources, Validation, Writing–review and editing. SL: Writing–review and editing, Conceptualization, Formal Analysis, Funding acquisition, Investigation, Methodology, Project administration, Resources, Supervision, Validation, Writing–original draft.
Funding
The author(s) declare that financial support was received for the research, authorship, and/or publication of this article. This study was funded by grant DE-SC0022968 from Chemical Sciences, Geosciences and Biosciences Division, Office of Basic Energy Sciences, Office of Science, U.S. Department of Energy. Additional support for field work was provided by the Albert W. and Alice M. Weeks Centennial Professorship in Geological Sciences (SL), GDL Foundation field education grant (JO), and the Fracture Research and Application Consortium at The University of Texas at Austin. Field work and analysis were part of the class Brittle Structure and Structural Diagenesis (Jackson School GEO 491/381E) (SL).
Acknowledgments
We are grateful to Teresa Jordan and Richard Allmendinger for their substantial contributions to the research and to The University of Texas and Cornell University field team that helped collect the Potsdam data. Thanks to Adam Hawkins and David Valentino for discussion and colleagues from the 2023 Burlington-Altona symposium for field review of the outcrops. We thank the Miner Institute for logistical support and Kurt Beattie of the Miner Institute and Corbin Swamp of the Ganienkeh Mohawk Nation police for their courtesy in hosting our visits. Rock Road outcrops are on public land, but other exposures are on private property. We are grateful to the Miner Institute and to the Ganienkeh Mohawk Nation for permission to access.
Conflict of interest
The authors declare that the research was conducted in the absence of any commercial or financial relationships that could be construed as a potential conflict of interest.
Generative AI statement
The author(s) declare that no Generative AI was used in the creation of this manuscript.
Publisher’s note
All claims expressed in this article are solely those of the authors and do not necessarily represent those of their affiliated organizations, or those of the publisher, the editors and the reviewers. Any product that may be evaluated in this article, or claim that may be made by its manufacturer, is not guaranteed or endorsed by the publisher.
Supplementary material
The Supplementary Material for this article can be found online at: https://www.frontiersin.org/articles/10.3389/feart.2025.1545052/full#supplementary-material
References
Agosta, F., Alessandroni, M., Antonellini, M., Tondi, E., and Giorgioni, M. (2010). From fractures to flow: a field-based quantitative analysis of an outcropping carbonate reservoir. Tectonophysics 490 (3-4), 197–213. doi:10.1016/j.tecto.2010.05.005
Allmendinger, R. W., and Karabinos, P. (2023). Illuminating geology in areas of limited exposure using texture shading of lidar digital terrain models. Geosphere 19 (1), 163–178. doi:10.1130/ges02531.1
Amidon, W. H., Kylander-Clark, A. R., Barr, M. N., Graf, S. F., and West, D. P. (2022). Pace of passive margin tectonism revealed by U-Pb dating of fracture-filling calcite. Nat. Commun. 13 (1), 1953–1957. doi:10.1038/s41467-022-29680-z
Anders, A. M., Lai, J., and Marshak, S. (2022). Development of foreland intracratonic plateaus (Ozark Plateau and Appalachian Plateaus): a consequence of topographic inversion due to erosion of adjacent fold-thrust belts. Tectonics 41 (4), e2021TC006957. doi:10.1029/2021TC006957
Anders, M. H., Laubach, S. E., and Scholz, C. H. (2014). Microfractures: a review. J. Struct. Geol. 69 (B), 377–394. doi:10.1016/j.jsg.2014.05.011
Anderson, A., and Rezaie, B. (2019). Geothermal technology: trends and potential role in a sustainable future. Appl. Energy 248, 18–34. doi:10.1016/j.apenergy.2019.04.102
Aydin, A., and Basu, A. (2005). The Schmidt hammer in rock material characterization. Eng. Geol. 81 (1), 1–14. doi:10.1016/j.enggeo.2005.06.006
Ballas, G., Soliva, R., Sizun, J. P., Benedicto, A., Cavailhes, T., and Raynaud, S. (2012). The importance of the degree of cataclasis in shear bands for fluid flow in porous sandstone, Provence, France. AAPG Bull. 96 (11), 2167–2186. doi:10.1306/04051211097
Barbier, E. (2002). Geothermal energy technology and current status: an overview. Renew. Sustain. Energy Rev. 6 (1-2), 3–65. doi:10.1016/s1364-0321(02)00002-3
Bauer, J. F., Krumbholz, M., Meier, S., and Tanner, D. C. (2017). Predictability of properties of a fractured geothermal reservoir: the opportunities and limitations of an outcrop analogue study. Geotherm. Energy 5 (1), 24–27. doi:10.1186/s40517-017-0081-0
Becker, S. P., Eichhubl, P., Laubach, S. E., Reed, R. M., Lander, R. H., and Bodnar, R. J. (2010). A 48 m.y. history of fracture opening, temperature, and fluid pressure: Cretaceous Travis Peak Formation, East Texas basin. Geol. Soc. Am. Bull. 122 (7/8) 122, 1081–1093. doi:10.1130/B30067.1
Benedetti, G., Casiraghi, S., Bertacchi, D., and Bistacchi, A. L. P. (2024). Unbiased statistical length analysis of linear features: adapting survival analysis to geological applications. EGUsphere 2024, 1–34. doi:10.5194/egusphere-2024-2818
Bentabol, M., Cruz, M. R., Huertas, F. J., and Linares, J. (2003). Hydrothermal transformation of kaolinite to illite at 200 and 300ºC. Clay Miner. 38 (2), 161–172. doi:10.1180/0009855033820086
Bjerstedt, T. W., and Erickson, J. M. (1989). Trace fossils and bioturbation in peritidal facies of the Potsdam-Theresa Formations (Cambrian-Ordovician), northwest Adirondacks. Palaios 4 (3), 203–224. doi:10.2307/3514770
Boersma, Q., Bruna, P., De Hoop, S., Vinci, F., Moradi Tehrani, A., and Bertotti, G. (2021). The impact of natural fractures on heat extraction from tight Triassic sandstones in the West Netherlands Basin: a case study combining well, seismic and numerical data. Neth. J. Geosciences 100, E6. doi:10.1017/njg.2020.21
Bradley, D. C., and Kidd, W. S. F. (1991). Flexural extension of the upper continental crust in collisional foredeeps. Geol. Soc. Am. Bull. 103 (11), 1416. doi:10.1130/0016-7606(1991)103<1416:feotuc>2.3.co;2
Busch, B., Adelmann, D., Herrmann, R., and Hilgers, C. (2022). Controls on compactional behavior and reservoir quality in a triassic buntsandstein reservoir, upper rhine graben, SW Germany. Mar. Petroleum Geol. 136, 105437. doi:10.1016/j.marpetgeo.2021.105437
Cañamón, I., Rajeh, T., Ababou, R., and Marcoux, M. (2022). Topological analysis of 3D fracture networks: graph representation and percolation threshold. Comput. Geotechnics 142, 104556. doi:10.1016/j.compgeo.2021.104556
Castagna, M., Becker, M. W., and Bellin, A. (2011). Joint estimation of transmissivity and storativity in a bedrock fracture. Water Resources Research 47(9), W09504. Water Resour. Res. 47. doi:10.1029/2010WR009262
Chong, Q., Wang, J., and Gates, I. D. (2022). Evaluation of closed-loop U-tube deep borehole heat exchanger in the basal cambrian sandstone formation, alberta, Canada. Geotherm. Energy 10, 21. doi:10.1186/s40517-022-00229-z
Cladouhos, T. T., and Marrett, R. (1996). Are fault growth and linkage models consistent with power-law distributions of fault lengths? J. Struct. Geol. 18 (2-3), 281–293. doi:10.1016/s0191-8141(96)80050-2
Clift, S. J., Laubach, S. E., and Holder, J. (1992). Strength anisotropy in low-permeability sandstone gas reservoir rocks: application of the axial point-load test: gulf Coast Association of Geological Societies Transactions. v 42, 61–72. Available online at: https://archives.datapages.com/data/gcags/data/042/042001/0061.htm.
Copuroglu, O. (2010). Effect of silica dissolution on the mechanical characteristics of alkali-reactive aggregates. J. Adv. Concr. Technol. 8 (1), 5–14. doi:10.3151/jact.8.5
Corrêa, R. S. M., Marrett, R., and Laubach, S. E. (2022). Analysis of spatial arrangement of fractures in two dimensions using point process statistics. J. Struct. Geol. 163, 104726. doi:10.1016/j.jsg.2022.104726
de Dreuzy, J.-R., Méheust, Y., and Pichot, G. (2012). Influence of fracture scale heterogeneity on the flow properties of three-dimensional discrete fracture networks (DFN). Journal of Geophysical Research: solid Earth 117(B11). doi:10.1029/2012JB009461
Dutton, S. P., Clift, S. J., Hamilton, D. S., Hamlin, H. S., Hentz, T. F., Howard, W. E., et al. (1993). “Major low-permeability-sandstone gas reservoirs in the continental United States,” in Bureau of economic geology report of investigations, 211. The University of Texas at Austin, 221.
Einstein, H. H. (1993). “Modern developments in discontinuity analysis—the persistence—connectivity problem,” in Comprehensive rock engineering 3. Editor J. A. Hudson (Oxford: Pergamon), 193–213.
Ellis, M. A., Laubach, S. E., Eichhubl, P., Olson, J. E., and Hargrove, P. (2012). Fracture development and diagenesis of Torridon Group Applecross Formation, near An Teallach, NW Scotland: Millennia of brittle deformation resilience? Journal of the Geological Society. 169 (3), 297–310. doi:10.1144/0016-76492011-086
Engelder, J. T., and Sbar, M. L.(1976). Evidence for uniform strain orientation in the Potsdam Sandstone, northern New York, from in situmeasurements. J. Geophys. Res. 81(17), 3013–3017. doi:10.1029/JB081i017p03013
Engelder, T., and Geiser, P. (1980). On the use of regional joint sets as trajectories of paleostress fields during the development of the Appalachian Plateau, New York. J. Geophys. Res. Solid Earth 85 (B11), 6319–6341. doi:10.1029/JB085iB11p06319
Engelder, T., and Gross, M. (2018). Pancake joints in Utica gas shale: mechanisms for lifting overburden during exhumation. J. Struct. Geol. 117, 241–250. doi:10.1016/j.jsg.2018.06.014
Engelder, T., Lash, G. G., and Uzcátegui, R. S. (2009). Joint sets that enhance production from middle and upper devonian gas shales of the Appalachian Basin. AAPG Bull. 93 (7), 857–889. doi:10.1306/03230908032
Engelder, T., and Sbar, M. L. (1977). The relationship between in situ strain relaxation and outcrop fractures in the Potsdam sandstone, Alexandria Bay, New York. Pure Appl. Geophys. 115, 41–55. doi:10.1007/BF01637096
English, J. M., and Laubach, S. E. (2017). Opening-mode fracture systems: insights from recent fluid inclusion microthermometry studies of crack-seal fracture cements. Geol. Soc. Lond. Spec. Publ. 458 (1), 257–272. doi:10.1144/sp458.1
Eppes, M. C., Rinehart, A., Aldred, J., Berberich, S., Dahlquist, M. P., Evans, S. G., et al. (2023). Introducing standardized field methods for fracture-focused surface process research. Earth Surf. Dyn. 12, 35–66. doi:10.5194/esurf-12-35-2024
Fall, A. (2020). “Applications of fluid inclusions in structural diagenesis,” in Fluid and melt inclusions: applications to geologic processes. Québec, Canada, mineralogical association of Canada, topics in mineral Sciences. Editors M. Steele-MacInnis, P. Lecumberri-Sanchez, and D. Kontak 49, 17–46.
Fall, A., and Bodnar, R. (2018). How precisely can the temperature of a fluid event be constrained using fluid inclusions? Econ. Geol. 113 (8), 1817–1843. doi:10.5382/econgeo.2018.4614
Fall, A., Eichhubl, P., Cumella, S. P., Bodnar, R. J., Laubach, S. E., and Becker, S. P. (2012). Testing the basin-centered gas accumulation model using fluid inclusion observations: southern Piceance Basin, Colorado. AAPG Bull. 96 (12), 2297–2318. doi:10.1306/05171211149
Fischer, M. P., Gross, M. R., Engelder, T., and Greenfield, R. J. (1995). Finite-element analysis of the stress distribution around a pressurized crack in a layered elastic medium: implications for the spacing of fluid-driven joints in bedded sedimentary rock. Tectonophysics 247 (1-4), 49–64. doi:10.1016/0040-1951(94)00200-s
Fisher, D. W. (1968). “Geology of the Plattsburgh and Rouses Point, New York–Vermont Quadrangles,” in New York State Museum Map and Chart Series (Albany, New York: The University of the State of New York) 10, 51. Available online at: https://dec.vermont.gov/sites/dec/files/geo/specialbulletin/Fisher1968Spb.pdf.
Forstner, S. R., Corrêa, R., Wang, Q., and Laubach, S. E. (2025). “Fracture length data for geothermal applications,” in Powering the energy transition through subsurface collaboration, geological society of London, energy geoscience conference series. Editors C. E. Gill, G. Goffey, and J. R. Underhill 1. doi:10.1144/egc1-2024-17
Forstner, S. R., and Laubach, S. E. (2022). Scale-dependent fracture networks. J. Struct. Geol. 165, 104748. doi:10.1016/j.jsg.2022.104748
Fossen, H., Soliva, R., Ballas, G., Trzaskos, B., Cavalcante, C., and Schultz, R. A. (2018). “A review of deformation bands in reservoir sandstones: geometries, mechanisms and distribution,”in Subseismic-scale reservoir deformation, geological society, London, special publications. Editors M. Ashton, S. J. Dee, and O. P. Wennberg, 459(1), 9–33. doi:10.1144/sp459.4
Friedman, G. M., and Sanders, J. E. (1982). Time-temperature-burial significance of Devonian anthracite implies former great (∼6.5 km) depth of burial of Catskill Mountains, New York. Geology 10 (2), 93–96. doi:10.1130/0091-7613(1982)10<93:TSODAI>2.0.CO;2
Fulcher, S. A., Pinilla, D., Jordan, T. E., Fulton, P. M., and Viera de Luca, P. H. (2023). Fracture network characterization and permeability for direct-use geothermal energy – Cornell university Borehole observatory ESH No. 1, proceedings, 48th workshop on geothermal reservoir engineering. Stanford, CA: Stanford University.
Gale, J. F. W., Elliott, S. J., Rysak, B. G., and Laubach, S. E. (2023). The critical role of core in understanding hydraulic fracturing. Core values: the role of core in twenty-first century reservoir characterization, geological society, London, the critical role of core in understanding hydraulic fracturing. Editors A. Neal, M. Ashton, L. S. Williams, S. J. Dee, T. J. H. Dodd, and J. D. Marshall, 527, 317–332. doi:10.1144/SP527-2021-198
Garg, S. K., Pritchett, J. W., Wannamaker, P. E., and Combs, J. (2007). Characterization of geothermal reservoirs with electrical surveys: beowawe geothermal field. Geothermics 36, 487–517. doi:10.1016/j.geothermics.2007.07.005
Gee, B., Gracie, R., and Dusseault, M. B. (2021). Multiscale short-circuiting mechanisms in multiple fracture enhanced geothermal systems. Geothermics 94, 102094. doi:10.1016/j.geothermics.2021.102094
GeoVision (2019). GeoVision: Harnessing the heat beneath our feet, U.S. Department of energy (DOE) Office of energy efficiency and renewable energy, geothermal technologies Office (GTO). Report No.: DOE/EE-1306; 8890
Ghassemi, A. (2012). A review of some rock mechanics issues in geothermal reservoir development. Geotech. Geol. Eng. 30, 647–664. doi:10.1007/s10706-012-9508-3
Gillespie, P. A., Walsh, J. J., Watterson, J., Bonson, C. G., and Manzocchi, T. (2001). Scaling relationships of joint and vein arrays from the Burren, Co. Clare, Ireland. J. Struct. Geol. 23, 183–201. doi:10.1016/s0191-8141(00)00090-0
Goldstein, R. H., and Reynolds, T. J. (1994). Systematics of fluid inclusions in diagenetic minerals. Society for sedimentary geology short course 31, SEPM society for sedimentary geology, Tulsa, Oklahoma, 199.
Gomez, L. A., and Laubach, S. E. (2006). Rapid digital quantification of microfracture populations. J. Struct. Geol. 28, 408–420. doi:10.1016/j.jsg.2005.12.006
Götze, J., Plötze, M., and Habermann, D. (2001). Origin, spectral characteristics and practical applications of the cathodoluminescence (CL) of quartz–a review. Mineralogy Petrology 71 (3-4), 225–250. doi:10.1007/s007100170040
Hagadorn, J. W., and Belt, E. S. (2008). Stranded in upstate new youk: cambrian scyphomedusae from the Potsdam sandstone. Palaios 23, 424–441. doi:10.2110/palo.2006.p06-104r
Hancock, P. L. (1985). Brittle microtectonics: principles and practice. J. Struct. Geol. 7 (3-4), 437–457. doi:10.1016/0191-8141(85)90048-3
Hardy, S., and Finch, E. (2007). Mechanical stratigraphy and the transition from trishear to kink-band fault-propagation fold forms above blind basement thrust faults: a discrete-element study. Mar. Petroleum Geol. 24 (2), 75–90. doi:10.1016/j.marpetgeo.2006.09.001
Harris, A. G., Harris, L. D., and Epstein, J. B. (1978). Oil and gas data from Paleozoic rocks in the Appalachian basin; Maps for assessing hydrocarbon potential and thermal maturity (conodont color alteration isograds and overburden isopachs): U.S. Geological Survey Miscellaneous Investigations Series Map I–917–E, 4 sheets scale. Report No.: DOE/ET/10136-T2; ON: DE83011707
Hawkins, A. J., Fox, D. B., Becker, M. W., and Tester, J. W. (2017). Measurement and simulation of heat exchange in fractured bedrock using inert and thermally degrading tracers. Water Resour. Res. 53, 1210–1230. doi:10.1002/2016WR019617
Hayman, N. W., and Kidd, W. S. F. (2002). Reactivation of prethrusting, synconvergence normal faults as ramps within the Ordovician Champlain-Taconic thrust system. Geol. Soc. Am. Bull. 114 (4), 476–489. doi:10.1130/0016-7606(2002)114<0476:ropsnf>2.0.co;2
Healy, D., Rizzo, R. E., Cornwell, D. G., Farrell, N. J., Watkins, H., Timms, N. E., et al. (2017). FracPaQ: a MATLAB™ toolbox for the quantification of fracture patterns. J. Struct. Geol. 95, 1–16. doi:10.1016/j.jsg.2016.12.003
Heaman, L. M., Kjarsgaard, B. A., and Creaser, R. A. (2003). The timing of kimberlite magmatism in North America: implications for global kimberlite genesis and diamond exploration. Lithos 71 (2-4), 153–184. doi:10.1016/j.lithos.2003.07.005
Heizler, M. T., and Harrison, T. M. (1998). The thermal history of the New York basement determined from 40Ar/39Ar K-feldspar studies. J. Geophys. Res. Solid Earth 103 (B12), 29795–29814. doi:10.1029/98jb02837
Hersi, O. S., Landing, E., Franzi, D., and Hagadorn, J. (2021). “Cambrian–lower ordovician of SW quebec–NE New York,” in GSA in the field in 2020: geological society of America field guide. Editors B. L. Cousens, and N. Riggs, 60, 1–32. doi:10.1130/2021.0060(01)
Hickman, S. H., Healy, J. H., and Zoback, M. D. (1985). In situ stress, natural fracture distribution, and borehole elongation in the Auburn geothermal well, Auburn, New York. J. Geophys. Res. Solid Earth 90 (B7), 5497–5512. doi:10.1029/jb090ib07p05497
Hodgson, R. A. (1961). Classification of structures on joint surfaces. Am. J. Sci. 259 (7), 493–502. doi:10.2475/ajs.259.7.493
Hooker, J. N., Katz, R. F., Laubach, S. E., Cartwright, J., Eichhubl, P., Ukar, E., et al. (2023a). Fracture-pattern growth in the deep, chemically reactive subsurface. J. Struct. Geol. 173, 104915. doi:10.1016/j.jsg.2023.104915
Hooker, J. N., Laubach, S. E., Gomez, L. A., Marrett, R., Eichhubl, P., Diaz-Tushman, K., et al. (2011). Fracture size, frequency, and strain in the cambrian Eriboll Formation sandstones, NW Scotland. Scott. J. Geol. 47, 45–56. doi:10.1144/0036-9276/01-420
Hooker, J. N., Laubach, S. E., and Marrett, R. (2013). Fracture-aperture size—frequency, spatial distribution, and growth processes in strata-bounded and non-strata-bounded fractures, Cambrian Mesón Group, NW Argentina. J. Struct. Geol. 54, 54–71. doi:10.1016/j.jsg.2013.06.011
Hooker, J. N., Laubach, S. E., and Marrett, R. (2014). A universal power-law scaling exponent for fracture apertures in sandstones. Geol. Soc. Am. Bull. 126 (9-10), 1340–1362. doi:10.1130/B30945.1
Hooker, J. N., Laubach, S. E., and Marrett, R. (2018). Microfracture spacing distributions and the evolution of fracture patterns in sandstones. J. Struct. Geol. 108, 66–79. doi:10.1016/j.jsg.2017.04.001
Hooker, J. N., Marrett, R., and Wang, Q. (2023b). Rigorizing the use of the coefficient of variation to diagnose fracture periodicity and clustering. J. Struct. Geol. 168, 104830. doi:10.1016/j.jsg.2023.104830
Huang, Y., Stansberry, A. R., Lipnikov, K., Moulton, J. D., Hyman, J. D., Sweeney, M. R., et al. (2024). Coupled thermo-hydro-mechanical modeling in enhanced geothermal systems. In ARMA US rock mechanics/geomechanics symposium (p. D021S010R006). ARMA June 2024.
Isachsen, Y. W. (1974). Fracture analysis of New York State using multi-stage remote sensor data and ground study; possible application to plate tectonic modeling. Proceedings of the First International Conference on the New Basement Tectonics. Contribution No. 24, 200–217. Available online at: https://archives.datapages.com/data/uga/data/091/091001/200_ugs0910200.htm.
Isachsen, Y. W. (1975). Possible evidence for contemporary doming of the Adirondack Mountains, New York, and suggested implications for regional tectonics and seismicity. Tectonophysics 29 (1–4), 169–181. doi:10.1016/b978-0-444-41420-5.50023-x
Isachsen, Y. W., and McKendree, W. G. (1977). “Preliminary brittle structures map of New York, New York state museum,” in Map and chart series, 31 (Albany, NY: New York State Museum).
Jacobi, R., Starr, J., Eckert, C., Mitchell, C., and Leaver, A. (2021). Relay ramps and rhombochasms in the northern Appalachian Basin: extensional and strike-slip tectonics in the marcellus Formation and utica Group. AAPG Bull. 105 (10), 2093–2124. doi:10.1306/04232120046
Jacobi, R. D., and Fountain, J. (2002). The character and reactivation history of the southern extension of the seismically active Clarendon–Linden Fault System, western New York State. Tectonophysics 353 (1-4), 215–262. doi:10.1016/s0040-1951(02)00284-6
Jordan, T., Fulton, P., Tester, J., Bruhn, D., Asanuma, H., Harms, U., et al. (2020). Borehole research in New York State can advance utilization of low-enthalpy geothermal energy, management of potential risks, and understanding of deep sedimentary and crystalline geologic systems. Sci. Drill. 28, 75–91. doi:10.5194/sd-28-75-2020
Kastner, M., and Siever, R. (1979). Low temperature feldspars in sedimentary rocks. Am. J. Sci. 279 (4), 435–479. doi:10.2475/ajs.279.4.435
Lander, R. H., Larese, R. E., and Bonnell, L. M. (2008). Toward more accurate quartz cement models—the importance of euhedral vs. non-euhedral growth rates. AAPG Bull. 92, 1537–1564. doi:10.1306/07160808037
Lander, R. H., and Laubach, S. E. (2015). Insights into rates of fracture growth and sealing from a model for quartz cementation in fractured sandstones. Geol. Soc. Am. Bull. 127 (3-4), 516–538. doi:10.1130/B31092.1
Lander, R. H., and Walderhaug, O. (1999). Porosity prediction through simulation of sandstone compaction and quartz cementation. AAPG Bull. 83, 433–449. doi:10.1306/00AA9BC4-1730-11D7-8645000102C1865D
Landing, E., Franzi, D. A., Hagadorn, J. W., Westrop, S. R., Kroger, B., and Dawson, J. C. (2007). “Cambrian of East Laurentia: field workshop in eastern New York and western Vermont,” in Ediacaran–ordovician of east Laurentia – S.W. Ford memorial volume, New York state museum bulletin no. Editors E. Landing 510, 25–80.
Landing, E., Webster, M., and Bowser, S. S. (2024). “Terminal Ediacaran–Late Ordovician evolution of the NE Laurentia palaeocontinent: rift–drift–onset of Taconic Orogeny, sea-level change and ‘Hawke Bay’ onlap (not offlap),” in Geological society, London, special publications. Editors R. D. Nance, R. A. Strachan, C. Quesada, and S. Lin 542 (1). doi:10.1144/SP542-2023-4
Landing, E. D., Amati, L., and Franzi, D. A. (2009). Epeirogenic transgression near a triple junction: the oldest (latest early–middle Cambrian) marine onlap of cratonic New York and Quebec. Geol. Mag. 146 (4), 552–566. doi:10.1017/s0016756809006013
Laubach, S. E. (1997). A method to detect natural fracture strike in sandstones. AAPG Bull. 81 (4), 604–623. doi:10.1306/522B43E3-1727-11D7-8645000102C1865D
Laubach, S. E. (2003). Practical approaches to identifying sealed and open fractures. AAPG Bull. 87 (4), 561–579. doi:10.1306/11060201106
Laubach, S. E., and Diaz-Tushman, K. (2009). “Laurentian palaeostress trajectories and ephemeral fracture permeability, cambrian Eriboll Formation sandstones west of the moine thrust zone, NW Scotland,”J. Geol. Soc. Lond., 166. 349–362. doi:10.1144/0016-76492008-061
Laubach, S. E., Fall, A., Copley, L. K., Marrett, R., and Wilkins, S. (2016). Fracture porosity creation and persistence in a basement-involved Laramide fold, Upper Cretaceous Frontier Formation, Green River Basin, U.S.A. Geological Magazine 153(5/6), 887–910. Geol. Mag. 153, 887–910. doi:10.1017/S0016756816000157
Laubach, S. E., and Gale, J. F. W. (2006). Obtaining fracture information for low-permeability (tight) gas sandstones from sidewall cores. J. Petroleum Geol. 29 (2), 147–158. doi:10.1111/j.1747-5457.2006.00147.x
Laubach, S. E., Lander, R. H., Criscenti, L. J., Anovitz, L. M., Urai, J. L., Pollyea, R. M., et al. (2019). The role of chemistry in fracture pattern development and opportunities to advance interpretations of geological materials. Rev. Geophys. 57 (3), 1065–1111. doi:10.1029/2019rg000671
Laubach, S. E., Marrett, R., and Olson, J. (2000). New directions in fracture characterization. Lead. Edge 19 (7), 704–711. doi:10.1190/1.1438694
Laubach, S. E., Olson, J. E., and Gross, M. R. (2009). Mechanical and fracture stratigraphy. AAPG Bull. 93 (11), 1413–1426. doi:10.1306/07270909094
Laubach, S. E., Zeng, L., Hooker, J. N., Wang, Q., Zhang, R. H., Wang, J., et al. (2023). Deep and ultra-deep basin brittle deformation with focus on China. J. Struct. Geol. 175, 104938. doi:10.1016/j.jsg.2023.104938
Lawrence, D. E. (2001). Building stones of Canada's federal parliament buildings. Geosci. Can. 28 (1), 13–30.
Li, L., and Ji, S. (2021). A new interpretation for formation of orthogonal joints in quartz sandstone. J. Rock Mech. Geotechnical Eng. 13 (2), 289–299. doi:10.1016/j.jrmge.2020.08.003
Lochman-Balk, C., and Wilson, J. L. (1958). Cambrian biostratigraphy in North America. J. Paleontology 32 (2), 312–350.
Lombard, D. B. (1983). An evaluation of potential geothermal reservoirs in central and western New York state. Final Report, ERDA No. New York State Energy Research and Development Authority. 83–84. doi:10.1016/j.geothermics.2024.102925
Lowe, D. G., Brink, R., Mehrtens, C., and Franzi, D. A. (2015). Stratigraphy and terrestrial to shallow marine environments of the Potsdam Group in the southwestern Ottawa embayment. New York State Geological Association 87th annual meeting guidebook, 143–189.
Lundegard, P. D. (1992). Sandstone porosity loss; a “big picture” view of the importance of compaction. J. Sediment. Res. 62 (2), 250–260. doi:10.1306/d42678d4-2b26-11d7-8648000102c1865d
Lynch, R. S., and Castor, T. P. (1983). “Final report. No. NYSERDA-84-18-Vol. 6. Donohue, Anstey and Morrill, Boston, MA (USA); ENG, Inc,” in Auburn low-temperature geothermal well (Boston, MA), 6.
Makowitz, A., and Milliken, K. L. (2003). Quantification of brittle deformation in burial compaction, Frio and Mount Simon Formation sandstones. J. Sediment. Res. 73 (6), 1007–1021. doi:10.1306/051003731007
Manspeizer, W. (1988). Triassic–Jurassic rifting and opening of the Atlantic: an overview. Dev. Geotect. 22, 41–79. doi:10.1016/b978-0-444-42903-2.50008-7
Marrett, R., Gale, J. F. W., Gomez, L., and Laubach, S. E. (2018). Correlation analysis of fracture arrangement in space. J. Struct. Geol. 108, 16–33. doi:10.1016/j.jsg.2017.06.012
Martel, S. J. (2017). Progress in understanding sheeting joints over the past two centuries. J. Struct. Geol. 94, 68–86. doi:10.1016/j.jsg.2016.11.003
Mazzullo, S. J., Agostino, P., Seitz, J. N., and Fisher, D. W. (1978). Stratigraphy and depositional environments of the upper Cambrian-lower Ordovician sequence, Saratoga Springs, New York, J. Sediment. Res. 48, 99–116. doi:10.1306/212F7405-2B24-11D7-8648000102C1865D
McBride, E. F. (1963). A classification of common sandstones. J. Sediment. Petrology 33, 664–669. doi:10.1306/74D70EE8-2B21-11D7-8648000102C1865D
Montario, M. J., and Garver, J. I. (2009). The thermal evolution of the Grenville terrane revealed through U-Pb and fission-track analysis of detrital zircon from Cambro-Ordovician quartz arenites of the Potsdam and Galway Formations. J. Geol. 117, 595–614. doi:10.1086/605778
Mount, V. S. (2014). Structural style of the Appalachian Plateau fold belt, north-central Pennsylvania. J. Struct. Geol. 69, 284–303. doi:10.1016/j.jsg.2014.04.005
Muffler, P., and Cataldi, R. (1978). Methods for regional assessment of geothermal resources. Geothermics 7 (2-4), 53–89. doi:10.1016/0375-6505(78)90002-0
Nadan, B. J., and Engelder, T. (2009). Microcracks in New England Granitoids: A record of thermoelastic relaxation during exhumation of intracontinental crust. Geol. Soc. Am. Bull. 121 (1/2) preprint, 1–99. doi:10.1130/B26202.1
Nastev, M., Morin, R., Godin, R., and Rouleau, A. (2008). Developing conceptual hydrogeological model for Potsdam sandstones in southwestern Quebec, Canada. Hydrogeology J. 16, 373–388. doi:10.1007/s10040-007-0267-9
Ogali, O. I., and Orodu, O. D. (2022). Fault characterization and flow barrier detection using capacitance-resistance model and diagnostic plots. J. Petroleum Sci. Eng. 209, 109817. doi:10.1016/j.petrol.2021.109817
Ogilvie, S. R., Orribo, J. M., and Glover, P. W. J. (2001). The influence of deformation bands upon fluid flow using profile permeametry and positron emission tomography. Geophys. Res. Lett. 28 (1), 61–64. doi:10.1029/2000gl008507
Olson, J. E., Laubach, S. E., and Eichhubl, P. (2010). Estimating natural fracture producibility in tight gas sandstones: coupling diagenesis with geomechanical modeling. Lead. Edge 29 (12), 1494–1499. doi:10.1190/1.3525366
Olson, J. E., Laubach, S. E., and Lander, R. H. (2009). Natural fracture characterization in tight gas sandstones: Integrating mechanics and diagenesis. AAPG Bull. 93, 1535–1549. doi:10.1306/08110909100
Olson, J. E., Laubach, S. E., and Lander, R. L. (2007). “Combining diagenesis and mechanics to quantify fracture aperture distributions and fracture pattern permeability,” in Fractured reservoirs, geological society of London special publication. Editors L. Lonergan, R. J. Jolley, D. J. Sanderson, and K. Rawnsley 270, 97–112.
Ortega, O. J., Marrett, R., and Laubach, S. E. (2006). A scale-independent approach to fracture intensity and average spacing measurement. AAPG Bull. 90 (2), 193–208. doi:10.1306/08250505059
Otvos, E. G. (1966). Sedimentary structures and depositional environments, Potsdam Formation, Upper Cambrian. AAPG Bull. 50 (1), 159–165. doi:10.1306/5D25B473-16C1-11D7-8645000102C1865D
Paxton, S. T., Szabo, J. O., Ajdukiewicz, J. M., and Klimentidis, R. E. (2002). Construction of an intergranular volume compaction curve for evaluating and predicting compaction and porosity loss in rigid-grain sandstone reservoirs. AAPG Bull. 86 (12), 2047–2067. doi:10.1306/61eeddfa-173e-11d7-8645000102c1865d
Peacock, D. C. P., Sanderson, D. J., and Leiss, B. (2022). Use of analogue exposures of fractured rock for Enhanced Geothermal Systems. Geosciences 12 (9), 318. doi:10.3390/geosciences12090318
Pferd, J. W. (1981). Geology, drill holes, and geothermal energy potential of the basal Cambrian rock units of the Appalachian Basin of New York State, Technical Report osti.gov No. NYSERDA. TAL Res. Dev., 81–14. doi:10.2172/6677802
Philip, Z. G., Jennings, J. W., Olson, J. E., Laubach, S. E., and Holder, J. (2005). Modeling coupled fracture-matrix fluid flow in geomechanically simulated fracture networks. SPE Reserv. Eval. Eng. 8 (4), 300–309. doi:10.2118/77340-pa
Pickering, G., Bull, J. M., and Sanderson, D. J. (1995). Sampling power-law distributions. Tectonophysics 248 (1-2), 1–20. doi:10.1016/0040-1951(95)00030-q
Pinilla, D., Fulton, P., Fulcher, S., and Jordan, T. (2023). “Geomechanical analysis for target sequences in the Cornell University Borehole Observatory CUBO geothermal exploration well, Ithaca NY,” in ARMA US Rock Mechanics/Geomechanics Symposium paper ARMA-2023-0890. doi:10.56952/ARMA-2023-0890
Plumb, R. A., and Hickman, S. H. (1985). Stress-induced borehole elongation: A comparison between the four-arm dipmeter and the borehole televiewer in the Auburn geothermal well. J. Geophys. Res. Solid Earth 90 (B7), 5513–5521. doi:10.1029/jb090ib07p05513
Pollard, D. D., and Aydin, A. (1988). Progress in understanding jointing over the past century. Geol. Soc. Am. Bull. 100 (8), 1181–1204. doi:10.1130/0016-7606(1988)100<1181:piujot>2.3.co;2
Potysz, A., and Bartz, W. (2022). Bioweathering of minerals and dissolution assessment by experimental simulations—Implications for sandstone rocks: A review. Constr. Build. Mater. 316, 125862. doi:10.1016/j.conbuildmat.2021.125862
Rayburn, J. A., Franzi, D. A., and Knuepfer, P. L. K. (2007). Evidence from the Lake Champlain Valley for a later onset of the Champlain Sea and implications for late glacial meltwater routing to the North Atlantic. Palaeogeogr. Palaeoclimatol. Palaeoecol. 246 (1), 62–74. doi:10.1016/j.palaeo.2006.10.027
Rayburn, J. A., Knuepfer, P. L., and Franzi, D. A. (2005). A series of large, Late Wisconsinan meltwater floods through the Champlain and Hudson Valleys, New York State, USA. Quat. Sci. Rev. 24 (22), 2410–2419. doi:10.1016/j.quascirev.2005.02.010
Repetski, J. E., Ryder, R. T., Weary, D. J., Harris, A. G., and Trippi, M. H. (2014). “Thermal maturity patterns (conodont color alteration index and vitrinite reflectance) in Upper Ordovician and Devonian rocks of the Appalachian basin: A major revision of USGS Map I-917-E using new subsurface collections,” in Coal and petroleum resources in the Appalachian basin: distribution, geologic framework, and geochemical character, Professional Paper 1708-F.1. US Geological Survey.
Rickard, L. V. (1975). “Correlation of the Silurian and Devonian rocks in New York State,” in Map and Chart Series Number (Albany, NY: New York State Museum and Science Service), 24, 16.
Robinson, P., Tucker, R. D., Bradley, D., Berry IV, H. N., and Osberg, P. H. (1998). Paleozoic orogens in New England, USA. GFF 120 (2), 119–148. doi:10.1080/11035899801202119
Sanderson, D. J. (2016). “Field-based structural studies as analogues to sub-surface reservoirs,” in The value of outcrop studies in reducing subsurface uncertainty and risk in hydrocarbon exploration and production, geol. Soc.,. Editors M. B. J. Bowman, H. R. Smyth, T. R. Good, S. R. Passey, J. P. P. Hirst, and C. J. Jordan (London: Special Publications) 436, 207–217. doi:10.1144/sp436.5
Sanderson, D. J., and Nixon, C. W. (2015). The use of topology in fracture network characterization. J. Struct. Geol. 72, 55–66. doi:10.1016/j.jsg.2015.01.005
Sanford, B. V., and Arnott, R. W. C. (2010). Stratigraphic and structural framework of the Potsdam Group in eastern Ontario, western Quebec, and northern New York State. Geological Survey of Canada. Bulletin 597, 83. doi:10.4095/247673
Selleck, B. W. (1997). Potsdam Sandstone of the southern Lake Champlain Valley: Sedimentary facies, environments and diagenesis: New England Intercollegiate Geology Conference, Field Trip Guidebook, pC3-1–16.
Shakiba, M., Lake, L. W., Gale, J. F. W., and Pyrcz, M. J. (2022). Multiscale spatial analysis of fracture arrangement and pattern reconstruction using Ripley’s K-Function. J. Struct. Geol. 155, 104531. doi:10.1016/j.jsg.2022.104531
Smith, L. B. (2006). Origin and reservoir characteristics of Upper Ordovician Trenton–Black River hydrothermal dolomite reservoirs in New York. AAPG Bull. 90 (11), 1691–1718. doi:10.1306/04260605078
Snee, J. E. L., and Zoback, M. D. (2022). State of stress in areas of active unconventional oil and gas development in North America. AAPG Bull. 106 (2), 355–385. doi:10.1306/08102120151
Somma, R., Blessent, D., Raymond, J., Constance, M., Cotton, L., De Natale, G., et al. (2021). Review of recent drilling projects in unconventional geothermal resources at Campi Flegrei Caldera, Cornubian Batholith and Williston sedimentary basin. Energies 14 (11), 3306. doi:10.3390/en14113306
Stanley, R. S. (1980). Mesozoic faults and their environmental significance in western Vermont. Vt. Geol. 1, 22–32.
Steele-MacInnis, M., Lecumberri-Sanchez, P., and Bodnar, R. J. (2012). HokieFlincs_H2O-NaCl: A Microsoft Excel spreadsheet for interpreting microthermometric data from fluid inclusions based on the PVTX properties of H2O–NaCl. Comput. Geosciences 49, 334–337. doi:10.1016/j.cageo.2012.01.022
Stokes, D. J. (2008). Principles and practice of variable pressure/environmental scanning electron microscopy (VP-ESEM). West Sussex: John Wiley and Sons.ISBN780470065402.
Sweeney, M. R., Hyman, J. D., O’Malley, D., Santos, J. E., Carey, J. W., Stauffer, P. H., et al. (2023). Characterizing the impacts of multi-scale heterogeneity on solute transport in fracture networks. Geophys. Res. Lett. 50 (21), e2023GL104958. doi:10.1029/2023gl104958
Tai, N., and Gates, I. D. (2024). Cyclic CO2 storage and geothermal energy extraction using a huff and puff technique in the Basal Cambrian Sandstone Unit, Canada. Geothermics 118, 102925. doi:10.1016/j.geothermics.2024.102925
Taylor, J. P., and Fitzgerald, P. G. (2011). Low-temperature thermal history and landscape development of the eastern Adirondack Mountains, New York: Constraints from apatite fission-track thermochronology and apatite (U-Th)/He dating, Geol. Soc. Am. Bull. 123(3-4), 412–426. doi:10.1130/B30138.1
Taylor, T. R., Lander, R. H., and Bonnell, L. M. (2022). Sandstone Petrography, Petrology, and Modeling. SEPM Concepts in Sedimentology and Paleontology No. 20. doi:10.2110/sepmcsp.13.12
Ukar, E., Laubach, S. E., and Hooker, J. N. (2019). Outcrops as guides to subsurface natural fractures: Example from the Nikanassin Formation tight-gas sandstone, Grande Cache, Alberta foothills, Canada. Mar. Petroleum Geol. 103, 255–275. doi:10.1016/j.marpetgeo.2019.01.039
Valentino, D. W., Valentino, J. D., Chiarenzelli, J. R., and Inclima, R. W. (2016). Faults and fracture systems in the basement rocks of the Adirondack Mountains, New York. Adirondack Journal of Environmental Studies 21(1). Article 10, 101–117.
Vidal, J., and Genter, A. (2018). Overview of naturally permeable fractured reservoirs in the central and southern Upper Rhine Graben: Insights from geothermal wells. Geothermics 74, 57–73. doi:10.1016/j.geothermics.2018.02.003
Watanabe, K., and Takahashi, H. (1995). Fractal geometry characterization of geothermal reservoir fracture networks. J. Geophys. Res. Solid Earth 100 (B1), 521–528. doi:10.1029/94jb02167
Weary, D. J., Ryder, R. T., and Nyahay, R. (2000). Thermal maturity patterns (CAI and% Ro) in the Ordovician and Devonian rocks of the Appalachian basin in New York State (No. 2000-496). US Geological Survey.
Wiesnet, D. R. (1961). Composition, grain size, roundness, and sphericity of the Potsdam Sandstone (Cambrian) in northeastern New York. J. Sediment. Petrology 31 (1), 5–14. doi:10.1306/74D70AE7-2B21-11D7-8648000102C1865D
Williams, J. H., Paillet, F. L., Franzi, D. A., and Romanowicz, E. A. (2010b). “Borehole flows, hydraulic heads, and fracture-zone connection in the Potsdam Sandstone at the Altona Flat Rock Research Site in Northern New York,” in 23rd EEGS Symposium on the Application of Geophysics to Engineering and Environmental Problems, European Association of Geoscientists and Engineers, 45–49. doi:10.4133/1.3445470
Williams, J. H., Reynolds, R. J., Franzi, D. A., Romanowicz, E. A., and Paillet, F. L. (2010a). Hydrogeology of the Potsdam Sandstone in Northern New York. Can. Water Resour. J. 35 (4), 399–416. doi:10.4296/cwrj3504399
Wilson, A. E. (1946). Geology of the Ottawa-St. Lawrence Lowland, Ontario and Quebec. Geological Survey of Canada. Memoir 241, 66. doi:10.4095/101632
Keywords: analog, diagenesis, connectivity, fracture, geothermal, network, permeability, scaling
Citation: Elliott SJ, Forstner SR, Wang Q, Corrêa R, Shakiba M, Fulcher SA, Hebel NJ, Lee BT, Tirmizi ST, Hooker JN, Fall A, Olson JE and Laubach SE (2025) Diagenesis is key to unlocking outcrop fracture data suitable for quantitative extrapolation to geothermal targets. Front. Earth Sci. 13:1545052. doi: 10.3389/feart.2025.1545052
Received: 13 December 2024; Accepted: 13 February 2025;
Published: 02 April 2025.
Edited by:
Huan Li, Central South University, ChinaReviewed by:
Martina Zucchi, University of Bari Aldo Moro, ItalyGuilhem Hoareau, Université de Pau et des Pays de l’Adour, France
Copyright © 2025 Elliott, Forstner, Wang, Corrêa, Shakiba, Fulcher, Hebel, Lee, Tirmizi, Hooker, Fall, Olson and Laubach. This is an open-access article distributed under the terms of the Creative Commons Attribution License (CC BY). The use, distribution or reproduction in other forums is permitted, provided the original author(s) and the copyright owner(s) are credited and that the original publication in this journal is cited, in accordance with accepted academic practice. No use, distribution or reproduction is permitted which does not comply with these terms.
*Correspondence: S. J. Elliott, c2FyYS5lbGxpb3R0QGJlZy51dGV4YXMuZWR1
†R. Corrêa, Petrobras S.A., Rio de Janeiro, Rio de Janeiro, Brazil
‡ORCID: S. J. Elliott: orcid.org/0000-0002-7457-1442; Q. Wang: orcid.org/0000-0003-2173-5404; R. Corrêa: orcid.org/0000-0002-6876-3499; S. A. Fulcher: orcid.org/0000-0002-0711-3935;J. N. Hooker: orcid.org/0000-0002-0711-3935; J. E. Olson: orcid.org/0000-0002-0711-3935; S. E. Laubach: orcid.org/0000-0003-2511-9414