 Yangfei Yu1,2*
 Jianguo Li
- 1China University of Petroleum, Beijing, China
- 2Mahu Exploration and Development Project Department, Xinjiang Oilfield Branch Company, Petro China, Karamay, Xinjiang, China
- 3Junggar Project Department, CNPC Engineering Technology R&D Company Limited, Karamay, Xinjiang, China
- 4China University of Geosciences, Beijing, China
Accurate rate of penetration (ROP) prediction is important for optimizing drilling parameters, selecting drilling tools, improving drilling efficiency, and reducing operation cost. The study area is deep lacustrine shale oil in Mahu, with alkaline lacustrine sediment and strong non-homogeneity, the spatial variation of ROP is fast and cannot be accurately predicted. The selection of drilling parameters and drilling tools are not targeted, especially there is a good correspondence between ROP and the formation resistivity by statistics. In the paper, a new method for well-seismic joint data-driven resistivity-based prediction of 3D spatial ROP based on geologic factors is presented. The advantage of this method is that the geological factors are invariant, and when the engineering factors change and the technological progress is upgraded, only the ROP of the formation needs to be recalibrated with new representative wells. Existing research on ROP prediction mainly focuses on 1D spatial, physical-driven, data-driven, fusion of drilling and logging information, multiple regression, and AI algorithm. The method described in the paper is a new, original, and advanced method. It can be used for accurate prediction of 3D spatial ROP. The specific idea is as follows: Classify the formation hard-to-drill grade based on the unsupervised neural network (UNN) for logging resistivity, construct the resistivity classification template, determine the ROP of each hard-to-drill stratigraphy from the ROP of the drilled wells, obtain the 3D spatial resistivity model by using the well-seismic joint data-driven method, classify the resistivity model into hard-to-drill grades and assign the ROP. The geological background of shale oil in Fengcheng formation is summarized, and the current status and difficulties of drilling engineering in the study area are summarized. The method principle and implementation steps are described in detail from five aspects: the relationship between resistivity and ROP, the technical process of predicting 3D spatial ROP, stratigraphy classification based on logging resistivity and calibration of ROP, 3D seismic data processing and facies-controlled resistivity attribute modeling, and prediction of 3D spatial ROP, and an application example of the development well is given. As verified by the example, the predicted ROP of this method is basically consistent with the actual ROP, which effectively guides the selection of drill bits, personalized drill bit design, and optimization of drilling parameters.
1 Introduction
Drillability is the ability of a rock to resist fragmentation by a drill bit (Gan et al., 2021), commonly represented by indicators sunch as rate of penetration (ROP) (Khosravimanesh et al., 2024; Zeng et al., 2023; Qi et al., 2019), drilling rate index (DRI) (Shahani et al., 2024; Kamran, 2021; Khandelwal and Armaghani, 2015), drillability grade (Kd) (Cheng et al., 2024; Li et al., 2021; Geng et al., 2014). The drillability of rocks can be theoretically determined by a laboratory physical simulation device. An experimental standard rock sample is made from the core of engineering coring, and the drilling process is simulated by using a microbit, applying a certain weight on bit (WOB) and rotary speed to the microbit, and recording the drilling time at a drilling depth of 2–3 mm to calculate the drillability grade (Feng and Wang, 2022; Kong et al., 2022). Due to the limitation of the number of engineering coring and the difficulty of the experimental environment to simulate the temperature and pressure at the bottom of the well, the drillability grade determined by the drillability experiments are 1D discrete data with low accuracy. To overcome this problem, many scholars have applied statistical models (Chen et al., 2020) and machine learning models (Mahmoud and Elkatatny, 2023) to compute continuous 1D formation drillability models, and combined with seismic data to realize 3D formation drillability modeling (Qi et al., 2019).
ROP indicates the footage per unit time, which most intuitively and figuratively reflects the drilling operation time and cost (Qi et al., 2019). In the field of petroleum drilling, accurate prediction of ROP is of great significance for optimizing drilling parameters, selecting tools and equipment, improving drilling efficiency, and reducing operating costs (Eskandarian et al., 2017), especially during the period of global oil price downturn. The factors that affect ROP include geological and engineering factors. Among them, engineering factors can be categorized into controllable and uncontrollable factors (Tookallo and Sohbatzadeh, 2023; Sabah et al., 2019). Controllable drilling factors are WOB, RPM, torque (T), standpipe pressure (SPP), etc., and uncontrollable drilling factors are bit size, drilling fluid physicochemical properties, etc. Controllable factors do not affect each other, while uncontrollable factors affect each other (Soares and Gray, 2019). Therefore, ROP prediction can be studied from both geological and engineering factors in two ideas.
Many scholars have conducted research on 1D ROP prediction. Hegde et al. (2017) compared physics driven and data-driven modeling methods for ROP and proposed a confidence interval method for predicting ROP for drilling decisions. Ashrafi et al. (2019) believed that eight parameters, including drilling pressure, drill bit speed, pump flow rate, pump pressure, pore pressure, gamma rays, density logging, and shear wave velocity, have the greatest impact on ROP. They constructed eight hybrid artificial neural networks, including genetic algorithm (GA), particle swarm optimization algorithm (PSO), biogeography-based optimization algorithm (BBO), etc. The hybrid artificial neural network showed higher efficiency and reliability. Hashemizadeh et al. (2022) inputted 11 parameters into nine machine learning models and found that random forest (RF) and artificial neural network (ANN) had high accuracy in predicting ROP. Ji et al. (2023) proposed a Long Short Term Memory Neural Network (LSTM) method that improved the accuracy of predicting ROP. Oyedere and Gray (2020) represented ROP as a function of weight on bit (WOB), flow rate, rotational speed (RPM), and uniaxial compressive strength (UCS), and established classification models using five different machine learning algorithms: logistic regression, linear discriminant analysis (LDA), quadratic discriminant analysis (QDA), support vector machine (SVM), and random forest (RT). Ebrahimabadi and Afradi (2024) applied three artificial intelligence algorithms which are Grey Wolf Optimization (GWO), Particle Swarm Optimization (PSO), and Grasshoperl Optimization (GOA), to predict ROP. Research has shown that all of them can produce good prediction results, but GOA is more accurate. Wang et al. (2024) proposed a ROP prediction method based on PCA informer. Compared with recurrent neural networks (RNN) and long short-term memory neural networks (LSTM), this method has significant advantages and provides a new solution for improving drilling speed. Osman et al. (2021) comprehensively considered drilling machinery parameters, wellbore cleaning parameters, and formation properties, and used the Random Forest (RF) algorithm to predict the ROP of horizontal wells in carbonate rock formations. Al AbdulJabbar et al. (2022) used artificial neural networks (ANN) to learn drilling machinery parameters and predict ROP in gas bearing sandstone formations.
Many scholars have conducted research on 3D spatial ROP prediction. Geng et al. (2014) expressed drillability grade in terms of velocity and density, obtained 3D velocity bodies through seismic inversion with logging constraints, and realized 3D spatial drillability prediction by calculating drillability grade with the velocity bodies. Qi et al. (2015) predicted 3D spatial petrophysical attributes through pre-stack seismic inversion, and used multivariate linear regression (MLR) to optimize three main attributes related to ROP, and use artificial neural network (ANN) and alternating conditional expectation (ACE) algorithms to predict 3D spatial ROP, respectively. Song (2018) used data fitting regression method, based on logging data, which were combined with the core experimental data to establish the relationship between the rock mechanical parameters and logging data, using the multiple well data to construct a 3D spatial drillability grade model of the study area using the idea of attribute modeling. Qietal (2019) extracted 3D seismic attributes and geomechanical attributes of 1,036 km2, combined with data from 51 horizontal wells, and used proximal support vectors (PSVM) to relate ROP to seismic attributes and geomechanical attributes, and predicted the non-homogeneous ROP of mississippian limestone reservoirs. Gan et al. (2021) used fuzzy c-means clustering algorithm to determine the patterns of formations, and established the drillability grade models of various formation patterns separately by random forest (RF) algorithm, and finally combined them into a 3D spatial drillability grade model.
The study area is deep lacustrine shale oil in Mahu, with alkaline lacustrine sediment and strong non-homogeneity, and the ROP of the formation statistically has a good correspondence with the resistivity of the formation. In order to reveal the drillability distribution law of the formation in the study area, and to guide the drilling design, work tool preference, drill bit personalized design, and drilling parameter optimization, a 3D spatial of ROP prediction study is carried out. In the paper, based on the unsupervised neural network (UNN), we classify the logging resistivity to divide the formation hard-to-drill grade, construct resistivity classification template, determine the ROP of each hard-to-drill grade from the ROP of the already drilled wells, get the 3D spatial resistivity model by adopting the combined data-driven method of well-seismic, and then classify the resistivity model into hard-to-drill grades based on the classification template, and assign ROP. In the paper, the ROP in 3D spatial is predicted from the geological factors.
The paper is organized as follows. The second part summarizes the geological background of the Fengcheng Formation shale oil structural features, sedimentary features, lithological features, and so on. The third part describes the current status and difficulties of drilling engineering in the study area, including rate of penetration characteristics, drilling duration, bit wear characteristics, and core testing. The fourth part details the 3D spatial rate of penetration prediction method, including the statistical relationship between formation resistivity and ROP, well data cleaning, unsupervised neural network (UNN) classification of formation hard-to-drill class, construction of classification templates, ROP calibration, seismic data preprocessing, preparation of structural horizon, well and seismic joint data-driven resistivity modeling, and ROP modeling. The fifth part details the drilling engineering applications of rate of penetration modeling. The sixth part is discussion. The seventh part summarizes the full paper.
2 Geologic background of shale oil in fengcheng formation
The Mahu Sag is located in the northwestern margin of the Junggar Basin, with an area of about 5,000 km2 (Liu et al., 2020), surrounded by secondary tectonic units such as the Quartz Beach High, the Yingxi Sag, the Xiayan High, the Dabasong High, the Zhongguai High, the Kebai Fracture Zone, and the Wuxia Fracture Zone (Yu et al., 2022), which is an important hydrocarbon generating Sag in the basin (Zhi et al., 2019). It is an important hydrocarbon Sag in the basin (Zhi et al., 2019). Four sets of hydrocarbon source rocks are developed in the Mahu Sag, namely, the Carboniferous, Lower Permian Jiamuhe Formation, Lower Permian Fengcheng Formation, and Middle Permian Lower Urho Formation (Li et al., 2020). The hydrocarbon source rocks of the Fengcheng Formation are the oldest alkaline lacustrine hydrocarbon source rocks in the world discovered so far, with thicknesses ranging from 50 to 250 m, with a maximum thickness of more than 400 m, rich in bacterial and algal matrices, with high organic matter abundance, predominantly of type II1, and with a strong hydrocarbon generating capacity and a long duration (Qu et al., 2019). The Fengcheng Formation is a fan-delta-alkaline lacustrine sedimentary system (Wang et al., 2022), developing a large suite of lacustrine mud shale and mica deposits, characterized by alkaline lacustrine basin, fine-grained deposition, integrated source and reservoir, and strong non-homogeneity, and industrial breakthroughs of shale oil have already been achieved (Huang et al., 2022; Zhi et al., 2021).
The Fengcheng Formation is buried at a depth of 4,000–8,000 m, and it is divided into lower Fengcheng Formation (P1f1), middle Fengcheng Formation (P1f2), and upper Fengcheng Formation (P1f3) from the bottom upward. P1f1 is mainly a volcaniclastic rock, and P1f2 and P1f3 are dominated by dark fine-grained sediments, with the development of cloudy siltstone, silty sandy dolomite, mud-crystalline dolomite, and cloudy mudstone, etc.; among them, P1f2 is the heyday period of the development of alkaline lacustrine (Wang et al., 2023). P1f2 is the heyday of alkaline lacustrine development, and alkali minerals such as silica-boronatite and carbonatite-calcite are developed (Wang et al., 2023). The reservoir of Fengcheng Formation is dense, with porosity ranging from 0.10% to 13.60%, with an average of 4.61%, and permeability ranging from 0.010 to 13.800 mD, with an average of 0.134 mD, which is a typical characteristic of shale oil reservoirs (Yu et al., 2022).
3 Current status and difficulties of drilling engineering in the study area
The study area is located in the northern part of Mahu Sag, and the shale oil of Fengcheng Formation of the Permian System of Mabei Fan. Fengcheng Formation shows the characteristics of overall oil-bearing and local enrichment, with 135 million tons of whole control reserves and 100 million tons of proved reserves basically implemented, which is the main block for future scale efficiency development. P1f3 is mainly dark gray muddy dolomite, sandwiched with dark gray cloudy mudstone and silty mudstone. P1f2 is mainly dark gray thinly bedded muddy dolomite and cloudy mudstone interbedded with creamy siltstone. From top to bottom, the strata encountered in the drilling are the Tugulu Formation, the Toutunhe Formation, the Xishanyao Formation, the Sangonghe Formation, the Badaowan Formation, the Baijiantan Formation, the Karamay Formation, the Baikouquan Formation, the Urho Formation, the Xiazijie Formation, and the Fengcheng Formation.
In 2024, six pilot test wells were deployed, with the destination layer P1f2 C9, C10, C12 sweet spot, TVD of 4,853–5,206 m. Third spud of the well structure: In the first spud, using Φ444.5 mm drill bit to drill to a depth of 500 m, lowering into Φ339.7 mm surface casing, cementing water mud is returned to the surface to seal the surface loose and easy to collapse formation; In the second spud, Φ311.2 mm drill bit is used to drill to the bottom of Xiazijie Formation to stabilize the stratigraphy, Φ244.5 mm technical casing is lowered, cementing mud is returned to the ground, and the well section at the top of Xiazijie Formation and above which is prone to collapse is sealed; Φ215.9 mm drill bit is used to drill to the final target point B, Ф139.7 mm oil casing is lowered, and cementing mud is returned to the ground. Drilling fluids: In the first spud, K1tg, Bentonite-CMC drilling fluid system; In the second spud, K2tg, potassium-calcium-based polymer drilling fluid system; In the third spud, K3tg, potassium-calcium-based organic salt drilling and completion fluid system. The formation pressure coefficient of the Tugulu Group (K1tg) to Baikouquan Formation (T1b) is 1.00–1.10 sg. The formation pressure coefficient of the Baikouquan Formation (T1b) to the Urho Formation (P2w) is 1.10–1.25 sg, and the density of the drilling fluid is 1.20–1.40 g/cm3. The formation pressure coefficient of the Fengcheng Formation is 1.31–1.79 sg, and the drilling fluid density is 1.80–2.00 g/cm3. For inclined section, PDC drill bit + Rotary Steering; for horizontal section, PDC drill bit + medium-high speed and high-torque screw, the drill bit is mainly 5-blade and 6-blade, the drilling parameters of the three In the first spud-well sections are shown in Table 1. Completion method: Cemented shot-hole completion.

Table 1. Drilling parameters of pilot test wells in the study area.
The three wells 5,101, 5,102 and 5,103 encountered ultra-high resistivity (>1,000), the number of trips drilled in the third spud was 16–27, the average footage of trips drilled was 106.9–112.7 m, the average ROP was 1.99–2.51 m/h, and the third spud had a working period of 69.2–98 day; The resistivity of 5,126, 5,127 and 5,128 wells is within normal range, the number of trips drilling is 7-9, the average footage of trips drilling is 230.9–301.6 m, the average ROP is 3.96–5.07 m/h, and the duration of trips drilling is 31–47.3 day; the detailed data are shown in Table 2; the furthest distance between the wellheads is only 4,200 m (5,126 wells and 5,103 wells). Comparison can be found that the three wells drilled with ultra-high resistivity formation have low ROP, many trips and long duration, which have obvious negative correlation with resistivity. The PDC drill bit has 100% newness into the well and 20% newness out of the well, and it is severely worn out, with ring fluted or hollowing as the major part of the drill bit, as shown in Figure 1. It can be seen that the spatial difference in the drillability of the formation in the study area is very large, showing strong non-homogeneity.
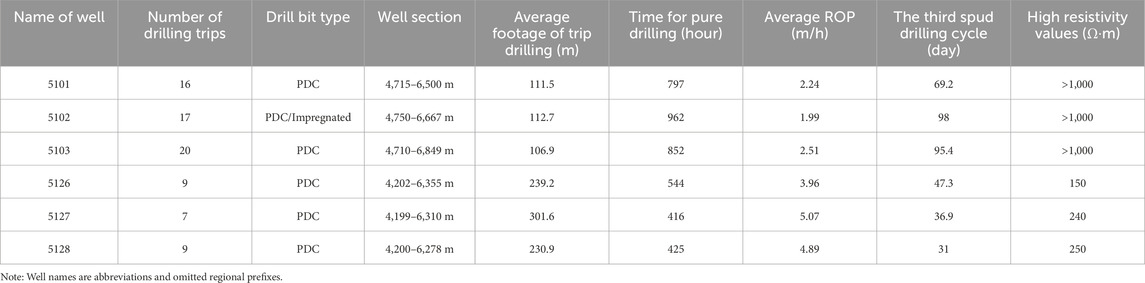
Table 2. Drilling metrics for the three-opening section of the pilot test well in the study area.
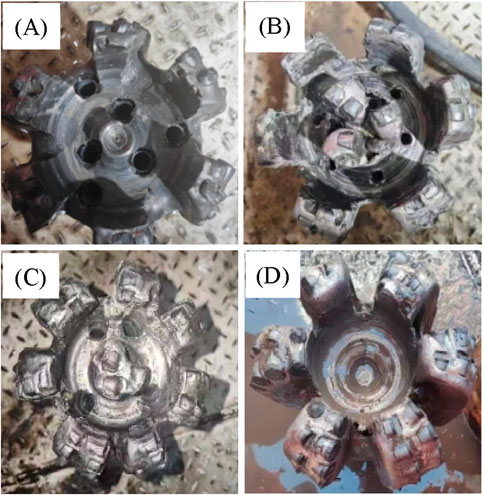
Figure 1. Photograph of drill bit exiting the well [(A, D) are hollowed, (B, C) are ring fluted. The PDC drill bit has 100% newness into the well and 20% newness out of the well, and it is severely worn out, with ring fluted or hollowing as the major part of the drill bit.].
The 5,103 wells of Fengcheng Formation have been cored with a length of 6 m and MD 5119–5,125 m (TVD 5028–5,030 m), which is equivalent to the bottom hole pressure of about 90 MPa. The mechanical properties of the rock have been tested, and the compressive strength of the rock under normal pressure is 250 MPa, and that of the rock under the overburden pressure of 90 MPa is 600 MPa as shown in Figure 2. The drillability test is carried out by using a micro PDC drill bit, and the drillability grade is determined to be > 10. Overall, with the background of grain-layered mud powder crystal dolomite, the siliceous grain layer, calcite stripe layer, and silica-boronatite layer are unevenly distributed, and part of the grain layer have the characteristics of bending and folding and deformation. The grain layer has pure powder crystal dolomite layer, pure siliceous layer, and mixed siliceous and cloudy grain layer, calcite banded layer is often accompanied with siliceous aggregates, and silica sodium borate is mostly banded layer, and individual crystals scattered in cloudy siliceous grain layer are also seen. The thin section photo of the Fengcheng Formation core is shown in Figure 3.
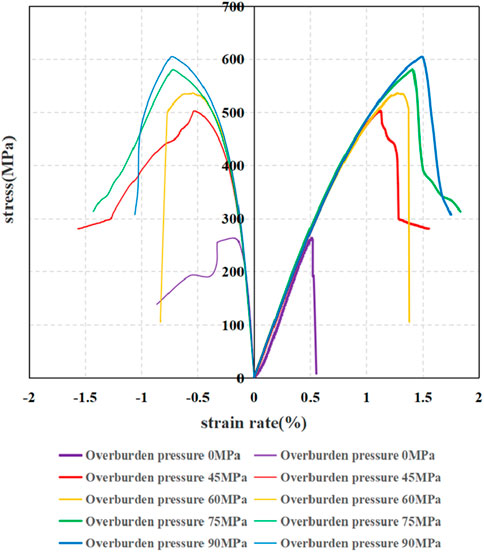
Figure 2. Stress-strain curve of the core of Fengcheng Formation (Overburden pressure: 0 MPa, 45 MPa, 60 MPa, 75 MPa, 90 MPa. The mechanical properties of the rock have been tested, and the compressive strength of the rock under normal pressure is 250 MPa, and that of the rock under the overburden pressure of 90 MPa is 600 MPa).
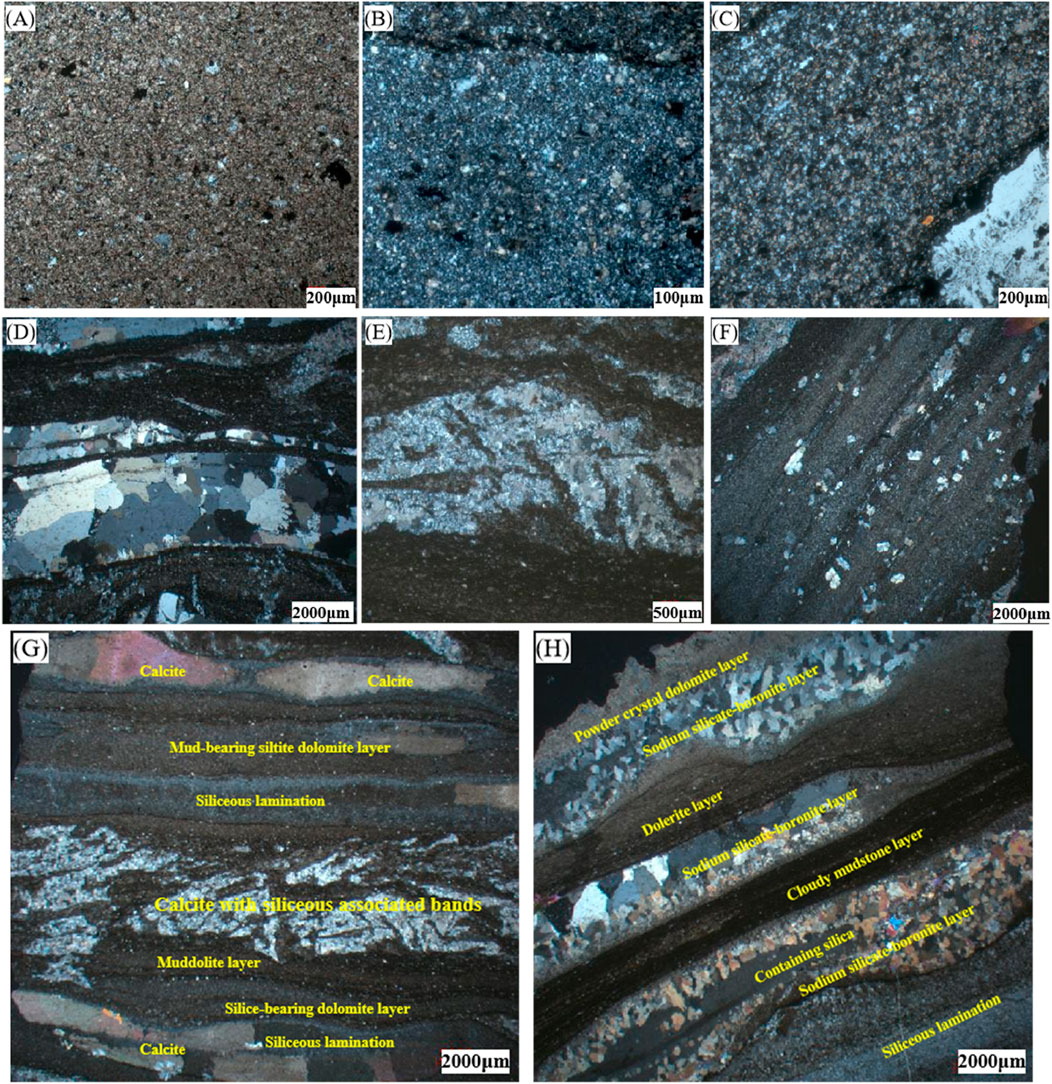
Figure 3. Photograph of thin section of core of Fengcheng Formation [(A) is muddy chalky crystalline dolomite grains, 5,119.54 m; (B) is siliceous lamination, 5,119.54 m; (C) is cloudily and siliceously mixed grain layers, 5,123.60 m; (D) is sodium silicon boron stone layer, 5,120.41 m; (E) is siliceous calcite associated banded layer, 5,119.96 m; (F) is dispersion of sodium silicon boronite crystals, 5,123.6 m; (G) is silicon-bearing mud and silica mud powder crystal dolomite, 5,119.96 m; (H) is siliciclastic mud with silica salts, powdered crystalline dolomite, 5,121.11 m].
Difficulties in shale oil drilling in Fengcheng Formation are as follows: (1) deep burial (>5,000 m), hard and dense, high formation pressure, gas intrusion occurs from time to time, and high drilling fluid density are needed to ensure well control safety, result in high perimeter pressure that brings great challenges to drilling engineering; (2) The compressive strength of rocks is extremely high (comparable to granite), with poor drillability, low ROP, multiple trips, severe wear of PDC drill bits, strong heterogeneity of the formation, and large spatial differences in drillability.
4 3D spatial ROP prediction methods
In this section, the relationship between resistivity and ROP, the technical process of predicting 3D spatial ROP, the classification of stratigraphy based on logging resistivity and the calibration of ROP, the 3D seismic data processing and modeling of facies-controlled resistivity attributes, and the prediction of 3D spatial ROP are explained in detail in five aspects, namely, the principle and implementation steps of the methodology of the combined well-seismic data-driven resistivity-based 3D spatial ROP prediction based on resistivity. This is a multidisciplinary study that includes geology, geophysical exploration, logging, and drilling. Geological and geophysical engineers provide structural interpretation and seismic data, logging engineers provide resistivity data, and drilling engineers provide ROP.
4.1 The relationship between resistivity and ROP
The resistivity data sources are conventional logging and logging with drilling, deep lateral resistivity mainly reflects the formation resistivity, shallow lateral resistivity mainly reflects the intrusive zone resistivity, the paper mainly uses deep lateral resistivity data. Considering that there are many factors affecting the ROP, and resistivity is only a phenomenon of geological factors. In order to investigate the intrinsic relationship between formation resistivity and ROP, the fitted relationship between trip average ROP and trip average formation resistivity is statistically determined for the third spud of six pilot test wells. These six wells were drilled with similar engineering parameters and their effects are ignored for statistical purposes. A total of 78 trips are drilled in the third spud of six wells, excluding the inefficient trips (<30 m) with short footage and the coring trips totaling 13 trips, and the effective sample data totaled 65. The average ROP of the trips and the average resistivity of the formation in the trips are analyzed by means of corssplot diagrams, as shown in Figure 4. It can be seen that in logarithmic coordinates, the average ROP of trip drilling and the average resistivity of trip drilling strata have a good negative correlation, i.e., the higher of the resistivity and the lower of the ROP, with a correlation coefficient of 0.638. This relationship, which confirms the feasibility of the prediction of the ROP from the resistivity, lays a theoretical foundation for the research of this paper.
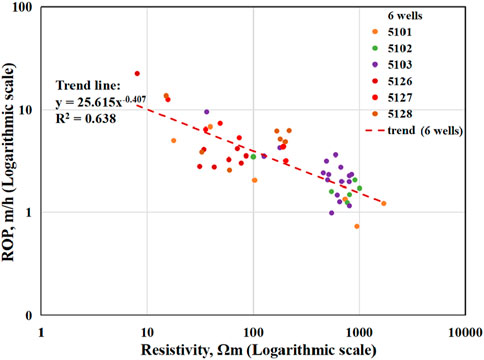
Figure 4. Average ROP of trip drilling in the third spud versus average resistivity of trip drilling crossplot (In logarithmic coordinates, the average ROP of trip drilling and the average resistivity of trip drilling strata have a good negative correlation, i.e., the higher of the resistivity and the lower of the ROP, with a correlation coefficient of 0.638.).
4.2 Technical process for predicting ROP in 3D spatial
Well-seismic joint refers to the full utilization of 1D vertical features of well data and 3D spatial features of seismic data in 3D resistivity attribute modeling and 3D ROP prediction. Data-driven means starting from the phenomenal relationship between data rather than the mechanism. Resistivity-based prediction of 3D spatial ROP requires the joint use of 3D resistivity attribute models, logging resistivity classification plates, and drilled well ROP.
The technical process of well seismic joint data-driven resistivity-based prediction of 3D spatial ROP (Figure 5) is divided into three parts: (1) well data processing, including logging resistivity data cleaning, unsupervised neural network (UNN) clustering analysis, resistivity classification templates, and drilling ROP calibration; (2) seismic data processing, including structural horizon interpretation, seismic data cleaning, and well seismic joint facies-controlled resistivity attribute modeling; (3) 3D ROP prediction.
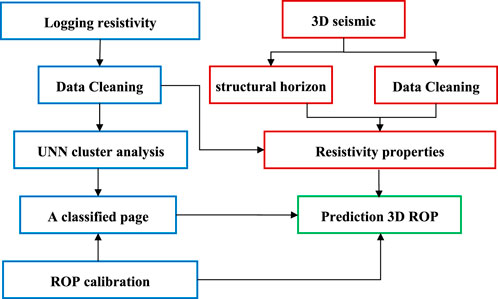
Figure 5. Flowchart of the technique to drive resistivity-based prediction of 3D spatial ROP by well-seismic joint (Blue box: well data (logging, drilling) processing flow; red box: 3D seismic data processing and seismic phased resistivity attribute modeling flow; green box: predicting 3D spatial ROP).
4.3 Classification of formations based on log resistivity and calibration of ROP
Cluster analysis is a statistical analysis technique that aims to find the intrinsic structure of the data and classify the data into different classes, which are divided into supervised and unsupervised clustering. Common unsupervised cluster analysis methods include: K-means, hierarchical clustering, spectral clustering, maximum expectation clustering of Gaussian mixture model (GMM), etc. (Deng et al., 2024). The commonly used unsupervised neural networks (UNN) in the field of geology are (Zhang et al., 2020; Bai et al., 2018; Tao et al., 2022): Hopfield network (HN), Radial Basis Function Network (RBF), Self-Organizing Mapping Network (SOMNN), Deep Belief Network (DBN), Convolutional Neural Network (CNN). According to the previous analysis, there is a nonlinear relationship between resistivity and ROP, and it is not possible to use resistivity to directly describe the absolute value of ROP. In the paper, an indirect analysis is used to relate resistivity to ROP. First, an unsupervised neural network (UNN) is used to categorize the logging resistivity and classify the stratigraphic drillability class. Then, the ROP of the drilled wells was used to calibrate the ROP corresponding to each grade of formation.
Usually, the collected logging resistivity data carry spikes and high-frequency fluctuations, which are not conducive to data categorization. Therefore, before clustering analysis, it is necessary to perform data cleaning, mainly to remove spikes and median filtering, and retain the low-frequency trend of the data. Figure 6 shows the comparison between the resistivity data of three wells 5,101, 5,102 and 5,103 before and after cleaning, the isolated spikes are effectively removed, and the low-frequency characteristics of the data are more prominent. Figure 7 shows the use of unsupervised neural network (UNN) to classify the stratigraphy based on logging resistivity, the input logging resistivity is data cleaned, and the classification parameters are repeatedly adjusted according to the classification results until the 5,101, 5,102, and 5,103 high-resistivity well sections are effectively distinguished. The strata were classified into five categories resistivity from low to high: sky blue, green, orange, red, purple. By creating a cross plot between resistivity and classification values, the classification threshold can be obtained. The formation can be calibrated using the already drilled ROP and divided into four levels: Easy-to-drill formation (sky blue: resistivity ≤20 Ω m, green: 20 < resistivity ≤52 Ω m), ROP>4 m/h; First hard-to-drill formation (orange: 52 < resistivity ≤123 Ω m), ROP = 3.5 m/h; Secondary hard-to-drill formation (red: 123 < resistivity ≤373 Ω m), ROP = 2.5 m/h; Third hard-to-drill formation (purple: resistivity >373 Ω m), ROP = 1.5 m/h, as shown in Figure 8.
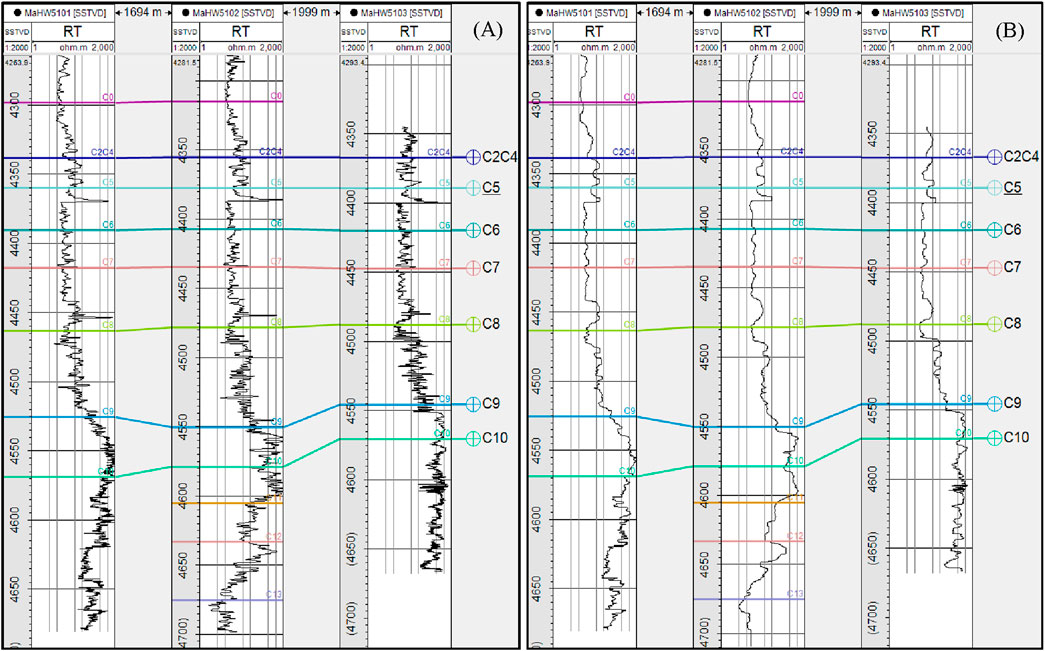
Figure 6. Logging resistivity data cleaning [(A) is raw, (B) is de-spiking and median filtering, the isolated spikes are effectively removed, and the low-frequency characteristics of the data are more prominent.].
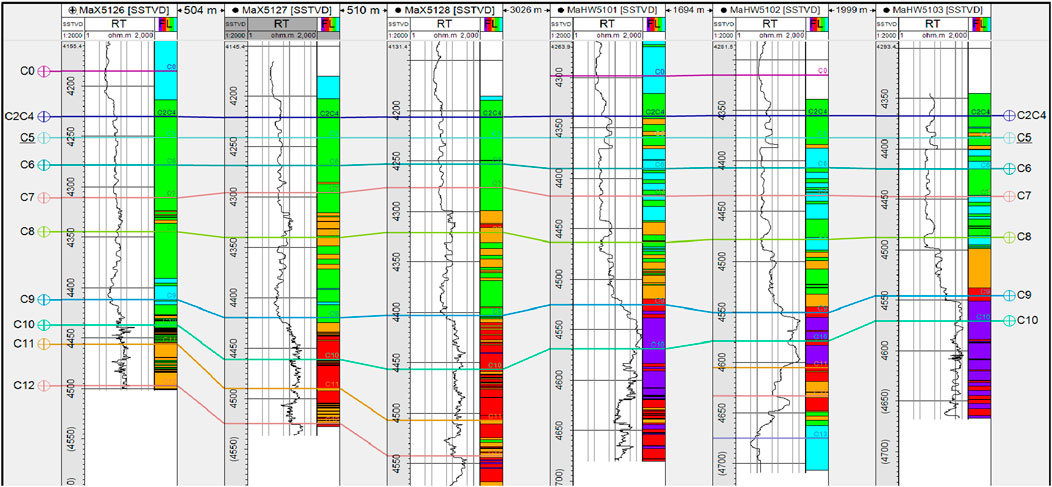
Figure 7. Classification of formations based on logging resistivity using unsupervised neural network (UNN).
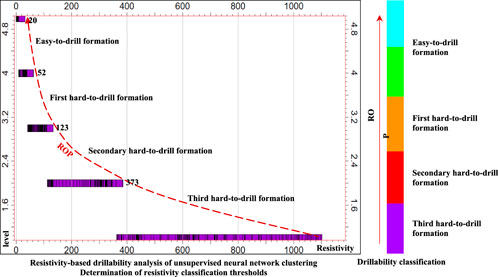
Figure 8. Resistivity Classification Plate and Stratigraphic Drillability levels (Easy-to-drill formation (sky blue: resistivity ≤20 Ω m, green: 20 < resistivity ≤52 Ω m), ROP>4 m/h; First hard-to-drill formation (orange: 52 < resistivity ≤123 Ω m), ROP = 3.5 m/h; Secondary hard-to-drill formation (red: 123 < resistivity ≤373 Ω m), ROP = 2.5 m/h; Third hard-to-drill formation (purple: resistivity >373 Ω m), ROP = 1.5 m/h).
4.4 3D seismic data processing and facies-controlled resistivity attribute modeling
Well-seismic joint facies-controlled resistivity attribute modeling requires log resistivity, seismic data, and structural horizon data. Well log resistivity with data cleaned resistivity, structural horizon data derived from seismic data interpretation, seismic data cleaning mainly has de-noising, fracture enhancement, expanding frequency, etc., and seismic amplitude is used as the facies-controlled data. Structural horizon and logging resistivity, as shown in Figure 9. The main process of well seismic joint facies-controlled resistivity attribute modeling is as follows: (1) Structural modeling based on structural horizon, and if faults are developed, the fault data need to be added; (2) Logging resistivity coarsening and data analysis, given samples, and determining the geostatistical parameters; (3) Seismic amplitude facies-controlled sequential Gaussian simulation resistivity property modeling. 3D resistivity property modeling, as shown in Figure 10.
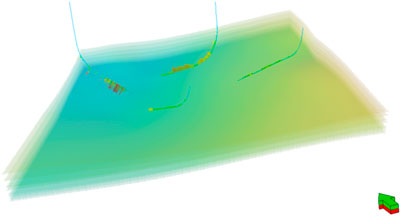
Figure 9. Structural horizon and logging resistivity (This is basic data for structural modeling and resistivity property modeling.).
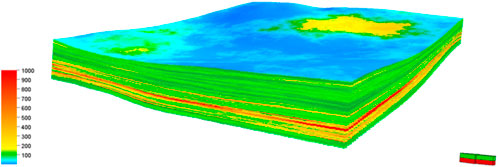
Figure 10. 3D resistivity property modeling (This is a model by seismic amplitude facies-controlled sequential Gaussian simulation resistivity property modeling.).
4.5 3D spatial ROP prediction
Based on the resistivity classification thresholds obtained from well data analysis, the 3D resistivity attribute model is classified to obtain a formation drillability classification model. The model represents the classification results under the geological factors, which are unchanged with time and technological development. When applying the drillability grading model to predict the ROP, it is necessary to refer to the representative and latest ROP in the work area to calibrate and assign the corresponding ROP to different formations. Referring to six pilot test wells in the research area, the predicted ROP is: Easy-to-drill formations (sky blue and green), ROP >4 m/h; First hard-to-drill formation (orange), ROP is 3.5 m/h; Secondary hard-to-drill formation (red), ROP is 2.5 m/h; Third hard-to-drill formation (purple), ROP is 1.5 m/h. The predicted 3D ROP model is shown in Figure 11. This prediction result only represents the ROP when it is close to the drilling engineering parameters of the reference well. When drilling engineering parameters are strengthened, the actual ROP will increase compared to the predicted result.
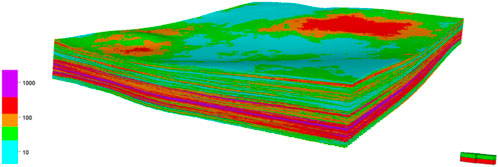
Figure 11. 3D ROP model (The predicted ROP is: Easy-to-drill formations (sky blue and green), ROP >4 m/h; First hard-to-drill formation (orange), ROP is 3.5 m/h; Secondary hard-to-drill formation (red), ROP is 2.5 m/h; Third hard-to-drill formation (purple), ROP is 1.5 m/h).
5 Drilling engineering applications of ROP model
The fourth part of the article details how to realize the well seismic joint data drive and how to realize the 3D spatial ROP prediction based on resistivity, giving the specific technical process and modeling method. During the study period of the paper, a new development well 206H was drilled in the workover area, and the drillability and ROP of the three open sections were predicted before drilling using the method of the paper, as shown in Figure 12. For comparison purposes, Table 3 was developed. Table 3 details the engineering parameters such as WOB, RPM, displacement, PP, and drilling tool combinations for the triple-open section, as well as the actual drilling ROP, predicted formation drillability, and predicted ROP. Trip drilling TZ3, TZ4, TZ5, drill type, drilling tool combination, drilling parameters and other engineering factors are basically the same; trip drilling TZ6 is turbine + pregnant set; trip drilling TZ7, TZ8, TZ9, TZ10, drilling tool combination, drilling parameters and other basically the same, the drill bit is different; trip drilling TZ11, TZ12, drilling parameters of the enhanced test, WOB of 120–200 kN, RPM of 30–50, the drill bit of trip drilling TZ12 is the enhanced version of TZ11.

Figure 12. ROP Model for Well 206H (Predicted ROP: color model; actual ROP: black numbers. The ROP predicted by the method of the paper based on resistivity from the geological factors is basically consistent with the actual ROP.).
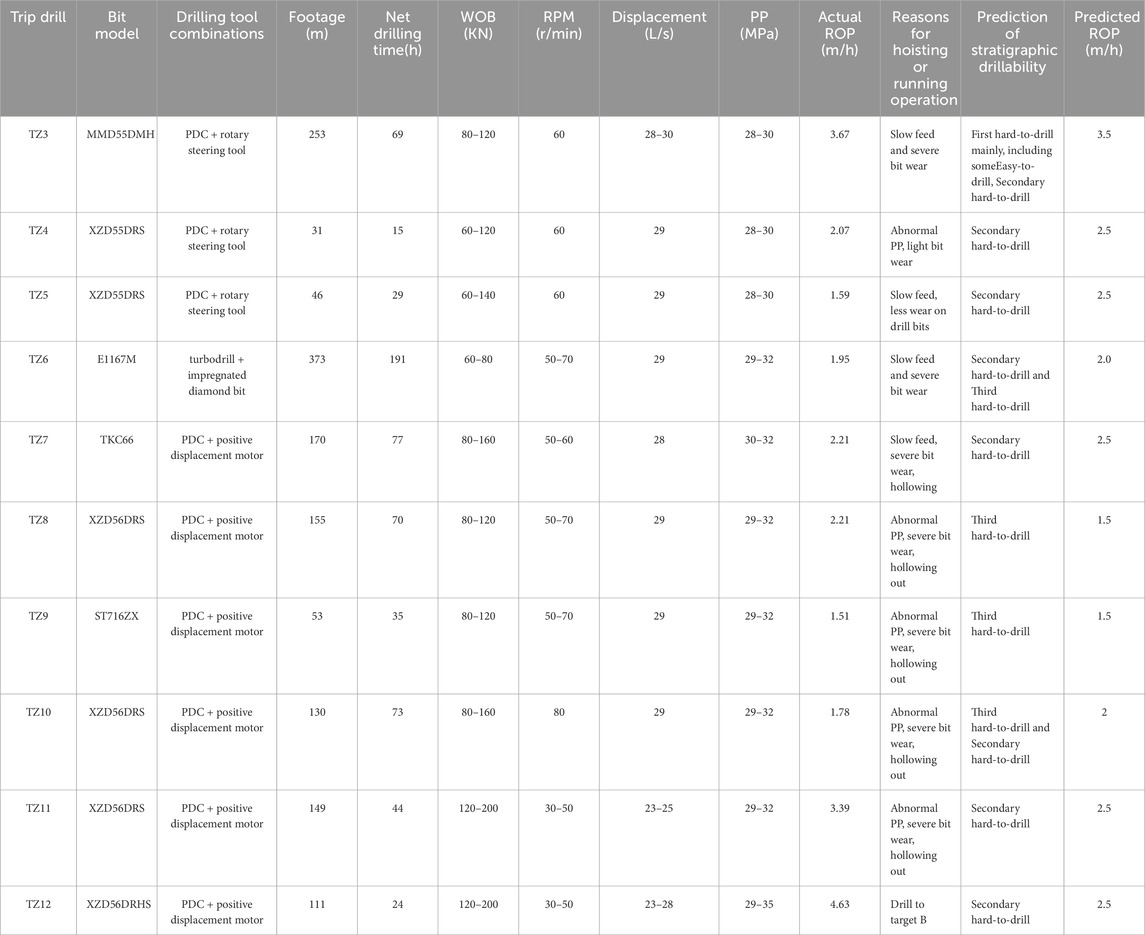
Table 3. Drilling parameters and ROP for the triple opening section of well 206H.
Trip drilling TZ3: 5-blade 16 mm tooth PDC, drill bit, footage 253 m, actual ROP, is 3.67 m/h; pre-drilling prediction of stratigraphy is mainly hard-to-drill in the first level, with part of the easy-to-drill and hard-to-drill in the second level, predicted ROP, is 3.5 m/h, basically in line with the actual ROP.
Trip drillling TZ4: 5-blade 16 mm tooth PDC, drill bit, footage 31 m, actual ROP, is 2.07 m/h, tripping out due to abnormal pump pressure; prediction of the formation before drilling is second hard-to-drill, predicted ROP, is 2.5 m/h, the actual ROP, is on the low side. Trip drilling TZ5: 5-blade 16 mm tooth PDC, drill bit, footage 46 m, actual ROP, is 1.59 m/h, tripping out due to low ROP; prediction of stratigraphy before drilling is second hard-to-drill, predicted ROP, is 2.5 m/h, actual ROP, is lower than expected.
The footage and ROP of TZ4 and TZ5 were lower than expected, and the bit wear was light, which indicated that the 5-blade 16 mm tooth PDC bit was difficult to be applied to the secondary hard-to-drill stratigraphy. After discussion, it was decided to use “turbine + pregnant” drilling tool combination for trip drilling TZ6. Trip drilling TZ6: footage 373 m, actual ROP is 1.95 m/h, footage, ROP performance is better; pre-drilling prediction of the stratigraphy for the second hard-to-drill, with part of the third hard-to-drill, predicted ROP is 2.0 m/h and basically same to the actual.
Trip drill TZ7: 6-blade 19 mm-tooth PDC bit, footage 170 m, actual ROP 2.21 m/h; pre-drilling prediction of the formation is second hard-to-drill, predicted ROP is 2.5 m/h, the actual ROP is low. Trip drill TZ8: 5-blade 19 mm-tooth PDC bit, footage 155 m, actual ROP is 2.21 m/h; pre-drilling prediction of the formation is third hard-to-drill, prediction of the ROP is 1.5 m/h, 5-blade 19 mm-tooth PDC bit shows good aggressiveness. Trip drilling TZ9: 7-blade 16 mm tooth PDC bit, footage 53 m, ROP is 1.51 m/h; pre-drilling prediction of the stratigraphy is third hard-to-drill, predicted ROP 1.5 m/h. Same as third hard-to-drill formation, the footage of 7-blade 16 mm tooth PDC bit of trip drilling TZ9 is not as good as 5-blade 19 mm tooth PDC bit of trip drilling TZ8. Trip drilling TZ10: 5-blade 19 mm tooth PDC bit, footage 130 m, actual ROP is 1.78 m/h; pre-drilling prediction of the stratigraphy for the third and second hard-to-drill, predicted ROP is 2 m/h, and the actual is basically the same.
Trip TZ11: 5-blade 19 mm tooth PDC bit, footage 149 m, actual ROP is 3.39 m/h; pre-drilling prediction: the stratigraphy is second hard-to-drill, predicted ROP is 2.5 m/h. Trip TZ12: 5-blade 19 mm tooth reinforced PDC bit, footage 111 m, actual ROP is 4.63 m/h; pre-drilling prediction: the stratigraphy is second hard-to-drill, ROP is 2.5 m/h. Trying to increase WOB, these two trips have significantly increased the ROP. Before drilling, the formation was predicted to be second hard-to-drill, and the predicted ROP was 2.5 m/h. After trying to increase the WOB, the ROP of these two drilling trips increased significantly. The reinforced drill bit of TZ12 in the drilling trip with large WOB increased the ROP significantly.
Overall, the ROP predicted by the method of the paper based on resistivity from the geological factors is basically consistent with the actual ROP, which fluctuates greatly due to the difference of the drill bits and the change of drilling parameters. The results of large WOB test show that large WOB is favorable to drilling speed.
In view of the hard, dense and strongly non-homogeneous nature of the Fengcheng Formation in the study area, combined with the drillability modeling and ROP prediction in the paper, six types of PDC drill bits, including “strong attack in the straight section, special for slanting and rotary guidance, and differentiated super wear-resistant and anti-impact in the horizontal section”, are designed to support the drilling speed of the Mabei shale oil well. Drilling speed up. PDC drill bit for straight section: single row of 5-blade, shallow internal taper, 800 μm deep de-cobaltized plane tooth. PDC bit for inclined Section: 5-blade double row, balanced convex ridge tooth (800–1,000 μm deep de-cobaltized), used with rotary guide. PDC drill for steady inclined Section: 6 blade double rows, heart conical tooth to prevent hollowing, balanced convex ridge tooth to improve impact resistance; six flanks double rows, conical prism tooth to prevent hollowing, high performance convex ridge tooth to improve impact resistance. As shown in Figure 13.

Figure 13. Individualized drill design plan for the Fengcheng Formation in the study area [(A): Straight well section, 5-blade wing single row, shallow inner cone, 800 μm deep de-cobalt plane teeth; (B): Inclined section, 5-blade wing double row, with rotary guide, balanced convex ridge teeth (ultra-deep de-cobaltation of 800–1000 μm); (C): Stabilized inclined section, 6-blade wing double row, heart conical teeth to prevent hollowing out, balanced convex ridge teeth to enhance impact resistance; (D): Stabilized inclined section, 6-blade wing double row, conical prismatic teeth to prevent hollowing out, high performance convex ridge teeth to enhance impact resistance. High-performance convex spine teeth to improve impact resistance.].
6 Discussion
Existing research on ROP prediction mainly focuses on 1D spatial, physical-driven (Hegde et al., 2017), data-driven (Hegde et al., 2017), fusion of drilling and logging information (Ashrafi et al., 2019; Oyedere and Gray, 2020; Osman et al., 2021), multiple regression (Oyedere and Gray, 2020), and AI algorithm (Ashrafi et al., 2019; Oyedere and Gray, 2020; Osman et al., 2021; Hashemizadeh et al., 2022; Al-AbdulJabbar et al., 2022; Ji et al., 2023; Ebrahimabadi and Afradi, 2024; Wang et al., 2024). The 1D ROP model cannot accurately represent the changes in 3D spatial. The drillability grade determined by the drillability experiments is 1D discrete data with low accuracy. The 3D drillability grade model needs to be calibrated with core drillability grade (Geng et al., 2014). The existing 3D drillability prediction methods mainly focus on predicting drillability grade (Geng et al., 2014; Song, 2018; Gan et al., 2021), there are relatively few studies that directly predict ROP (Qi et al., 2015; Qi et al., 2019). There are many factors that affect ROP, and mainly the factors are geology and engineering aspects. The ROP values vary with engineering factors and technological levels, and the ROP cannot be unified and standardized among multiple wells. Geological factors are constant, and predicting ROP from geological factors has the advantage of adapting to changes with constancy. In the paper, a new method for well-seismic joint data-driven resistivity-based prediction of 3D spatial ROP based on geologic factors is presented. When the engineering factors change and the technological progress is upgraded, only the ROP of the formation needs to be recalibrated with new representative wells. This is a new, original, and advanced method. By integrate drilling, logging, and seismic information, we can be used accurately predicted 3D spatial ROP. It has an important guiding role in relevant research in areas. The shortcoming of this method is the irregular calibration of ROP.
7 Conclusion
The deep lacustrine shale of Mahu is characterized by alkaline lacustrine sediment and strong non-homogeneity. The Fengcheng Formation is characterized by overall oil content and local enrichment. According to statistics, the ROP has a good correspondence with the resistivity of the formation. In the paper, a new method of well-seismic joint data-driven resistivity-based prediction of ROP in 3D spatial is proposed, which is a geological factor-based, well-seismic joint, data-driven, 3D spatial prediction method. The principle and realization steps of the method are elaborated in detail, and an application example of developing wells is given, which achieves good application results. The method is innovative and universal. The conclusions are as follows.
(1) After statistical analysis, the average ROP of trip drilling and the average resistivity of trip drilling strata have a good negative correlation, which satisfies the linear relationship in logarithmic coordinates with a correlation coefficient of 0.638. It confirms the feasibility of predicting the ROP from the resistivity, and lays a theoretical foundation for data-driven prediction of resistivity.
(2) The well-seismic joint makes full use of the 1D vertical features of well data and 3D spatial features of seismic data, and the well-seismic joint data drive realizes the accurate prediction of 3D spatial ROP from the phenomenological relationship between formation resistivity and ROP.
(3) The advantage of resistivity-based predicted ROP is that the geological factors are invariant, and when engineering factors change and technological advances are upgraded, it is only necessary to re-calibrate the ROP of the formation with a new representative well. The predicted ROP is basically the same as the actual drilling ROP, which effectively guides bit selection, personalized bit design, and drilling parameter optimization.
Data availability statement
The original contributions presented in the study are included in the article/Supplementary Material, further inquiries can be directed to the corresponding authors.
Ethics statement
The manuscript presents research on animals that do not require ethical approval for their study.
Author contributions
YY: Data curation, Project administration, Validation, Writing–original draft, Writing–review and editing. ST: Data curation, Project administration, Validation, Writing–original draft, Writing–review and editing. JL: Data curation, Writing–original draft, Writing–review and editing, Project administration, Validation. LZ: Conceptualization, Writing–review and editing. GL: Conceptualization, Writing–review and editing. PL: Conceptualization, Writing–review and editing. WZ: Conceptualization, Writing–review and editing. YL: Conceptualization, Writing–review and editing.
Funding
The author(s) declare that financial support was received for the research, authorship, and/or publication of this article. China National Petroleum Corporation Special Project “Research on Scale Storage and Production Increase of lacustrine shale Oil and Exploration and Development Technology (2023ZZ15YJ05)”.
Acknowledgments
We greatly appreciate editors and reviewers for their comments and helpful suggestions.
Conflict of interest
Authors YY and PL were employed by Xinjiang Oilfield Branch Company, Petro China. Authors JL, LZ, GL, and YL were employed by CNPC Engineering Technology R&D Company Limited.
The remaining authors declare that the research was conducted in the absence of any commercial or financial relationships that could be construed as a potential conflict of interest.
The authors declare that this study received funding from China National Petroleum Corporation. The funder had the following involvement in the study: data collection.
Generative AI statement
The author(s) declare that no Generative AI was used in the creation of this manuscript.
Publisher’s note
All claims expressed in this article are solely those of the authors and do not necessarily represent those of their affiliated organizations, or those of the publisher, the editors and the reviewers. Any product that may be evaluated in this article, or claim that may be made by its manufacturer, is not guaranteed or endorsed by the publisher.
Supplementary material
The Supplementary Material for this article can be found online at: https://www.frontiersin.org/articles/10.3389/feart.2025.1546094/full#supplementary-material
References
Al-AbdulJabbar, A., Mahmoud, A. A., Elkatatny, S., and Abughaban, M. (2022). A novel artifcial neural network-based correlation for evaluating the rate of penetration in a natural gas bearing sandstone formation: a case study in a middle east oil feld. J. Sens. 2022, 9444076. doi:10.1155/2022/9444076
Ashrafi, S. B., Anemangely, M., Sabah, M., and Ameria, M. J. (2019). Application of hybrid artificial neural networks for predicting rate of penetration (ROP): a case study from Marun oil field. J. Petrol. Sci. Eng. 175, 604–623. doi:10.1016/j.petrol.2018.12.013
Bai, L., Yao, Y., Li, S. T., Xu, D. J., and Wei, X. (2018). Mineral composition analysis of rock image based on deep learning feature extraction. CM 27 (7), 178–182. doi:10.12075/j.issn.1004-4051.2018.07.038
Chen, J., Huang, F. Y., Xiang, B., Shi, X. C., and Liu, B. (2020). Drillability characteristics of formation and evaluation of bitselection for the Zhongtaishan structural strata in Sichuan Basin. China 570. doi:10.1088/1755-1315/570/3/032002
Cheng, T. H., Li, G. L., Wang, Y. R., Qin, H. L., Fu, Q., Cheng, W., et al. (2024). Evaluation and simulation study of rock drillability grades in theTazhong-tabei block. Processes 12, 1626. doi:10.3390/.pr12081626
Deng, D. Z., Zhao, Y. H., Riel, B., Gao, J. Y., and Fang, Y. X. (2024). Quantification and unsupervised clustering analysis of morphological characteristics of seamounts in the south China sea basin. Earth Sci. doi:10.3799/dqkx.2023.218
Ebrahimabadi, A., and Afradi, A. (2024). Prediction of ROP in petroleum drilling operations using optimization algorithms. Rudarsko-geološko-naftni Zb. 39 (3), 19–130. doi:10.17794/rgn.2024.3.9
Eskandarian, S., Bahramib, P., and Kazemi, P. (2017). A comprehensive data mining approach to estimate the rate of penetration: application of neural network, rule based models and feature ranking. J. Petrol. Sci. Eng. 156, 605–615. doi:10.1016/j.petrol.2017.06.039
Feng, S. X., and Wang, S. (2022). Experimental study of rock-bit interaction mechanism for rock drillability assessment in rotary drilling. JCCS 47 (3), 1395–1404. doi:10.13225/j.cnki.jccs.XR21.1459
Gan, C., Cao, W. H., Liu, K. Z., and Wu, M. (2021). A new spatial modeling method for 3D formation drillability field using fuzzy c-means clustering and random forest. J. Petrol. Sci. Eng. 200, 108371. doi:10.1016/j.petrol.2021.108371
Geng, Z., Fan, H. H., Chen, M., Wang, J. Z., Ji, R. nY., and Jing, N. (2014). Application and research on methods for 3D spatial rock drillability prediction. Pet. Drill. Tech. 42 (5), 80–84. doi:10.11911/syztjs.201405014
Hashemizadeh, A., Bahonar, E., Chahardowli, M., Kheirollahi, H., and Simjoo, M. (2022). Analysis of rate of penetration prediction in drilling using data-driven models based on weight on hook measurement. Earth Sci. Inf. 15, 2133–2153. doi:10.1007/s12145-022-00860-1
Hegde, C., Daigle, H., Millwaterb, H., and Graya, K. (2017). Analysis of rate of penetration (ROP) prediction in drilling using physics-based and data-driven models. J. Petrol. Sci. Eng. 159, 295–306. doi:10.1016/j.petrol.2017.09.020
Huang, Y. Y., Wang, G. W., Song, L. T., Wang, S., Zhang, Y. L., Huang, L. L., et al. (2022). Fracture logging identification and effectiveness analysis of shale reservoir of the Permian Fengcheng Formation in Mahu sag. Junggar Basin. J. Palaeogeogr. 24 (3), 540–555. doi:10.7605/gdlxb.2022.03.031
Ji, H., Lou, Y. S., Cheng, S. T., Xie, Z. L., and Zhu, L. (2023). An advanced long short-term memory (LSTM) neural network method for predicting rate of penetration (ROP). ACS Omega 8 (1), 934–945. doi:10.1021/acsomega.2c06308
Kamran, M. (2021). A probabilistic approach for prediction of drilling rate index using ensemble learning technique. JME 12 (2), 327–337. doi:10.22044/jme.2021.10689.2030
Khandelwal, M., and Armaghani, D. J. (2015). Prediction of drillability of rocks with strength properties using a hybrid GA-ANN technique. Geotech. Geol. Eng. 34, 605–620. doi:10.1007/s10706-015-9970-9
Khosravimanesh, S., Esmaeilzadeh, A., Akhyani, M., Mikaeil, R., and Mokhtarian Asl, M. (2024). Accurate prediction of drill bit penetration rate in rock using supervised machine learning techniques base on laboratory test data. RGNZ/MGPB 115-130 39, 115–130. doi:10.17794/rgn.2024.1.10
Kong, X. W., Chen, H., Ye, J. J., Li, Y. D., and Gan, Y. F. (2022). Bit selection based on PCA to predict drillability level of hard rocks. Xinjiang Oil and Gas 18 (3), 6–11. doi:10.12388/j.issn.1673-2677.2022.03.002
Li, J., Tang, Y., Wu, T., Zhao, J. Z., Wu, H. Y., Wu, W. T., et al. (2020). Overpressure origin and its effects on petroleum accumulation in the conglomerate oil province in Mahu Sag, Junggar Basin, NW China. PED 47 (4), 726–739. doi:10.1016/s1876-3804(20)60088-x
Li, W. X., Liu, X. M., Ren, P. J., Chen, X. P., Liu, J. T., Zhou, Z., et al. (2021). Study on the law of drillability of stratum in ShunBei #1 block. 11th Conf. Asian Rock Mech. Soc. 861, 062066. doi:10.1088/1755-1315/861/6/062066
Liu, D. G., Zhou, L., Li, S. H., Ma, W. Y., and Guo, W. J. (2020). Characteristics of source rocks and hydrocarbon generation models of Fengcheng Formation in Mahu sag. Acta Sedimentol. Sin. 38 (5), 946–955. doi:10.14027/j.issn.1000-0550.2020.005
Mahmoud, A. A., and Elkatatny, H. G. S. (2023). Evaluation of the wellbore drillability while horizontally drilling sandstone formations using combined regression analysis and machine learning models. J. Pet. Explor. Prod. Te. 13, 1641–1653. doi:10.1007/s13202-023-01635-0
Osman, H., Ali, A., Mahmoud, A. A., and Elkatatny, S. (2021). Estimation of the rate of penetration while horizontally drilling carbonate formation using random forest. J. Energy. Res. Technol. 143 (9), 093003. doi:10.1115/1.4050778
Oyedere, M., and Gray, K. (2020). ROP and TOB optimization using machine learning classification algorithms. J. Nat. Gas. Sci. Eng. 77 (No), 103230. doi:10.1016/j.jngse.2020.103230
Qi, X., Snyder, J., Marfurt, K., and Pranter, M. J. (2015). Linking for rate of penetration to seismic attributes and mechanical properties in the Mississippi lime. Seg. New Orleans Annu. Meet., 2972–2976. doi:10.1190/segam2015-5930003.1
Qi, X., Snyder, J., Zhao, T., Marfurt, K. J., and Pranter, M. J. (2019). Correlation of seismic attributes and geomechanical properties to the rate of penetration in the mississippian limestone, Oklahoma. AAPG Spec. Vol., 527–539. doi:10.1306/13632162M1163795
Qu, J. H., Yang, R. R., and Tang, Y. (2019). Large-area petroleum accumulation model of the Triassic glutenite reservoirs in the Mahu Sag, Junggar Basin: triple controls of fan, fault and overpressure. Acta Geol. Sin. 93 (4), 915–927. doi:10.19762/j.cnki.dizhixuebao.2019108
Sabah, M., Talebkeikhah, M., Wood, D. A., Khosravanian, R., Anemangely, M., and Younesi, A. (2019). A machine learning approach to predict drilling rate using petrophysical and mud logging data. Earth Sci. Inf. 12, 319–339. doi:10.1007/s12145-019-00381-4
Shahani, N. M., Zheng, X. G., Wei, X., and Jiang, H. W. (2024). Hybrid machine learning approach for accurate prediction of the drilling rate index. natureportfolio 14, 24080. doi:10.1038/s41598-024-75639-z
Soares, C., and Gray, K. (2019). Real-time predictive capabilities of analytical and machine learning rate of penetration (ROP) models. J. Petrol. Sci. Eng. 172, 934–959. doi:10.1016/J.PETROL.2018.08.083
Song, Q. R. (2018). Prediction of formation drillability and bit SelectionFor halahatang block. Master's Thesis at China University of Petroleum. Available at: https://www.cnki.net/.
Tao, L. R., Ren, H. R., Ye, Y. M., and Jiang, J. S. (2022). Seismic surface related multiples suppression based on SAGAN. IEEE Geosci. Remote S. 19, 1–5. doi:10.1109/LGRS.2022.3168143
Tookallo, K., and Sohbatzadeh, S. (2023). Using analytical and artificial intelligence models to estimate drilling rate ofpenetration (ROP). Petro. Chem. Indus. Intern. 6 (5), 322–327. doi:10.33140/pcii.06.05.01
Wang, W., Wang, Z. L., Liu, C. G., Zheng, M. L., Zhang, R., Zheng, G. Q., et al. (2023). Key Technology of shale oill sweet spot evaluation and sweet spot type division in Fengcheng Formation of Mahu sag. JES 48 (1), 223–234. doi:10.3799/dqkx.2022.333
Wang, X. Y., Bian, B. L., Liu, H. L., Jiang, Z. F., Zhou, L., and Zhu, Y. C. (2022). Seismic facies characteristics and distribution of sedimentary facies of permian Fengcheng Formation in Mahu area, Junggar Basin. Nat. Gas. Geosci. 33 (5), 693–707. doi:10.11764/j.issn.1672-1926.2022.01.014
Wang, Y. F., Lou, Y. S., Lin, Y. C., Cai, Q. L., and Zhu, L. (2024). ROP prediction method based on PCA-informer modeling. ACS Omega 9, 23822–23831. doi:10.1021/acsomega.3c10339
Yu, J. L., Chen, G., Wu, J. J., Li, W., Yang, S., and Tang, T. M. (2022). Seismic prediction method of geological and engineering shale oil sweet spots and its application in Fengcheng Formation of Mahu sag. XJPT 43 (6), 757–766. doi:10.7657/XJPG20220614
Zeng, X. L., Li, Q., Wei, H. C., Chen, J. H., and Zhu, H. Y. (2023). rate-of-penetration (ROP) prediction model based on formation characteristies of extremely thick plastic mudstone in South China Sea. Coal Geol. and Explor. 51 (11), 159–168. doi:10.12363/issn.1001-1986.23.06.0307
Zhang, G. Y., Wang, Z. Z., Lin, C. Y., Wang, W. F., Li, L., and Li, C. (2020). Seismic reservoir prediction method based on wavelet transform and convolutional neural network and its application. JCUP 44 (4), 83–93. doi:10.3969/j.issn.1673-5005.2020.04.010
Zhi, D., Tang, Y., He, W. J., Guo, X. G., Zheng, M. L., and Huang, L. L. (2021). Orderly coexistence and accumulation models of conventional and unconventional hydrocar-bons in lower permian Fengcheng Formation, Mahu sag, Junggar Basin. PED 48 (1), 43–59. doi:10.1016/s1876-3804(21)60004-6
Keywords: well-seismic joint, data-driven, resistivity, prediction, 3D spatial, rate of penetration, shale
Citation: Yu Y, Tian S, Li J, Zou L, Liu G, Li P, Zhou W and Lu Y (2025) Well-seismic joint data-driven resistivity-based prediction of 3D spatial rate of penetration. Front. Earth Sci. 13:1546094. doi: 10.3389/feart.2025.1546094
Received: 16 December 2024; Accepted: 20 February 2025;
Published: 04 April 2025.
Edited by:
Peng Wu, Dalian University of Technology, ChinaReviewed by:
Na Li, Chinese Academy of Geological Sciences, ChinaChenglong Wu, Qingdao University of Technology, China
Copyright © 2025 Yu, Tian, Li, Zou, Liu, Li, Zhou and Lu. This is an open-access article distributed under the terms of the Creative Commons Attribution License (CC BY). The use, distribution or reproduction in other forums is permitted, provided the original author(s) and the copyright owner(s) are credited and that the original publication in this journal is cited, in accordance with accepted academic practice. No use, distribution or reproduction is permitted which does not comply with these terms.
*Correspondence: Yangfei Yu, eXV5YW5nZmVpQHBldHJvY2hpbmEuY29tLmNu; Shouceng Tian, dHNjc3lkeEAxNjMuY29t; Jianguo Li, MTM3MDMyMjkyNThAMTYzLmNvbQ==