Abstract
The hallmark of lower Aptian sediments is commonly organic-rich black shales related to widespread oxygen deficient conditions known as ocean anoxic event 1a (OAE1a). The La Frontera section, located in the Subbetic Basin, southern Spain, documents the response to OAE1a within a ∼28 m interval divided into 3 units: U1 (before), U2 (during OAE1a), and U3 (after) to assess the local changes related to the global event. Analytical results include TIC, TOC, major elements (Al, Si, and Ti), biolimiting elements (Fe and P), redox sensitive trace elements (RSTEs; V, Cr, Cu, Mo, and U), clay minerals, bulk mineralogy, and biomarkers. Biomarker data from C27 hopane Ts/(Ts + Tm) ratios and C31 22S/(22S + 22R) homohopane ratios indicate that OM from this site are thermally immature. Unit 1 contains the highest TIC values with limestone layers that were deposited under well oxygenated conditions with minimal detrital input and low TOC. Recurrent marlstone layers within U1 show higher TOC related to heightened terrestrial input which provided increased biolimiting elements that sustained enhanced primary productivity. Elevated RSTE values associated with marlstone layers suggest low oxygen conditions, however without reaching full anoxia. The onset of OAE1a in U2 is marked by diminished TIC and dark shales with the highest TOC and RSTE values. Increased Al content, the presence of longer chain n-alkanes, plus increased quartz and feldspars during this interval are attributed to enhanced hydrological cycles providing more nutrients to the basin. Concurrently biolimiting elements were remobilized by reducing conditions as indicated by coeval increases in the RSTEs. U3 contains recurring peaks of TIC coincident with low TOC values and is characterized by decreases in relative abundances of quartz and feldspars, lower Al content and a shift back to only marine OM. Concurrence of these factors imply a decline in fluvial input. RSTEs in this unit are decoupled from TOC and correlate with Al, indicating a common provenance and that the bottom waters were likely oxygenated. Thus, the results of this study reveal that enhanced hydrologic cycles was the main driving mechanism for enhanced accumulation and preservation of OM during OAE1a in the Subbetic Basin.
1 Introduction
The Barremian-Aptian interval was a period of profound environmental and climatic change, marked by extensive volcanic activity, ocean deoxygenation, and global carbon cycle perturbations. This time interval is marked by the development of widespread Oceanic Anoxic Events (OAEs), or episodes of enhanced organic carbon burial under oxygen-deficient conditions, that are linked to periods of extreme warmth and elevated atmospheric CO2 levels (Schlanger and Jenkyns, 1976; Arthur and Schlanger, 1979; Jenkyns, 1980; Erbacher et al., 1996; Hu et al., 2020). Among the most significant of these events was OAE1a (Selli Event, ∼120 Ma), which is recorded globally in marine sedimentary deposits and deep-sea drilling sites and represents a key interval for understanding Early Cretaceous paleoceanographic evolution.
The Barremian-Aptian transition is characterized by significant climatic shifts, largely driven by increased volcanogenic CO2 emissions from both Large Igneous Province (LIP) eruptions and enhanced seafloor spreading at active mid-ocean ridges (Arthur et al., 1985; Barron et al., 1995; Huber et al., 1995; Tejada et al., 2009; Hu et al., 2020). The rapid influx of greenhouse gases led to a reduction in latitudinal temperature gradients, resulting in weakened ocean circulation and prolonged ocean stratification (Barron et al., 1989; Larson, 1991; Tatsumi et al., 1998; Jenkyns, 2003; Fletcher et al., 2008). Additionally, heightened hydrological cycling intensified continental weathering and nutrient delivery to marine basins (Blättler et al., 2011). These responses resulted in increased primary productivity and organic matter (OM) accumulation, fostering eutrophic and dysoxic to anoxic conditions (Leckie et al., 2002).
A key marker for OAE1a is a major negative carbon isotope excursion (CIE) in both organic carbon and carbonate δ13C records, reflecting the injection of isotopically light carbon (12C) into the ocean-atmosphere system (Scholle and Arthur, 1980; Weissert, 1989; Menegatti et al., 1998). Eruptions from LIPs, particularly from the Ontong Java-Manihiki-Hikurangi Plateau in the central Pacific (Tarduno et al., 1991; Larson, 1991; Tatsumi et al., 1998; Tejada et al., 2009; Percival et al., 2021) and the dissociation of methane hydrate (Jahren et al., 2001) have been credited as the main sources influx of 12C.
This isotopic signal has been well-documented across multiple Tethyan basins and globally. Most notably these include: the Cismon Core and Gorgo a Cerbara section of the Umbria-Marche Basin (Italy) (Erba et al., 1999; Weissert et al., 1998), the Vocontian Basin (France) (Weissert et al., 1998), the Ionian and Pindos Basins (Greece) (Tsikos et al., 2004), the Exmouth Plateau (Indian Ocean, DSDP Site 766): This deep-sea site offers a crucial record of Southern Hemisphere ocean chemistry and anoxia during OAE1a (Gradstein et al., 1992; Weissert et al., 1998), among others. These global records indicate that OAE1a represents a major perturbation in the Earth’s carbon cycle, that spanned multiple depositional environments and latitudes. OAE1a is conventionally defined by a series of carbon isotope segments (C1–C8), with the anoxic interval corresponding to C3–C6, first identified in the Cismon (Italy) and Rotter Sattel (Switzerland) sections (Menegatti et al., 1998). The widespread documentation of these δ13C trends clearly reflects the geochemical state of the global carbon reservoir, therefore, it is valuable global correlation tool, applicable across marine and terrestrial stratigraphic records (Scholle and Arthur, 1980; Weissert et al., 1998; Kuhnt et al., 1998; Bellanca et al., 2002; Li et al., 2008; de Gea et al., 2003; de Gea et al., 2008; Yilmaz et al., 2004; Millán et al., 2009; Huck et al., 2010; Najarro et al., 2011; Hu et al., 2012; Godet et al., 2014; Aguado et al., 2014a; Aguado et al., 2014b; Sanchez-Hernandez and Maurrasse, 2014; Sanchez-Hernandez and Maurrasse, 2016; Sanchez-Hernandez et al., 2014; Giraud et al., 2018; Socorro and Maurrasse, 2019; Socorro and Maurrasse, 2020; Socorro and Maurrasse, 2022; Zhang et al., 2021; Herdocia and Maurrasse, 2022, and others).
The La Frontera section in the Betic Cordillera, southern Spain, is part of the Subbetic Basin (Figure 1) and includes OM-rich sediments deposited in the upper bathyal zone of the Iberian margin coeval with OAE1a, under conditions of water column deoxygenation linked to deficient circulation and increased organic productivity with increased sedimentation rates (de Gea et al., 2008; Aguado et al., 2014a; Aguado et al., 2014b). Initial biomarker (n-alkanes) results from two samples suggest that sediments in the La Frontera section were thermally immature (Quijano et al., 2012). The degree of terrigenous influence, the sources of OM and the controlling factors of redox conditions in the OAE1a interval of this distinct setting remain to be clarified. Such understanding is valuable because it can offer insight into changing conditions of modern analogs amid a warming climate.
FIGURE 1
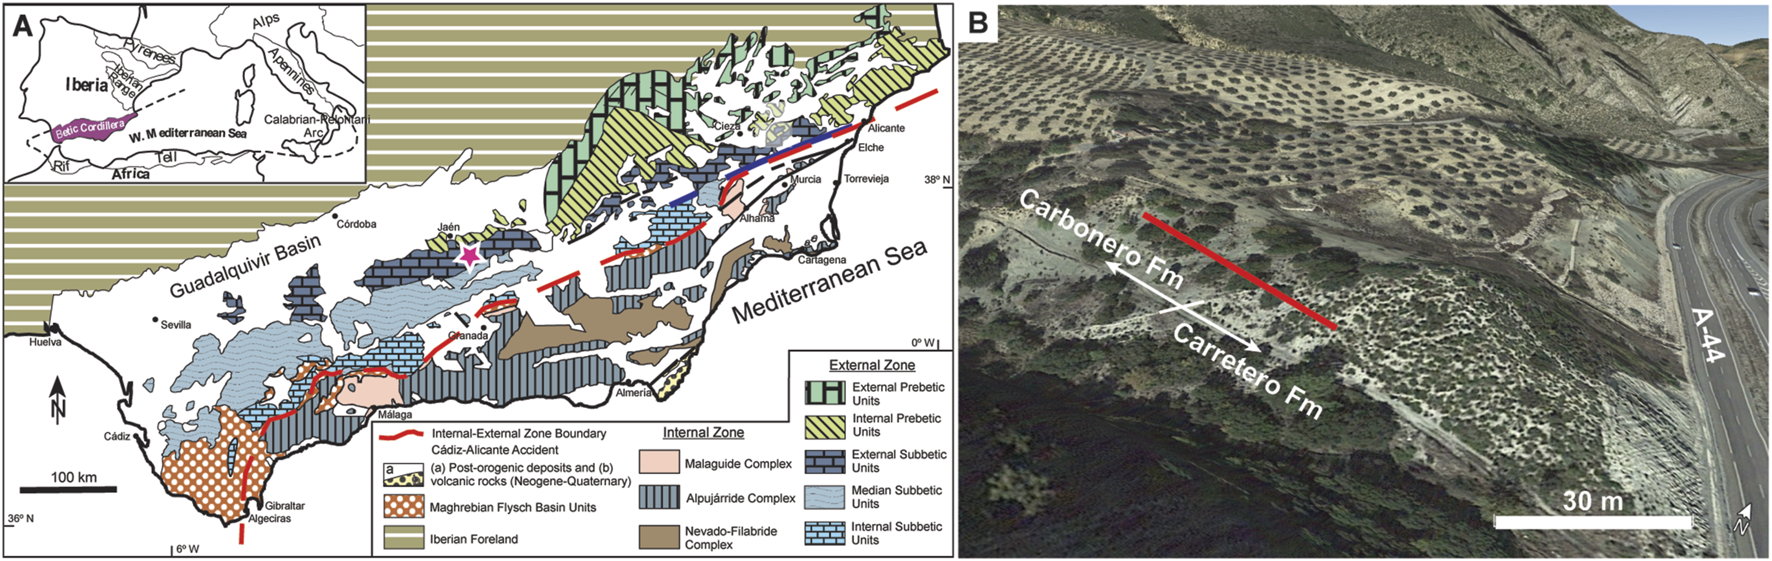
(A) Geologic map of the Betic Cordillera modified after Guerrera et al. (2014). The pink star marks the location of the studied site. (B) Aerial view of the La Frontera section, the red line indicates the ∼28 m interval that was sampled.
In this study we revisit ∼28 m of the La Frontera section with main purpose to provide the fundamental geochemical data needed to further assess the specific response of this upwelling environment during the global forcing mechanisms associated with OAE1a. We use a multi-proxy study to better characterize the local factors that led to the deposition of OM-rich deposits. The results provide new data regarding total inorganic carbon (TIC), the relationships between input of carbonate biomineralizers and siliciclastic fluxes, and total organic carbon (TOC) for OM preservation. The carbon isotope data permit chemostratigraphic correlation for chronology, while major elements are used to assess terrigenous supplies, biolimiting elements for their possible influence on productivity, and redox sensitive trace elements (RSTEs) provide the oxygenation conditions in the basin and its impact on OM preservation. Additionally, biomarkers shed light on OM provenance and thermal maturity of the preserved organic matter, whereas clay and bulk mineral content further characterize the climatic conditions influencing weathering and terrigenous supplies to the Subbetic Basin during OAE1a. The integration of these results highlights the environmental conditions that favored enhanced carbon sequestration during the OAE 1a within the Barremian-Aptian interval in the Subbetic Basin.
2 Location and geologic setting
The study site is located about 30 km south of Jaen on the west side of Highway A44 (E−902: Autovia Sierra Nevada – Costa Tropical Figure 1), across from the truck stop “Hostal Restaurante Frontera” (lat: 37°35′36.88′ N; long: 3°36′06.88′ W), (XF1 in Aguado et al., 2014a; Aguado et al., 2014b). The ∼28 m interval of interest contains a pelagic deposit consisting of limestone, marly limestone, marlstone, as well as dark calcareous shale of Barremian-Aptian age which include OAE1a (Molina, 1987; Sandoval et al., 2012; Aguado et al., 2014a; Aguado et al., 2014b). The succession is subdivided into two formations separated by a hiatus: the Carretero Fm (Barremian) and the Carbonero Fm (Aptian) where the biochronology was determined based on calcareous nannofossils, planktonic foraminifera, and radiolarians (Aguado et al., 2014a; Aguado et al., 2014b). Carbon isotope chemostratigraphy further permit to identify carbon isotope segments C2 to C7, thus corroborating the age and presence of OAE1a within the section (Aguado et al., 2014a; 2014b). Organic-rich sediments of the Carbonero Formation provide an excellent record of the response of the Subbetic Basin during OAE1a.
As reported in the literature, the Betic Basin developed in response to extensional tectonism which began in the Triassic Period (García-Hernández et al., 1980; Ziegler, 1988; Reicherter et al., 1994). During the Jurassic Period offshore pelagic and hemipelagic troughs and swells formed within the Southern Iberian Continental Margin (SICM) in response to the rifting of the Betic shelf (Gibbons and Moreno, 2002). The breakup of the platform led to the formation of two main paleogeographic domains, the Prebetic zone, a platform setting in the north, and the Subbetic zone, a pelagic setting in the south (García-Hernández et al., 1980; Martin-Chivelet et al., 2002). Within the Subbetic zone, 3 sedimentary realms are identified from north to south: the External Subbetic, the Median Subbetic, and the Internal Subbetic; where both the External and Internal zones are characterized by sedimentary deposits that accumulated on the swells, and the Median zone is characterized by sedimentary deposits that accumulated in the trough (García-Hernández et al., 1980). The opening of the North Atlantic Ocean in the earliest Cretaceous led to a reduction in the counterclockwise rotation of the Iberian plate relative to the African plate, followed by an acceleration of the rotation as the Bay of Biscay began to open during late Aptian to Campanian times (Ziegler, 1988; Olivet, 1996; Martin-Chivelet et al., 2002). Rapid rise of mid-ocean ridges initiated by active seafloor spreading associated with the opening of the North Atlantic Ocean at that time led to eustatic sea-level rise which flooded most of the Iberian continent except the Iberian and Erbo Variscan massifs (Martin-Chivelet et al., 2002). Sedimentation in the Subbetic Basin during Aptian times was largely controlled by this extensional regime and by changing paleoclimatic conditions as well as eustatic sea-level rise. During the Early Cretaceous Iberia had a paleolatitude of ∼25°–30° N with a subtropical, semi-arid to arid climate which favored carbonate sedimentation (Dercourt et al., 2000).
In the present geologic context, the La Frontera section is part of the Subbetic zone of the Betic Cordillera (Figure 1A). The succession was deposited on the External to Median Subbetic transition area (de Gea et al., 2012; Aguado et al., 2014a; 2014b). The studied ∼28 m (Figure 1B) includes 2 formations (Fm): the upper 10.78 m of the Carretero Fm at the base which consists of Barremian age limestones and marly limestones (Molina, 1987; Aguado et al., 1993); and 17.15 m of the overlying Carbonero Fm composed of dark marls, radiolarian-rich claystones and green marls corresponding to the Aptian which contain OAE1a (Aguado et al., 2014a; Aguado et al., 2014b).
Biostratigraphic works completed by Aguado et al. (2014a); Aguado et al. (2014b) documented biozones for radiolarians, planktonic foraminifera, and calcareous nannofossils, which are summarized on Figure 2. The biozones for radiolarians include of “Hiscocapsa” asseni and Turbocapsula zones. Planktonic foraminifera assemblages recognized Globigerinelloides blowi, Leupoldina cabri and Globigerinelloides ferreolensis zones. For calcareous nannofossil subzones NC5E, NC6A, and NC7A were identified, however the NC6B subzone is not present. This absence is interpreted to represent a stratigraphic hiatus that separates the Carretero Fm and the Carbonero Fm (Aguado et al., 1997; Aguado et al., 1999; de Gea et al., 2008; Aguado et al., 2014a; Aguado et al., 2014b). Here we rely on these Biostratigraphic works for age constraints of the studied section.
FIGURE 2
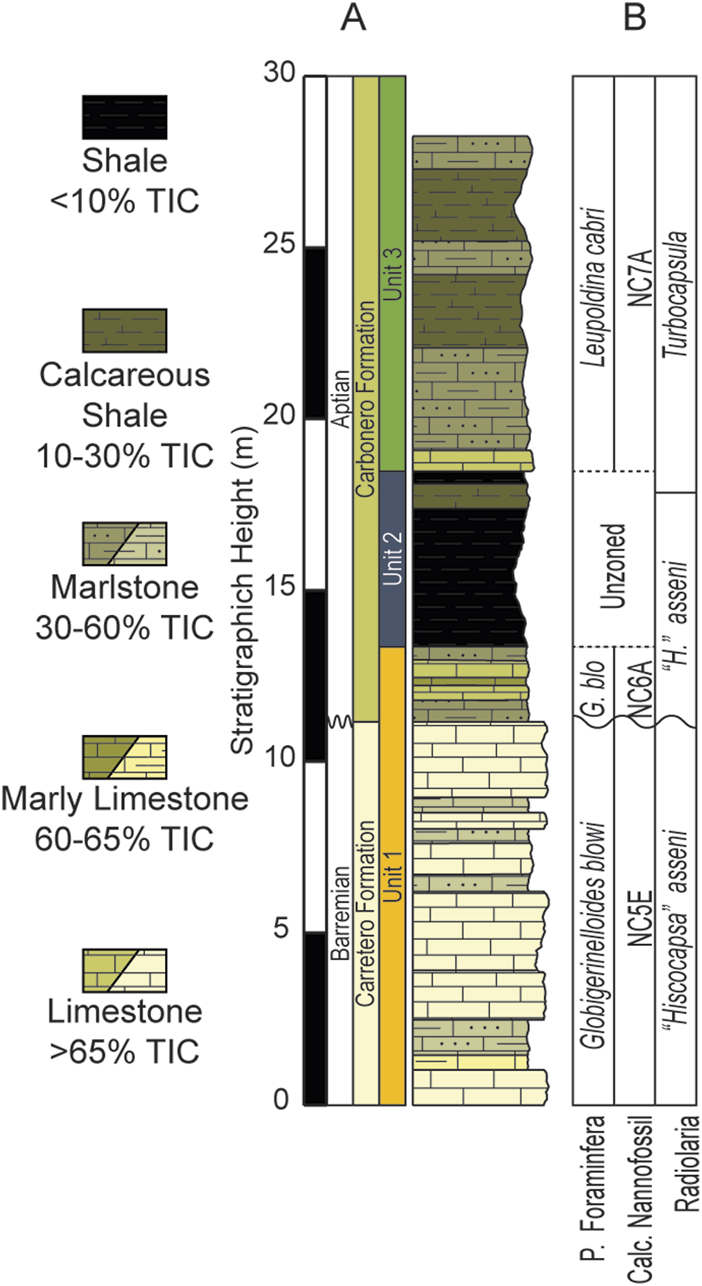
(A) Simplified lithologic column of the ∼28 m studied interval of the La Frontera section. (B) Biostratigraphy completed by Aguado et al. (2014a); Aguado et al. (2014b).
3 Methods
3.1 Field sampling
A total of sixty-five (65) samples were collected over 27.93 m of the succession, yielding a sampling resolution of 1 sample every ∼43 cm, during a field campaign conducted in 2019. The sampling procedure targeted all variations in the bedding along the studied interval. All washover alluvium was removed to expose the outcrop in some areas and any weathered surfaces were either carefully removed or avoided to obtain unweathered rock sample. The dry rock colors were determined using the Rock Color chart after Goddard et al. (1963), which was modified after a 1912 Munsell color scheme.
3.2 Carbon geochemistry: TIC, TOC, and carbon isotope
Total inorganic carbon (TIC) and total organic carbon (TOC) content were measured for all 65 samples using ∼0.3 g of homogenized powdered sample. The analysis was conducted at Florida International University (FIU) using a LECO CR-412 elemental analyzer with the furnace set to 1,450°C, following the procedures detailed in Sanchez-Hernandez and Maurrasse (2014) as well as in Socorro and Maurrasse (2022). Calibration of the instrument was performed using a Fisher Scientific C64-500 pure calcite standard to generate a 15-point linear calibration curve and then corroborated using a NIST 88 b dolomite standard. The analytical precision of the analysis based on replicate runs is ±0.1%. Results for TIC are expressed in %CaCO3 and for TOC as %C. The lithologic nomenclature used follows the descriptions after Sanchez-Hernandez and Maurrasse (2014) in which: limestone >65% TIC; marly-limestone 60%–65% TIC; marlstone 30%–60% TIC; calcareous shale 10%–30% TIC; and shale 0%–10% TIC.
The stable carbon isotope on the bulk organic carbon (δ13COrg) was measured for all 65 samples. Prior to the analysis powdered samples were decarbonated using 10% HCl and then rinsed with deionized water to raise the pH, following the procedures described in Herdocia and Maurrasse (2022). Once dry, the samples were sent to be analyzed at the Stable Isotope Laboratory (SIL) of the Rosenstiel School of Marine, Atmospheric, and Earth Science (RSMEAS), University of Miami. The δ13COrg values were obtained using a Costech elemental combustion system coupled with a Thermo Scientific Delta V Advantage continuous flow isotope ratio mass spectrometer in the same manner described in Swart et al. (2019). The results are expressed as per mil (‰) deviations (δ) relative to the Vienna Pee Dee Belemnite (Belemnitella americana) standard (VPDB). The reproducibility of the analysis is ±0.1‰ based on glycine and secondary standards that were run every 10 samples.
3.3 Elemental analyses: major, biolimiting, and redox sensitive trace elements (RSTEs)
Thirty (30) samples representative of the different lithologies were selected for major elements (Al, Si, and Ti), biolimiting elements (Fe and P), manganese content, and redox sensitive trace elements (RSTEs, V, Cr, Cu, Mo, and U) analysis. The elemental concentrations were determined at FIU’s Trace Evidence Analysis Facility (TEAF). The analysis was carried out using the methodology after Arroyo et al. (2009) and further detailed in Herdocia and Maurrasse (2022). Two internal standard solutions, 300 μL indium metal (1,000 ppm in 3% HNO3) and 350 μL scandium oxide (1,000 ppm in 3% HNO3), were added to 1.000 g of powdered samples which were subsequently dried and homogenized before being pressed into pellets.
The analysis was conducted using an ELAN DRC II (Perkin Elmer LAS) inductively coupled plasma mass spectrometer (ICP/MS). Samples were introduced to the mass spectrometer via laser ablations from an Applied Spectra J200 equipped with a 266 nm Nd:YAG laser and a spot size of 200 μm at 10 Hz. Three standard reference materials (NIST2710, PACS-2, and NIST2704) were used to check the performance of the instrument and were run at the beginning of the analytical procedure, then every 10 samples, and at the end of the analysis. Results were averaged for each sample and the standard material after receiving five ablations. The overall average precision for the analysis was 0.2% relative standard deviation, with a 5.5% average error based on replicate standards. Major elements and biolimiting elements are reported as milligram per gram (mg/g) and the RSTEs are reported in parts per million (ppm).
All trace element data are interpreted using non-normalized data because, given the elemental distribution in these sediments, processing the analytical results reveals that normalization may cause “spurious correlations” or false correlations if the divisor being used to normalize (usually Al) the data contains a high coefficient of variance (standard deviation divided by the mean) (Pearson, 1896; Van der Weijden, 2002). These false correlations are further enhanced if the coefficient of variance of the divisor (Al) is higher than the numerator (trace elements). Nevertheless, in cases where these parameters are not met, normalization to Al may be useful when its coefficient of variance is low or much lower than other trace element data. The trace element data obtained at La Frontera yield a high coefficient of variance for Al (v = 0.56), therefore the data is not normalized to Al to avoid potential false correlations. Instead, here we use cross-plots between all trace elements and Al to distinguish between the possible authigenic or detrital sources of the trace elements.
3.4 Bulk and clay mineralogy
Relative abundances for bulk minerals (calcite, dolomite, siderite, pyrite/marcasite, clays, quartz, k-feldspar, and p-feldspar) and specific clay minerals (illite, smectite, chlorite, and kaolinite) were measured using X-ray diffraction (XRD) on the <2 µm fraction for thirteen (13) samples. Preparation of samples followed the methodology detailed after Moore and Reynolds (1989). The analysis was carried out at the Illinois State Geological Survey, Geochemistry Section, Prairie Research Institute, University of Illinois. The clay content was measured using a Scintag® XDS2000 diffractometer. The samples were oriented on to glass slides and step-scanned from 2° to 60° 2θ with a fixed time of 5 s per 0.05° 2θ for bulk minerals and from 2° to 34° 2θ with a fixed rate of 2° per min with a step size of 0.05°2θ for clay minerals. Instrument calibration is verified using Si XRD NBS standards #640 and #640a, and NIST standard reference materials. The results were analyzed using the semi-quantitative data reduction software from Materials Data Inc. (MDI) known as Jade+®.
3.5 Biomarkers
Preparation of the lipid extracts followed the procedures carried out by Socorro et al. (2017), and Herdocia and Maurrasse (2022) which were modified after methods used on board research vessels of the Ocean Drilling Program (e.g., Marlow et al., 2001; Bastow et al., 2007). Lipids were extracted from powdered rocks using a sonic bath for 30 min in a 10 mL solution of 1:9 methanol/dichloromethane (MeOH/DCM). Sulfur was removed by adding activated copper to the total lipid extracts as the lipid extracts were concentrated by evaporation. The nonpolar compounds, containing the n-alkanes, acyclic isoprenoids, hopanes, and steranes, were separated from the total lipid extract via column chromatography using silica gel as a stationary phase and 5 mL of hexane as the elutant.
All biomarker analyses were conducted at FIU’s Advanced Mass Spectrometry Facility. The n-alkanes were measured using gas chromatography mass spectrometry (GC/MS) on an Agilent 6,890/Agilent 5973 GC/MS. The GC used a temperature program that was set to hold at 65°C for 2 min, then ramped up to 300°C at a rate of 4°C/min and then held at 300°C for 8 min. Detection for the single-quadrupole MS was set to scan mode to monitor 42–500 m/z.
Hopane and steranes were analyzed using a Bruker EvoQ GC triple-quadrupole MS in metastable reaction monitoring mode (MRM-GC/MS/MS). The oven was programed to hold at 65°C for 2 min, then ramped up to 310°C at a rate of 4°C/min and then held isothermally for 10 min. MRM transitions include m/z 370 → 191, 384 → 191, 398 → 191, 412 → 191, 426 → 191, 440 → 191, 454 → 91, 468 → 191, and 482 → 191 for the C27 to C35 hopanes. The C27 to C30 steranes and diasteranes used m/z 372 → 217, 386 → 217, 400 → 217, and 414 → 217 MR M transitions.
The thermal maturity of the section was assessed using two hopane parameters which utilize the C27 hopane and the C31 hopane. For the C27 hopane thermal maturity assessment the Ts/(Ts + Tm) or Ts/Tm ratio was calculated as follows:
The C31 hopane thermal maturity parameter uses the C31 22S/(22S + 22R) homohopane isomerization ratio as follows:
3.6 Correlations
The majority of correlations used in this study are calculated using Microsoft Excel 2016 which utilizes Pearson correlations (r): ; where xi and yi are the corresponding sample values, and x̄, ȳ are the sample averages. The calculated r-values vary from −1 to 1, where −1 is a perfect negative correlation, 0 refers to no correlation, and 1 is equivalent to a perfect positive correlation.
Linear cross-plots with R2 values generated by Microsoft Excel 2016 are also employed to determine correlations between Al and the other trace elements.
4 Results
4.1 TIC and TOC
Figure 3 is a compendium of the lithostratigraphy together with the results for TIC, TOC, and δ13Corg, also shown in Table 1. Overall TIC content fluctuates between 0% and 89.6% (Figure 3B), and the temporal distribution of these values permits to distinguish 3 distinct units defined below.
FIGURE 3
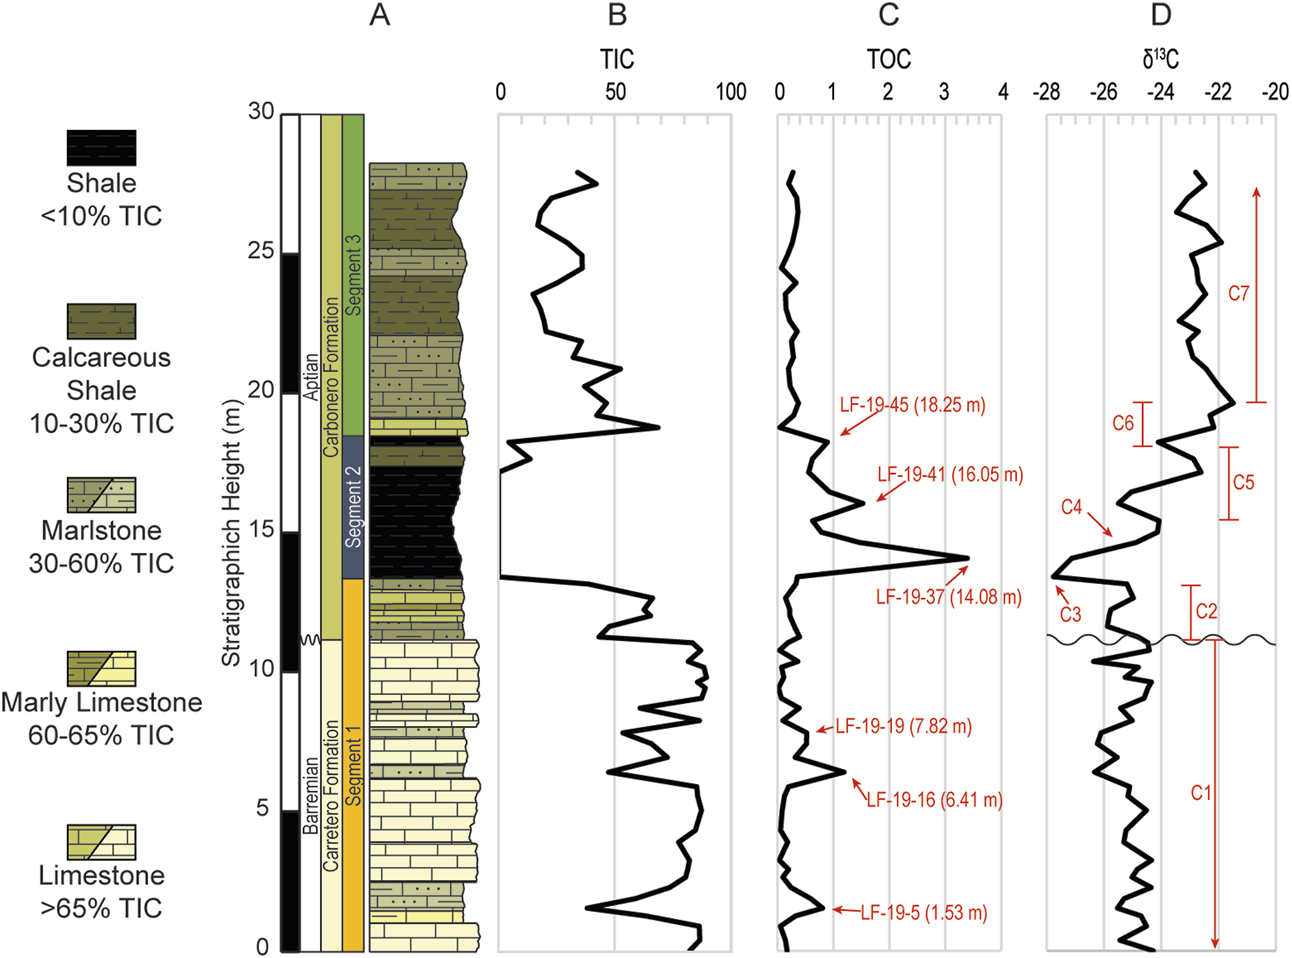
(A) Simplified lithologic column of the ∼28 m studied interval of the La Frontera section. Carbon geochemistry plots: (B) total inorganic carbon (TIC) in %CaCO3; (C) total organic carbon (TOC) in %C; (D) carbon isotope curve on the organic carbon (δ13Corg) plotted in per mil (‰) relative to the Vienna Pee Dee Belemnite standard (VPDB).
TABLE 1
| Sample | Height (m) | TIC (%CaCO3) | TOC (%C) | δ13Corg (‰) |
|---|---|---|---|---|
| LF-19–65 | 27.93 | 34.10 | 0.28 | −22.8 |
| LF-19–64 | 27.52 | 42.11 | 0.20 | −22.5 |
| LF-19–63 | 27.01 | 22.89 | 0.34 | −23.1 |
| LF-19–62 | 26.5 | 18.22 | 0.37 | −23.5 |
| LF-19–61 | 26.03 | 16.93 | 0.34 | −22.4 |
| LF-19–60 | 25.41 | 29.59 | 0.27 | −21.9 |
| LF-19–59 | 24.96 | 35.98 | 0.18 | −22.9 |
| LF-19–58 | 24.5 | 36.11 | 0.07 | −22.8 |
| LF-19–57 | 23.97 | 25.27 | 0.33 | −22.7 |
| LF-19–56 | 23.56 | 14.87 | 0.14 | −22.5 |
| LF-19–55 | 23.03 | 18.05 | 0.15 | −22.9 |
| LF-19–54 | 22.6 | 19.63 | 0.22 | −23.4 |
| LF-19–53 | 22.22 | 20.53 | 0.35 | −22.7 |
| LF-19–52 | 21.87 | 35.74 | 0.25 | −23.1 |
| LF-19–51 | 21.29 | 32.18 | 0.29 | −22.9 |
| LF-19–50 | 20.88 | 52.55 | 0.20 | −22.4 |
| LF-19–49 | 20.25 | 37.11 | 0.22 | −22.0 |
| LF-19–48 | 19.65 | 46.50 | 0.37 | −21.5 |
| LF-19–47 | 19.21 | 42.30 | 0.29 | −22.3 |
| LF-19–46 | 18.77 | 68.76 | 0.04 | −22.2 |
| LF-19–45 | 18.25 | 4.50 | 0.89 | −24.1 |
| LF-19–44 | 17.65 | 13.66 | 0.63 | −22.9 |
| LF-19–43 | 17.17 | 0.00 | 0.55 | −22.6 |
| LF-19–42 | 16.46 | 0.00 | 0.93 | −25.0 |
| LF-19–41 | 16.05 | 0.00 | 1.53 | −25.5 |
| LF-19–40 | 15.43 | 0.00 | 0.63 | −24.1 |
| LF-19–39 | 15.02 | 0.00 | 0.78 | −24.1 |
| LF-19–38 | 14.65 | 0.00 | 1.47 | −24.9 |
| LF-19–37 | 14.08 | 0.00 | 3.39 | −27.1 |
| LF-19–36 | 13.42 | 0.00 | 0.36 | −27.8 |
| LF-19–35 | 13.16 | 38.82 | 0.33 | −25.2 |
| LF-19–34 | 12.66 | 66.38 | 0.14 | −25.0 |
| LF-19–33 | 12.24 | 62.72 | 0.22 | −25.8 |
| LF-19–32 | 12.02 | 65.55 | 0.22 | −25.8 |
| LF-19–31 | 11.64 | 47.78 | 0.30 | −25.9 |
| LF-19–30 | 11.26 | 43.31 | 0.39 | −24.8 |
| LF-19–29 | 11.05 | 83.51 | 0.18 | −24.5 |
| LF-19–28 | 10.78 | 87.07 | 0.04 | −24.4 |
| LF-19–27 | 10.38 | 81.71 | 0.36 | −26.4 |
| LF-19–26 | 10.17 | 88.45 | 0.07 | −24.8 |
| LF-19–25 | 9.81 | 89.58 | 0.11 | −25.3 |
| LF-19–24 | 9.64 | 85.69 | 0.07 | −24.3 |
| LF-19–23 | 9.43 | 89.07 | 0.02 | −24.5 |
| LF-19–22 | 9.06 | 87.45 | 0.07 | −24.6 |
| LF-19–21 | 8.71 | 61.00 | 0.39 | −25.4 |
| LF-19–20 | 8.26 | 86.56 | 0.10 | −25.0 |
| LF-19–19 | 7.82 | 53.60 | 0.52 | −26.1 |
| LF-19–18 | 7.43 | 65.94 | 0.52 | −26.2 |
| LF-19–17 | 6.94 | 72.71 | 0.31 | −25.5 |
| LF-19–16 | 6.41 | 47.42 | 1.19 | −26.3 |
| LF-19–15 | 5.89 | 85.38 | 0.20 | −25.1 |
| LF-19–14 | 5.55 | 85.75 | 0.12 | −25.2 |
| LF-19–13 | 5.04 | 87.43 | 0.09 | −24.5 |
| LF-19–12 | 4.32 | 84.77 | 0.06 | −25.2 |
| LF-19–11 | 3.9 | 77.58 | 0.18 | −25.3 |
| LF-19–10 | 3.25 | 82.23 | 0.03 | −24.3 |
| LF-19–9 | 2.92 | 81.52 | 0.20 | −24.8 |
| LF-19–8 | 2.64 | 80.59 | 0.09 | −25.0 |
| LF-19–7 | 2.27 | 73.74 | 0.24 | −24.4 |
| LF-19–6 | 1.87 | 59.06 | 0.59 | −25.3 |
| LF-19–5 | 1.53 | 38.18 | 0.81 | −25.5 |
| LF-19–4 | 1.25 | 63.49 | 0.32 | −24.7 |
| LF-19–3 | 0.88 | 86.47 | 0.05 | −24.5 |
| LF-19–2 | 0.38 | 86.67 | 0.14 | −25.4 |
| LF-19–1 | 0 | 82.36 | 0.17 | −24.3 |
Carbon geochemistry (TIC, TOC and δ13Corg) values for the ∼28 m of the La Frontera section with their respective sample ID and stratigraphic height.
Unit 1 (U1) consists of the lowermost 13.13 m of the studied section and constitutes the interval in the succession with the highest TIC values (average 73.1%), ranging from 38.2% to 89.6% TIC. U1 includes 15 individual layers that comprise the Carretero Fm in the lower 11.05 m (zigzag line in Figure 3A) and the lowest portion of the Carbonero Fm in the upper ∼2.37 m. The lower 11.05 m of the section consists of 5 light gray (N7) pelagic limestone layers with 4 medium dark gray (N4) marlstone interbeds (TIC 38.2%–59.1%). A medium dark gray (N4) marly limestone (63.5%) occurs at 1.25 m (Figures 3A, B). The upper portion of U1 that includes the base of the Carbonero Fm is characterized by an abrupt change in the color of the layers to a dark greenish hue up to 13.42 m and that interval contains 3 greenish gray (5GY) marlstone layers separated by 2 olive gray (5Y 4/1) limestone layers.
Unit 2 (U2, from 3.42 m to 18.25 m) is characterized by its sharp decrease in TIC that remains at 0 throughout that interval, except at 17.65 m (TIC 13.7%) and in its upper limit at 18.25 m where there is a slight increase to 4.5% (Figure 3B; Table 1). U2 consists of 3 layers that are mostly of dark gray (N3) shales, with one dark greenish gray (5GY 4/1) calcareous shale layer at 17.65 m.
Finally, unit 3 (U3, from 18.77 m to 27.93 m) is marked by increased TIC values, that vary from 14.9% to 68.8 wt%, with an average of 32.5% (Figure 3B). It is composed of 6 layers: an initial olive gray (5Y 4/1) limestone layer followed by alternating greenish gray (5GY) marlstones and dark greenish gray (5GY 4/1) calcareous shales extending between 18.25 and 27.93 m.
TOC content fluctuates throughout the studied section and varies from 0.02% to a maximum of 3.4% (Figure 3C). The values are characteristically low in U1 where they remain mostly below 1% with an average of 0.25%, except at 6.41 m with a peak of 1.2%. The overlying shale interval (U2) contains the highest TOC values (average 1.1% TOC) and has 3 distinct peaks with progressively decreasing values at 14.08 m (3.4%), 16.05 m (1.5%), and 18.25 m (0.89%). TOC decreases again in U3 where the values stay above 0, but not surpassing 0.37%, with an average 0.24%.
4.2 δ13Corg
The studied section yields δ13Corg values that vary within a range of ∼6.3‰, from −27.8‰ to −21.5‰ (Figure 3D). Regarding the three lithologic units identified in the section (Figure 3A), isotopic values within U1 are relatively stable (−26.4‰ to −24.3‰) averaging −25.1‰. The greatest variability in the carbon isotope values develops in U2, the shale interval. The most negative value, −27.8‰, occurs at the base of U2 (13.42 m), followed by a 3.7‰ positive shift up to −24.1 at 15.43 m. This high is followed by a negative swing to −25.5‰ at 16.05 m before an increase to −22.6‰ at 17.17 m. Another negative inflection to −24.1‰ ensues at 18.25 m, which is about the topmost limit of U2. Subsequently, the carbon isotope increases to its most positive value of −21.5‰ at 19.65 m in the transition to U3. Finally, the carbon isotope values drop slightly to −22.9‰ at 21.29 m and remain relatively stable between −23.5‰ and −21.9‰ up to the end of the studied interval with an average of −22.8‰.
4.3 Elemental concentrations: major, biolimiting, and redox sensitive trace elements
Results for 30 samples analyzed for major elements (Al, Si, Ti), biolimiting elements (Fe, P), Mn, and RSTEs (V, Cr, Cu, U, Mo) are listed in Table 2 and shown on Figures 3, 4.
TABLE 2
| Sample | Height (m) | Al (mg/g) | Si (mg/g) | Ti (mg/g) | P (mg/g) | Fe (mg/g) | V (ppm) | Cr (ppm) | Cu (ppm) | Mo (ppm) | U (ppm) | Mn (ppm) |
|---|---|---|---|---|---|---|---|---|---|---|---|---|
| LF-16–65 | 27.93 | 96.93 | 310.30 | 4.10 | 0.49 | 53.61 | 116.0 | 132.2 | 150.1 | 0.5 | 1.8 | 845.435 |
| LF-19–62 | 26.5 | 132.60 | 408.21 | 6.03 | 0.49 | 62.86 | 164.2 | 180.7 | 152.3 | 0.5 | 3.5 | 371.555 |
| LF-19–60 | 25.41 | 110.59 | 333.03 | 5.30 | 0.55 | 62.26 | 129.5 | 150.3 | 117.8 | 0.4 | 2.0 | 638.175 |
| LF-19–58 | 24.5 | 90.78 | 301.76 | 3.97 | 0.64 | 54.85 | 105.2 | 125.8 | 90.8 | 0.3 | 1.8 | 984.3525 |
| LF-19–57 | 23.97 | 112.47 | 367.83 | 5.29 | 0.62 | 54.35 | 156.2 | 195.7 | 234.9 | 0.7 | 3.0 | 380.1475 |
| LF-19–56 | 23.56 | 136.88 | 428.03 | 5.81 | 0.53 | 71.89 | 149.6 | 181.6 | 176.5 | 0.4 | 2.4 | 338.315 |
| LF-19–53 | 22.22 | 139.96 | 391.85 | 6.18 | 0.70 | 68.19 | 169.6 | 190.7 | 143.1 | 0.6 | 4.1 | 445.7825 |
| LF-19–50 | 20.88 | 70.47 | 207.31 | 2.77 | 0.60 | 45.23 | 84.2 | 95.0 | 40.3 | 0.2 | 1.9 | 1,606.598 |
| LF-19–49 | 20.25 | 99.39 | 316.33 | 4.36 | 0.46 | 52.55 | 117.1 | 139.2 | 69.4 | 0.3 | 1.8 | 464.92 |
| LF-19–46 | 18.77 | 38.17 | 132.54 | 1.53 | 0.56 | 35.13 | 48.7 | 53.1 | 69.4 | 0.2 | 2.0 | 2,490.288 |
| LF-19–45 | 18.25 | 173.70 | 471.67 | 7.91 | 0.63 | 72.44 | 245.5 | 252.6 | 179.0 | 0.5 | 4.3 | 208.0375 |
| LF-19–43 | 17.17 | 169.82 | 535.94 | 7.73 | 0.56 | 68.71 | 225.0 | 249.5 | 136.0 | 0.8 | 3.6 | 183.005 |
| LF-19–41 | 16.05 | 150.82 | 542.14 | 7.44 | 0.40 | 37.22 | 347.7 | 306.3 | 149.0 | 2.5 | 8.3 | 79.995 |
| LF-19–40 | 15.43 | 169.17 | 572.70 | 8.08 | 0.33 | 43.73 | 220.6 | 260.5 | 94.9 | 0.9 | 4.6 | 97.3525 |
| LF-19–38 | 14.65 | 165.39 | 591.31 | 7.60 | 0.36 | 41.78 | 287.3 | 260.0 | 125.1 | 2.1 | 7.1 | 98.2575 |
| LF-19–37 | 14.08 | 173.07 | 850.38 | 9.36 | 0.44 | 38.85 | 365.9 | 280.8 | 248.0 | 12.3 | 12.1 | 85.6925 |
| LF-19–36 | 13.42 | 192.01 | 715.04 | 8.89 | 0.34 | 47.13 | 250.0 | 253.6 | 170.4 | 0.5 | 5.2 | 121.93 |
| LF-19–34 | 12.66 | 49.69 | 190.48 | 2.00 | 0.66 | 28.85 | 67.9 | 68.1 | 45.8 | 0.5 | 2.3 | 1,339.93 |
| LF-19–31 | 11.64 | 110.53 | 295.62 | 4.45 | 0.74 | 50.89 | 139.0 | 146.2 | 103.0 | 0.7 | 3.6 | 671.875 |
| LF-19–29 | 11.05 | 23.68 | 64.29 | 0.86 | 0.41 | 14.01 | 27.9 | 31.2 | 30.2 | 0.2 | 0.9 | 1,268.29 |
| LF-19–25 | 9.81 | 16.73 | 57.35 | 0.61 | 0.35 | 13.14 | 22.1 | 23.0 | 18.7 | 0.1 | 0.9 | 1,188.578 |
| LF-19–20 | 8.26 | 22.38 | 66.59 | 0.88 | 0.46 | 12.90 | 27.3 | 29.9 | 18.7 | 0.2 | 0.9 | 1837.365 |
| LF-19–19 | 7.82 | 101.40 | 253.71 | 4.12 | 0.84 | 46.31 | 147.6 | 144.1 | 90.9 | 0.8 | 3.5 | 1,433.335 |
| LF-19–17 | 6.94 | 52.31 | 137.20 | 2.05 | 0.64 | 25.26 | 66.4 | 69.5 | 42.8 | 0.3 | 2.4 | 1,375.075 |
| LF-19–16 | 6.41 | 111.96 | 281.51 | 5.42 | 0.63 | 55.38 | 165.5 | 163.4 | 111.9 | 1.0 | 3.7 | 864.4075 |
| LF-19–13 | 5.04 | 22.08 | 65.97 | 0.87 | 0.37 | 15.11 | 33.4 | 30.9 | 26.6 | 0.2 | 0.9 | 1,204.183 |
| LF-19–9 | 2.92 | 32.33 | 91.29 | 1.27 | 0.47 | 17.43 | 43.4 | 45.1 | 29.5 | 0.2 | 1.2 | 1,078.018 |
| LF-19–5 | 1.53 | 139.62 | 349.35 | 5.60 | 0.68 | 59.42 | 179.8 | 199.8 | 161.9 | 0.8 | 4.1 | 407.295 |
| LF-19–3 | 0.88 | 22.43 | 72.10 | 0.90 | 0.36 | 13.65 | 25.4 | 30.8 | 20.7 | 0.1 | 0.9 | 1,145.648 |
| LF-19–1 | 0 | 31.39 | 89.33 | 1.24 | 0.39 | 17.37 | 47.8 | 43.6 | 35.9 | 0.4 | 1.1 | 1,078.25 |
Absolute values of the major elements (Al, Si and Ti), biolimiting elements (Fe and P), redox-sensitive trace elements (RSTEs) (V, Cr, Cu, Mo, and U), and manganese of the La Frontera section. Concentrations for major elements are reported in milligrams per Gram (mg/g) and concentrations for all other trace metals are reported as parts per million (ppm).
FIGURE 4
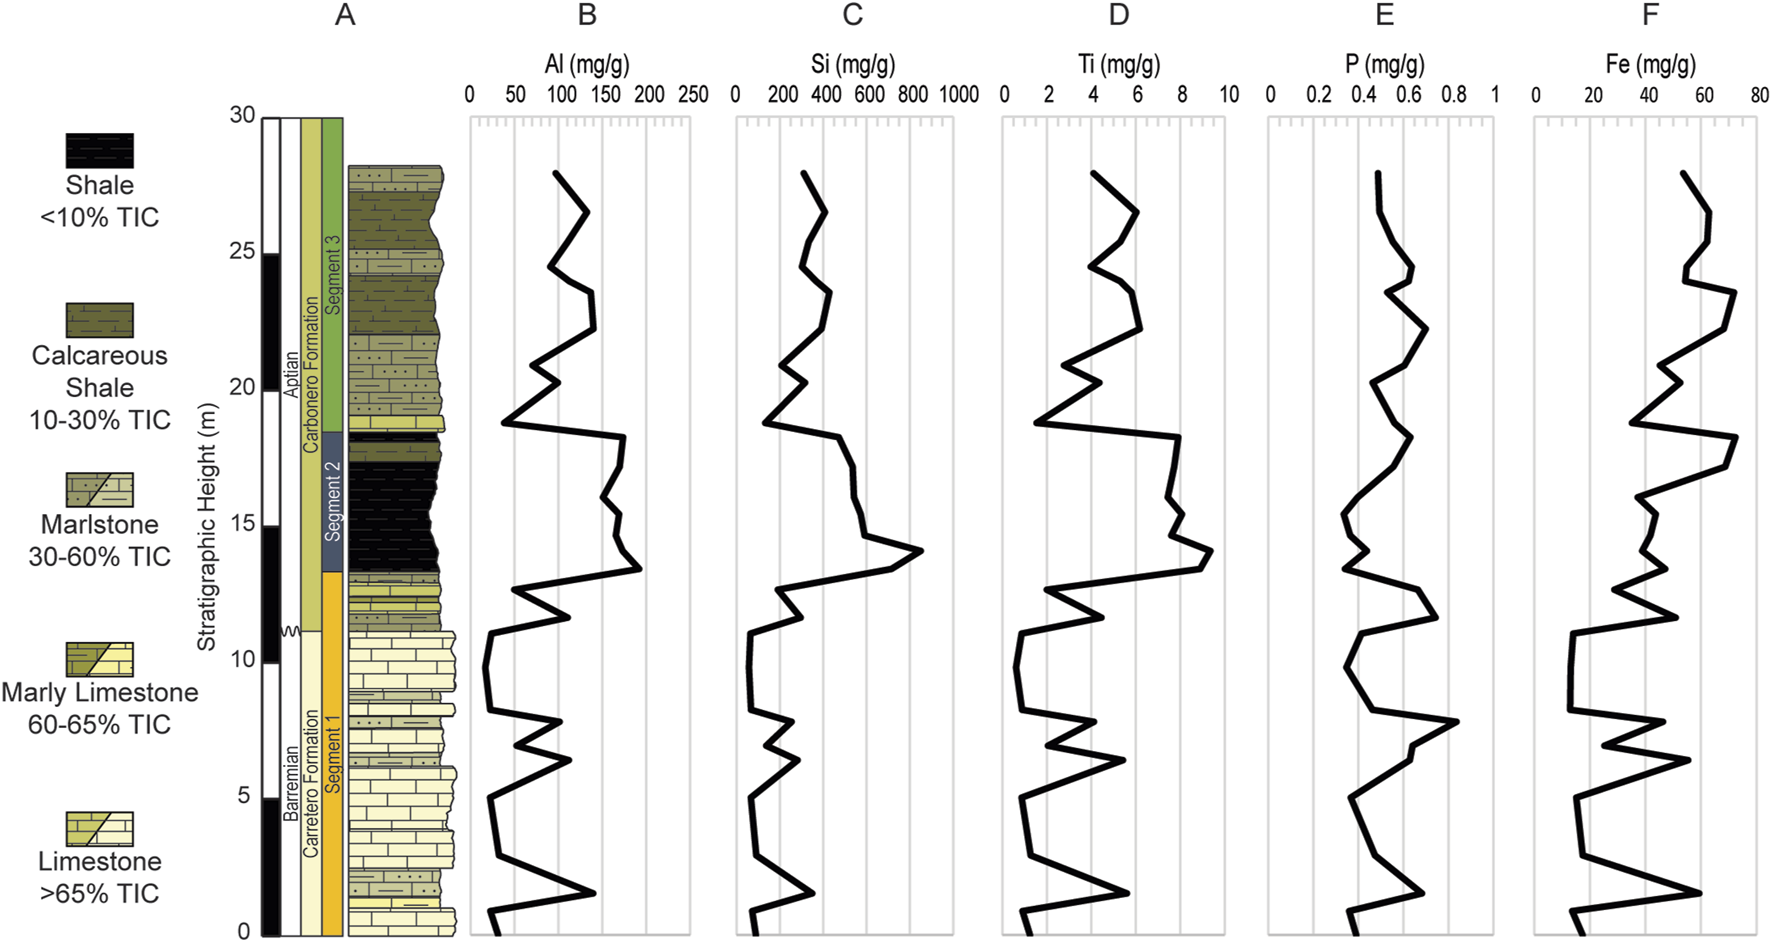
(A) Simplified lithologic column of the ∼28 m studied interval of the La Frontera section with vertical distribution of the major elements, (B) Al, (C) Si, (D) Ti and the biolimiting elements, (E) P, and (F) Fe. Values are in milligram per gram (mg/g).
The highest values for all the major elements occur within the shale layers, especially within U2, while the lowest values occur in the limestone layers, namely, within U1 (Figure 4). Major elements fluctuate with lithology and increase inversely with TIC, sharing a strong negative correlation with TIC (r = Al, −0.97; Si, −0.95; Ti, −0.97). By comparison Al, Si, and Ti share a positive correlation with TOC (r = Al, 0.56; Si, 0.70; Ti, 0.63).
Biolimiting elements Fe and P vary independently of each other (Figures 4E, F). Fe varies from 12.9 mg/g to 72.4 mg/g with an average of 42.7 mg/g, and P fluctuates from 0.33 mg/g to 0.84 mg/g with an average of 0.52 mg/g. Generally, Fe follows the lithology with higher values occurring mostly where TIC is lower (r = −0.77) but follows a similar trend with Al (r = 0.77), especially within U1 and U3. In U1 Fe has a strong correlation with both Al (r = 0.99) and TOC (r = 0.84), although in U2 it becomes mostly decoupled from Al (r = 0.26) and TOC (r = −0.49). Subsequently, during U3 Fe is strongly correlated to Al (r = 0.96) and moderately to TOC (r = 0.49). Overall, P neither shares particular trends with TIC (r = −0.03), Al (r = 0.10), nor TOC (r = −0.10). However, within U1 P covaries with Al (r = 0.83) and TOC (r = 0.56), decreases in U2 and varies independently of both Al (r = −0.03) and TOC (r = −0.04). P remains partly decoupled from Al (r = 0.05) and TOC (r = 0) in the succeeding U3.
Most of the RSTEs follow an apparent trend correlative with Al, namely, V (r = 0.92), Cr (r = 0.97), Cu (r = 0.84), and U (r = 0.74) and relates to lithology, whereby their highest values occur within the shale interval U2 (Figures 5A-H). Unlike the other RSTEs Mo remains substantially below 1 ppm throughout the studied section but reaches peaks at 3 levels: 14.08 m (12.3 ppm), 14.65 m (2.1 ppm), and 16.05 m (2.5 ppm) which coincide with the 2 highest TOC values (14.08 m and 16.05 m), moreover, Mo shares a strong positive correlation with TOC (r = 0.91; Figure 5G). Manganese concentration varies from 80.0 to 2,490.3 ppm with the highest average value (x̄ = 1,145.6 ppm) in U1. Sustained Mn lowest values occur in U2, remaining below 209 ppm (80.0–208.0 ppm, x̄ = 124.9 ppm), and increases in U3, varying from 338.3 to 2,490.3 but with an average of x̄ = 797.6 ppm, below that attained in U1.
FIGURE 5
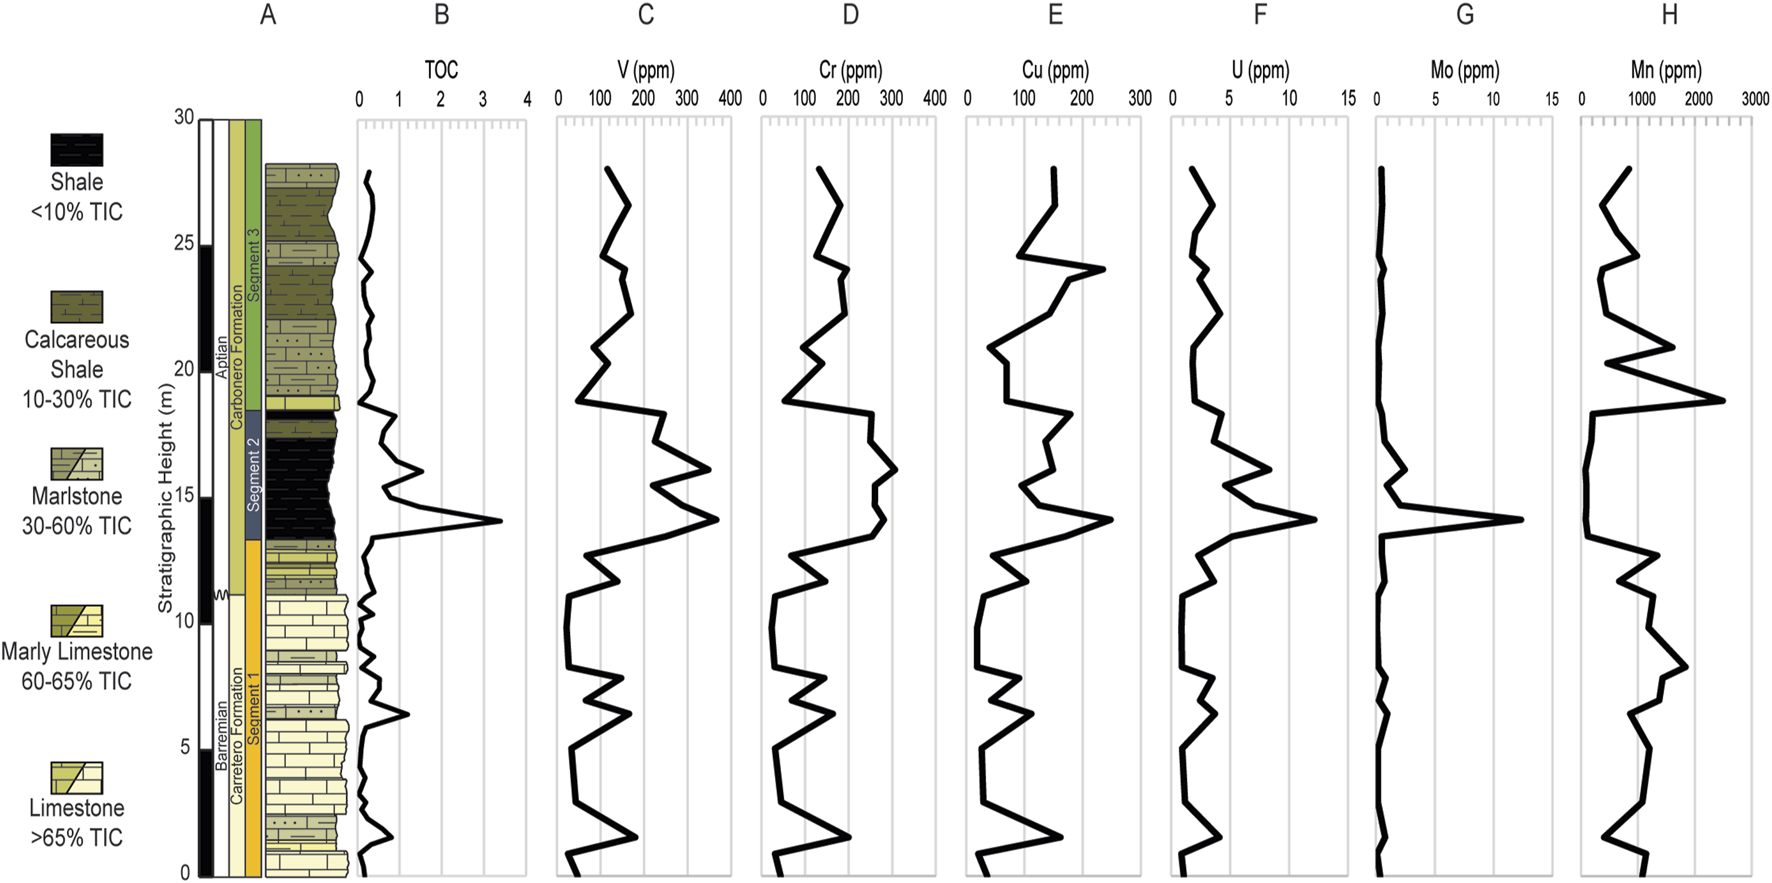
(A) Simplified lithologic column of the ∼28 m studied interval of the La Frontera section. Vertical trends of trace metals plotted with TOC (B). (C–G) RSTEs: V, Cr, Cu, U, and Mo. (H) Mn. TOC values are in %C and all trace metals are reported in parts per million (ppm).
4.4 Clay and bulk mineralogy
Figures 6A-E; Table 3 show the clay and bulk mineralogy results for 13 representative samples of the various lithologies. The dominant clay mineral throughout the section is illite with values between 47% and 72%, and an overall average of 63%. The lowest illite value occurs within U2 at 15.02 m where smectite is highest. Smectite is the next most abundant clay mineral present with values ranging from 20% to 51%, and an average of 29%. Chlorite content varies from 0% to 9%, with an average of 5% while kaolinite is the least abundant clay in the section with values from 0% to 6% and an average of 3%. Lithology does not seem to be a factor for illite content as it shows a weak correlation with TIC (r = 0.42), whereas smectite content decreases with increasing TIC (r = −0.75) both chlorite and kaolinite vary strongly with TIC (r = 0.88 and r = 0.82, respectively).
FIGURE 6
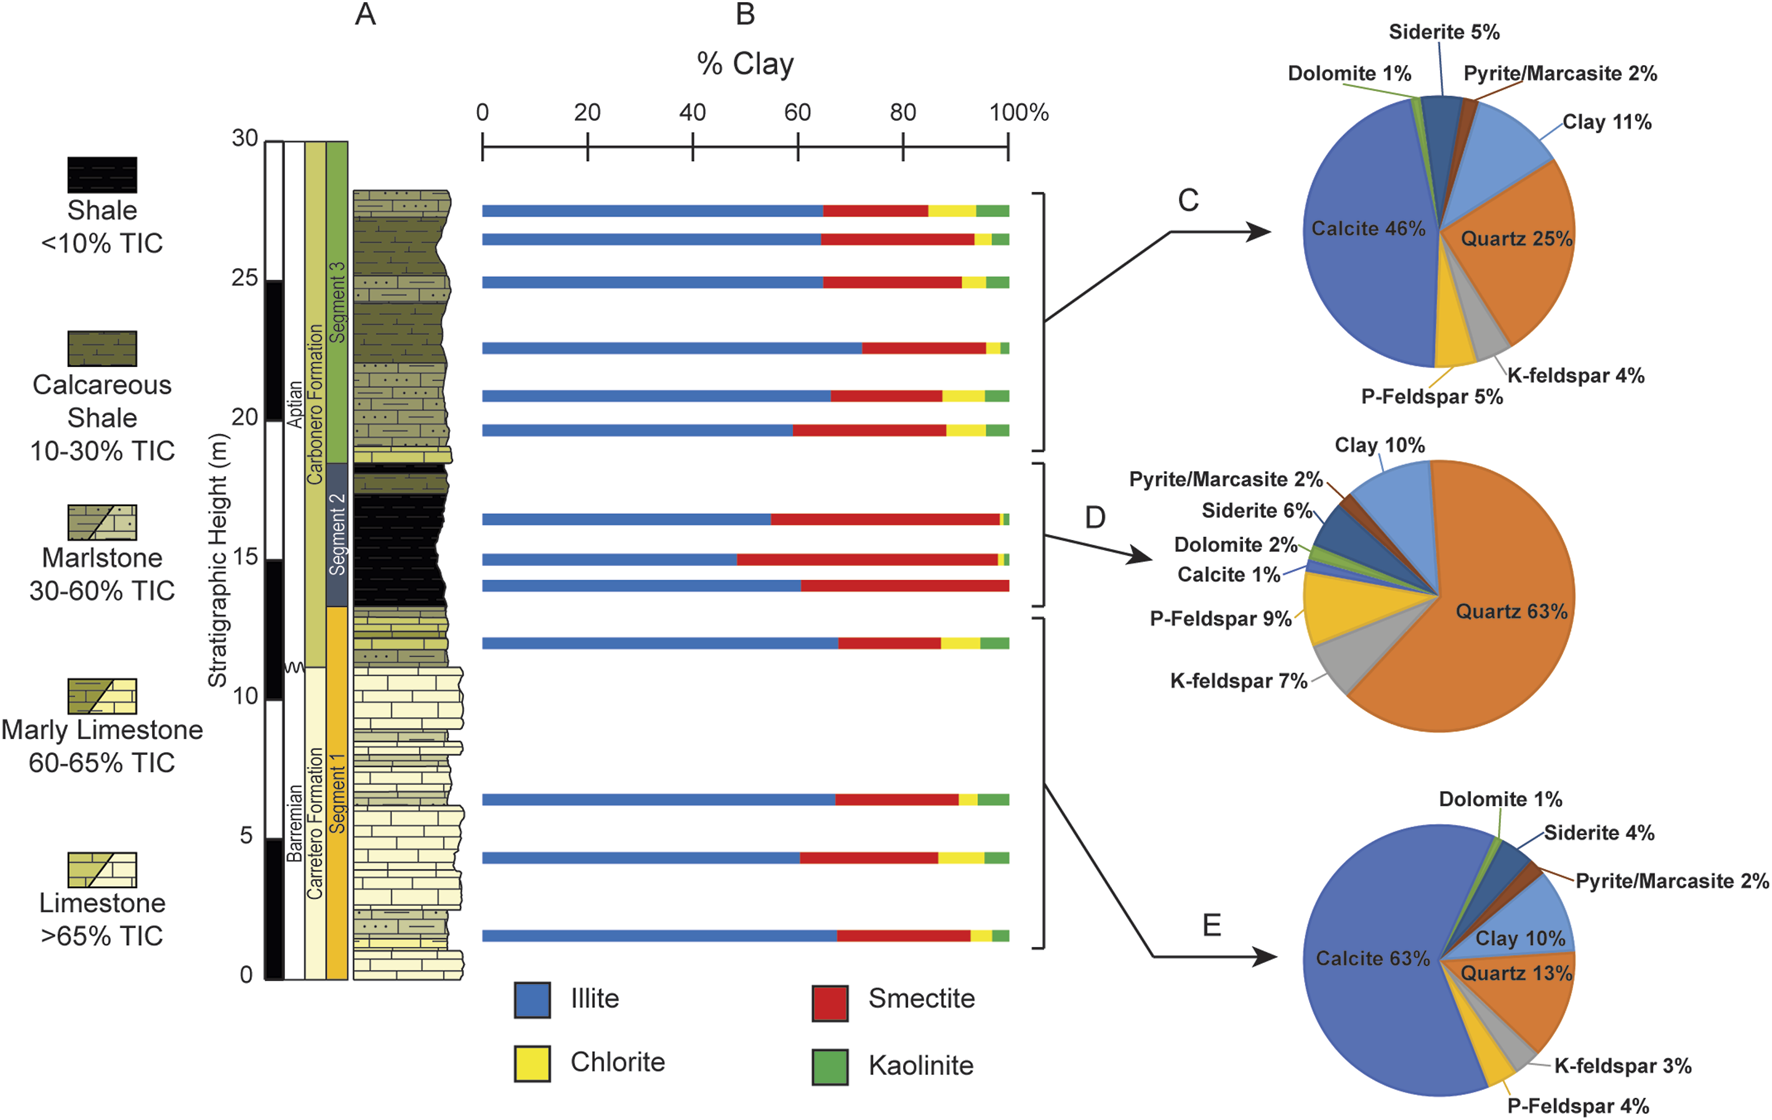
(A) Simplified lithologic column of the ∼28 m studied interval of the La Frontera section. (B) Vertical distribution of the relative abundances for the clay minerals (<2 µm fraction): illite, smectite, chlorite, and kaolinite. (C) Average bulk mineral abundance for unit 3. (D) Average bulk mineral abundance for unit 2. (E) Average bulk mineral abundance for unit 1.
TABLE 3
| Bulk minerals | Clay minerals | ||||||||||||
|---|---|---|---|---|---|---|---|---|---|---|---|---|---|
| Sample | Height (m) | Calcite | Quartz | K-feldspar | P-feldspar | Siderite | Pyrite/Marcasite | Dolomite | Clay | Illite | Smectite | Chlorite | Kaolinite |
| LF-19–64 | 27.52 | 50% | 24% | 4% | 5% | 4% | 1% | 1% | 10% | 65% | 20% | 9% | 6% |
| LF-19–62 | 26.5 | 31% | 35% | 7% | 7% | 4% | 2% | 1% | 12% | 64% | 29% | 3% | 3% |
| LF-19–59 | 24.96 | 44% | 24% | 5% | 6% | 6% | 3% | 1% | 11% | 65% | 26% | 5% | 4% |
| LF-19–54 | 22.6 | 35% | 30% | 5% | 6% | 6% | 3% | 2% | 12% | 72% | 24% | 3% | 1% |
| LF-19–50 | 20.88 | 61% | 19% | 2% | 3% | 3% | 1% | 1% | 10% | 66% | 21% | 8% | 4% |
| LF-19–48 | 19.65 | 55% | 18% | 3% | 4% | 7% | 1% | 1% | 11% | 59% | 29% | 8% | 4% |
| LF-19–42 | 16.46 | 1% | 56% | 8% | 13% | 6% | 3% | 2% | 11% | 55% | 44% | 1% | 1% |
| LF-19–39 | 15.02 | 2% | 61% | 6% | 9% | 7% | 1% | 2% | 12% | 47% | 51% | 1% | 1% |
| LF-19–37 | 14.08 | 1% | 72% | 7% | 5% | 4% | 1% | 1% | 8% | 61% | 39% | 0% | 0% |
| LF-19–32 | 12.02 | 67% | 12% | 2% | 1% | 4% | 3% | 1% | 10% | 68% | 20% | 7% | 5% |
| LF-19–16 | 6.41 | 56% | 16% | 4% | 5% | 5% | 2% | 1% | 11% | 67% | 23% | 4% | 6% |
| LF-19–12 | 4.32 | 75% | 7% | 2% | 3% | 3% | 1% | 1% | 8% | 60% | 26% | 9% | 5% |
| LF-19–5 | 1.53 | 52% | 18% | 6% | 5% | 4% | 2% | 1% | 12% | 67% | 25% | 4% | 3% |
Relative abundance values for bulk mineralogical content and clay mineralogy for the La Frontera Section.
Bulk mineralogy (Figures 6C–E) shows calcite as the most abundant mineral with fluctuating values from 1% to 75% (average = 41%). Quartz is second (7%–72%, average = 30%) and is predominant in U2 (average = 63%). Clay minerals are third in abundance with an average of 11% (8%–12%). Accessory minerals include plagioclase feldspar (1%–13%), potassium feldspar (2%–8%), siderite (3%–7%), pyrite/marcasite (1%–3%), and dolomite (1%–2%). The pie charts (Figures 6C–E) illustrate the bulk minerals averaged for each of the 3 units where differences become more apparent. U1 stands in sharp contrast to U2 due the predominance of calcite while U2 shows the most abundant quartz. Remarkably, during U2 calcite becomes supplanted by quartz, P-feldspar, and K-feldspar (5% each; Figure 6D). Then in the uppermost unit (U3) calcite increases again reaching an average of 46%, followed by quartz, clays, P-feldspar, siderite, K-feldspar, Pyrite, and then dolomite (Figure 6C).
4.5 Biomarkers
Biomarker analysis from the aliphatic portion of the lipid extracts was carried out on 25 samples and focuses primarily on the n-alkanes. The total ion chromatogram shows that the aliphatic fraction is predominantly comprised of n-alkanes, the acyclic isoprenoids pristane (2,6,10,14-tetramethylpentadecane, or Pr) and phytane (2,6,10,14-tetramethylhexadecane, or Ph) with essentially no unresolved complex mixture (UCM; Figure 7). Figure 8 shows that the n-alkanes range from nC12 to nC25 and have a unimodal distribution with a positive skew. Short-chain n-alkanes (<nC19) are found throughout the length of the studied section while longer chains (>nC20) are only found within the shale interval (U2) and in one sample in U1 (6.41 m, sample LF-19-16, Figure 3C).
FIGURE 7
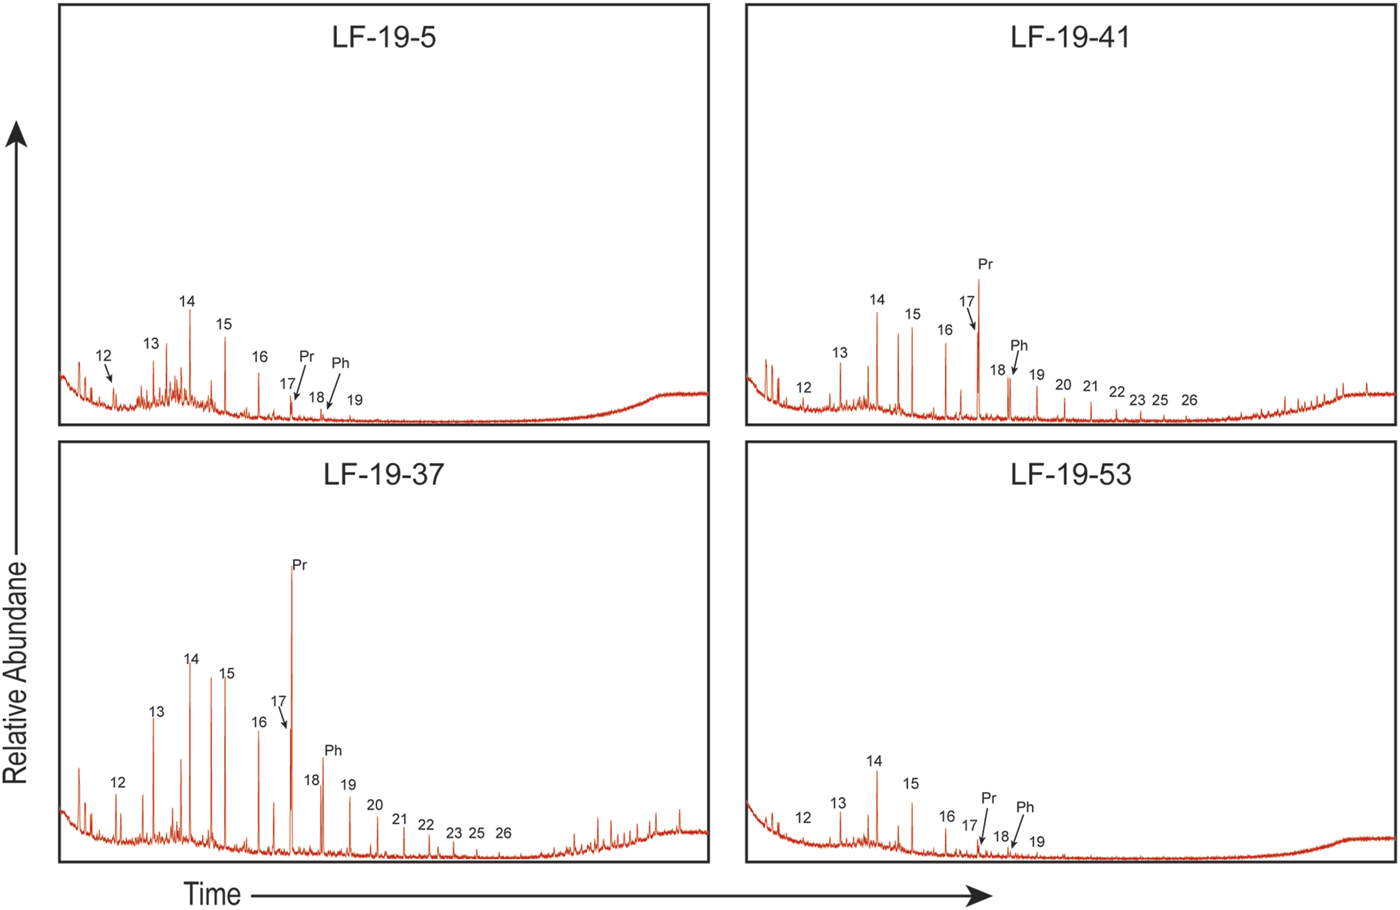
Total ion chromatograms for the aliphatic fraction from select samples: LF-19-5, 1.53 m, U1; LF-19-37, 14.08 m, U2; LF-19-41, 16.05, U2; LF-19-53, 22.22 m, U3.
FIGURE 8
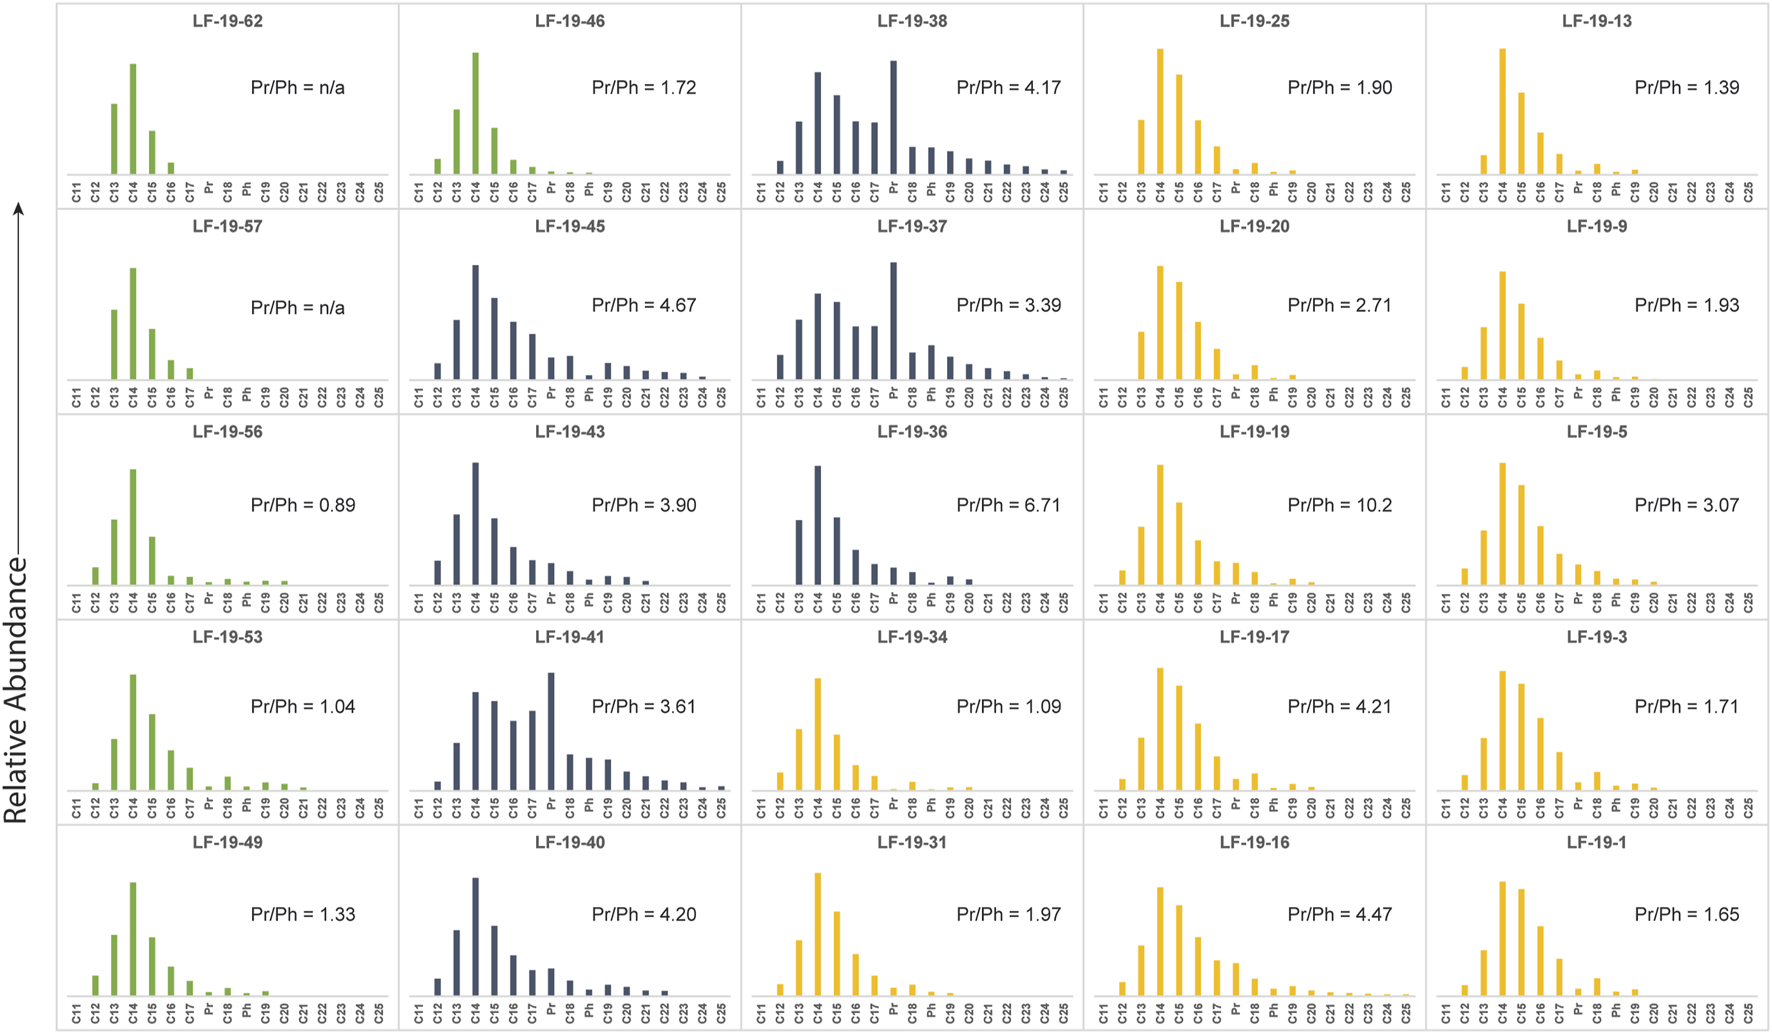
n-alkane distribution for all analyzed samples. Yellow colored bar graphs represent n-alkane distributions for samples in Unit 1, gray colored bar graphs represent n-alkane distributions for samples in Unit 2, and green colored bar graphs represent n-alkane distributions for samples in Unit 3.
Hopanes (m/z 191) and steranes (m/z 217, m/z 218, and m/z 259) were measured on 9 of the 25 analyzed samples, but only 2 had results from which reliable interpretations could be drawn (samples: LF-19–37 (14.08 m) and LF-19–41 (16.05 m), both from U2 at levels with highest TOC values (Figure 3C). Observed hopanes in these samples include 18α-22,29,30-trisnorneo-hopane (Ts), 17α-22,29,30-trisnorhopane (Tm), and C31 homohopane (Figure 9). The Ts/(Ts + Tm) ratio was only determined at these levels because Ts was not detected in the other analyzed samples which all had very low TOC (<0.81%). Gammacerane was not detected at any level within the studied interval. Regular steranes and diasteranes were identified at most analyzed levels except at levels with <0.33% TOC.
FIGURE 9
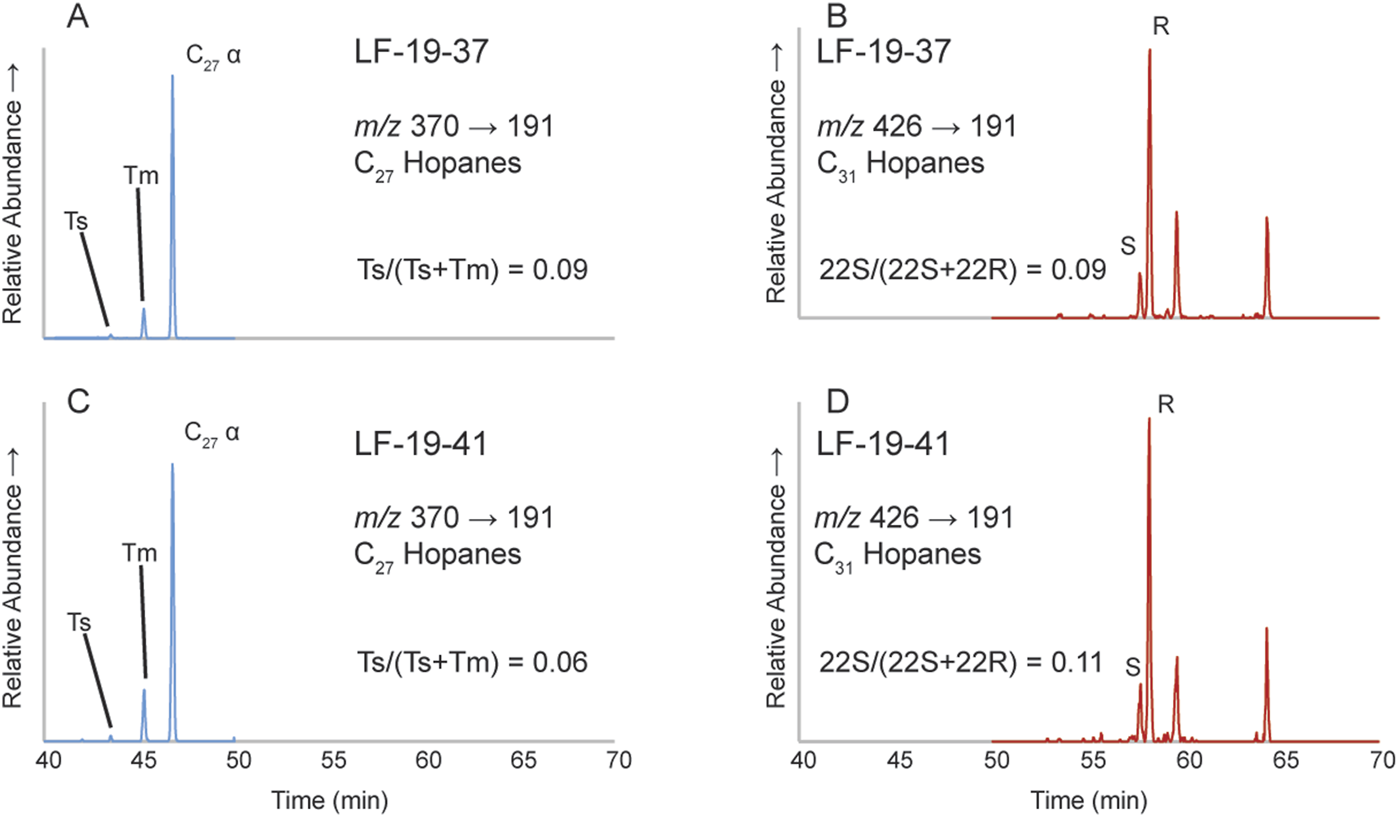
Metastable reaction monitoring (MRM) transition profiles from 2 samples (LF-19–37, 14.08 m and LF-19–41, 16.05 m), showing the distribution of various hopanes. (A) C27 hopane MRM for LF-19-37. (B) C31 hopane MRM for LF-19-37. (C) C27 hopane MRM for LF-19-41. (D) C31 hopane MRM for LF-19-41.
5 Discussion
5.1 Thermal maturity assessment: reliability of organic geochemical proxies
The organic geochemical archive that permits reliable interpretation of useful criteria such as the stable-carbon isotope and the origin of the organic matter in the sedimentary record becomes altered with increasing thermal maturity (Philippi, 1965; Seifert and Moldowan, 1980; Mackenzie et al., 1980; Clayton, 1991; Clayton and Bjorøy, 1994; Peters et al., 2005; Peters et al., 2007). Hence, it is necessary to consider the extent of thermal degradation to better understand the information provided by these proxies. Common molecular maturity parameters include ratios of certain stereoisomerization reactions of hopanes and steranes (e.g., Mackenzie et al., 1980; Farrimond et al., 1998; Socorro and Maurrasse, 2020; Socorro and Maurrasse, 2022; Londoño and Collins, 2022). These proxies rely on the basis that the relative abundance of the non-biogenic stereoisomer increases relative to its biogenic counterpart as the degree of thermal maturity increases, because the non-biogenic stereoisomer is more stable at higher temperatures (Curiale et al., 1989; Peters et al., 2007).
Here we rely on the C27 hopane and the C31 homohopane isomerization reactions as thermal maturity indices. The biologically produced C31 homohopane contains a 22R configuration at the C-22 position and converts to 22S isomer as thermal maturity increases (Peters et al., 2007). Rising temperatures cause the C31 homohopane 22S/(22S + 22R) ratio to increase from 0 up to equilibrium (0.57–0.62) during the main phase of oil generation (Peters et al., 2007). Similarly, the C27 hopane 18α-22,29,30-trisnorneohopane (Ts) remains more stable at higher temperatures while the C27 17α-22,29,30-trisnorhopane (Tm) becomes less stable as temperature increases (equilibrium values: 0.52–0.55) (Seifert and Moldowan, 1978). Thus, the Ts/(Ts + Tm) ratio can similarly be used to estimate thermal maturity.
The samples analyzed at La Frontera have C31 homohopane 22S/(22S + 22R) ratios from 0.05 to 0.38 (Figure 9) which are below the equilibrium values. Likewise, the ratios for Ts/(Ts + Tm) range from 0.06 to 0.09, again lower than equilibrium values. Accordingly, low Ts/(Ts + Tm) values along with C31 22S/(22S + 22R) values below equilibrium indicate that the samples are thermally immature, therefore their geochemical signals have experienced little to no alteration related to thermal modification. Our results agree with previous findings on 2 samples within OAE1a in La Frontera indicating thermally immature OM based on 22S/(22S + 22R) homohopane ratios, C30 βα/(βα+αβ) hopane ratios, ββ/(ββ+αα) sterane ratios, and 20S/(20S + 20R) sterane ratios (Quijano et al., 2012). A further biomarker study (Aguado et al., 2014a) reiterated the earlier results of the La Frontera section based on the C31 22S/(22S + 22R) 17a , 21b-homohopane ratio, C30 βα/(βα + αβ) hopane ratios, and the odd-over-even carbon number predominance (OEP) of the long chain n-alkanes (>nC24).
Moreover, fluctuations in the clay mineralogy can allude to the degree of thermal diagenetic alteration of sedimentary rocks, as secondary illite may form due to thermal diagenesis of smectite- or kaolinite-illitization with increasing depth (Cuadros and Linares, 1996; Sangüesa et al., 2000). Both types of illitization reactions occur at increasing burial temperatures. Smectite illitization begins as temperatures rise above 50°C (Cuadros and Linares, 1996; Du et al., 2019; Hower et al., 1976; Deer et al., 1977; McIntosh et al., 2021) and kaolinite illitization occurs in the temperature range of 130°C–150°C (Bjørkum and Gjelsvik, 1988; Bjørlykke and Aagaard, 1992). The relative abundance of illite content (Figure 6B) does not increase with depth, thus corroborating with the biomarker thermal maturity proxies, supporting that the sample are thermally immature, By contrast, another study of OM on the equivalent lithologic succession, the Carbonero section, approximately 18 km west of the La Frontera section revealed different results (Castro et al., 2019). The study used 22S/(22S + 22R) homohopane ratios, C29 20S/(20S + 20R) steranes ratio, C29 (C29ββ/ββ+αα) steranes ratio, C30 hopanes (βα/βα + αβ) ratio and the n-alkane CPI ratio which revealed a thermal maturity hovering within the peak oil window to slightly over mature (Castro et al., 2019). These contradicting results indicating high thermal maturity were presumed to be OM recycled from weathering ancient rocks at the time of deposition, which may underscore lateral variability in the continental margin topography that controlled the delivery of terrigenous supply to the Subbetic Basin.
5.2 Chemostratigraphic correlation
The La Frontera section has been dated using δ13Corg calibrated to calcareous nannofossils, foraminifera, and radiolarian biochronology (Aguado et al., 1992; de Gea et al., 2012; Aguado et al., 2014a; Aguado et al., 2014b). Aguado et al. (2014a) identified carbon isotope segments C1 to C8 in their study of the La Frontera section. In this work, carbon isotope segments C1 to C7 have been recognized and correlated to Roter Sattel section in Switzerland, the Cismon section in northern Italy (Menegatti et al., 1998), the El Pui and the El Pujal sections in northeastern Spain (Sanchez-Hernandez and Maurrasse, 2016; Socorro and Maurrasse, 2022), the Cuchía section in northern Spain (Herdocia and Maurrasse, 2023), the Calabianca section in southern Italy (Bellanca et al., 2002), and the Cau section in southeastern Spain (de Gea et al., 2003; Figure 10).
FIGURE 10
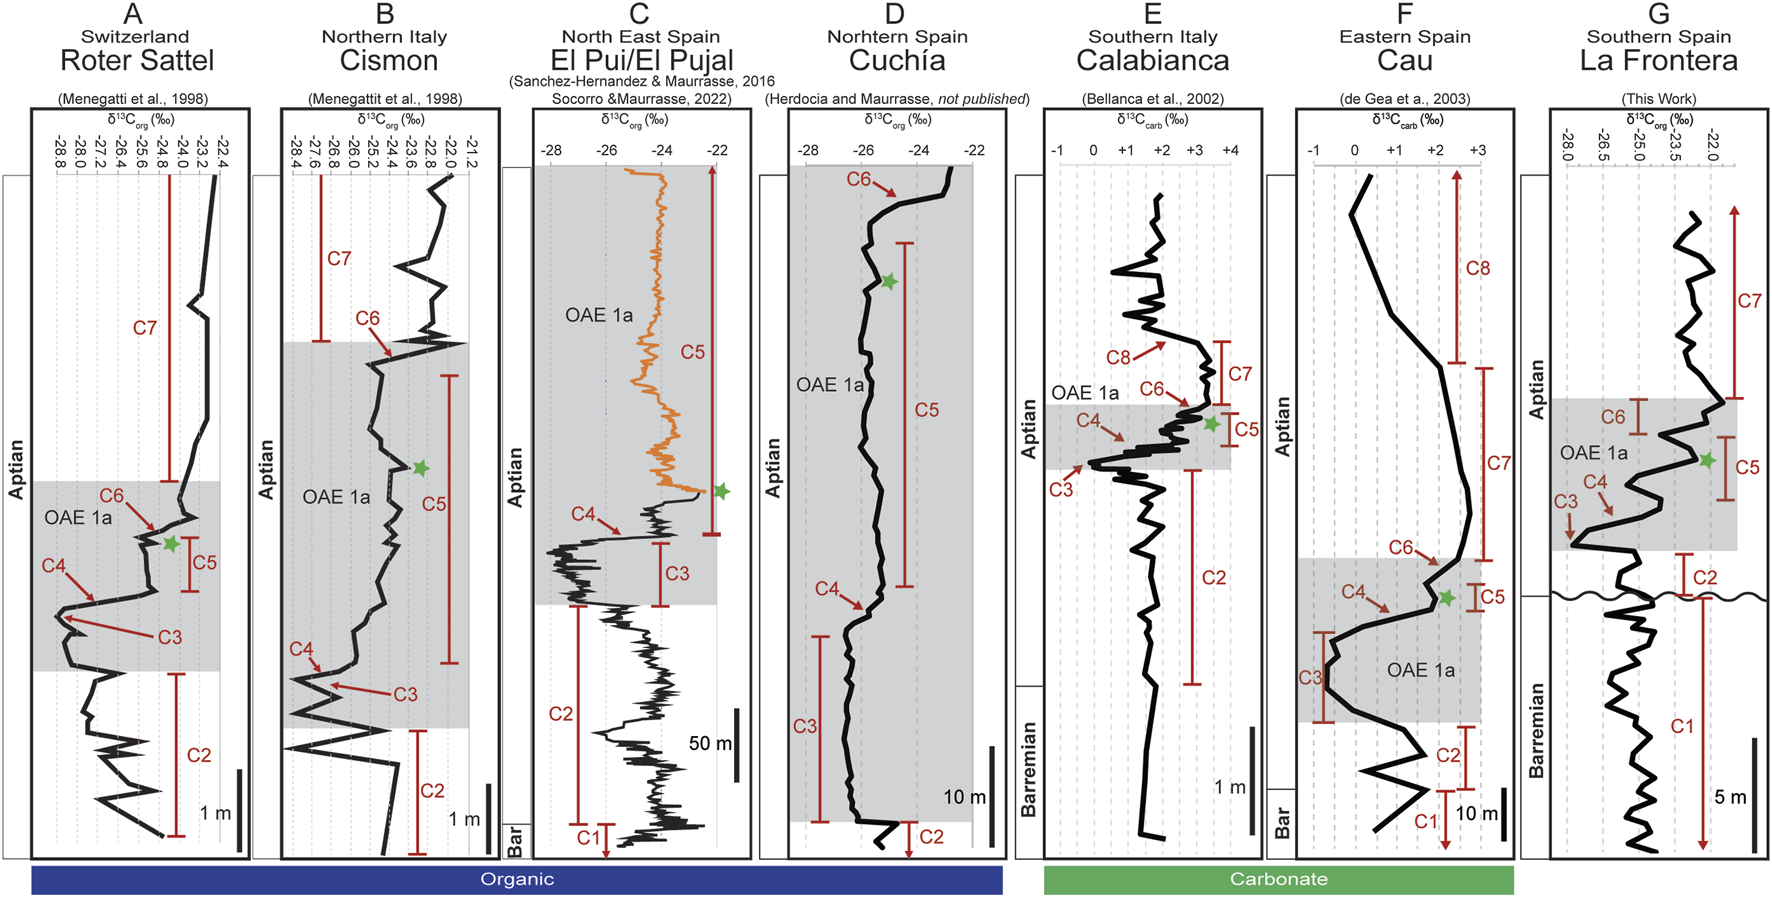
Chemostratigraphic correlation determined by the δ13Corg of the La Frontera section (G) with the (A) Roter Sattel section (Menegatti et al., 1998), (B) Cismon section (Menegatti et al., 1998), (C) El Pui (black; Socorro and Maurrasse, 2022) and the El Pujal sections (Gold, Socorro and Maurrasse, 2022), (D) the Cuchía section (Herdocia and Maurrasse, submitted), (E) the Calabianca section (Bellanca et al., 2002), and (F) the Cau section (de Gea et al., 2003). The green star indicates a positive peak found in segment C5 at all sites.
Thus, in this study we use the carbon isotope segments C1 to C8 described by Menegatti et al. (1998) to confirm the stratigraphic position of our study interval. In the original description of the carbon isotope segments C3 is characterized by a strong negative inflection, or the carbon isotope excursion (CIE), followed by a positive shift (C4) indicative of OAE1a (Menegatti et al., 1998). This process for the identification of OAE1a using the carbon isotope curve has been established to be a robust method for chemostratigraphic correlations of coeval sites as the carbon isotope expression in both the organic carbon (δ13Corg) and carbonate (δ13Ccarb) isotopes are recognized globally (e.g., Menegatti et al., 1998; Kuhnt et al., 1998; Leckie et al., 2002; Yilmaz et al., 2004; Forster et al., 2004; Godet et al., 2006; Michalík et al., 2008; Sanchez-Hernandez and Maurrasse, 2016; Socorro and Maurrasse, 2022). Indeed, some variability is expected from site to site as local factors specific to each basin such as OM source, diagenesis, or species-specific fractionation of organic carbon may affect the carbon isotopic values (Ravelo and Fairbanks, 1995; Feakins et al., 2007; Godet et al., 2014).
The lower part of U1 (0–11.05 m, Carretero Fm) correlates with carbon isotope segment C1 as the isotopic values (δ13Corg) range from −26.4‰ to −24.3‰ and average −25.1‰ (Figure 10G; Table 1). These δ13Corg values are consistent with those obtained for the Roter Sattel section in which the values are close to −25.4‰ (Figure 10A; Menegatti et al., 1998). Biostratigraphic studies conducted at coeval sites containing the Carretero Fm and the Carbonero Fm within the Subbetic basin identified a hiatus between the two formations (Aguado et al., 1997; Aguado et al., 1999; de Gea et al., 2008; Aguado et al., 2014a; Aguado et al., 2014b). The stratigraphic break is based on coccolithophores indicating the presence of Flabellites oblongus without H. irregularis in the upper part of the Carretero Fm, placing it in the uppermost part of the Micrantholithus hoschulzii nannofossil zone (Aguado et al., 1997; Aguado et al., 1999). The presence of Hayesites irregularis, Nannoconus truittii, and Braarudosphaera africana in the overlying Carbonero Fm, places this interval in the upper H. irregularis nannofossil zone which is equivalent to the upper part of the Deshayesites weissi ammonite zone (Aguado et al., 1997; Aguado et al., 1999). The hiatus should include a gap which spans through the upper Colchidites sarasini ammonite zone, the whole Deshayesites tuarkyricus ammonite zone, and the lower D. weissi ammonite zone, which has been attributed to a period where subsidence was at a minimum (de Gea et al., 2008). Therefore, the upper portion of U1 (11.05–13.16 m, base of the Carbonero Fm) corresponds to carbon isotope segment C2 with values averaging −25.4‰ during this interval (Figure 10G; Table 1).
The most negative carbon isotope values reach −27.8‰ at the start of U2 (13.42 m) with a pronounced 2.7‰ negative shift from segment C2 (Figures 3D, 10G; Table 1), consistent with the maximum negative carbon isotope value correlative with segment C3, as observed in the Roter Sattel section which has a ∼4.4‰ negative shift (Menegatti et al., 1998; see Figure 10A). This characteristic negative CIE characterizes the base of OAE1a at the La Frontera section, thus comparable to similar sharp shifts recorded in deposits of the Tethyan domain such as ∼2.4‰ for segment C3 at Cismon, ∼3.0‰ at El Pui, 1.8‰ at Cuchía, ∼2.3‰ (δ13Ccarb) at Calabianca, and ∼2.3‰ (δ13Ccarb) at Cau (Figure 10). Likewise, at La Frontera, a rapid positive shift of 3.7‰ occurs from 14.08 to 15.43 m indicative of carbon isotope segment C4, which agrees with the isotopic shift of ∼3.4‰ at Roter Sattel, ∼2.5‰ at Cismon, ∼3.7‰ at El Pui, ∼1.0‰ at Cuchía, ∼2.3‰ (δ13Ccarb) at Calabianca, and ∼3.3‰ (δ13Ccarb) at Cau. Segment C5 at La Frontera extends from 15.43 to 18.25 m where the isotope values dip from −24.1‰ (15.02 m) to −25.5‰ (16.05 m) then increases to −22.6‰ (17.17 m), followed by a decline to −24.1‰ (18.25 m). In extended sections, segment C5 is typically described as a plateau where isotopic values are centered on ∼25.2‰ analogous to Roter Sattel. In different sections segment C5 also includes a characteristic slight positive peak (Figure 10; marked with a green star). This minor peak precedes the decline that follows reaching a minimum of −24.1‰ at its termination. This short-lived positive excursion in C5 can be observed at Cismon (∼263.3 m; Figure 10B; Menegatti et al., 1998), at Calabianca (∼2.1 m depth; Figure 10E; Bellanca et al., 2002) and particularly in the extended El Pui section abutting with the El Pujal section (Figure 10C) (Sanchez-Hernandez and Maurrasse, 2016; Socorro and Maurrasse, 2019).
A sudden positive shift corresponds to segment C6 which begins at 18.25 m and continues through 19.65 m, crossing into U3 (Figure 3D) where values increase by 2.6‰, up to −21.5‰, consistent with similar increase of ∼2.4‰ at Roter Sattel, ∼3.2‰ at Cismon, 2.9‰ at Cuchía, ∼1.0‰ at Calabianca, and ∼0.5‰ at Cau (Figure 10). Finally, the upper portion of La Frontera, from 19.65 m to 27.93 m, is assigned to segment C7 where values are centered on ∼ −22.8‰, comparable to the values at Roter Sattel (−23.2‰), Cismon (−22.9‰), Calabianca (∼3.5‰, δ13Ccarb), and Cau (∼3.7‰, δ13Ccarb) (Figure 10).
5.3 Assessment of sediment accumulation rate
The sediment accumulation rate may play an important role in the preservation of OM because increased burial of OM prevents its oxidation, although it could also lead to an apparent lower TOC values due to a dilution effect (Tyson, 2001). Therefore, assessing the bulk sediment accumulation rate can shed light on potential factors that influence OM preservation and intrinsic TOC values.
Most recent values of estimated sedimentation rates associated with OAE1a at different sections (e.g., Kuhnt et al., 2011; Lorenzen et al., 2013; Castro et al., 2021; Socorro and Maurrasse, 2022) followed the chronology of the carbon isotopic segments determined by Li et al. (2008) using orbital tuning at the Santa Rosa section, NE Mexico. Hence, the integrated durations for carbon isotope segments C3, C4, C5, and C6 were quantified from the Cismon APTICORE (Italy) being ∼1.27 Ma and the Santa Rosa section (NE Mexico) ∼ 1.28 Ma. More precisely, the duration for each of the carbon isotope segments was estimated as follows: C3 = 27–44 kyr; C4 = 330 kyr; C5 = 570 kyr, and C6 = 310–330 kyr (Li et al., 2008). However, because there is evidence that the Cismon APTICORE experienced some dissolution or an unconformity at the onset of OAE1a within the C3 interval the proposed duration for C3 was regarded as an underestimation (Li et al., 2008; Kuhnt et al., 2011; Castro et al., 2021; Leandro et al., 2022). Given this uncertainty with the Cismon APTICORE standard, other studies initiated elsewhere have determined the duration of C3 with some large variability between sites. For instance, Kuhnt et al. (2011) estimated the duration of segment C3 at La Bédoule (SE France) to be greater than 100 kyr, whereas Lorenzen et al. (2013) estimated a duration of 280–350 kyr for C3 from a core (LU1) drilled at La Bédoule. In addition, more recently Leandro et al. (2022), determined that the Selli Event (C3 to C6) had a duration of 920 kyr using orbital tuning of the Poggio le Guaine core from the Umbria-Marche Basin in Italy. Combining the estimates of these previous studies we use the durations of the bulk sediment accumulation rates for La Frontera as follows: C3 ∼100–350 kyr; C4 ∼ 330 kyr: C5 ∼ 570 kyr, and C6 ∼310–330 kyr, or 920 kyr from the Poggio le Guanie core (Leandro et al., 2022).
Thus, the dry bulk sediment accumulation rates for the studied section yield the following values: segment C3 is 0.92 m (13.16–14.08 m), using a range of 100–350 kyr as the duration of C3, it may range between 0.3 and 0.9 cm/kyr; C4 is 1.35 m (14.08–15.43 m), it is 0.4 cm/kyr; C5 is 2.82 m (15.43–18.25 m) it is 0.5 cm/kyr; and C6 is 1.4 m thick (18.25–19.65 m) it is 0.4–0.5 cm/kyr. By comparison, based on 1.3 Ma duration for OAE1a, the average sediment accumulation rate at La Frontera with a thickness of 6.49 m is ∼0.5 cm/kyr, or 0.7 cm/kyr using 920 kyr (Leandro et al., 2022), whereas at La Bédoule the average sediment accumulation rate is 1.6–2 cm/kyr (Lorenzen et al., 2013). An even greater difference is observed for the coeval Carbonero section from the External zone of the Subbetic Basin located ∼18 km west of La Frontera which has an average sediment accumulation rate of 3 cm/kyr (Castro et al., 2006) or ∼4 times the rate observed at La Frontera. These differences can likely be attributed to variable subsidence rates between the two sites as indicated in the paleogeographic reconstruction in Figure 11 of (Aguado et al., 2014b).
FIGURE 11
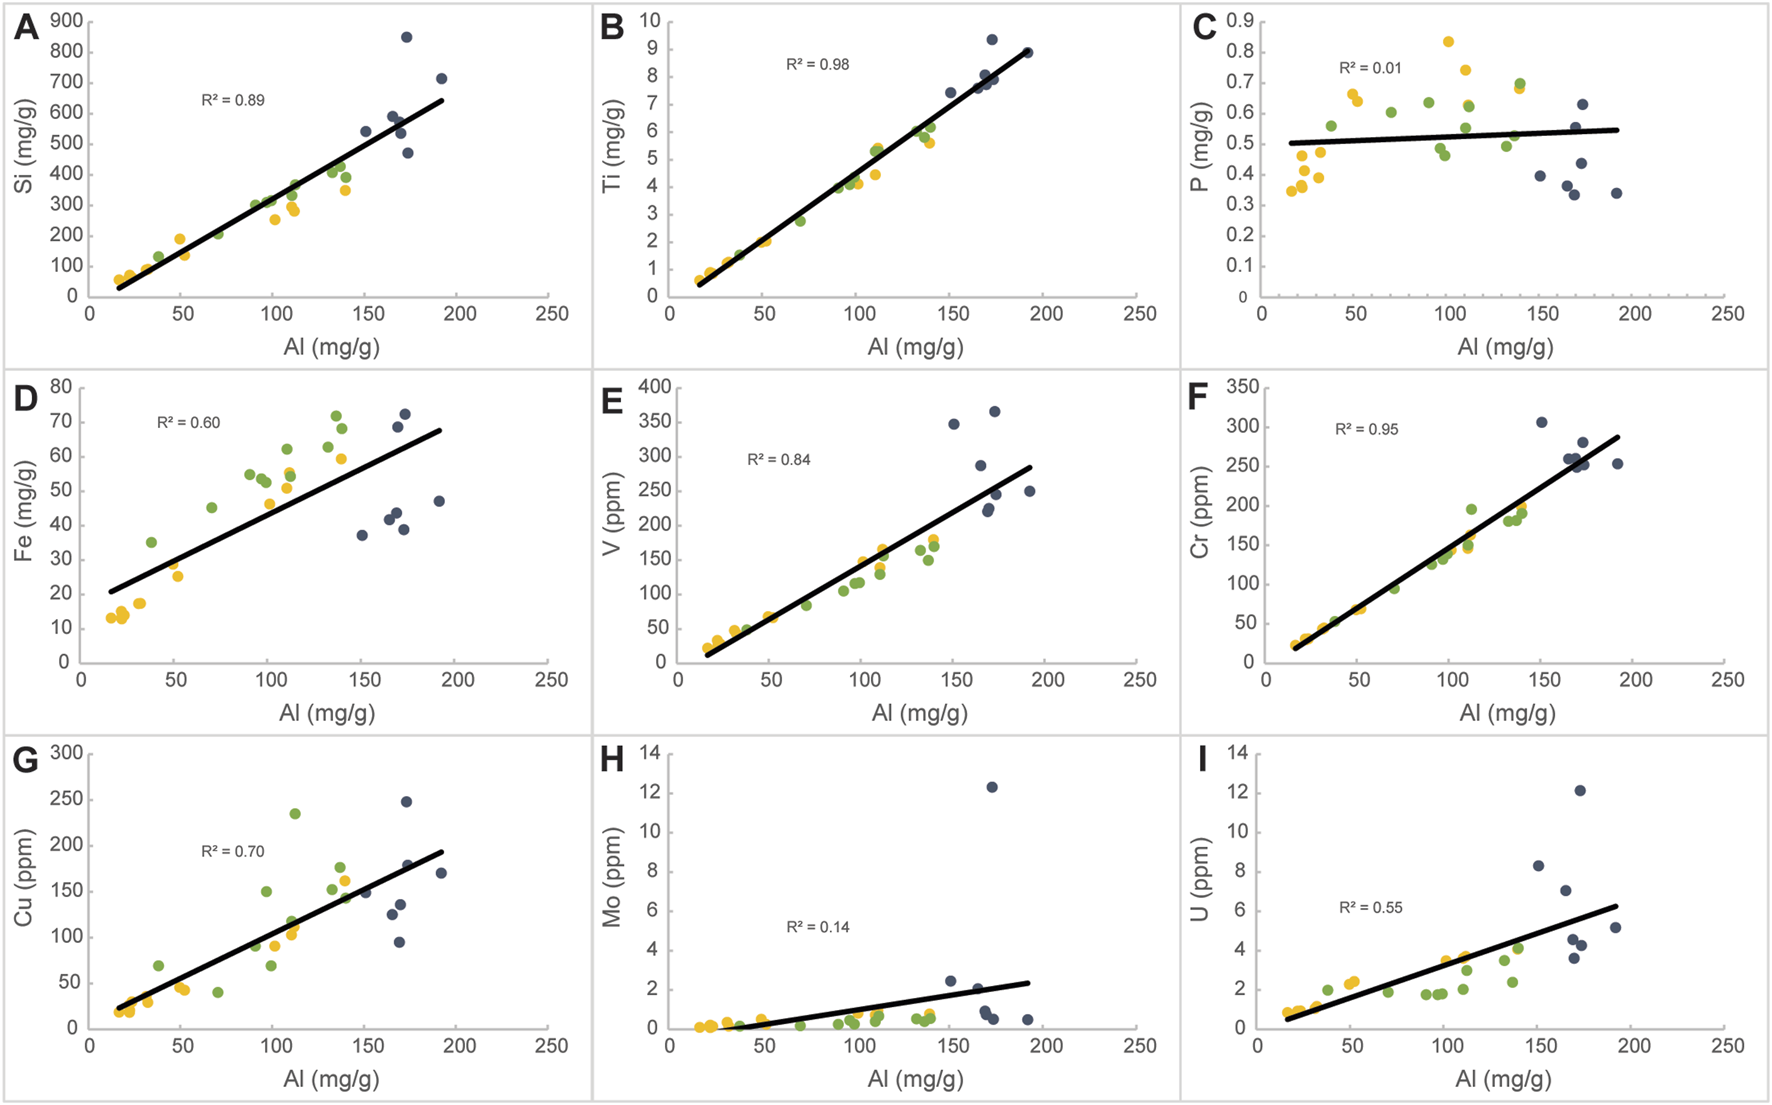
Linear cross plots of all measured trace elements versus Al, showing the correlation coefficient (R2). (A) Silicon; (B) titanium; (C) phosphorous; (D) iron; (E) vanadium; (F) chromium; (G) copper; (H) molybdenum (I) uranium. Yellow colored dots represent samples in Unit 1, gray colored dots represent samples in Unit 2, and green colored dots represent samples in Unit 3.
Hence, despite the differences in the estimated duration of the isotopic segments, the average accumulation rate being 0.3 to a maximum of 0.9 cm/kyr indicates that on the overall this part of the Subbetic Basin did not experience appreciable changes in the sediment accumulation rate that would lead to dilution effects or increased OM preservation observed at the onset of OAE1a in the U2 interval (Figure 3C). However, the lack of carbonate in U2 (carbon isotope segments C3–C5) may reflect an underestimation for the bulk sedimentation rates discussed above.
5.4 Sources of organic matter
Marine sedimentary deposits are typically composed of a mixture of land-derived material, minerals that precipitated from the ocean water, biogenic tests, and residual organic matter of marine organisms (Seibold and Berger, 2017). Thus, the OM may be supplied by autochthonous and allochthonous sources. For instance, overland flow may introduce OM sourced from higher plants or soils with characteristic carbon compounds different from those of the marine algae and bacteria produced in situ. Most OM is remineralized (>90%) as it sinks through the water column and consequently only a small fraction is preserved in the geologic record (Eadie, 1984; Hedges, 1987; Goldberg et al., 2009). The organic molecules that reach the seafloor are susceptible to further diagenetic alteration and the molecules preserved in ancient rocks or sediments are the stabilized end products characteristic of their parent compound (biomarkers), therefore they are representative of the original organic molecule (Meyers, 2003; Peters et al., 2005). Although these compounds are capable of being biodegraded as bacteria consume hydrocarbons, typically beginning with the low molecular weight n-alkanes followed by the acyclic isoprenoids (Pr and Ph) and then continuing with the higher molecular weight components (Peters et al., 2005). As this process of degradation continues, the major resolved compounds are removed, leaving behind other complex molecules that cannot be resolved by GC/MS. This fragmentation results in the formation of an unresolved complex mixture (UCM) hump in the chromatograms (Meyers, 2003; Peters et al., 2005). However, aliphatic hydrocarbons are regarded as robust biomarkers that can be used for characterization of the OM sources because of their relatively strong resistance to microbial degradation (Eglinton and Eglinton, 2008).
In the samples from La Frontera, chromatograms show no evidence of any UCM (Figure 7), therefore they can be regarded as unaltered by biodegradation. Biomarker signatures can also be affected by elevated temperatures as these conditions can alter organic molecules by breaking the covalent C-C bonds (Seifert and Moldowan, 1980; Mackenzie et al., 1980; Peters et al., 2005; Eglinton and Eglinton, 2008). However as discussed in the Thermal Maturity Assessment (Section 5.1), the samples collected are thermally immature. Thus, the distribution of the n-alkanes is representative of the original OM deposited at La Frontera. Generally, short chain n-alkanes, up to nC19, are a distinctive of products generated from marine phytoplankton (Cranwell, 1973; Cranwell et al., 1987; Forster et al., 2004; Peters et al., 2005), whereas OM derived from aquatic macrophytes tend to have carbon chains between nC20 and nC25 (Cranwell, 1984; Ficken et al., 2000). Land plants generate long chain n-alkanes (>nC25) that come from their epicuticular wax coating and have strong odd-over-even carbon preference, where nC27, nC29, and nC31 are typically have the highest relative abundances with respect to the other high molecular weight n-alkanes (Eglinton and Hamilton, 1967; Peters et al., 2005; Eglinton and Eglinton, 2008).
The measured biomarkers from La Frontera revealed an n-alkane distribution with chain lengths from nC12 to nC25 with a positive skew centered on nC14 for all analyzed samples. However, the stratigraphic distribution of the n-alkanes varies for each of the units in La Frontera. For example, the lower unit (U1) is dominated by short-chain n-alkanes, mostly not exceeding nC20 except at 6.41 m (sample LF-19-16) where the chain-length reaches up to nC25 with low relative abundances in the longer chain n-alkanes (Figure 8). By contrast, within the overlying unit (U2), chain-lengths above nC20 are observed in 6 of the 7 samples analyzed for that interval, although low molecular weight n-alkanes are still predominant. In U3 the n-alkanes mostly do not surpass nC20, except for LF-19–53; 22.22 m (Figure 8).
In all 25 analyzed samples the low molecular weight n-alkanes were the most abundant biomarkers observed, suggesting that the OM is mostly being produced by microbial phytoplankton communities. Presumably, periods of enhanced terrestrial fluxes supplied the longer chain n-alkanes (nC20 to nC25), derived from aquatic macrophytes (Cranwell, 1984; Ficken et al., 2000). This is supported by increased concentrations in the major elements which occur concurrently with periods of higher molecular weight n-alkanes at 6.41 m (Figures 2, 3, 7; LF19-16) as well as within U2. Given that OAE1a has been reported to coincide with enhanced hydrological cycles (Barron et al., 1981; Jenkyns, 2003; Fletcher et al., 2008; Blättler et al., 2011; Sanchez-Hernandez and Maurasse, 2016; Socorro and Maurasse, 2022; Herdocia and Maurasse, 2022, and others), the data obtained here further exemplifies the degree of continental influence that occurred globally at that time. Overall, the highest TOC content occurs within U2, or during OAE1a, where long chain n-alkanes are increasingly prevalent (Figure 8, LF19-36–45). Since higher molecular weight n-alkanes are more recalcitrant to degradation and are more readily preserved (Cranwell, 1981; Kawamura et al., 1987; Meyers and Eadie, 1993) their presence is likely a contributing factor to increased TOC values observed at these levels.
Isoprenoids are found abundantly in organic geochemical studies of ancient rocks and sediments (e.g., Schouten et al., 2000; Meyers, 2003; Sinninghe Damsté et al., 2008; Sanchez-Hernandez et al., 2014; Sanchez-Hernandez and Maurrasse, 2014; Sanchez-Hernandez and Maurrasse, 2016; French et al., 2014; Ando et al., 2017; Socorro and Maurrasse, 2019; Socorro and Maurrasse, 2020; Socorro and Maurrasse, 2022; Londoño and Collins, 2022; Herdocia and Maurrasse, 2022). The main source of the acyclic isoprenoids, Pr and Ph, is from the phytyl side chain of chlorophyll a and from bacteriochlorophyll a and b (Brooks et al., 1969; Powell and McKirdy, 1973). As chlorophyll degrades, the phytyl side chain is cleaved from the molecule and forms phytol, the precursor molecule for both Pr and Ph. These isoprenoids develop under contrasting environmental conditions. For example, Pr is produced in oxic environments where phytol is oxidized to phytenic acid and later decarboxylated to Pr. Conversely, under a reducing conditions phytol reduces to dihydrophytol and further reduction creates Ph (Brooks et al., 1969; Peters et al., 2007; Rontani and Bonin, 2011). In this manner, Pr/Ph ratios have been used to estimate paleoredox conditions using rock and oil samples within the oil window, where Pr/Ph < 1 are indicative of anoxic deposition and Pr/Ph > 1 suggest oxic deposition (Didyk et al., 1978). Nonetheless, Pr/Ph ratios can also be affected by the type of archaea present at the time of deposition. For instance, halophilic archaea contain lipids with phytanyl which can degrade to either Pr or Ph (Rontani and Bonin, 2011), whereas methanogenic bacteria tend to degrade to Ph (Goossens et al., 1984; Risatti et al., 1984; Rowland, 1990), consequently low Pr/Ph ratios can be indicative of anoxic environments (ten Haven et al., 1987). Furthermore, it has been shown that these biochemical signals may become altered via biodegradation and/or thermodegradation (Goossens et al., 1984; Peters et al., 2007), yet the samples obtained from the studied section are thermally immature and do not show evidence of significant biological degradation as none of the chromatograms show any UCM (Figure 7). Ratios for Pr/Ph from these analyzed samples range from 0.89 to 10.2 (Figure 8), but Pr and Ph are absent in U3 at 23.97 m (LF-19–57) and 26.5 m (LF-19–62), thus these results suggest that OM throughout the studied section is mostly land derived and deposited under oxic conditions except for LF-19–56 (23.56 m: Pr/Ph = 0.89) (Didyk et al., 1978; Peters et al., 2007). However, the high Pr/Ph ratios observed in the marlstones of U1 and in the whole of U2 (U1: 3.07–10.2; U2:3.4–6.7; Figure 8) that are indicative of oxic deposition with terrigenous OM are at variance with the observed RSTE (Figure 5) values and n-alkane distribution (Figure 8) at these same levels. By contrast, RSTEs and biomarkers indicate low oxygen levels with OM from mostly marine organisms with some aquatic macrophytes. A possible explanation for this discrepancy is that there are multiple sources for Pr and Ph. Other proposed sources for these molecules include archaeal cell membranes, specifically from methanogenic bacteria (Ten Haven et al., 1987), tocopherols (Goossens et al., 1984; Rontani et al., 2010), methyltrimethlytrideclychromans (MTTCs) (Li et al., 1995), as well as certain species of zooplankton (Blumer et al., 1963; 1964; Avigan and Blumer, 1968). However, experimental results on tocopherols which originate only from photosynthetic organisms suggest they are possibly precursors for pristane but much less likely for phytane due to antagonistic α-cleavage next to the aromatic functional group. Moreover, in some cases, zooplankton only produce Pr and not Ph which would further increase Pr/Ph ratios. For instance, the microscopic and abundant calanoid copepods contain high concentrations of only Pr which they produce in much higher amounts when compared to other similar zooplankton. These crustaceans use Pr for buoyancy to maintain certain depths in the water column because it is less dense than water. Since these organisms are herbivores, the main source of phytol that eventually generates Pr is chlorophyll a from their diet (Blumer et al., 1963; Blumer et al., 1964; Kleppel, 1993; Kuczynska et al., 2015). Thus, without the possibility to rule out other sources for the measured acyclic isoprenoids it is best not to use Pr/Ph ratios for paleoenvironmental interpretations here.
Other characteristics of U2, during OAE1a, is the unusually high abundance of Pr which is higher than all n-alkanes recorded within this interval. These peak abundances occur at 3 levels: 14.08 m (LF-19–37), 14.65 m (LF-19–38) and 16.05 m (LF-19–41) (Figure 8). Archeal lipids or tocopherols, mentioned above, may have been responsible for these extraordinary increases in Pr within this interval that coincides with higher TOC. Here the Pr/Ph ratios range from 3.4 to 4.67 no matter the relative abundance of Pr, except at 13.42 m where it reaches 6.71. These values suggest that these molecules were being produced in a constant relative proportion from their original sources. They also suggest that methanogenic bacteria, which produce both isoprenoids (Ten Haven et al., 1987), may have been active during these periods. This is indicated by the Pr/Ph ratios coinciding with OAE1a. During that time, the Internal/External transition zone of the Subbetic Basin experienced low oxygen conditions, as indicated by the increased RSTE values during this interval (Figure 5), which was favorable to methanogenic bacteria activity. However, the exceedingly high Pr/Ph values found in the section, except at 23.56 m (Figure 8), suggest preferential accumulation of Pr. Elevated Pr at that time could be associated with periodic blooms of the Calanoid crustaceans (Blumer et al., 1963; Blumer et al., 1964) or some similar species, triggered by periods of enhanced primary productivity during OAE1a. These recorded increases in the abundances of Pr and Ph within U2 (OAE1a) associated with increased primary productivity (Ten Haven et al., 1987) most likely derived from upwelling, as further corroborated by the increased abundance in radiolarians (Aguado et al., 2014a).
5.5 Controlling mechanisms of episodic primary productivity and preservation of OM recorded in U1, U2, and U3
The temporal variability in the major, biolimiting, and trace elements can be used to infer changes in terrigenous contributions, primary productivity, and the redox conditions of the bottom waters or within the sediment (Calvert and Pedersen, 1993; Tribovillard et al., 2004; Brumsack, 2006). Below, a discussion is provided for how such elements are used to determine the conditions during the deposition of the sediments followed by the observed patterns at La Frontera during U1, U2, and U3.
The three major lithophile elements Al, Ti, Si, being fundamental components of rock-forming minerals of the lithosphere are commonly used as indicators of detrital influences (e.g., Murphy et al., 2000Sanchez-Hernandez and Maurrasse, 2014; Sanchez-Hernandez and Maurrasse, 2016; Socorro and Maurrasse, 2019; Socorro and Maurrasse, 2020; Socorro and Maurrasse, 2022; Zhang et al., 2019; Herdocia and Maurrasse, 2022). These elements mostly occur as aluminosilicates which are generally from the terrestrial realm (Calvert and Pedersen, 1993; Rimmer, 2004; Brumsack, 2006). However, Si may also originate from significant biogenic contributions, therefore its true terrestrial signal can be altered (Brumsack, 2006), while Al and Ti are not involved in biomineralization processes, they are mostly derived from aluminosilicates of the crystalline terranes of adjacent continental crust (Brumsack, 2006). Thus, Al and Ti are more dependable and tend to show the true detrital signature, consequently, here we rely mostly on the variation of Al to assess the terrestrial contribution and its potential role in relation to productivity and OM preservation in the Subbetic zone of the Betic Cordillera. As shown in Figures 11A, B, both Ti and Si have positive covariation with Al (R2 = 0.98 and R2 = 0.89, respectively) indicating that they share a common provenance, although the lower R2 value from the Si content (Figure 11A) may be related to biogenic influence, because radiolarians are present throughout the studied interval (Aguado et al., 2014a; Aguado et al., 2014b).
As widely recognized in coeval sites elsewhere, determining the important contribution of terrigenous supply to the Subbetic zone of the Betic Cordillera highlights its role in the controlling mechanisms for the preservation of OM in the basin. Indeed, this kind of carbon sequestration requires not only a continuous OM supply through primary productivity and/or the input of land-derived OM together with oxygen deficient conditions, but also rapid burial (Hedges and Keil, 1995; Calvert et al., 1996; Hedges et al., 1997). Similarly, the availability of nutrients is necessary for enhanced biological productivity and supply of the critical bioelements which may also be related to terrigenous input. Iron and phosphorous are commonly used as proxies for enhanced productivity because they are essential for primary producers (Filippelli, 2008; Chappell et al., 2012; Sanchez-Hernandez et al., 2014; Sanchez-Hernandez and Maurrasse, 2014; Sanchez-Hernandez and Maurrasse, 2016; Socorro and Maurrasse, 2019; Socorro and Maurrasse, 2020; Socorro and Maurrasse, 2022; Londoño and Collins, 2022; Herdocia and Maurrasse, 2022). Iron is found abundantly in many rock-forming minerals and clays, thus one of the main sources of Fe is from the erosion of continental rocks (Prietzel et al., 2007; Muñoz et al., 2013). In the ocean most dissolved Fe is bound to organic ligands, making it a good proxy for determining changes in productivity (Chappell et al., 2012). Similarly, P can also be introduced to the basin through erosion of continental P-bearing rocks, or from organic matters either as dissolved P or particulate P (Filippelli, 2008). In the water column P is a bioactive element as it is fundamental for the synthesis of critical components of life in both autotrophs and heterotrophs (DNA, RNA, ADP, ATP, and proteins, phospholipids), thus it has non-conservative properties and dissolved organic P is readily taken up by living organisms whereas inorganic P is less commonly incorporated in the biosphere (Paytan and McLaughlin, 2007; Filippelli, 2008). Consequently, P can be preserved in the sediment within the OM, or it can be preserved as inorganic phases such as phosphate minerals or can be adsorbed to Fe-oxides (Golterman, 1995; 2001). However, under anoxic conditions when free H2S is present, the P from the Fe-oxides and the P associated with OM can be released back into the water column (De Groot, 1991; Golterman, 1995).
In addition to elevated productivity, low oxygen levels favor the preservation of OM and the degree of oxygen deficiency, or the redox conditions can be inferred from variations in RSTE concentrations (e.g., Hatch and Leventhal, 1992; Sanchez-Hernandez and Maurrasse, 2014; Sanchez-Hernandez and Maurrasse, 2016; Castro et al., 2019; Socorro and Maurrasse, 2022; Londoño and Collins, 2022; Herdocia and Maurrasse, 2022). Under normal oxygenated conditions RSTEs exist mostly as dissolved ions in the water column, however under sub-oxic to completely anoxic environmental conditions RSTEs precipitate as minerals or complex with organic matter and are removed from the water column and preserved in the sediment (Calvert and Pedersen, 1993; Morford and Emerson, 1999; Tribovillard et al., 2004; Brumsack, 2006). Authigenic Mo tends to only be preserved in the sediment under strong reducing, or sulfidic conditions (Crusius et al., 1996; Calvert and Pederson, 1993). Thus, increased concentrations in Mo here are interpreted as more strongly anoxic conditions. On the other hand, Mn behaves opposite to the RSTEs and can be used as a proxy to infer oxygenated conditions. In oxygenated waters Mn occurs as insoluble oxides and accumulates in the sediment, however, Mn becomes mobile in its reduced state and is leached from the sediment and back into the water column (Calvert and Perdersen, 1993; Brumsack, 2006). Therefore, decreases in Mn content are used to infer oxygen deficiency in combination with increases in the RSTE concentrations.
Based on the elemental results the following discussion provides the distinct environmental responses archived in U1, U2, and U3 of the sedimentary succession of this part of the Subbetic Basin during the global forcing mechanisms associated with OAE1a.
5.5.1 Unit 1
During U1 the lithology displays the most variability (TIC = 38.3–89%; limestones, marly limestones, and marlstones; Figure 3B), indicative of alternating paleoenvironmental conditions archived in the sediments with calcite as the dominant mineral (63%) and with land-derived minerals remaining relatively low (quartz 13%, clay minerals 10%, P-feldspar 4%, and K-feldspar 3%; Figure 6E). Increased Al concentrations occur in the 4 marlstone layers of the Carretero Fm (Figure 4B), and generally in lithologies with lower TIC (r = −0.99), implying enhanced terrigenous runoff during the deposition of these marlstones (Vine and Tourtelot, 1970; Brumsack, 2006). Additionally, the biolimiting element concentrations rise with Al content (r = P, 0.83; r = Fe, 0.99), and the most prominent peaks in the biolimiting elements occur in the marlstone layers of U1 (Figures 4E, F), suggesting that increased runoff supplied bioessential nutrients to the basin at those times. These increases in the biolimiting elements coincide with elevated TOC values (r = Fe, 0.84; P, 0.56) implying that periods of elevated primary productivity took place during periods of heightened terrestrial runoff. The lower 3 marlstone layers (1.53 m, 6.41 m, and 7.82 m), with the highest TOC values (Figure 3C) of U1 also correspond to increases in the RSTEs (Figure 5) inferring decreased oxygen content during the marlstone intervals. At the same time Mn content decreases, supporting low oxygen conditions, because Mn becomes increasingly soluble under low oxygen conditions (Calvert and Pedersen, 1996; Brumsack, 2006). Presumably, some of the P is tied to the OM fraction and was supplied through terrigenous fluxes since TOC and P are also positively correlated in U1 (r = 0.56). The preservation of P in the OM phase suggests that during this period there was not sufficient H2S in the water column to remobilize the P (Parsons et al., 2017). Thus, this period may have experienced episodes of oxygen deficiency without reaching full anoxia. During this interval, biomarker data suggest that most of the OM is marine in origin, however at 6.41 m (LF-19–16) there is evidence for OM from aquatic macrophytes (Figure 8: Yellow colored bar graphs representing n-alkane distributions in U1) corresponding to the level of highest TOC (Figure 3C), indicative of the wettest period during U1, and further corroborating episodes of enhanced terrestrial runoff. By comparison, the limestone and marly limestone intervals have the lowest major element, biolimiting element, and RSTE values of U1 and the highest Mn content of U1 (Figures 3, 4), thus these intervals are indicative of intermittent decreased nutrient availability and normal oxic conditions.
The results for U1 suggest that periodic increases in terrigenous runoff supplied more nutrients to the basin and that the marlstone layers represent intervals with enhanced nutrient supply via increased runoff. Periodic increased runoff leading up to OAE1a is also recorded elsewhere in the Tethyan realm within the Paris Basin where increased kaolinite content suggests enhanced chemical weathering (Deconinck et al., 2021). Additionally, the Shatsky Rise (ODP Leg 198) recorded episodes of enhanced productivity due to increased hydrologic cycles >2 Ma before the onset of OAE1a (Robinson et al., 2004). Correspondingly, the marlstone layers in U1 at La Frontera are indicative of increased primary productivity that the increased supply of oxidizable organic matter causing oxygen deficient conditions in the bottom water and/or in the sediment. By contrast, the limestone layers within this unit indicate stages with less fluvial influence and well oxygenated bottom waters.
These intermitted low oxygen intervals prior to OAE1a may represent a gradual shift into more pronounced deoxygenation. The Gorgo a Cebara section recorded similar deposits that alternated between oligotrophic conditions with oxygenated water and temporary anoxic conditions prior to OAE1a (Li et al., 2016). Similarly, in the Paris Basin elevated organic matter preservation before the onset of OAE 1a are reported which may be related to periodic decreases in bottom-water oxygen at that time (Deconinck et al., 2021). In contrast the Gucuo II of Eastern Tethys (Southern Tibet) maintained oxic to suboxic conditions leading up to OAE1a, indicative of regional variability in redox conditions (Nie et al., 2023).
5.5.2 Unit 2 (OAE1a)
The overlying unit (U2) coincides with OAE1a and marks a sudden shift in the lithology to dark shales coeval with a sudden decrease in TIC to 0% for most of the duration of the unit (from 13.42 m to 17.17 m), excluding the top two measured levels (17.65 m, LF-19–44, TIC = 13.7% and 18.25 m, LF-19–45, TIC = 4.5%; Figure 3B). In this transition, from predominantly carbonate rocks to siliciclastics, quartz becomes dominant (63%) followed by clays (10%), P-feldspar (9%), and K-feldspar (7%) (Figure 6D). This shift occurs simultaneously with the highest overall values in the major elements (Figures 4B–D), together suggesting a strong increase in terrestrial discharge, consistent with reports of enhanced precipitation recorded elsewhere during OAE1a (Barron et al., 1989; Jenkyns, 2003). Similar lithological changes have been documented in the Vocontian Basin (France), where OAE1a is characterized by an abrupt shift from carbonate-rich sediments to organic-rich shales, associated with intensified continental weathering (Weissert et al., 1998; Herrle et al., 2004). Likewise, at Cismon (Italy), OAE1a corresponds to a distinctive marl- and shale-dominated interval with depleted carbonate content, reflecting increased siliciclastic input during this interval (Menegatti et al., 1998; Malinverno et al., 2010). The changes seen in La Frontera align closely with these trends, suggesting a synchronous climatic and oceanographic shift affecting multiple basins within the Tethyan realm at this time.
Additionally, smectite abundance increases significantly during this interval (Figure 6B). Smectites develop mainly in soils with poorly drained alkaline substrates, which are often found in areas with heavy seasonal precipitation (Borchardt, 1989) most typically in subtropical climates (Thiry, 2000). They can also form because of submarine weathering of basaltic lava (Chamley, 1989; Ruffell et al., 2002), and most commonly montmorillonite and beidellite are usually derived from the alteration of volcanic material under low pH in seawater or freshwater (Biscaye, 1965; Haldar, 2020). Several igneous bodies exist within the nearby Variscan massif and during the lower Cretaceous there was active submarine volcanism occurring in the Betic Cordillera (Martín-Chivelet et al., 2002), thus the increased smectite and feldspar content together support enhanced erosion of these adjacent terranes. The shift from low smectite abundance (x̄ = 23.5%) in U1, to higher abundance of smectite (x̄ = 44.7%) during OAE1a (U2) along with the drop in kaolinite and chlorite reflects a change in provenance related to erosion initiated with increased precipitation during this period (Barron et al., 1989; Tatsumi, et al., 1998; Larson, 1991; Jenkyns, 2003; Tejada et al., 2009). Although typical kaolinite formation occurs under warm humid conditions (Biscaye, 1965; Curtis, 1983; Sangüesa et al., 2000; Sheldon and Tabor, 2009), kaolinite content is lowest during this U2 interval (0%–1%; Figure 6B). The discrepancy in kaolinite content is likely due to either a more proximal erosional source or accelerated degradation of proximal land masses and aluminum silicates were not weathered significantly enough to form kaolinite that may be related to shifting physiography (Martín-Chivelet et al., 2002). The increased abundance of smectite within U2 is likely related to a change in the source of weathering (i.e., from metamorphic rocks to igneous rocks). In contrast, other areas report increased kaolinite content during this period due to the warm humid conditions representative of the Early Aptian period especially during OAE1a (Jenkyns, 1980; Blättler et al., 2011). For example, the Danish Central Graben, in the North Sea, recorded elevated kaolinite during OAE1a (Blok et al., 2022). Likewise the Paris basin, showed an abundance of kaolinite and the absence of smectite (Deconinck et al., 2021). This underscores regional variability in weathering intensity and source rock composition across different basins during this period.
The biomarkers data indicate increased abundance in OM from aquatic macrophytes (Figure 8 Black colored bar graphs representing n-alkanes distribution in U2) as well as increased quartz and feldspar content during this interval, which, further maintains heightened terrestrial runoff during this time (Figure 6D). This dark shale layer also includes the highest TOC values (0.55%–3.39%; Figure 3C) and Aguado et al. (2014b) reported an increase in the radiolarian abundances at this level which they attributed to expanded primary production. However, P content decreases during this interval and correlates poorly with TOC and Al (r = −0.04 and r = −0.03, respectively), in contrast to what is expected during periods of improved primary production. Similarly, Fe is decoupled from TOC (r = −0.49) and TIC (r = 0.26) (Figure 4F). This discrepancy in the biolimiting elements can be explained because as oxygen content drops, P and Fe are reduced and are remobilized back into the water column and as such will not be preserved in the sediment (Brumsack, 2006; Parsons et al., 2017). Correspondingly, RSTE content and TOC are also highest during this period and correlate strongly with each other (r = V, 0.87; r = Cr, 0.57; r = Cu, 0.72; r = Mo, 0.96; r = U, 0.95; Figures 3C, 5) supporting sustained low oxygen conditions with periodic anoxia. In addition, the RSTEs are poorly correlated with Al content (r = V, −0.42; r = Cr, −0.68; r = Cu, 0.28; r = Mo, −0.06; r = U, −0.25; Figures 3B, 4), implying that they are not detrital in origin (Brumsack, 2006). Similarly, this is shown in the cross plots between Al and the RSTEs (Black dots in Figures 11C–I), as the measured samples for this interval show the most deviation from Al. The two largest peaks in TOC coincide with the most notable peaks in Mo (14.08 m, TOC = 3.4% and 16.05 m, TOC = 1.5%). As such, these two intervals represent the most oxygen deficient condition recorded in the section (Crusius et al., 1996; Calvert and Pedersen, 1993). Manganese content also drops in U2, consistent with low oxygen levels as it is also removed from the sediment under such conditions (Brumsack, 2006).
The likely explanation for oxygen deficient conditions is the expansion of the oxygen minimum zone or oxygen deficient conditions in the sediment due to excess oxidizable OM. This is supported by the high TOC occurring with heightened concentrations in the RSTEs, the decrease in Mn concentration, and the lack of gammacerane (indicative of water stratification) in this study or in others (Aguado et al., 2014b). Additionally, increased abundances in radiolarians have been reported during OAE1a in the La Frontera section (Aguado et al., 2014b) further indicating enhanced primary productivity at that time. Radiolarian blooms have been also observed elsewhere within this interval such as in the Briançonnais domain (Charbonnier et al., 2018) and more broadly across the Tethyan domain (Weissert et al., 1998), further indicating enhanced productivity due to excess nutrient availability globally during OAE1a. Although, radiolarians are scare in other areas such as the Calabianca section (Italy, Bellanca et al., 2002), once again highlighting how local factors led to variability from basin to basin.
Radiolarians are typically preserved in upwelling zones, where there is constant recycling of dissolved silica, and the water column is saturated with respect to Si. This is because surface ocean waters are depleted with respect to Si, therefore the opaline Si tests of organisms are usually dissolved rapidly as they settle through the water column (Berger, 1970). Since upwelling involves constant mixing of the water column, therefore stratification is not a plausible mechanism at La Frontera for enhanced preservation of OM in this setting.
Thus, the results from U2 permit to infer that prolonged runoff from the continents for the duration of OAE1a combined with regional upwelling provided enhanced nutrient supply which favored high primary production. The excess OM being deposited into the basin led to low oxygen conditions with periodic anoxia occurring at the levels with enhanced Mo concentration, favoring the removal of P and Mn.
5.5.3 Unit 3
The final Unit (U3) consists of a limestone layer overlain by alternating marlstone and calcareous shales with increased TIC values (from 14.9% to 68.8%; Figure 3B). A change that is also reflected in the bulk mineralogy as calcite content rises (46%) and the siliciclastic minerals decrease in abundance (quartz 25%; P-feldspar 5%, K-feldspar 5%), suggesting decreasing continental input and the return to conditions prior to OAE1a (Figure 6C). All the major elements decrease compared to values in the previous unit (Figures 4B–D) but remain higher than values from U1 and the quartz and feldspar content decrease (quartz 25%; P-feldspar 5%, K-feldspar 5%, Figure 6C), implying decreased runoff as compared to U2. Accordingly, biomarker data indicate a predominance of marine derived OM with no terrestrial OM contribution (Figure 8 Green colored bar graphs representing n-alkanes distribution in U3), corroborating a decline in fluvial discharge. TOC values decrease to below 0.4% (0.04%–0.37%; x̄ = 0.24%; Figure 3C) like those prior to OAE1a. The biolimiting elements, however, are decoupled from the TOC (r = P, 0.00; r = Fe, 0.49; Figures 4E, F) implying that they are not tied to the OM fraction. Iron is mostly being supplied by terrestrial erosion, as it follows a similar trend to Al (r = 0.96). During U3 the RSTEs correlate with TOC (r = V, 0.77; r = Cr, 0.72; r = Cu, 0.53 r = Mo, 0.81; r = U, 0.67) and the RSTEs covary strongly with Al (r = V, 0.97; r = Cr, 0.95; r = Cu, 0.66 r = Mo, 0.75; r = U, 0.66; Figures 3B, 4) suggesting that they may have a detrital origin during this interval.
Increased carbonate content in the final unit (U3; TIC = 14.9–68.8%) and a shift to alternating marlstone and calcareous shales with one limestone (LF-19–46, 18.77 m) indicate a change in environmental conditions towards conditions like those prior to the onset of OAE1a. Although conditions were probably wetter as Al content is higher during this interval compared to U1, but they were drier conditions as compared to U2.
5.6 Plausible cause of the absence of carbonate within U2 coeval with OAE1a
Most marine sequences deposited during OAE1a are often referred to as black shales although they may contain variable amount of carbonate throughout the duration of the event (e.g., Bellanca et al., 2002; Heldt et al., 2012; Lorenzen et al., 2013; Sanchez-Hernandez and Maurrasse, 2014; Sanchez-Hernandez and Maurrasse, 2016, and others). In the La Frontera section, however, carbonate content drops to 0% at the onset of U2 coeval with OAE1a and remains absent for most of the duration of the interval, except for minimum values at the top (17.65 m, LF-19–44, TIC = 13.7% and 18.25 m, LF-19–45, TIC = 4.5%: Figure 3B). The sudden lack of carbonate during OAE1a at the studied site has been considered to be due to dissolution related to productivity (Aguado et al., 2014a) which involves a large supply of oxidizable OM that would cause the pH to decrease in the bottom waters, leading to carbonate dissolution. In analog oceanic environments such as off the Peruvian upwelling area where the oxygen minimum zone may reach the shelf leading to hypoxic to anoxic conditions, Ca ions precipitate in the form of authigenic fluorapatite (Scholz et al., 2011; Lomnitz et al., 2016), but such compound was not detected in the mineralogical results. Furthermore, upwelling affects DIC values and the pH of the water column in the OMZ area with aragonite saturation values <1.2, implying that conditions may be corrosive with large spacial variability along the upwelling zone, shallowing of the carbonate saturation horizon may occur but without total dissolution of the calcium carbonate (Hernandez-Ayon et al., 2019).
An alternative mechanism recently documented the lack of carbonate involves the activity of cable bacteria (Desulfobulbaceae, Deltaproteobacteria), a type of filamentous sulfur-oxidizing bacteria that thrive in anoxic to euxinic conditions (Nielsen et al., 2010; Malkin et al., 2014; Pfeffer et al., 2012; Lusk et al., 2024). These bacteria position themselves in the upper centimeters of the sediment and create electrogenic sulfur oxidation, which generates sulfuric acid in pore waters, leading to carbonate dissolution (Malkin et al., 2014).
In the studied section a plausible similar mechanism is supported by elevated concentrations in the RSTEs, especially Mo, along with the lack of P within the U2 interval suggesting anoxic to euxinic conditions which likely occurred at the sediment-water interface (Tyson and Pearson, 1991; Calvert and Pedersen, 1993; Brumsack, 2006). The highest TOC and Mo concentration occurs at the onset of OAE1a indicative of the most anoxic conditions, followed by an upward decrease in TOC and Mo concentrations suggesting less anoxic conditions towards the end of the event (Figures 3C, 5G), potentially reflecting increasing cable bacteria activity, which has been shown to buffer euxinic conditions (Seitaj et al., 2015). Additionally, pyrite content is low in the whole section and varies from 1% to 3% in the U2 interval, consistent with cable bacteria activity, as these organisms promote hydrogen sulfide oxidation rather than pyrite precipitation (Malkin et al., 2014; Seitaj et al., 2015).
The absence of calcareous fossils in U2 further supports a potential link to cable bacteria activity, as similar observations have been made in modern marine basins experiencing seasonal anoxia. If verified, this mechanism would provide a novel explanation for carbonate loss during OAE1a in the Subbetic Basin. Future research should focus on identifying biochemical markers of cable bacteria in ancient sediments, potentially leading to new proxies for recognizing electrogenic sulfur oxidation in the rock record.
6 Conclusion
This study further sheds light on the environmental conditions related to the deposition of OAE1a at the La Frontera section in the Subbetic Basin, Spain. Biomarker data from hopanes and steranes indicate that the succession contains thermally immature OM and therefore indicates that the OM recorded at the studied site is unaltered. The carbon isotope curve documents a major perturbation in the global carbon isotopic record as identified worldwide in Aptian deposits and confirmed the presence of segments C1 to C7 identified in previous studies of the section.
Integration of the lithologic and geochemical results reveal environmental changes before, during and after OAE1a here described as Units 1, 2, and 3 as follows:
1. Unit 1 (0–13.16 m) contains limestones with intermittent marlstone layers and few marly limestones. The limestone and marly limestone layers represent periods of well oxygenated bottom waters with minimal terrestrial input as TOC, the major elements and the RSTE values are low while Mn concentrations are high. The intervals of marlstones represent periods of increased terrestrial runoff as signified by increased Al content. These terrestrial fluxes supplied biolimiting nutrients to the basin which fueled primary productivity. Elevated TOC and RSTE content together with a decrease in Mn within the marlstone infer lower oxygen conditions, however, without reaching full anoxia as Mo is not significantly increased. The n-alkanes suggest predominantly marine OM in the marlstone, except at 6.41 m, where longer chain n-alkanes are present signaling a short episode of land-derived flux OM in the Subbetic Basin.
2. Unit 2 (13.16–18.25 m) shows a sharp drop in carbonate content and contains dark shales coeval with OAE1a. High Al content, increased silicate mineral abundances, and the presence of longer chain n-alkanes (up to nC25) together suggest sustained terrigenous input for the duration of the event archived in sediments of the segment. Covariation of these conjoint parameters indicate increased hydrological cycles at that time. RSTE values are high, and Mn values are low for the duration of the unit implying low oxygen conditions. Strong fluvial discharge coupled with upwelling probably fueled high primary productivity and increased the supply of oxidizable OM leading to oxygen deficiency in the bottom waters. The two highest TOC values (3.4% at 14.08 m and 1.5% at 16.05 m) correspond to the highest values in Mo and the removal of P suggest very low oxygen in the bottom waters or sediment at those times. Based on recent discovery of the effects of cable bacteria in pore water associated with carbonate dissolution processes, the lack of carbonate in the section may be related to active cable bacteria as they have been shown to be active in modern anoxic lakes and they induce a drop in pH (Seitaj et al., 2015) due to the production of acid capable of actively dissolving in situ carbonate.
3. Unit 3 (18.25–27.93 m) contains alternating marlstone and marly shales with low TOC and increased carbonate content. The Al values together with aluminosilicate mineral content decrease compared to U2 but are higher than values in U1, thus indicating a decrease in fluvial input posterior to OAE1a, albeit higher than U1. Additionally, RSTE values decrease following a pattern like Al, and the RSTEs are decoupled from TOC implying that they are detrital and that the bottom waters were not anoxic following OAE1a.
Statements
Data availability statement
The original contributions presented in the study are included in the article/supplementary material, further inquiries can be directed to the corresponding author.
Author contributions
CH: Conceptualization, Data curation, Formal Analysis, Funding acquisition, Investigation, Methodology, Project administration, Resources, Software, Supervision, Validation, Visualization, Writing – original draft, Writing – review and editing. FJ-MM: Conceptualization, Data curation, Formal Analysis, Funding acquisition, Investigation, Methodology, Project administration, Resources, Software, Supervision, Validation, Visualization, Writing – original draft, Writing – review and editing.
Funding
The author(s) declare that no financial support was received for the research and/or publication of this article.
Acknowledgments
The authors acknowledge that partial support for the research and publication of this article was covered by private funds (from FJ-MRM) in memory of Glenn Goodfriend. We thank our late colleague Marcos Lamolda to have introduced us to the geology of the area, and our colleague Jander Socorro for helping us with both fieldwork and lab work. We are grateful to the Earth and Environment Department at FIU for providing us with supplies and laboratory materials. We would like to thank Peter Swart of the Stable Isotope Laboratory at the Rosenstiel School of Marine, Atmospheric and Earth Sciences (RSMAES) for the carbon isotope analyses, Cesar Ramirez at FIU’s Advanced Spectrometry Facility for the biomarker analyses, Martin Pentrak of the Illinois State Geological Survey for the XRD analysis, and Ping Jiang at FIU’s Trace Elements Analytical Facilities (TEAF) for elemental analyses.
Conflict of interest
The authors declare that the research was conducted in the absence of any commercial or financial relationships that could be construed as a potential conflict of interest.
Generative AI statement
The authors declare that no Generative AI was used in the creation of this manuscript.
Publisher’s note
All claims expressed in this article are solely those of the authors and do not necessarily represent those of their affiliated organizations, or those of the publisher, the editors and the reviewers. Any product that may be evaluated in this article, or claim that may be made by its manufacturer, is not guaranteed or endorsed by the publisher.
References
1
Aguado R. Castro J. M. Company M. De Gea G. A. (1999). Aptian bio-events—an integrated biostratigraphic analysis of the almadich ormation, nner prebetic omain, SE Spain. Cretac. Res.20 (6), 663–683. 10.1006/cres.1999.0176
2
Aguado R. Company M. O’Dogherty L. Sandoval J. Tavera J. M. (1992). Biostratigraphic analysis of the pelagic Barremian/Aptian in the Betic Cordillera (southern Spain): preliminary data. Cretac. Res.13, 445–452. 10.1016/0195-6671(92)90009-F
3
Aguado R. Company M. Sandoval J. Tavera J. M. (1997). Biostratigraphic events at the barremian/aptian boundary in the etic Cordillera, southern Spain. Cretac. Res.18 (3), 309–329. 10.1006/cres.1997.0069
4
Aguado R. de Gea G. A. Castro J. M. O’Dogherty L. Quijano M. L. Naafs B. D. A. et al (2014a). Late Barremian–early Aptian dark facies of the Subbetic (Betic Cordillera, southern Spain): alcareous nannofossil quantitative analyses, chemostratigraphy and palaeoceanographic reconstructions. Palaeogeogr. Palaeoclimatol. Palaeoecol.395, 198–221. 10.1016/j.palaeo.2013.12.031
5
Aguado R. de Gea G. A. O’Dogherty L. (2014b). Integrated biostratigraphy (calcareous nannofossils, planktonic foraminifera, and radiolarians) of an uppermost Barremian–lower Aptian pelagic succession in the Subbetic Basin (southern Spain). Cretac. Res.51, 153–173. 10.1016/j.cretres.2014.06.002
6
Aguado R. Molina J. M. O’Dogherty L. (1993). Bioestratigrafía y litoestratigrafía de la formación carbonero (Barremiense-Albiense?) en la transición Externo-Subbético Medio (Sur de Jaén). Cuad. Geol. ibérica (17), 325–344.
7
Ando T. Sawada K. Nakamura H. Omatsu K. Takashima R. Nishi H. (2017). Depositional environments and maturity evaluated by biomarker analyses of sediments deposited across the Cenomanian–Turonian boundary in the Yezo Group, Tomamae area, Hokkaido, Japan. Isl. Arc26, e12178. 10.1111/iar.12178
8
Arroyo L. Trejos T. Gardinali P. R. Almirall J. R. (2009). Optimization and validation of a laser ablation inductively coupled plasma mass spectrometry method for the routine analysis of soils and sediments. Spectrochim. Acta Part B At. Spectrosc.64, 16–25. 10.1016/j.sab.2008.10.027
9
Arthur M. A. Dean W. E. Schlanger S. O. (1985). Variations in the global carbon cycle during the Cretaceous related to climate, volcanism, and changes in atmospheric CO2. carbon cycle Atmos. CO2 Nat. Var. Archean Present32, 504–529. 10.1029/GM032p0504
10
Arthur M. A. Schlanger S. O. (1979). Cretaceous “ceanic noxic vents” as ausal actors in evelopment of reef-reservoired iant il Fields1. Am. Assoc. Pet. Geol. Bull.63, 870–885. 10.1306/2F91848C-16CE-11D7-8645000102C1865D
11
Avigan J. Blumer M. (1968). On the origin of pristane in marine organisms. J. Lipid Res.9, 350–352. 10.1016/S0022-2275(20)43103-7
12
Barron E. J. Fawcett P. J. Peterson W. H. Pollard D. Thompson S. L. (1995). A “simulation” of Mid-Cretaceous climate. Paleoceanography10, 953–962. 10.1029/95PA01624
13
Barron E. J. Harrison C. G. Sloan J. L. Hay W. W. (1981). Paleogeography: 180 million years ago to the present. Eclogae Geol.74, 443–470.
14
Barron E. J. Hay W. W. Thompson S. (1989). The hydrologic cycle: major variable during earth history. Glob. Planet. Change1, 157–174. 10.1016/0921-8181(89)90001-5
15
Bastow T. P. van Aarssen B. G. K. Lang D. (2007). Rapid small-scale separation of saturate, aromatic and polar components in petroleum. Org. Geochem.38, 1235–1250. 10.1016/j.orggeochem.2007.03.004
16
Bellanca A. Erba E. Neri R. Silva I. P. Sprovieri M. Tremolada F. et al (2002). Palaeoceanographic significance of the tethyan ‘ivello selli’(arly aptian) from the hybla ormation, northwestern sicily: biostratigraphy and high-resolution chemostratigraphic records. Palaeogeogr. Palaeoclimatol. Palaeoecol.185 (1-2), 175–196. 10.1016/s0031-0182(02)00299-7
17
Berger W. H. (1970). Biogenous ea ediments: ractionation by ea irculation. GSA Bull.81, 1385–1402. 10.1130/0016-7606(1970)81[1385:BDSFBD]2.0.CO;2
18
Biscaye P. E. (1965). Mineralogy and sedimentation of recent deep-sea clay in the Atlantic Ocean and adjacent seas and oceans. Geol. Soc. Am. Bull.76, 803–832. 10.1130/0016-7606(1965)76[803:MASORD]2.0.CO;2
19
Bjørkum P. A. Gjelsvik N. (1988). An isochemical model for formation of authigenic kaolinite, K-feldspar and illite in sediments. J. Sediment. Res.58 (3), 506–511. 10.1306/212F8DD2-2B24-11D7-8648000102C1865D
20
Bjørlykke K. Aagaard P. (1992). Clay inerals in North Sea sandstones. Orig. Diagenes. Petrophysics Clay Min. Sandst. 10.2110/pec.92.47.0065
21
Blättler C. L. Jenkyns H. C. Reynard L. M. Henderson G. M. (2011). Significant increases in global weathering during Oceanic Anoxic Events 1a and 2 indicated by calcium isotopes. Earth Planet. Sci. Lett.309, 77–88. 10.1016/j.epsl.2011.06.029
22
Blok C. N. Ineson J. Anderskouv K. Fantasia A. Sheldon E. Thibault N. et al (2022). Latitude-dependant climate changes across the aptian ceanic noxic vent 1a. Palaeogeogr. Palaeoclimatol. Palaeoecol.601, 111085. 10.1016/j.palaeo.2022.111085
23
Blumer M. Mullin M. M. Thomas D. W. (1963). Pristane in ooplankton. Sci. (80-)140, 974. 10.1126/science.140.3570.974.a
24
Blumer M. Mullin M. M. Thomas D. W. (1964). Pristane in the marine environment. Helgoländer Wiss. Meeresunters.10, 187–201. 10.1007/BF01626106
25
Borchardt G. (1989). “Smectites,” in Minerals in Soil Environments99. John Wiley and Sons, Ltd., 75–727. 10.2136/sssabookser1.2ed.c14
26
Brooks J. D. Gould K. Smith J. W. (1969). Isoprenoid hydrocarbons in coal and petroleum. Nature222, 257–259. 10.1038/222257a0
27
Brumsack H.-J. (2006). The trace metal content of recent organic carbon-rich sediments: implications for Cretaceous black shale formation. Palaeogeogr. Palaeoclimatol. Palaeoecol.232, 344–361. 10.1016/j.palaeo.2005.05.011
28
Calvert S. E. Bustin R. M. Ingall E. D. (1996). Influence of water column anoxia and sediment supply on the burial and preservation of organic carbon in marine shales. Geochim. Cosmochim. Acta60, 1577–1593. 10.1016/0016-7037(96)00041-5
29
Calvert S. E. Pedersen T. F. (1993). Geochemistry of recent oxic and anoxic marine sediments: implications for the geological record. Mar. Geol.113, 67–88. 10.1016/0025-3227(93)90150-T
30
Calvert S. E. Pedersen T. F. (1996). Sedimentary geochemistry of manganese; implications for the environment of formation of manganiferous black shales. Econ. Geol.91, 36–47. 10.2113/gsecongeo.91.1.36
31
Castro J. M. de Gea G. A. Quijano M. L. (2006). Registro del evento anóxico oceánico OAE 1a (Aptiense inferior) en un contexto de plataforma. Prebético (provincia de Alicante). Geogaceta40, 251–254. Available online at: http://hdl.handle.net/10272/8627
32
Castro J. M. de Gea G. A. Quijano M. L. Aguado R. Froehner S. Naafs B. D. A. et al (2019). Complex and protracted environmental and ecological perturbations during OAE 1a - vidence from an expanded pelagic section from south Spain (Western Tethys). Glob. Planet. Change183, 103030. 10.1016/j.gloplacha.2019.103030
33
Castro J. M. Ruiz-Ortiz P. A. de Gea G. A. Aguado R. Jarvis I. Weissert H. et al (2021). High-esolution C-sotope, TOC and iostratigraphic ecords of OAE 1a (aptian) rom an xpanded emipelagic ored uccession, estern Tethys: ew tratigraphic eference for lobal orrelation and aleoenvironmental econstruction. Paleoceanogr. Paleoclimatology36, e2020PA004004. 10.1029/2020PA004004
34
Chamley H. (1989). “Clay formation through weathering,” in Clay sedimentology (Springer), 21–50.
35
Chappell P. D. Moffett J. W. Hynes A. M. Webb E. A. (2012). Molecular evidence of iron limitation and availability in the global diazotroph Trichodesmium. ISME J.6, 1728–1739. 10.1038/ismej.2012.13
36
Charbonnier G. Adatte T. Spangenberg J. E. Föllmi K. B. (2018). The expression of early Aptian to latest Cenomanian oceanic anoxic events in the sedimentary record of the Briançonnais domain. Glob. Planet. Change170, 76–92. 10.1016/j.gloplacha.2018.08.009
37
Clayton C. J. (1991). Effect of maturity on carbon isotope ratios of oils and condensates. Org. Geochem.17, 887–899. 10.1016/0146-6380(91)90030-N
38
Clayton C. J. Bjorøy M. (1994). Effect of maturity on 13C/12C ratios of individual compounds in North Sea oils. Org. Geochem.21, 737–750. 10.1016/0146-6380(94)90016-7
39
Cranwell P. A. (1973). Chain‐length distribution of n‐alkanes from lake sediments in relation to post‐glacial environmental change. Freshw. Biol.3, 259–265. 10.1111/j.1365-2427.1973.tb00921.x
40
Cranwell P. A. (1981). Diagenesis of free and bound lipids in terrestrial detritus deposited in a lacustrine sediment. Org. Geochem.3, 79–89. 10.1016/0146-6380(81)90002-4
41
Cranwell P. A. (1984). Lipid geochemistry of sediments from Upton Broad, a small productive lake. Org. Geochem.7, 25–37. 10.1016/0146-6380(84)90134-7
42
Cranwell P. A. Eglinton G. Robinson N. (1987). Lipids of aquatic organisms as potential contributors to lacustrine sediments—II. Org. Geochem.11, 513–527. 10.1016/0146-6380(87)90007-6
43
Crusius J. Calvert S. Pedersen T. Sage D. (1996). Rhenium and molybdenum enrichments in sediments as indicators of oxic, suboxic and sulfidic conditions of deposition. Earth Planet. Sci. Lett.145, 65–78. 10.1016/S0012-821X(96)00204-X
44
Curtis C. D. (1983). Link between aluminum mobility and destruction of secondary porosity1: GEOLOGIC NOTES. Am. Assoc. Pet. Geol. Bull.67, 380–384. 10.1306/03B5AD22-16D1-11D7-8645000102C1865D
45
Cuadros J. Linares J. (1996). Experimental kinetic study of the smectite-to-illite transformation. Geochim. Cosmochim. Acta60, 439–453. 10.1016/0016-7037(95)00407-6
46
Curiale J. A. Larter S. R. Sweeney R. E. Bromley B. W. (1989). “Molecular thermal maturity indicators in oil and gas source rocks,” in Thermal istory of edimentary asins. Editors NaeserN. D.McCullohT. H. (New York, NY: Springer), 53–72.
47
Deconinck J. F. Boué D. Amédro F. Baudin F. Bruneau L. Huret E. et al (2021). First record of early aptian ceanic noxic vent 1a from the Paris asin (France)-Climate signals on a terrigenous shelf. Cretac. Res.125, 104846. 10.1016/j.cretres.2021.104846
48
Deer W. A. Howie R. A. Zussman J. (1977). An introduction to the rock forming minerals, 528. London, United Kingdom: Longman Publisher.
49
de Gea G. A. Aguado R. Castro J. M. Molina J. M. O’Dogherty L. Ruiz-Ortiz P. A. (2008). Lower Aptian Subbetic organic-rich facies, radiolarites, and associated deposits: the local expression of Oceanic Anoxic Event 1a (Carbonero Formation, southern Spain). Cretac. Res.29, 861–870. 10.1016/j.cretres.2008.05.011
50
de Gea G. A. Aguado R. Castro J. M. Quijano M. L. Pancost R. D. (2012). Bioestratigrafía y geoquímica de alta resolución del Evento Anóxico Oceánico del Aptiense inferior (OAE 1a) en el Subbético de Jaén: sección de La Frontera. Geotemas13, 69.
51
de Gea G. A. Castro J. M. Aguado R. Ruiz-Ortiz P. A. Company M. (2003). Lower Aptian carbon isotope stratigraphy from a distal carbonate shelf setting: the Cau section, Prebetic zone, SE Spain. Palaeogeogr. Palaeoclimatol. Palaeoecol.200, 207–219. 10.1016/s0031-0182(03)00451-6
52
De Groot C.-J. (1991). The influence of FeS on the inorganic phosphate system in sediments. Int. Ver. für Theor. Angew. Limnol. Verhandlungen24, 3029–3035. 10.1080/03680770.1989.11899224
53
Dercourt J. Gaetani M. Vrielynck B. Barrier E. Biju-Duval B. Brunet M. F. et al (2000). Peri-Tethys palaeogeographical atlas 2000. Paris: Univ. Pierre Marie Curie, 269.
54
Didyk B. M. Simoneit B. R. T. Brassell S. C. T. Eglinton G. (1978). Organic geochemical indicators of palaeoenvironmental conditions of sedimentation. Nature272, 216–222. 10.1038/272216a0
55
Du J. Cai J. Chen Z. Lei T. Zhang S. Xie Z. (2019). A contrastive study of effects of different organic matter on the smectite illitization in hydrothermal experiments. Appl. Clay Sci.168, 249–259. 10.1016/j.clay.2018.11.016
56
Eadie B. J. (1984). “Distribution of polycyclic aromatic hydrocarbons in the Great Lakes,” in Toxic contaminants in the great akes. Editors NriaguJ. O.SimmonsM. S. (New York: John Wiley), 195–211.
57
Eglinton G. Hamilton R. J. (1967). Leaf picuticular waxes. Sci. (80-)156, 1322–1335. 10.1126/science.156.3780.1322
58
Eglinton T. I. Eglinton G. (2008). Molecular proxies for paleoclimatology. Earth Planet. Sci. Lett.275, 1–16. 10.1016/j.epsl.2008.07.012
59
Erba E. Bottini C. Weissert H. Keller C. E. (1999). Calcareous nannofossil biostratigraphy of the aptian-albian oceanic anoxic events from the alpine Tethys and the Atlantic Ocean. Cretac. Res.20 (6), 685–713. 10.1006/cres.1999.0199
60
Erbacher J. Thurow J. Littke R. (1996). Evolution patterns of radiolaria and organic matter variations: new approach to identify sea-level changes in mid-Cretaceous pelagic environments. Geology24, 499–502. 10.1130/0091-7613(1996)024<0499:EPORAO>2.3.CO;2
61
Farrimond P. Taylor A. TelnÆs N. (1998). Biomarker maturity parameters: the role of generation and thermal degradation. Org. Geochem.29, 1181–1197. 10.1016/S0146-6380(98)00079-5
62
Feakins S. J. Eglinton T. I. deMenocal P. B. (2007). A comparison of biomarker records of northeast African vegetation from lacustrine and marine sediments (ca. 3.40 Ma). Org. Geochem.38, 1607–1624. 10.1016/j.orggeochem.2007.06.008
63
Ficken K. J. Li B. Swain D. L. Eglinton G. (2000). An n-alkane proxy for the sedimentary input of submerged/floating freshwater aquatic macrophytes. Org. Geochem.31, 745–749. 10.1016/s0146-6380(00)00081-4
64
Filippelli G. M. (2008). The global phosphorus cycle: past, present, and future. Elements4, 89–95. 10.2113/gselements.4.2.89
65
Fletcher B. J. Brentnall S. J. Anderson C. W. Berner R. A. Beerling D. J. (2008). Atmospheric carbon dioxide linked with Mesozoic and early Cenozoic climate change. Nat. Geosci.1, 43–48. 10.1038/ngeo.2007.29
66
Forster A. Sturt H. Meyers P. A. (2004). “10. Molecular biogeochemistry of cretaceous black shales from the Demerara rise: reliminary shipboard results from sites 1257 and 1258, Leg 207,” in Proceedings of the Ocean rilling rogram, nitial eports.
67
French K. L. Sepúlveda J. Trabucho-Alexandre J. Gröcke D. R. Summons R. E. (2014). Organic geochemistry of the early toarcian oceanic anoxic event in hawsker ottoms, yorkshire, england. Earth Planet. Sci. Lett.390, 116–127. 10.1016/j.epsl.2013.12.033
68
García-Hernández M. López-Garrido A. C. Rivas P. Sanz de Galdeano C. Vera J. A. (1980). Mesozoic palaeogeographic evolution of the external zones of the Betic Cordillera.
69
Gibbons W. Moreno T. (2002). The eology of Spain. 10.1144/GOSPP
70
Giraud F. Pittet B. Grosheny D. Baudin F. Lécuyer C. Sakamoto T. (2018). The palaeoceanographic crisis of the arly aptian (OAE 1a) in the Vocontian Basin (SE France). Palaeogeogr. Palaeoclimatol. Palaeoecol.511, 483–505. 10.1016/J.PALAEO.2018.09.014
71
Goddard E. N. Trask P. D. De Ford R. K. Rove O. N. Singewald J. T. Overbeck R. M. (1963). Rock-olor hart. Denver, CO: Geological Society of America.
72
Godet A. Bodin S. Föllmi K. B. Vermeulen J. Gardin S. Fiet N. et al (2006). Evolution of the marine stable carbon-isotope record during the early Cretaceous: focus on the late Hauterivian and Barremian in the Tethyan realm. Earth Planet. Sci. Lett.242, 254–271. 10.1016/j.epsl.2005.12.011
73
Godet A. Hfaiedh R. Arnaud-Vanneau A. Zghal I. Arnaud H. Ouali J. (2014). Aptian palaeoclimates and identification of an OAE 1a equivalent in shallow marine environments of the southern tethyan margin: vidence from outhern Tunisia (bir oum ali section, orthern chott hain). Cretac. Res.48, 110–129. 10.1016/j.cretres.2013.12.006
74
Goldberg S. J. Carlson C. A. Hansell D. A. Nelson N. B. Siegel D. A. (2009). Temporal dynamics of dissolved combined neutral sugars and the quality of dissolved organic matter in the Northwestern Sargasso Sea. Deep Sea Res. Part I Oceanogr. Res. Pap.56, 672–685. 10.1016/j.dsr.2008.12.013
75
Golterman H. L. (1995). The role of the ironhydroxide-phosphate-sulphide system in the phosphate exchange between sediments and overlying water. Hydrobiologia297, 43–54. 10.1007/bf00033500
76
Golterman H. L. (2001). Phosphate release from anoxic sediments or `What did Mortimer really write?Hydrobiologia450, 99–106. 10.1023/A:1017559903404
77
Goossens H. de Leeuw J. W. Schenck P. A. Brassell S. C. (1984). Tocopherols as likely precursors of pristane in ancient sediments and crude oils. Nature312, 440–442. 10.1038/312440a0
78
Gradstein F. M. Agterberg F. P. Ogg J. G. Hardenbol J. Van Veen P. Thierry J. et al (1992). A Mesozoic time scale. J. Geophys. Res. Solid Earth99 (B12), 24051–24074. 10.1029/94JB01889
79
Guerrera F. Mancheño M. A. Martín-Martín M. Raffaelli G. Rodríguez-Estrella T. Serrano F. (2014). Paleogene evolution of the external etic one and geodynamic implications. Geol. Acta12 (3), 171–192. 10.1344/GeologicaActa2014.12.3.1
80
Haldar S. K. (2020). “Chapter 3 - basic mineralogy,” in Introduction to ineralogy and petrology. Editor HaldarS. K.Second Edition (Oxford: Elsevier), 109–143. 10.1016/B978-0-12-820585-3.00003-X
81
Hatch J. R. Leventhal J. S. (1992). Relationship between inferred redox potential of the depositional environment and geochemistry of the Upper Pennsylvanian (Missourian) Stark Shale Member of the Dennis Limestone, Wabaunsee County, Kansas, U.S.A. Chem. Geol.99, 65–82. 10.1016/0009-2541(92)90031-Y
82
Hedges J. I. (1987). Organic matter in sea water. Nature330, 205–206. 10.1038/330205a0
83
Hedges J. I. Keil R. G. (1995). Sedimentary organic matter preservation: an assessment and speculative synthesis. Mar. Chem.49, 81–115. 10.1016/0304-4203(95)00008-F
84
Hedges J. I. Keil R. G. Benner R. (1997). What happens to terrestrial organic matter in the ocean?Org. Geochem.27, 195–212. 10.1016/S0146-6380(97)00066-1
85
Heldt M. Mutterlose J. Berner U. Erbacher J. (2012). First high-resolution δ13C-records across black shales of the Early Aptian Oceanic Anoxic Event 1a within the mid-latitudes of northwest Europe (Germany, Lower Saxony Basin)a. Newsletters Stratigr.45 (2), 151–169. 10.1127/0078-0421/2012/0019
86
Herdocia C. Maurrasse F.J.-M. R. (2022). Chemostratigraphic characteristics of trace elements, biomarkers and clay mineralogy indicating environmental conditions within Aptian sediments of the Organyà Basin, North‐east Spain, prior to the onset of OAE 1a. Depos. Rec.8, 931–957. 10.1002/dep2.186
87
Hernandez-Ayon J. M. Paulmier A. Garcon V. Sudre J. Montes I. Chapa-Balcorta C. et al (2019). Dynamics of the Carbonate System Across the Peruvian Oxygen Minimum Zone. Front. Mar. Sci.6, 617. 10.3389/fmars.2019.00617
88
Herrle J. O. Kößler P. Friedrich O. Erlenkeuser H. Hemleben C. (2004). High-resolution carbon isotope stratigraphy of the Aptian to Lower Albian: a tool for reconstructing paleoceanographic changes and paleobiological evolution. Earth Planet. Sci. Lett.218, 149–161. 10.1016/S0012-821X(03)00646-0
89
Hower J. Eslinger E. V. Hower M. E. Perry E. A. (1976). Mechanism of burial metamorphism of argillaceous sediment: 1. Mineralogical and chemical evidence. Geol. Soc. Am. Bull.87, 725–737. 10.1130/0016-7606(1976)87<725:MOBMOA>2.0.CO;2
90
Hu X. Li J. Han Z. Li Y. (2020). Two types of hyperthermal events in the Mesozoic-Cenozoic: Environmental impacts, biotic effects, and driving mechanisms. Sci. China Earth Sci.63 (8), 1041–1058. 10.1007/s11430-019-9604-4
91
Hu X. Zhao K. Yilmaz I. O. Li Y. (2012). Stratigraphic transition and palaeoenvironmental changes from the Aptian oceanic anoxic event 1a (OAE1a) to the oceanic red bed 1 (ORB1) in the Yenicesihlar section, central Turkey. Cretac. Res.38, 40–51. 10.1016/j.cretres.2012.01.007
92
Huber B. T. Hodell D. A. Hamilton C. P. (1995). Middle–Late Cretaceous climate of the southern high latitudes: stable isotopic evidence for minimal equator-to-pole thermal gradients. Geol. Soc. Am. Bull.107, 1164–1191. 10.1130/0016-7606(1995)107<1164:mlccot>2.3.co;2
93
Huck S. Rameil N. Korbar T. Heimhofer U. Wieczorek T. D. Immenhauser A. (2010). Latitudinally different responses of Tethyan shoal-water carbonate systems to the Early Aptian oceanic anoxic event (OAE 1a). Sedimentology57, 1585–1614. 10.1111/j.1365-3091.2010.01157.x
94
Jahren A. H. Arens N. C. Sarmiento G. Guerrero J. Amundson R. (2001). Terrestrial record of methane hydrate dissociation in the Early Cretaceous. Geology29, 159–162. 10.1130/0091-7613(2001)029<0159:tromhd>2.0.co;2
95
Jenkyns H. C. (1980). Cretaceous anoxic events: from continents to oceans. J. Geol. Soc. Lond.137, 171–188. 10.1144/gsjgs.137.2.0171
96
Jenkyns H. C. (2003). Evidence for rapid climate change in the Mesozoic–Palaeogene greenhouse world. Philos. Trans. R. Soc. Lond. A Math. Phys. Eng. Sci.361, 1885–1916. 10.1098/rsta.2003.1240
97
Kawamura K. Ishiwatari R. Ogura K. (1987). Early diagenesis of organic matter in the water column and sediments: Microbial degradation and resynthesis of lipids in Lake Haruna. Org. Geochem.11, 251–264. 10.1016/0146-6380(87)90036-2
98
Kleppel G. S. (1993). On the diets of calanoid copepods. Mar. Ecol. Ser.99, 183–195. 10.3354/meps099183
99
Kuczynska P. Jemiola-Rzeminska M. Strzalka K. (2015). Photosynthetic pigments in diatoms. Mar. Drugs13, 5847–5881. 10.3390/md13095847
100
Kuhnt W. Holbourn A. Moullade M. (2011). Transient global cooling at the onset of early Aptian oceanic anoxic event (OAE) 1a. Geology39, 323–326. 10.1130/G31554.1
101
Kuhnt W. Moullade M. Masse J.-P. Erlenkeuser H. (1998). Carbon isotope stratigraphy of the lower Aptian historical stratotype at Cassis-La Bédoule (SE France). Géologie Méditerranéenne25, 63–79. 10.3406/geolm.1998.1625
102
Larson R. L. (1991). Geological consequences of superplumes. Geology19, 963–966. 10.1130/0091-7613(1991)019<0963:gcos>2.3.co;2
103
Leandro C. G. Savian J. F. Kochhann M. V. L. Franco D. R. Coccioni R. Frontalini F. et al (2022). Astronomical tuning of the Aptian Stage: implications for age recalibrations and paleoclimatic events. Nat. Commun.13, 2941. 10.1038/s41467-022-30075-3
104
Leckie R. M. Bralower T. J. Cashman R. (2002). Oceanic anoxic events and plankton evolution: Biotic response to tectonic forcing during the mid‐Cretaceous. Paleoceanography17, 11–13. 10.1029/2001pa000623
105
Li J. Hu X. Zhao K. Cai Y. Sun T. (2016). Paleoceanographic evolution and chronostratigraphy of the Aptian Oceanic Anoxic Event 1a (OAE1a) to oceanic red bed 1 (ORB1) in the Gorgo a Cerbara section (central Italy). Cretac. Res.66, 115–128. 10.1016/j.cretres.2016.04.016
106
Li M. Larter S. R. Taylor P. Jones D. M. Bowler B. Bjorøy M. (1995). Biomarkers or not biomarkers? A new hypothesis for the origin of pristane involving derivation from methyltrimethyltridecylchromans (MTTCs) formed during diagenesis from chlorophyll and alkylphenols. Org. Geochem.23, 159–167. 10.1016/0146-6380(94)00112-E
107
Li Y.-X. Bralower T. J. Montañez I. P. Osleger D. A. Arthur M. A. Bice D. M. et al (2008). Toward an orbital chronology for the early Aptian Oceanic Anoxic Event (OAE 1a, ∼120 Ma). Earth Planet. Sci. Lett.271, 88–100. 10.1016/j.epsl.2008.03.055
108
Lomnitz U. Sommer S. Dale A. W. Löscher C. R. Noffke A. Wallmann K. et al (2016). Benthic phosphorus cycling in the Peruvian oxygen minimum zone. Biogeosciences13, 1367–1386. 10.5194/bg-13-1367-2016
109
Londoño V. Collins L. S. (2022). Controls on sedimentary accumulation of organic matter during Cretaceous Oceanic Anoxic Event 2, IODP site U1407, Southeast Newfoundland Ridge. Mar. Geol.443, 106699. 10.1016/j.margeo.2021.106699
110
Lorenzen J. Kuhnt W. Holbourn A. Flögel S. Moullade M. Tronchetti G. (2013). A new sediment core from the Bedoulian (Lower Aptian) stratotype at Roquefort-La Bédoule, SE France. Cretac. Res.39, 6–16. 10.1016/j.cretres.2012.03.019
111
Lusk B. G. Morgan S. Mulvaney S. P. Blue B. LaGasse S. W. Cress C. D. et al (2024). Hydrated cable bacteria exhibit protonic conductivity over long distances. PNAS122 (4), e2416008122. 10.1073/pnas.2416008122
112
Mackenzie A. S. Patience R. L. Maxwell J. R. Vandenbroucke M. Durand B. (1980). Molecular parameters of maturation in the Toarcian shales, Paris Basin, France—I. Changes in the configurations of acyclic isoprenoid alkanes, steranes and triterpanes. Geochim. Cosmochim. Acta44, 1709–1721. 10.1016/0016-7037(80)90222-7
113
Malinverno A. Erba E. Herbert T. D. (2010). Orbital tuning as an inverse problem: Chronology of the early Aptian oceanic anoxic event 1a (Selli Level) in the Cismon APTICORE. Paleoceanography25 (2). 10.1029/2009pa001769
114
Malkin S. Y. Rao A. M. F. Seitaj D. Vasquez-Cardenas D. Zetsche E.-M. Hidalgo-Martinez S. et al (2014). Natural occurrence of microbial sulphur oxidation by long-range electron transport in the seafloor. ISME J.8, 1843–1854. 10.1038/ismej.2014.41
115
Marlow J. R. Farrimond P. Rosell-Melée A. (2001). “5. Analysis of lipid biomarkers in sediments from the Benguela Current coastal upwelling system (Site 1084),” in Proc. ODP, sci. Results. Editors WeferG.BergerW. H.RichterC., 175, 1–26.
116
Martin-Chivelet J. Beràstegui X. Rosales I. Vilas L. Vera J. A. Caus E. et al (2002). “Cretaceous,” in The eology of Spain. Editors GibbonsW.MorenoT. (London: The Geological Society of London), 255–292.
117
Menegatti A. P. Weissert H. Brown R. S. Tyson R. V. Farrimond P. Strasser A. et al (1998). High‐resolution δ13C stratigraphy through the early Aptian “Livello Selli” of the Alpine Tethys. Paleoceanography13, 530–545. 10.1029/98PA01793
118
McIntosh J. A. Tabor N. J. Rosenau N. A. (2021). Mixed-Layer Illite-Smectite in Pennsylvanian-Aged Paleosols: Assessing Sources of Illitization in the Illinois Basin. Minerals11, 108. 10.3390/min11020108
119
Meyers P. A. (2003). Applications of organic geochemistry to paleolimnological reconstructions: a summary of examples from the Laurentian Great Lakes. Org. Geochem.34, 261–289. 10.1016/S0146-6380(02)00168-7
120
Meyers P. A. Eadie B. J. (1993). Sources, degradation and recycling of organic matter associated with sinking particles in Lake Michigan. Org. Geochem.20, 47–56. 10.1016/0146-6380(93)90080-U
121
Michalík J. Soták J. Lintnerová O. Halásová E. Bąk M. Skupien P. et al (2008). The stratigraphic and paleoenvironmental setting of Aptian OAE black shale deposits in the Pieniny Klippen Belt, Slovak Western Carpathians. Cretac. Res.29, 871–892. 10.1016/j.cretres.2008.05.005
122
Millán M. I. Weissert H. J. Fernández-Mendiola P. A. García-Mondéjar J. (2009). Impact of Early Aptian carbon cycle perturbations on evolution of a marine shelf system in the Basque-Cantabrian Basin (Aralar, N Spain). Earth Planet. Sci. Lett.287, 392–401. 10.1016/j.epsl.2009.08.023
123
Molina J. M. (1987). Análisis de facies del Mesozoico en el Subbético Externo. (Prov. De Córdoba y sur de Jaén). PhD thesis. Granada: Universidad de Granada, 512.
124
Moore D. M. Reynolds R. C. (1989). X-ay iffraction and the dentification and nalysis of lay inerals. New York: Oxford University Press, 378.
125
Morford J. L. Emerson S. (1999). The geochemistry of redox sensitive trace metals in sediments. Geochim. Cosmochim. Acta63, 1735–1750. 10.1016/S0016-7037(99)00126-X
126
Muñoz M. Vidal O. Marcaillou C. Pascarelli S. Mathon O. Farges F. (2013). Iron oxidation state in phyllosilicate single crystals using Fe-K pre-edge and XANES spectroscopy: Effects of the linear polarization of the synchrotron X-ray beam. Am. Mineral.98, 1187–1197. 10.2138/am.2013.4289
127
Murphy A. E. Sageman B. B. Hollander D. J. Lyons T. W. Brett C. E. (2000). Black shale deposition and faunal overturn in the Devonian Appalachian Basin: Clastic starvation, seasonal water‐column mixing, and efficient biolimiting nutrient recycling. Paleoceanography15, 280–291. 10.1029/1999pa000445
128
Najarro M. Rosales I. Moreno-Bedmar J. A. de Gea G. A. Barrón E. Company M. et al (2011). High-resolution chemo-and biostratigraphic records of the Early Aptian oceanic anoxic event in Cantabria (N Spain): Palaeoceanographic and palaeoclimatic implications. Palaeogeogr. Palaeoclimatol. Palaeoecol.299, 137–158. 10.1016/j.palaeo.2010.10.042
129
Nie Y. Fu X. Wei H. Lin F. Zeng S. Mansour A. et al (2023). Paleoenvironmental reconstruction preceding and during the early Aptian Oceanic Anoxic Event 1a in southern Tibet, eastern Tethys. Cretac. Res.150, 105604. 10.1016/j.cretres.2023.105604
130
Nielsen L. P. Risgaard-Petersen N. Fossing H. Christensen P. B. Sayama M. (2010). Electric currents couple spatially separated biogeochemical processes in marine sediment. Nature463, 1071–1074. 10.1038/nature08790
131
Olivet J.-L. (1996). Kinematics of the Iberian plate. Bull. Centres Rech. Elf Exploration Prod.20, 191–195.
132
Parsons C. T. Rezanezhad F. O’Connell D. W. Van Cappellen P. (2017). Sediment phosphorus speciation and mobility under dynamic redox conditions. Biogeosciences14, 3585–3602. 10.5194/bg-14-3585-2017
133
Paytan A. McLaughlin K. (2007). The Oceanic Phosphorus Cycle. Chem. Rev.107, 563–576. 10.1021/cr0503613
134
Pearson K. (1896). Mathematical Contributions to the Theory of Evolution. --On a Form of Spurious Correlation Which May Arise When Indices Are Used in the Measurement of Organs. Proc. R. Soc. Lond.60, 489–498. 10.1098/rspl.1896.0076
135
Percival L. M. E. Tedeschi L. R. Creaser R. A. Bottini C. Erba E. Giraud F. et al (2021). Determining the style and provenance of magmatic activity during the early Aptian Oceanic Anoxic Event (OAE 1a). Glob. Planet. Change200, 103461. 10.1016/j.gloplacha.2021.103461
136
Peters K. E. Walters C. C. Moldowan J. M. (2005). The biomarker guide: volume 1, Biomarkers and isotopes in the environment and human history. Cambridge: Cambridge University Press.
137
Peters K. E. Walters C. C. Moldowan J. M. (2007). The biomarker guide: volume 2, Biomarkers and isotopes in petroleum systems and earth history. Cambridge: Cambridge University Press.
138
Pfeffer C. Larsen S. Song J. Dong M. Besenbacher F. Meyer R. L. et al (2012). Filamentous bacteria transport electrons over centimetre distances. Nature491, 218–221. 10.1038/nature11586
139
Philippi G. T. (1965). On the depth, time and mechanism of petroleum generation. Geochim. Cosmochim. Acta29, 1021–1049. 10.1016/0016-7037(65)90101-8
140
Powell T. G. McKirdy D. M. (1973). Relationship between Ratio of Pristane to Phytane, Crude Oil Composition and Geological Environment in Australia. Nat. Phys. Sci.243, 37–39. 10.1038/physci243037a0
141
Prietzel J. Thieme J. Eusterhues K. Eichert D. (2007). Iron speciation in soils and soil aggregates by synchrotron-based X-ray microspectroscopy (XANES,μ-XANES). Eur. J. Soil Sci.58, 1027–1041. 10.1111/j.1365-2389.2006.00882.x
142
Quijano M. L. Castro J. M. Pancost R. D. de Gea G. A. Najarro M. Aguado R. et al (2012). Organic geochemistry, stable isotopes, and facies analysis of the Early Aptian OAE—New records from Spain (Western Tethys). Palaeogeogr. Palaeoclimatol. Palaeoecol.365, 276–293. 10.1016/j.palaeo.2012.09.033
143
Ravelo A. C. Fairbanks R. G. (1995). Carbon isotopic fractionation in multiple species of planktonic foraminifera from core-tops in the tropical Atlantic. J. Foraminifer. Res.25, 53–74. 10.2113/gsjfr.25.1.53
144
Reicherter K. Pletsch T. Kuhnt W. Manthey J. Homeier G. Wiedmann J. et al (1994). Mid-Cretaceous paleogeography and paleoceanography of the Betic Seaway (Betic Cordillera, Spain). Palaeogeogr. Palaeoclimatol. Palaeoecol.107, 1–33. 10.1016/0031-0182(94)90162-7
145
Rimmer S. M. (2004). Geochemical paleoredox indicators in Devonian–Mississippian black shales, central Appalachian Basin (USA). Chem. Geol.206, 373–391. 10.1016/j.chemgeo.2003.12.029
146
Risatti J. B. Rowland S. J. Yon D. A. Maxwell J. R. (1984). Stereochemical studies of acyclic isoprenoids—XII. Lipids of methanogenic bacteria and possible contributions to sediments. Org. Geochem.6, 93–104. 10.1016/0146-6380(84)90030-5
147
Robinson S. A. Williams T. Bown P. R. (2004). Fluctuations in biosiliceous production and the generation of Early Cretaceous oceanic anoxic events in the Pacific Ocean (Shatsky Rise, Ocean Drilling Program Leg 198). Paleoceanography19 (4). 10.1029/2004pa001010
148
Rontani J.-F. Bonin P. (2011). Production of pristane and phytane in the marine environment: role of prokaryotes. Res. Microbiol.162, 923–933. 10.1016/j.resmic.2011.01.012
149
Rontani J.-F. Nassiry M. Michotey V. Guasco S. Bonin P. (2010). Formation of pristane from α-tocopherol under simulated anoxic sedimentary conditions: A combination of biotic and abiotic degradative processes. Geochim. Cosmochim. Acta74, 252–263. 10.1016/j.gca.2009.09.028
150
Rowland S. J. (1990). Production of acyclic isoprenoid hydrocarbons by laboratory maturation of methanogenic bacteria. Org. Geochem.15, 9–16. 10.1016/0146-6380(90)90181-X
151
Ruffell A. McKinley J. M. Worden R. H. (2002). Comparison of clay mineral stratigraphy to other proxy palaeoclimate indicators in the Mesozoic of NW Europe. Philos. Trans. R. Soc. Lond. Ser. A Math. Phys. Eng. Sci.360, 675–693. 10.1098/rsta.2001.0961
152
Sandoval J. Bill M. Aguado R. O’Dogherty L. Rivas P. Morard A. et al (2012). The Toarcian in the Subbetic basin (southern Spain): Bio-events (ammonite and calcareous nannofossils) and carbon-isotope stratigraphy. Palaeogeogr. Palaeoclimatol. Palaeoecol.342, 40–63. 10.1016/j.palaeo.2012.04.028
153
Sanchez-Hernandez Y. Maurrasse F. J.-M. R. (2014). Geochemical characterization and redox signals from the latest Barremian to the earliest Aptian in a restricted marine basin: El Pui section, Organyà Basin, south-central Pyrenees. Chem. Geol.372, 12–31. 10.1016/j.chemgeo.2014.02.011
154
Sanchez-Hernandez Y. Maurrasse F. J.-M. R. (2016). The influence of regional factors in the expression of oceanic anoxic event 1a (OAE1a) in the semi-restricted Organyà Basin, south-central Pyrenees, Spain. Palaeogeogr. Palaeoclimatol. Palaeoecol.441, 582–598. 10.1016/J.PALAEO.2015.06.031
155
Sanchez-Hernandez Y. Maurrasse F. J.-M. R. Melinte-Dobrinescu M. C. He D. Butler S. K. (2014). Assessing the factors controlling high sedimentation rates from the latest Barremian–earliest Aptian in the hemipelagic setting of the restricted Organyà Basin, NE Spain. Cretac. Res.51, 1–21. 10.1016/J.CRETRES.2014.05.010
156
Sangüesa F. J. Arostegui J. Suarez-Ruiz I. (2000). Distribution and origin of clay minerals in the Lower Cretaceous of the Alava Block (Basque-Cantabrian Basin, Spain). Clay Min.35, 393–410. 10.1180/000985500546864
157
Schlanger S. O. Jenkyns H. C. (1976). Cretaceous oceanic anoxic events: causes and consequences. Geol. Mijnb.55, 179–184.
158
Scholle P. A. Arthur M. A. (1980). Carbon isotope fluctuations in Cretaceous pelagic limestones: potential stratigraphic and petroleum exploration tool. Am. Assoc. Pet. Geol. Bull.64, 67–87. 10.1306/2f91892d-16ce-11d7-8645000102c1865d
159
Scholz F. Hensen C. Noffke A. Rohde A. Liebetrau V. Wallmann K. (2011). Early diagenesis of redox-sensitive trace metals in the Peru upwelling area – response to ENSO-related oxygen fluctuations in the water column. Geochimica Cosmochimica Acta75, 7257–7276. 10.1016/j.gca.2011.08.007
160
Schouten S. van Kaam-Peters H. M. E. Rijpstra W. I. C. Schoell M. Sinninghe Damste J. S. (2000). Effects of an oceanic anoxic event on the stable carbon isotopic composition of early Toarcian carbon. Am. J. Sci.300, 1 LP–22. 10.2475/ajs.300.1.1
161
Seibold E. Berger W. (2017). “Sources and Composition of Marine Sediments,” in The Sea loor: n ntroduction to arine eology (Cham: Springer International Publishing), 45–61. 10.1007/978-3-319-51412-3_4
162
Seifert W. K. Moldowan J. M. (1978). Applications of steranes, terpanes and monoaromatics to the maturation, migration, and source of crude oils. Geochimica Cosmochimica Acta42, 77–95. 10.1016/0016-7037(78)90219-3
163
Seifert W. K. Moldowan J. M. (1980). The effect of thermal stress on source-rock quality as measured by hopane stereochemistry. Phys. Chem. Earth12, 229–237. 10.1016/0079-1946(79)90107-1
164
Seitaj D. Schauer R. Sulu-Gambari F. Hidalgo-Martinez S. Malkin S. Y. Burdorf L. D. W. et al (2015). Cable bacteria generate a firewall against euxinia in seasonally hypoxic basins. Proc. Natl. Acad. Sci.112, 13278–13283. 10.1073/pnas.1510152112
165
Sheldon N. D. Tabor N. J. (2009). Quantitative paleoenvironmental and paleoclimatic reconstruction using paleosols. Earth-science Rev.95, 1–52. 10.1016/j.earscirev.2009.03.004
166
Sinninghe Damsté J. S. Kuypers M. M. M. Pancost R. D. Schouten S. (2008). The carbon isotopic response of algae, (cyano)bacteria, archaea and higher plants to the late Cenomanian perturbation of the global carbon cycle: Insights from biomarkers in black shales from the Cape Verde Basin (DSDP Site 367). Org. Geochem.39, 1703–1718. 10.1016/j.orggeochem.2008.01.012
167
Socorro J. Maurrasse F.J.-M. R. (2019). Continuous accumulation of organic matter-rich sediments associated with Oceanic Anoxic Event 1a in the El Pujal section, Organyà Basin, Catalunyà Spain and its relation to episodic dysoxia. Cretac. Res.95, 225–251. 10.1016/J.CRETRES.2018.11.009
168
Socorro J. Maurrasse F. J.-M. R. (2020). Regional palaeoenvironmental influence on organic matter sequestration and characteristics of carbon isotope segment C5 in a hemipelagic sequence, Organyà Basin, northeast Spain. Depositional Rec.6, 552–580. 10.1002/dep2.111
169
Socorro J. Maurrasse F.J.-M. R. (2022). Demise of Organic Matter–Rich Facies and Changing Paleoenvironmental Conditions Associated with the End of Carbon Isotope Segment C5 of Oceanic Anoxic Event 1a in the North and Northeastern Iberian Peninsula. J. Geol.130, 133–170. 10.1086/718834
170
Socorro J. Maurrasse F.J.-M. R. Sanchez-Hernandez Y. (2017). Characterization of the negative carbon isotope shift in segment C2, its global implications as a harbinger of OAE1a. Sci. China Earth Sci.60, 30–43. 10.1007/s11430-016-0092-5
171
Swart P. K. Blättler C. L. Nakakuni M. Mackenzie G. J. Betzler C. Eberli G. P. et al (2019). Cyclic anoxia and organic rich carbonate sediments within a drowned carbonate platform linked to Antarctic ice volume changes: Late Oligocene-early Miocene Maldives. Earth Planet. Sci. Lett.521, 1–13. ISSN 0012-821X. 10.1016/j.epsl.2019.05.019
172
Tarduno J. A. Sliter W. V. Kroenke L. Leckie M. Mayer H. Mahoney J. J. et al (1991). Rapid Formation of Ontong Java Plateau by Aptian Mantle Plume Volcanism. Sci. (80)254, 399 LP–403. 10.1126/science.254.5030.399
173
Tatsumi Y. Shinjoe H. Ishizuka H. Sager W. W. Klaus A. (1998). Geochemical evidence for a mid-Cretaceous superplume. Geology26, 151–154. 10.1130/0091-7613(1998)026<0151:GEFAMC>2.3.CO;2
174
Tejada M. L. G. Suzuki K. Kuroda J. Coccioni R. Mahoney J. J. Ohkouchi N. et al (2009). Ontong Java Plateau eruption as a trigger for the early Aptian oceanic anoxic event. Geology37, 855–858. 10.1130/g25763a.1
175
Ten Haven H. L. De Leeuw J. W. Rullkötter J. Damsté J. S. S. (1987). Restricted utility of the pristane/phytane ratio as a palaeoenvironmental indicator. Nature330, 641–643. 10.1038/330641a0
176
Thiry M. (2000). Palaeoclimatic interpretation of clay minerals in marine deposits: an outlook from the continental origin. Earth-Science Rev.49, 201–221. 10.1016/S0012-8252(99)00054-9
177
Tribovillard N. Trentesaux A. Ramdani A. Baudinet F. Riboulleau A. (2004). Controls on organic accumulation in late Jurassic shales of northwestern Europe as inferred from trace-metal geochemistry. Bull. Société Géologique Fr.175, 491–506. 10.2113/175.5.491
178
Tsikos H. Jenkyns H. C. Walsworth-Bell B. Petrizzo M. R. Forster A. Kolonic S. et al (2004). Carbon-isotope stratigraphy recorded by the Cenomanian–Turonian Oceanic Anoxic Event: correlation and implications based on three key localities. J. Geol. Soc. Lond.161, 711–719. 10.1144/0016-764903-077
179
Tyson R. V. (2001). Sedimentation rate, dilution, preservation and total organic carbon: some results of a modelling study. Org. Geochem.32, 333–339. 10.1016/S0146-6380(00)00161-3
180
Tyson R. V. Pearson T. H. (1991). Modern and ancient continental shelf anoxia: an overview. Geol. Soc. Lond. Spec. Publ.58, 1–24. 10.1144/GSL.SP.1991.058.01.01
181
Van der Weijden C. H. (2002). Pitfalls of normalization of marine geochemical data using a common divisor. Mar. Geol.184, 167–187. 10.1016/S0025-3227(01)00297-3
182
Vine J. D. Tourtelot E. B. (1970). Geochemistry of black shale deposits; a summary report. Econ. Geol.65, 253–272. 10.2113/gsecongeo.65.3.253
183
Weissert H. (1989). C-isotope stratigraphy, a monitor of paleoenvironmental change: a case study from the Early Cretaceous. Surv. Geophys.10, 1–61. 10.1007/bf01901664
184
Weissert H. Lini A. Föllmi K. B. Kuhn O. (1998). Correlation of Early Cretaceous carbon isotope stratigraphy and platform drowning events: a possible link?Palaeogeogr. Palaeoclimatol. Palaeoecol.137, 189–203. 10.1016/s0031-0182(97)00109-0
185
Yilmaz I. Vennemann T. Altiner D. Satir M. (2004). Stable isotope evidence for meter-scale sea level changes in lower Cretaceous inner platform and pelagic carbonate successions of Turkey. Geol. Carpathica55, 19–36.
186
Zhang L. Xiao D. Lu S. Jiang S. Lu S. (2019). Effect of sedimentary environment on the formation of organic-rich marine shale: Insights from major/trace elements and shale composition. Int. J. Coal Geol.204, 34–50. 10.1016/j.coal.2019.01.014
187
Zhang X. Li S. Yin T. (2021). Terrestrial expression of the Cretaceous greenhouse regime and its relationship with OAE 1a: Evidence from the Jiaolai Basin, eastern China. Geol. J.56, 525–546. 10.1002/gj.3978
188
Ziegler P. A. (1988). Late Jurassic-Early Cretaceous Central Atlantic sea-floor spreading, closure of Neo-Tethys, and opening of Canada Basin. Evol. Arctic-North Atl. West. Tethys.10.1306/M43478C6
Summary
Keywords
RSTEs, OAE1a, oceanic anoxia, biomarker, chemostratigaraphy, cable bacteria
Citation
Herdocia C and Maurrasse FJ-MR (2025) Geochemical response of Aptian sediments before, during and after Oceanic Anoxic Event 1A: insight from the La Frontera section Subbetic Basin, southern Spain. Front. Earth Sci. 13:1547237. doi: 10.3389/feart.2025.1547237
Received
18 December 2024
Accepted
17 March 2025
Published
10 April 2025
Volume
13 - 2025
Edited by
Irene Cornacchia, National Research Council (CNR), Italy
Reviewed by
Luigi Jovane, University of São Paulo, Brazil
Maciej Bojanowski, Polish Academy of Sciences, Poland
Updates
Copyright
© 2025 Herdocia and Maurrasse.
This is an open-access article distributed under the terms of the Creative Commons Attribution License (CC BY). The use, distribution or reproduction in other forums is permitted, provided the original author(s) and the copyright owner(s) are credited and that the original publication in this journal is cited, in accordance with accepted academic practice. No use, distribution or reproduction is permitted which does not comply with these terms.
*Correspondence: Carlos Herdocia, cherd002@fiu.edu
Disclaimer
All claims expressed in this article are solely those of the authors and do not necessarily represent those of their affiliated organizations, or those of the publisher, the editors and the reviewers. Any product that may be evaluated in this article or claim that may be made by its manufacturer is not guaranteed or endorsed by the publisher.