 Tomaso Esposti Ongaro1*
 Matteo Cerminara1
 Mattia de’ Michieli Vitturi1
 Alessandro Tadini1
 Matteo Trolese1
 Alessandro Fornaciai1
 Luca Nannipieri1
 Benedetta Calusi2
 Jorge Macías3
 Manuel J. Castro3
 Cipriano Escalante3
 Sergio Ortega3
 José M. González-Vida3
 Juan F. Rodríguez-Gálvez1,3
- 1Istituto Nazionale di Geofisica e Vulcanologia, Pisa, Italy
- 2Dipartimento di Matematica, Università degli Studi di Firenze, Florence, Italy
- 3EDANYA Group, Universidad de Málaga, Málaga, Spain
Mass movements at Stromboli volcano (Aeolian islands, Italy) have the capability of generating tsunamis, potentially affecting not only the island shores, but the whole Aeolian archipelago and the Southern Tyrrhenian sea. Such mass movements can be associated with subaerial and subaqueous slope instabilities of the Sciara del Fuoco, and with pyroclastic avalanches generated by the explosive activity. In this work, we present a wide set of volcanic mass movement scenarios and the subsequent tsunami generation, propagation and inundation on the Stromboli shores. Scenarios are produced by using a multilayer, depth-averaged non-hydrostatic numerical model able to simulate the dynamics of granular avalanches, their interaction with the sea, and the generation and propagation of the water waves. Five volumes ranging from
1 Introduction
Stromboli is the northernmost volcanic island of the Aeolian archipelago (Italy) in the Southern Tyrrhenian Sea. It is known for its intermittent explosive “Strombolian” activity, which is persistent at the volcano since at least two thousands years. Ordinary Strombolian activity involves continuous degassing and periodic explosions usually lasting for a few seconds and taking place at intervals of tens of minutes. Each explosion ejects incandescent scoriæ, ash and blocks to heights of a few tens to hundreds of metres (Barberi et al., 1993; Rosi et al., 2000), but these products usually fall close to the crater area. The ordinary activity is occasionally broken by more intense effusive (lava flows) and explosive phenomena (major explosions and paroxysms) (Rosi et al., 2000; Bevilacqua et al., 2020b). Major explosions are qualitatively similar to ordinary explosions, but they are comparatively more intense, they generate higher ash plumes (up to about 1 km) and they are able to eject metre-sized bombs and blocks reaching distances of several hundred of metres. Paroxysms are the most energetic explosions observed at Stromboli: they can last up to a few minutes and they are able to eject up to metre-sized pumiceous/scoriaceous bombs and lithic blocks at distances up to 2.5 km from the vents. They usually form convective tephra plumes rising 3–4 km above the vents (up to 10 km in the largest-scale events) and are able to generate pyroclastic currents, as a result of the collapse of the volcanic column and crater rims (Rosi et al., 2013; Di Roberto et al., 2014; Giordano and De Astis, 2020).
Associated with the most intense volcanic activity, the occurrence of tsunamis is clearly testified by historical chronicles and sedimentological analysis (Rosi et al., 2013; 2019; Pistolesi et al., 2020; Schindelé et al., 2024). In particular, mass movements capable of generating tsunami by the entrance into the sea have been associated with subaerial and submarine slope instabilities of the unconsolidated volcanic sediments (tephra, scoriæ and lavas) accumulated on the steep volcanic slope, but also with pyroclastic avalanches generated by the explosive activity, in particular by major explosions and paroxysmal eruptions (Rosi et al., 2000; Bevilacqua et al., 2020b; a). Since the beginning of the XX century CE, there is evidence of at least five relevant tsunamis (i.e., large enough to be observed and to affect the shores of the Stromboli village) (Maramai et al., 2005b; Marani et al., 2008; Rosi et al., 2013; Pistolesi et al., 2020). The last relevant event took place on the 31st of December 2002 (Maramai et al., 2005a; b; Tinti et al., 2005; Bonaccorso et al., 2003), triggered by multiple collapse events that occurred after days of intense effusive activity (Chiocci et al., 2008; Rosi et al., 2013) on the Sciara del Fuoco. This event produced a tsunami with run-up heights locally up to several metres, severely damaging many buildings but fortunately resulting in no casualties (Maramai et al., 2005b). Since 2019, other tsunamis have been observed, all associated with pyroclastic flows generated by paroxysmal eruptions (Calvari et al., 2022; Giordano and De Astis, 2020) or minor flank instabilities during periods of high eruptive intensity. Such events are relatively small compared to the 2002 event (Ripepe and Lacanna, 2024), and will not be addressed in this work.
Sciara del Fuoco (SdF) is a horseshoe-shaped depression in the NW sector of Stromboli volcano, which is 1700 m wide, 30° steep, and extends underwater to a depth over 2000 m. It was formed by repeated, large flank collapses of the volcano, starting about 13 ka (Tibaldi, 2001). The present lateral walls of the SdF are hypothesized to be the result of a large collapse that occurred about 6,000 years ago, whereas the most recent, large collapse probably took place in the Middle-age (Tibaldi, 2001; Rosi et al., 2019). Currently, the configuration of the SdF, its degree of filling by the fragmentary eruptive products of various grain sizes (bombs, lapilli, ashes and clinkers) alternating with lava flows of modest thickness (Marsella et al., 2009), and the position of the eruptive vents located at the top of the structure, make it prone to instability and episodes of partial collapse (Apuani et al., 2005; Romagnoli et al., 2009; Nolesini et al., 2013; Di Traglia et al., 2023b), with associated potential tsunami generation (Casalbore et al., 2020; Casalbore et al., 2011). The recent 2019 paroxysms, with the generation of pyroclastic avalanches (Calvari et al., 2020; Giordano and De Astis, 2020; Ripepe and Lacanna, 2024) and the instability episodes that occurred in 2021–2022 (Calvari et al., 2022), claim for an urgent, quantitative evaluation of the tsunami hazard associated with mass movements on the Sciara del Fuoco (Turchi et al., 2022).
This work follows a previous study by the same authors (Esposti Ongaro et al., 2021), in which we calibrated and validated our model by comparing numerical results with the observations of the 2002 event at Stromboli, and with previous studies by Fornaciai et al. (2019). Here, with an approach similar to that adopted in other tsunami hazard studies (Selva et al., 2021), we present and discuss a large set of numerical simulations of volcanic mass movements, and the subsequent tsunami generation, propagation and inundation on the Stromboli shores. The simulated scenarios have been chosen in a volume range compatible with the 2002 event, which has been taken as a reference case by the Italian Civil Protection (Dipartimento della Protezione Civile, 2015). The database of the scenarios computed in this study will be used in a following work for probabilistic hazard assessment.
Section 2 summarizes the motivations at the basis of the choice of a multilayer, two-fluids model, and the main features of physical/numerical solver. The set of numerical parameters defining the scenarios is described in Section 3. Model sensitivity analysis, and a preliminary quantitative assessment of model uncertainty is presented in Section 4. Section 5 illustrates the main results of the study with analysis of the tsunami waveforms and representation of the inundation patterns. In Section 6 we discuss some of the most relevant aspects deriving from the comparison of different scenarios, and the implications for hazard assessment. Finally, in Section 7 we summarize the outcomes of this work, give the references for accessing the database of the results, and draw a perspective for future works on tsunami hazard and risk assessment at Stromboli.
2 Numerical model of tsunami generation and propagation
In a previous study (Esposti Ongaro et al., 2021), we have reviewed several different modeling approaches (Tinti et al., 2000; 2005; 2006; 2008; Cecioni and Bellotti, 2010; Yavari-Ramshe and Ataie-Ashtiani, 2016; Fornaciai et al., 2019; Grilli et al., 2019) to conclude that non-hydrostatic, multilayer depth-averaged models are appropriate to simulate proximal waveforms of landslide-generated tsunamis on volcanic islands and the subsequent propagation in the deep sea. Using multiple layers (three being the optimal compromise with the required computational effort in our tests) improves the quality of predictions. We then presented several scenarios for tsunamis generated by a submarine mass movement at Stromboli by using the Multilayer-HySEA model (Macías et al., 2021a; Macías et al., 2021b), and inspected the sensitivity of the results to several numerical parameters. A reference scenario that best-fit the observed impact of the 2002 event at Stromboli was chosen, restricting the analysis to the submarine mass movement trigger mechanism. In this paper, we adopt the same physical and numerical model of Esposti Ongaro et al. (2021) and extend the simulation study to a wider range of volumes, densities and initial (both subaerial and submarine) positions of the granular mass.
2.1 Model
The Multilayer-HySEA model (Macías et al., 2021a; b) implements a two-phase (granular mass flow plus water) two-way (coupled interaction between the two phases) model intended to reproduce the interaction between the granular slide (submarine or subaerial) and the sea. The model has been validated against laboratory experiments (Kirby et al., 2018), using data proposed by the US National Tsunami Hazard and Mitigation Program (NTHMP).
Figure 1 shows a schematic picture of the model configuration. The subscript
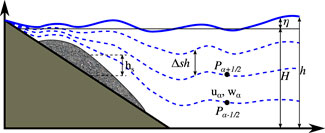
Figure 1. Schematic diagram describing the multilayer, two-phase model (Macías et al., 2021b).
The averaged horizontal velocity for the granular material is
If
and,
The mass flux across interfaces is indicated by the terms
and we assume that there is no mass transfer through the granular-water interface or the water-free surface:
In the model, the granular mass is described as a fluid, using the depth-averaged thin-layer equations for a granular flow (Savage and Hutter, 1989), implementing the Pouliquen and Forterre (2002) friction law. The landslide/granular flow model is written (here for the 1D case) as:
The first equation in Equation 1 expresses the depth-averaged conservation of the granular mass; the second equation is the balance of the horizontal momentum, assuming an isotropic stress distribution. The vertical component of the momentum equation reduces to the hydrostatic equation for the pressure. The term
The water fluid is modeled using a multilayer non-hydrostatic shallow-water system (Fernández-Nieto et al., 2018) to account for dispersive waves in the water. Unlike standard one-layer shallow-water approaches, the model is non-hydrostatic, a feature of the model proven to be critical in the presence of steep bathymetric slopes and/or when the wavelength is comparable with the water depth (Yavari-Ramshe and Ataie-Ashtiani, 2016; Macías et al., 2021b; Esposti Ongaro et al., 2021). In other words, the proposed approach allows the simulations to account for non-linear effects while accurately capturing relevant dispersive effects. This is achieved by discretizing the water column into a number of vertical interacting layers and decomposing the pressure into the sum of hydrostatic and non-hydrostatic components. When the number of layers increases, the dispersion relation of the model converges to that of Airy’s theory. The model is written (for the 1D case) in compact form for a 2D geometry as:
for
The first equation in system 3 (Equation 3) expresses the mass conservation; the second and third are the horizonal and vertical momentum balance. The first two terms on the right-hand side of the second equation represent the hydrostatic and non-hydrostatic components of pressure force, respectively. Here,
In order to close the system, the following boundary conditions are imposed at the free-surface and at the granular-water interface
The last two conditions enter into the incompressibility relation,
It should be noted that the water and the granular layers are coupled through the unknown
The set of system 3 (Equation 3) is solved on the whole domain where the water thickness exceeds a given threshold (set to 1 cm), including those portions of the topography initially dry and eventually reached by the water wave. In other words, no additional model is imposed to compute onland inundation.
2.2 Water friction model
The classical Manning-type parameterization for the bottom shear stress,
Here,
Finally, the coupling between the phases is modeled by the drag term
proportional to the velocity difference between the two phases. That terms allows to take into account pressure variations induced by the fluctuation on the free surface of the water fluid over the granular flow. The implications of such an assumption, introduced to ease the numerical solution, are extensively described by Macías et al. (2021b).
2.3 Granular friction model
The rheology of the granular material is probably the most important and most difficult constitutive model to constrain. The stress tensor in a granular flow depends on the properties of the material (density, shape, roughness, composition, size distribution of the grains) and of the interstitial fluid, and on the dynamical regime (from the quasi-static to a frictional weakening regime) (see, for example, Jop et al. (2006) and the references therein).
In this work, the unified rheological model for the variety of granular regimes proposed by Pouliquen and Forterre (2002) has been adopted. The definition of
where the friction coefficient
where
In which
2.4 Discretization and numerical solution
The model is solved in Cartesian coordinates. The system of equations is discretized using a second-order finite volume PVM positive-preserving well-balanced, path-conservative method (Castro and Fernández-Nieto, 2012). The numerical solution scheme is based on a two-step projection-correction method, similar to the standard Chorin’s projection method for Navier-Stokes equations (Chorin, 1968). That is a standard procedure when dealing with dispersive systems (see Escalante et al. (2019) and references therein). The resulting numerical scheme is well-balanced for the water at rest solution and is linearly
3 Scenario definition
In this work, we use Multilayer-HySEA to simulate both subaerial and submarine mass movements at the Sciara del Fuoco, providing a wide set of tsunami scenarios at Stromboli for a range of initial conditions. The values of the initial condition parameters are set to be compatible with those hypothesized for the 2002 event. We hereby report on the most important parameters analyzed in this study, and on the physical and geological constraints used to define their ranges of variability. Sensitivity studies are made on the waveforms, i.e., the elevation of the free surface sampled in time at specific measuring points (gauges; Figure 2): four proximal and two medium-distal locations offshore the Sciara del Fuoco, and three locations close to the Stromboli village. By taking as a reference length scale the size of the island (
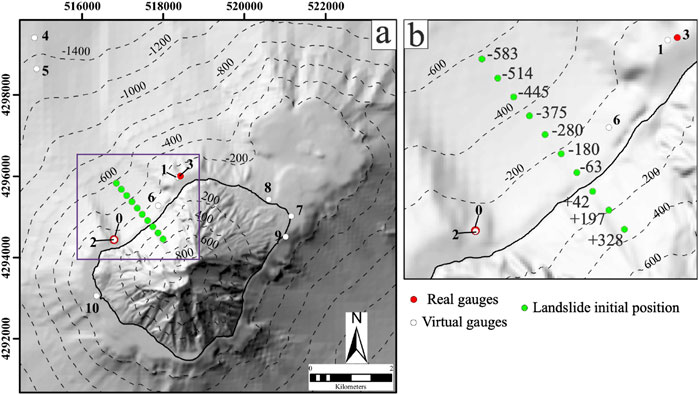
Figure 2. (a) Map of the position of the real (in red) and virtual (in white) gauges where the tsunami waveforms have been sampled. Landslide initial positions are marked in green; (b) enlargement of blue box in (a) Coordinates expressed in the WGS-84 33 N system. Dashed lines are isobaths in m.
Granular mass volume. According to Chiocci et al. (2008), the 30 December 2002 tsunami at Stromboli was initially caused by a
Initial elevation. We have sampled four subaerial and six submarine initial positions of the center of mass of the landslide along the central axis of the Sciara del Fuoco, from −583 m to +328 m, consistently with observations of the 2002 event (Chiocci et al., 2008). Potential instability of the crater area at higher elevations has been observed during ordinary and extraordinary eruptive activity (Di Traglia et al., 2023a; Giudicepietro et al., 2023), but this would likely involves smaller volumes (
Density contrast. The ratio between the water and granular mass densities depends on many factors, including the initial porosity of the unconsolidated sediments, the amount of air entrained in the subaerial propagation of the granular material, the amount of sea water entrained in the submarine motion. We have assumed different density contrast (
4 Sensitivity study
In a prior sensitivity study, we have analyzed, for only one volume (
Granular volume initial aspect ratios. We have tested the effect of the initial shape by varying, at constant volume, the horizontal aspect ratio (the ratio between the transversal and longitudinal axes with respect to the direction of the maximum topographic slope) of the collapsing mass from 0.25 to 4, while the initial maximum thickness of the granular flow was varied from 56 to 224 m (Supplementary Figures S211). In general, the granular flow initial thickness has little influence on the proximal waveforms, with the exception of the first trough which is always deeper for thicker granular flows. On the contrary, the positive crests are always of comparable height. At medium-distal gauges, thicker granular mass movements seem to increase the high-frequency content of the tsunami, but the trends do not look significant. The horizontal aspect ratio has a more significant influence on the initial waveform. In particular, elongated slides produce a deeper trough and a higher first crest, with variations of up to 27%, in magnitude. However, this initial increased amplitude at the proximal gauges is not observed at more distal ones. In conclusion, we estimate that the horizontal-to-vertical and the transversal-to-longitudinal granular volume aspect ratios have relatively little influence on the generated waves. In the following analysis, we have then considered constant 6:1 (width to thickness) and 1:1 (length to width) aspect ratios, respectively.
Horizontal granular mass position. The initial position of the barycenter of the granular mass on the same isobath has been varied with respect to the central axis of the Sciara del Fuoco, in two positions displaced 440 m along NE and 395 m along SW (Supplementary Figures S1617). The proximal waveforms are quite sensitive to the horizontal position (with a variability range of around 10%), but comparably less significant than other parameters.
Rheological parameters. The friction parameters for both the granular and the water mass have been described in Sections 2.3, 2.2. Such models need a preliminary calibration. For the water layer, the Manning coefficient is taken in the range [0.005, 0.01, 0.02, 0.05] s m−1/3 (Gibbons et al., 2022). For the granular rheology, the friction angles
Since a database of granular mass movements of unconsolidated tephra is not available at Stromboli, we have adopted values of the parameters within the calibration range by Brunet et al. (2017) and from the previous literature (Pouliquen and Forterre, 2002):
As a first test, we inspected the influence of the
A second set of tests has been carried out by varying the values of
This is clearly one of the major uncertainties in the predictions, that we will discuss in Section 6. In this work, for the simulation of tsunami scenarios, we adopted a conservative approach and we chose to use the lowest values (in the proposed range) of the friction angles.
Numerical parameters: number of layers. The influence of the model approximation and number of layers has been widely described by Esposti Ongaro et al. (2021). We have repeated the sensitivity tests in this work with (1,2,3,4,5,10) layers (Supplementary Figure S30), and confirmed the previous results, i.e., that the one-layer solution strongly differs from the multilayer ones, and that above three layers there is basically no difference in the waveforms. We therefore adopted three water layers over the entire study.
Numerical parameters: grid resolution. We have repeated simulations with grid resolutions of 10 m, 20 m, and 40 m (Supplementary Figure S18). As expected, the frequency content increases at higher resolution. With the 40 m grid the maximum wave height is reduced up to 10% (Table 3). Such an error is associated to the changes in topobathimetry close to the shoreline. To reduce the error, we decided to use a 20 m grid as a compromise between spatial resolution and computational cost of the simulations. The cost of a single run (600 s of simulation) on the spatial domain represented in Figure 2 with 20 m resolution is 7,200–10,800 s on a on a Linux server with 40 Xeon X cores and one NVIDIA Tesla P100 16GB, 3584 CUDA cores, having a nominal peak performance of 4.7 TFLOPS.
In summary, the results of the sensitivity analysis clearly highlight the dominant role of the initial volume and position of the landslide. Rheology also significantly affects the results, as discussed above. The aspect ratio appears to have a comparable influence, but it is worth noticing that analyzed range (0.25–4.00) of aspect ratios is much wider than what is typically observed for landslides.
5 Results
The combination of parameters reported in Table 1 results in a total of 150 simulated scenarios. Every run has been automatically post-processed to produce geo-referenced maps of the maximum wave height, arrival time and inundation, and timeseries of the free surface elevation at ten discrete points (waveforms). The arrival time is the time of the arrival of the first crest, measured with a threshold of 1 cm. The inundation on land is represented by the maximum water depth above the topography. Waveforms sampled at several discrete points (virtual gauges) have been saved for each run, both in data and image formats. The sampling positions are listed in Table 2 and represented in Figure 2.
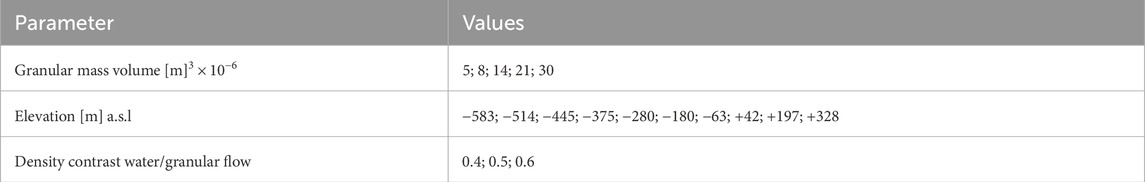
Table 1. Parameters defining the simulated scenarios.
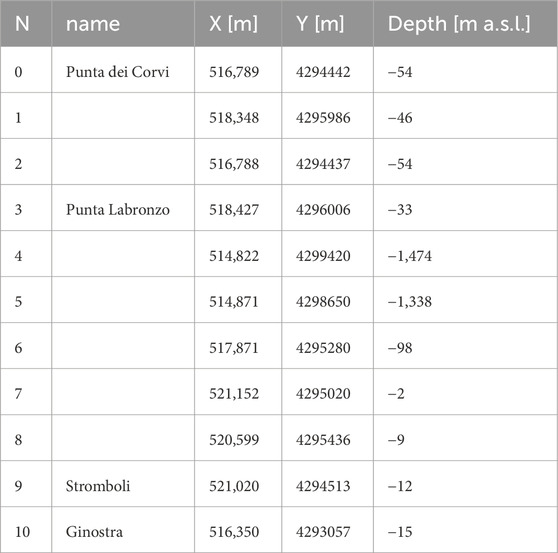
Table 2. Positions of the virtual gauges where the tsunami waveforms have been sampled (X and Y are longitude and latitude in UTM coordinates. Positions 0 and 3 correspond to the two real gauges installed offshore the Sciara del Fuoco at Stromboli.
In the following, we analyze the influence of the three parameters reported in Table 1 on the resulting waveforms, limiting the analysis to a subsample of the simulation ensemble, from 5 to 14
5.1 Granular flow density
The effect of the granular flow density has been evaluated on all scenarios. In all simulated cases, the density of the granular mixture has a second-order effect, affecting only slightly the height of the first crest. Figure 3 shows the waveforms at the proximal gauge 0 for (a) subaerial and (b) submarine granular mass movements of 14
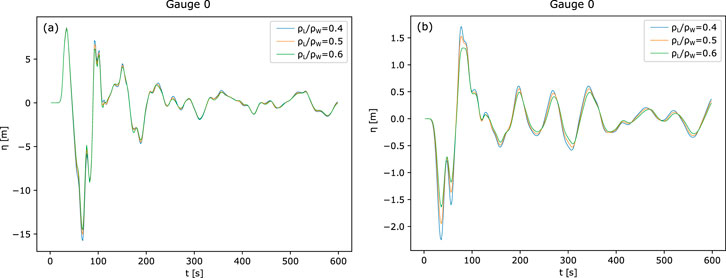
Figure 3. Waveforms generated by (a) subaerial (+328 m) and (b) submarine (−375 m) mass movements of 14
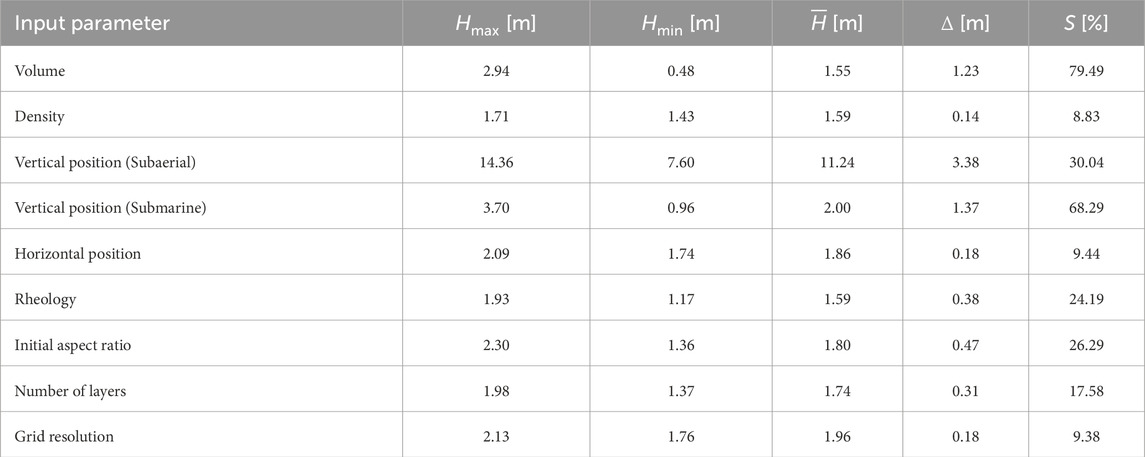
Table 3. Sensitivity index
5.2 Granular flow volume
The initial volume of the granular mass is certainly the most important parameter controlling the generation and impact of the subsequent tsunami. In our simulations, at the proximal gauges, the volume of the granular mass movement directly correlates with the maximum wave height (Figure 4). The differences in the waveforms are, in general, relatively small, and mostly associated with an increase in the high-frequency component of the waves with increasing volumes, for both submarine and subaerial landslides. Some dependency of the waveform on the volume can be observed for subaerial mass movements, because of the different triggering time, but also because subaerial flows change their shape more rapidly during propagation and can have different aspect ratios at the impact with the sea. It is also clear from these plots that subaerial mass movements have a much higher potential to generate high waves, at equal volume. In the next section, we will discuss in more detail the differences associated with the initial position of the granular mass.
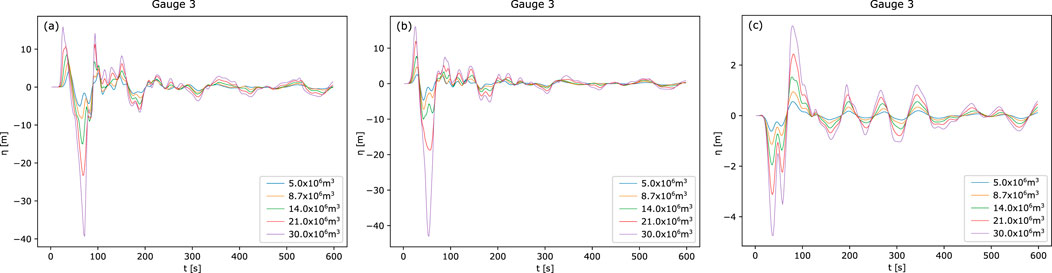
Figure 4. Waveforms generated by (a) subaerial (+328 m), (b) intermediate (−63 m) and (c) submarine (−375 m) mass movements at gauge 0 (Punta dei Corvi), for volumes from 5 to 30
In Figure 5, we plot the same waves sampled at gauge 5, about 5 km offshore SdF. The waves generated by subaerial mass movements (plots a and b) evolve into coherent wavetrains, with a clear direct correlation of the amplitude with the volume. The wave generated by a submarine mass movement (c) has lost its distinctive first trough, while a leading crest appeared.
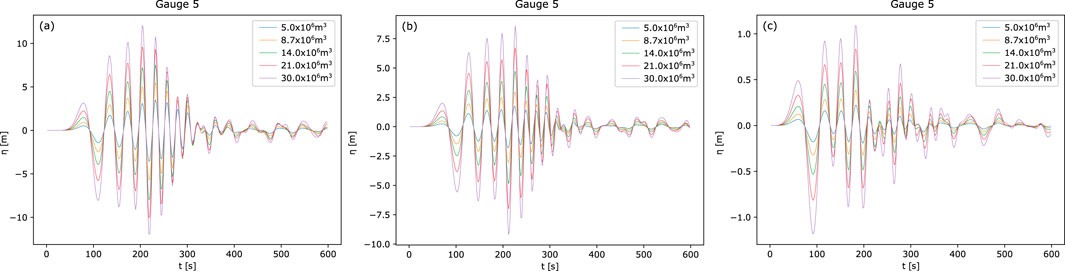
Figure 5. Waves generated by (a) subaerial (+328 m), (b) intermediate (−63 m) and (c) submarine (−375 m) mass movements at gauge 5 (offshore SdF), for volumes from 5 to 30
A leading crest characterizes waveforms from submarine landslides also at gauges 8 and 10. In this case, however, such feature is associated with complex reflection/refraction processes occurring close to the shoreline. Figures 6, 7 show the evolution of the waveforms close to the Stromboli (gauge 9) and Ginostra (gauge 10) villages. In all cases, the leading crest does not correspond to the maximum free surface elevation. Instead, it is followed by a negative trough and by a second, more elevated crest. In any case, the distinctive direct correlation between the maximum wave height and volume remains valid also at more distal locations.
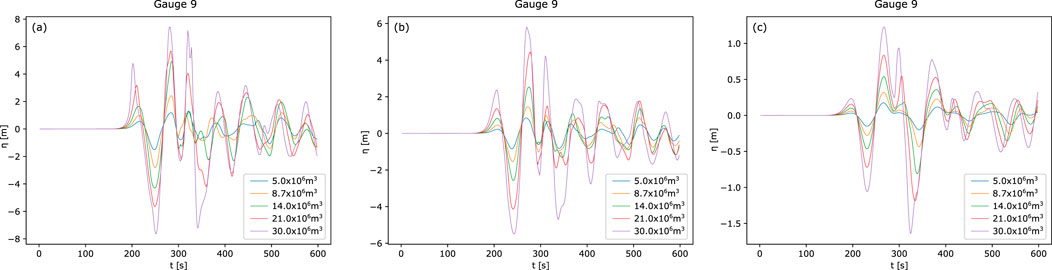
Figure 6. Waves generated by (a) subaerial (+328 m), (b) intermediate (−63 m) and (c) submarine (−375 m) mass movements at gauge 9 (Stromboli village shores), for volumes from 5 to 30
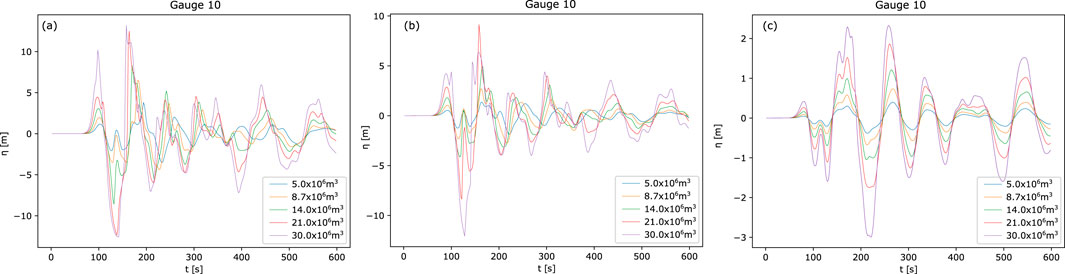
Figure 7. Waves generated by (a) subaerial (+328 m), (b) intermediate (−63 m) and (c) submarine (−375 m) mass movements at gauge 10 (Ginostra village shores), for volumes from 5 to 30
5.3 Granular mass elevation
In the analysis of the influence of the initial position of the granular mass, we distinguish between subaerial and submarine mass movements, and consider four subaerial and six submarine positions (Table 1). The two shallow submarine positions at −63 m and −180 m manifest intermediate behaviour, so we display the former in the subaerial and the latter in the submarine sets. Since we have already shown that the volume of the granular mass influences only the wave amplitude and to a lesser extent its shape, we here show the results for only one (intermediate) volume of 14
Figure 8 shows the waveforms at the proximal gauge 0 (Punta dei Corvi), for subaerial (a) and submarine (b) mass movements.
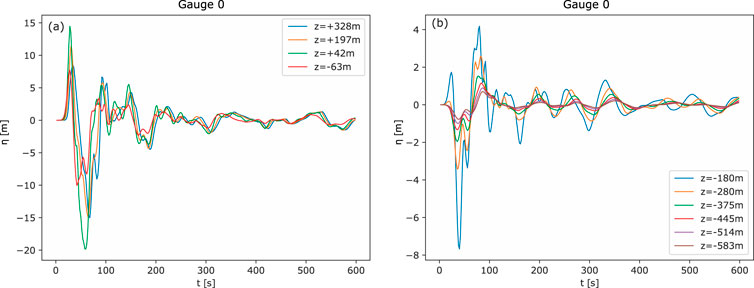
Figure 8. Waveforms generated by (a) subaerial, and (b) submarine mass movements of 14
For subaerial mass movements, the height of the first crest depends on the initial position, but counterintuitively, the largest one is associated with the lower subaerial positions. Inspection of the results reveals that this is due to the fast deformation of the granular mass, that elongates during the descent along the slope from the highest positions, thus reducing the rate of volume injection in the sea. Despite a remarkable difference in the first positive and negative peaks, the subsequent waveform is relatively insensitive to the initial position. Our findings are consistent with those of Fine et al. (2003) for granular slides. They showed that the highest amplitude occurs for slides initiated near the coastline, attributing this to a balance between the increased potential energy from higher initial positions and the enhanced deformation (stretching and spreading) of the slide that reduces the efficiency of energy transfer into the water column. For submarine mass movements, on the contrary, the largest maximum wave height is always associated with the shallowest ones, during the entire time series.
At medium-distal gauge 5 (5 km offshore SdF, Figure 9), the spectral differences are limited, as wave trains develop. For subaerial mass movements, the amplitude associated with lower position is about 25% larger than that associated with the highest position; the difference in the amplitude is more pronounced for submarine mass movements, with the highest waves associated with the shallowest ones.
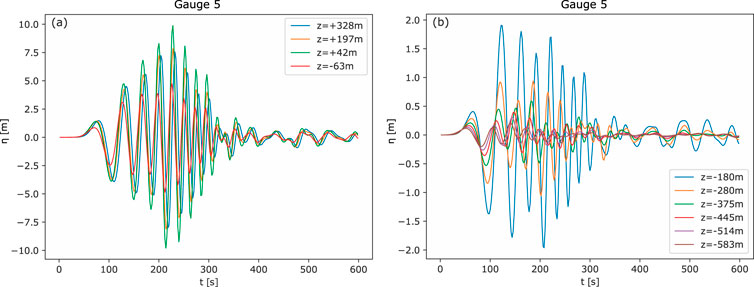
Figure 9. Waveforms generated by (a) subaerial, and (b) submarine mass movements of 14
Finally, Figure 10 displays the waveforms at gauge 9, close to the Stromboli harbour. For subaerial mass movements, the differences associated with the initial position are almost negligible, whereas, also in this case, waves generated by submarine mass movements have smaller amplitude for deeper sources.
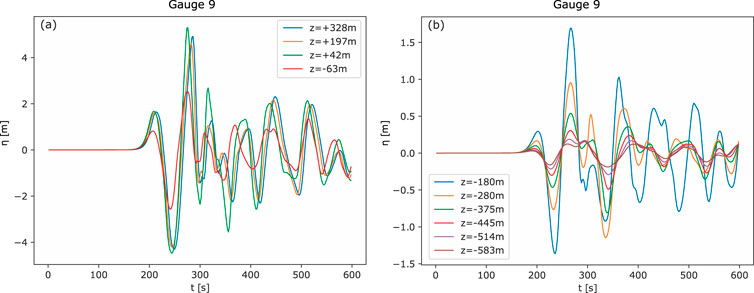
Figure 10. Waveforms generated by (a) subaerial, and (b) submarine mass movements of 14
5.4 Correlation between maximum wave height and granular flow volume
Figures 11a, b display the maximum wave height at proximal gauge 0 (Punta dei Corvi) and gauge 5 (offshore SdF), for the whole set of simulations (here limited to a density contrast of 0.5). Solid lines show the trends for subaerial, dashed lines for submarine mass movements. There is a direct correlation between volume and maximum wave height, but the trend is clearly nonlinear for subaerial conditions, with large variations associated with the initial position of the granular mass. For submarine mass movements, the variation is smaller, and the trends are more linear, but the limited number of points does not allow us to derive a more quantitative evaluation.
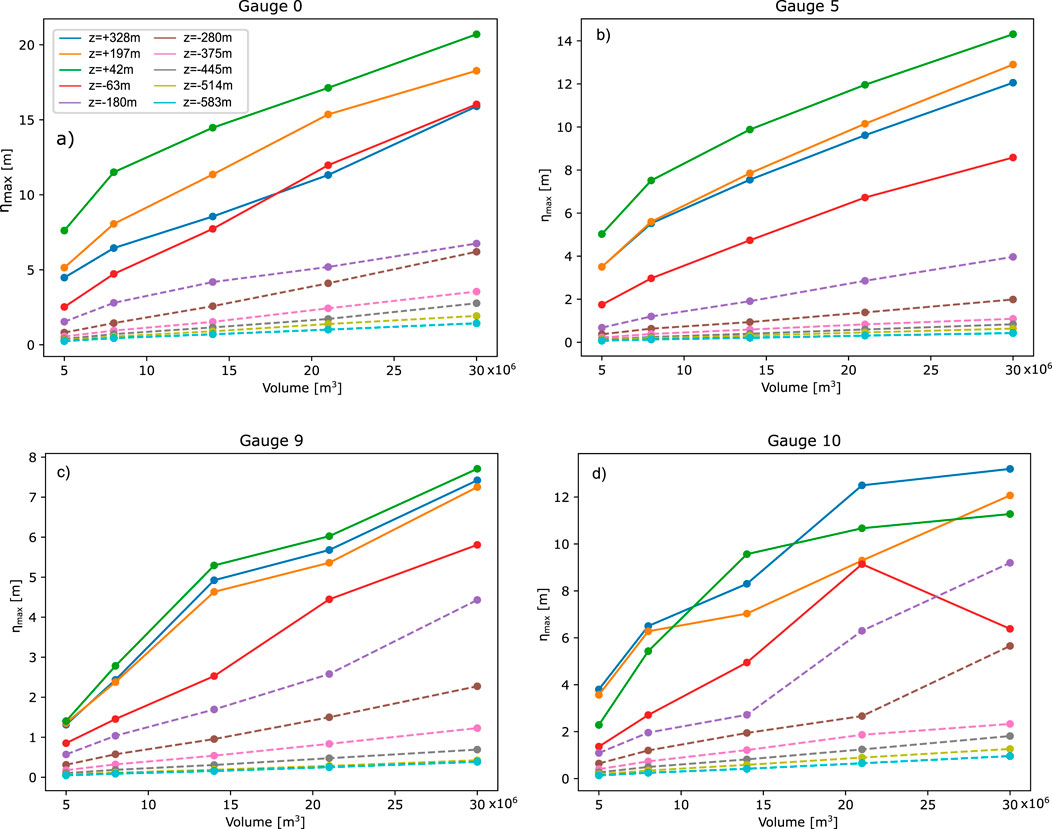
Figure 11. Maximum wave height at (a) gauge 0 (Punta dei Corvi), (b) gauge 5 (offshore SdF), (c) gauge 9 (Stromboli village) and (d) gauge 10 (Ginostra village), for volumes from 5 to 30
Figures 11c, d display the maximum wave height at gauge 9 (Stromboli village) and gauge 10 (Ginostra village). In this case, the trends are more irregular, and it is even more difficult to derive a simple correlation between volume and maximum wave height. Also, as already noted above, the differences between subaerial and submarine mass movements are less evident at these more distal locations around the island.
5.5 Arrival times
Maps of wave arrival times are produced by registering the time of the first crest, with a threshold of +1 cm. Figure 12 shows the arrival times for the whole Stromboli island of the tsunami generated by a subaerial (Position 1, +328 m) and submarine (Position 7, -375 m) mass movements, with volumes of 5 and 30
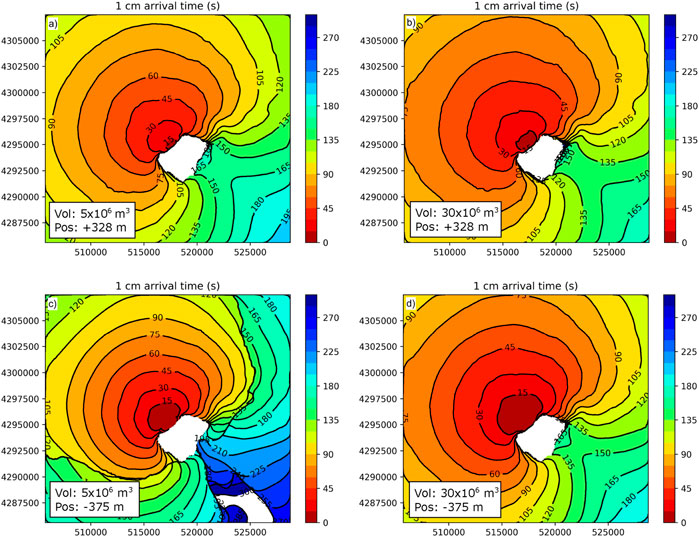
Figure 12. Arrival time (Stromboli island) of the first crest of the tsunami generated by (a, b) subaerial (Position 1, +328 m) and (c, d) submarine (Position 7, -375 m) mass movement for volumes of 5 (left) and 30 (right)
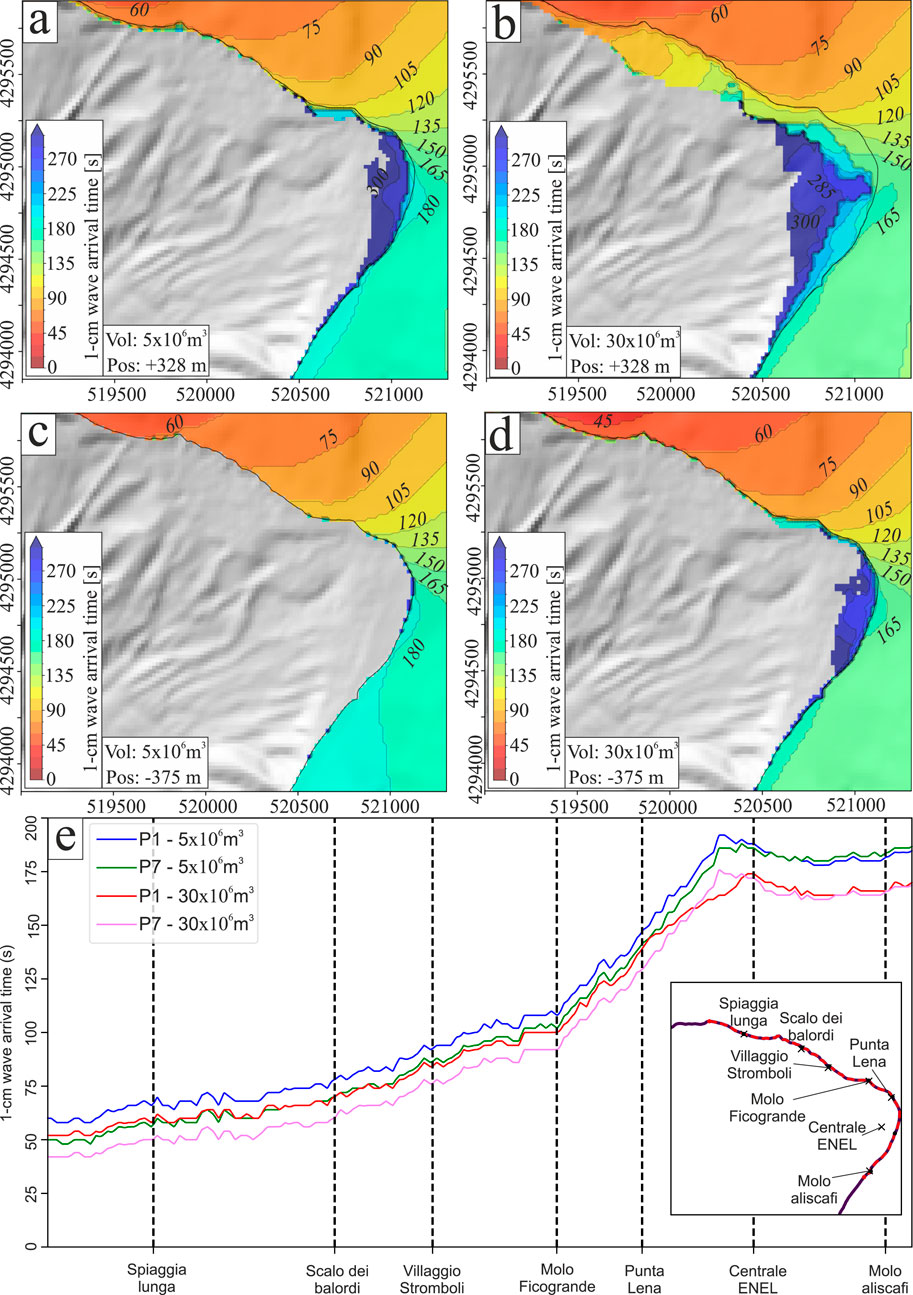
Figure 13. Arrival time (Stromboli village) of the first crest of the tsunami generated by a (a, b) subaerial (Position 1, +328 m) (c, d) and submarine (Position 7, -375 m) mass movement for volumes of 5 (left) and 30 (right)
5.6 Inundation maps
The inundation on land is mapped as the maximum water depth above the topography, reached during the whole simulation. Due to the steep slopes of the volcano, the main differences in the inundated area are observed on the North-Eastern part of the island, where the Stromboli village is located, and where there is also the highest exposure to the tsunami hazard.
In Figure 14 we show the inundation maps on the North-Eastern shores (corresponding to most of the inhabited part of the Stromboli village) for two subaerial (initial elevation of +328 and +42 m respectively) and two submarine scenarios (initial elevation of −180 and −375 m respectively), for three volumes of 5, 14 and 30
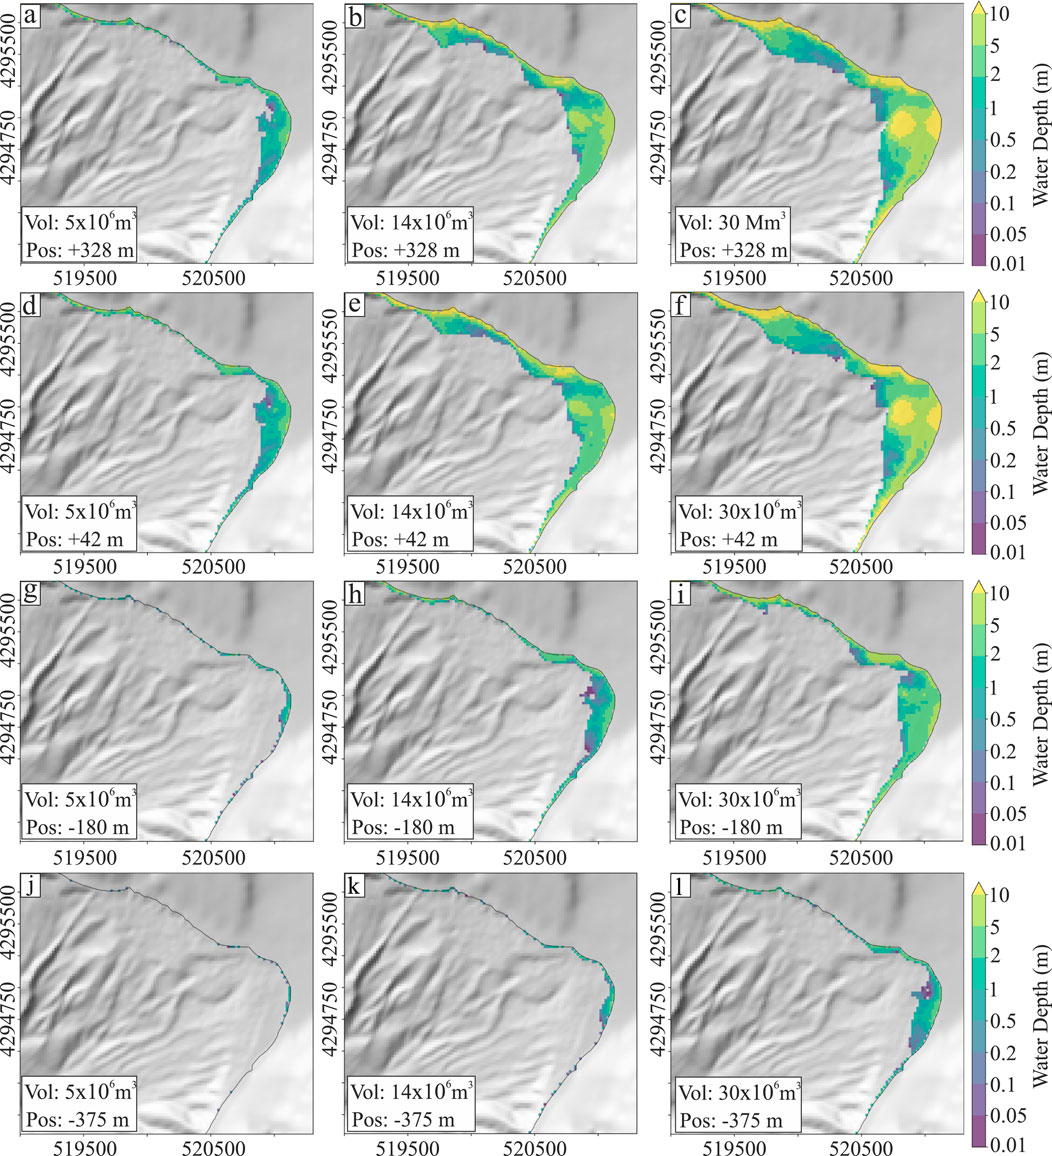
Figure 14. Inundation produced by a tsunami triggered by a subaerial or submarine mass movement for volumes 5, 14 and 30
6 Discussion
The results presented here illustrate some trends and features that can be recognized from a preliminary analysis of the whole set of simulations. The first observation concerns the difference between tsunami generated by subaerial and submarine mass movements. In this study, subaerial mass movements generated, in general, maximum wave heights 3–5 times larger than submarine ones of similar volume, with the variability depending on the initial granular mass position. The initial wave, as recorded by the two gauges near the shoreline (Figure 4), differs markedly between the subaerial and submarine cases. All subaerial mass movements generate a first crest (which is also the highest) followed by a trough of comparable amplitude, while submarine ones display an initial negative trough followed by a higher crest. Although semi-qualitative, these differences are observable for all volumes in the investigated range. Such a difference is progressively less visible at more distal locations, where tsunamis generated by submarine mass movements also develop a leading crest, both offshore and around the island (Figures 5–7). Around the island, waveforms from subaerial and submarine sources can be better superposed: theoretical and experimental studies suggest indeed that their dispersion relations depend less on initial conditions and are instead associated with a mechanism of trapping the wave around the island (Romano et al., 2013). Farther offshore, in the direction of mass movement propagation, wave trains develop due to the dispersive nature of water waves, with the highest wave typically not being the first (Okal and Synolakis, 2016). It is worth mentioning that such wave train do not develop using the single-layer, hydrostatic version of the model. Future work to analyse the spectral features of such wave trains, rather than the proximal waveforms, could provide insights into the volume of the generating mass movement and offer more reliable information for estimating the far field hazard from tsunami generated by mass movements at Stromboli.
There is a clear correlation between the maximum wave height and the granular volume involved (Figure 11). This is intuitively associated with the energy transfer from granular flows to the water column. However, this is a complex process, governed by the interplay of flow dynamics, material properties, and hydrodynamic interactions, for which it has been shown that the majority of energy transfer occurs rapidly near the moment of impact (Yavari-Ramshe and Ataie-Ashtiani, 2019; Clous and Abadie, 2019). Uncertainties in quantifying the proportion of the slide energy converted into water energy still exist. It is widely accepted that the volume, velocity and initial acceleration of the sliding mass are the controlling factors in tsunami generation (e.g., Løvholt et al., 2005; Harbitz et al., 2006; Huang et al., 2020; Robbe-Saule et al., 2021). The slide volume governs the total potential energy available for transfer, with larger volumes generally correlating with larger amplitudes. However, this relationship can be nonlinear, as dissipation through basal and internal friction, deformation (stretching and spreading) of the slide, and hydraulic effects (such as water entrainment) can reduce the efficiency of the energy transfer. These processes create an optimal initial elevation near the shorelines, where potential energy and dissipation reach a balance (Fine et al., 2003) that is also observed in our database. Velocity and initial acceleration further modulate energy transfer efficiency, and the Froude number (the ratio between the slide and wave speeds) is the critical dimensionless parameter determining the generation of surface waves (Fritz et al., 2004). Future studies will focus on linking wave amplitudes to landslide kinematics (Heller and Hager, 2010) or landslide material properties (Bougouin et al., 2020; Lipiejko et al., 2023) at Stromboli.
The correlation between landslide volume and maximum wave height is in general non-linear for subaerial mass movements, so it is difficult to extrapolate an empirical relationship from the analysis of our database. A study on flank collapses at La Montagne Pelée volcano observed a logarithmic relationship between volume and wave amplitude, while the wavelength increases with volume according to a power law (Poulain et al., 2023). However, it is also worth remarking that the maximum wave height might not be an optimal parameter to estimate the tsunami hazard. Other integral measures might give a better indication of the impact potential of the tsunami, such as the tsunami mechanical (i.e., potential plus kinetic) energy (Tinti and Bortolucci, 2000), for which an approximately log-log relationship is expected with the mass/volume (Zaniboni et al., 2020) or the mass flow (Bougouin et al., 2020; 2024). For submarine mass movements, the correlation is apparently more direct, but it depends strongly on the depth of the mass movements, potentially resulting in high uncertainties. Further work analyzing the relationship between granular flow parameters and wave characteristics is ongoing.
We have presented in Figure 14 maps of the expected inundation produced in the simulated scenarios. The uncertainty on inundation maps associated with the accuracy and numerical parameters of our simulation models is probably larger than the one affecting waveforms (Esposti Ongaro et al., 2021). In particular, while shoaling effects are explicitly resolved by the multilayer non-hydrostatic model, the following factors might affect the resulting inundation maps: 1) the spatial resolution of the topo-bathymetric model (e.g., Shigihara et al., 2022); 2) the water friction model, and in particular the water Manning coefficient (which is significant only for water thin layers) (Gibbons et al., 2022), as well as the friction between the granular and the water layers; 3) potentially, the lack of a subgrid model accounting for breaking of the waves and onset of turbulent flows in the shoaling process (Guignard et al., 1999; Kozelkov et al., 2022). Their effects should be investigated and quantified in the near future.
In all simulated scenarios, the parameters characterizing the landslide basal friction (Pouliquen-Forterre parameters) and the water friction (Manning parameter) have been kept constant. The preliminary sensitivity analysis introduced in Sect. Four and presented in the Supporting Information shows that the variability associated with rheological parameters is comparable with that associated with the scenario parameters (volume and initial position of the granular mass). For this reason we chosed to adopt a conservative approach, and to use the values of the friction angles in the lowest range (consistent with literature data). Future studies should address this aspect systematically, with a more detailed rheological characterization of the expected mass movements at Stromboli (accounting for the substantial diversity between, e.g., landslides and pyroclastic avalanches).
Finally, in this paper we have considered an initial ellipsoidal pile of grains with zero initial velocity, imposed on the pre-existing topography. Such an initial shape is not completely realistic, and in a future paper we will analyze the influence of generating the mass movement from a granular volume excavated from the actual topography, or with an initial non-zero velocity.
7 Conclusion
We have produced a set of numerical simulations of subaerial and submarine granular mass movements along the Sciara del Fuoco slope on the Stromboli volcano, to assess their capability to generate tsunami and the consequent physical features and potential impact of the waves on the Stromboli coastline. The results are consistent with the observations and numerical simulations of the 2002 event at Stromboli (Esposti Ongaro et al., 2021; Fornaciai et al., 2019), but the analyzed range of variability of the input conditions is much larger. In selecting the parameters characterizing these scenarios, we have identified the most relevant initial parameters characterizing the scenarios (the initial granular volume, its position along the Sciara del Fuoco, its density), and tried to perform a preliminary evaluation of the sensitivity of the results to the other parameters. Inevitably, the uncertainty in these parameters is high, and evaluating it in a probabilistic framework will be a mandatory task for future works. The ensemble of scenarios is relatively large (150 scenarios) and allows us to preliminarily observe some significant trends correlating the initial conditions (granular volume and position) with the tsunami features, in particular the maximum wave height and the shape of the waves. Such information is of paramount importance to try to assess tsunami hazards in Stromboli in a quantitative way.
For the purpose of assessing the tsunami hazard on the Stromboli island, it was already noticed by Fornaciai et al. (2019) that the arrival time of the tsunami generated on the SdF on the island shores is very short: in all simulated cases (Figures 12, 13e), the tsunami reaches the Stromboli village in less than 4 minutes (about two and a half minutes in the worst cases) and the Ginostra village in about 1 minute. For this reason, tsunami early warning for the Stromboli island would require the early recognition of the triggering mass movements and the early detection of the tsunami close to the SdF. The simulation of the proximal waveforms (plotted in Figure 4) can help characterizing the expected signals at the measuring beacons installed offshore the Sciara del Fuoco. In particular, the observation that the waveform measured at points close to the shoreline does not initially depend on the granular mass volume implies that dispersive effects are not dominant at these distances, so that spectral properties of the tsunami can be used as a robust indicator in tsunami early warning systems (Lacanna and Ripepe, 2020; Ripepe and Lacanna, 2024).
Finally, the information provided by such a set of scenarios (Cerminara et al., 2024) has been recently used by Bonilauri et al. (2024) to evaluate and quantify the effectiveness of potential risk mitigation by means of evacuation on the island of Stromboli. Ongoing effort is dedicated to use expert elicitation tools (de’Michieli Vitturi et al., 2024; Tadini et al., 2024) to attribute probabilities to volume and initial position ranges utilized in this work, to combine all scenarios into a probabilistic tsunami inundation hazard map for Stromboli. This work is part of the continuous effort to mitigate volcanic and tsunami risk on the island of Stromboli.
Data availability statement
The datasets generated and analyzed for this study can be found and freely downloaded from (Cerminara et al., 2024).
Author contributions
TE: Conceptualization, Data curation, Formal Analysis, Funding acquisition, Methodology, Project administration, Supervision, Visualization, Writing – original draft, Writing – review and editing, Investigation, Resources. MC: Data curation, Formal Analysis, Investigation, Software, Supervision, Writing – original draft, Writing – review and editing, Validation. MM: Conceptualization, Formal Analysis, Funding acquisition, Investigation, Methodology, Project administration, Software, Supervision, Visualization, Writing – original draft, Writing – review and editing. AT: Investigation, Visualization, Writing – original draft, Writing – review and editing. MT: Formal Analysis, Investigation, Visualization, Writing – original draft, Writing – review and editing. AF: Data curation, Writing – original draft, Writing – review and editing. LN: Data curation, Writing – original draft, Writing – review and editing. BC: Investigation, Software, Writing – original draft, Writing – review and editing. JM: Conceptualization, Funding acquisition, Methodology, Supervision, Validation, Writing – original draft, Writing – review and editing. MC: Methodology, Software, Validation, Writing – original draft, Writing – review and editing. CE: Software, Validation, Writing – original draft, Writing – review and editing. SO: Funding acquisition, Project administration, Supervision, Writing – original draft, Writing – review and editing. JG-V: Funding acquisition, Project administration, Supervision, Writing – original draft, Writing – review and editing. JR-G: Investigation, Software, Validation, Visualization, Writing – original draft, Writing – review and editing.
Funding
The author(s) declare that financial support was received for the research and/or publication of this article. This work has been produced within the 2012–2021 agreement between Istituto Nazionale di Geofisica e Vulcanologia (INGV) and the Italian Presidenza del Consiglio dei Ministri, Dipartimento della Protezione Civile (DPC), Convenzione B2, Ob. 5 Task 4 (2017), Ob. 4 Task 4 (2018) and WP2 Task 12 (2019-2021). The new versions of the HySEA codes used here has been developed in the framework of ChEESE-2P project (https://cheese2.eu/) funded by the European Union (European High Performance Computing Joint Undertaking (JU) and Spain, Italy, Iceland, Germany, Norway, France, Finland and Croatia under grant agreement No 101093038). This research has also been partially funded by MCIN/AEI/10.13039/501100011033 and by the “European Union NextGenerationEU/PRTR” through the Grant PDC 2022-133663-C21 and by MCIN/AEI/10.13039/50110001103 and by “ERDF A way of making Europe,” by the European Union through the Grant PID 2022-137637NB-C21.
Acknowledgments
The authors would like to acknowledge Civil Protection colleagues, and in particular Domenico Mangione, for the continous support in the conception and realization of the project, and the former Director of the INGV Department of Volcanoes, Augusto Neri, for supporting and promoting the activities in the framework of the INGV-DPC agreement.
Conflict of interest
The authors declare that the research was conducted in the absence of any commercial or financial relationships that could be construed as a potential conflict of interest.
Generative AI statement
The author(s) declare that no Generative AI was used in the creation of this manuscript.
Publisher’s note
All claims expressed in this article are solely those of the authors and do not necessarily represent those of their affiliated organizations, or those of the publisher, the editors and the reviewers. Any product that may be evaluated in this article, or claim that may be made by its manufacturer, is not guaranteed or endorsed by the publisher.
Supplementary material
The Supplementary Material for this article can be found online at: https://www.frontiersin.org/articles/10.3389/feart.2025.1548961/full#supplementary-material
References
Apuani, T., Corazzato, C., Cancelli, A., and Tibaldi, A. (2005). Stability of a collapsing volcano (Stromboli, Italy): limit equilibrium analysis and numerical modelling. J. Volcanol. Geotherm. Res. 144, 191–210. doi:10.1016/j.jvolgeores.2004.11.028jvolgeores.2004.11.028
Barberi, F., Rosi, M., and Sodi, A. (1993). Volcanic hazard assessment at Stromboli based on review of historical data. Acta Vulcanol., 173–187.
Bevilacqua, A., Bertagnini, A., Pompilio, M., Landi, P., Del Carlo, P., Di Roberto, A., et al. (2020b). Major explosions and paroxysms at Stromboli (Italy): a new historical catalog and temporal models of occurrence with uncertainty quantification. Sci. Rep. 10, 17357. doi:10.1038/s41598-020-74301-8s41598-020-74301-8
Bevilacqua, A., Bertagnini, A., Pompilio, M., Landi, P., Del Carlo, P., D Roberto, A., et al. (2020a). Historical catalog of major explosions and paroxysms at Stromboli (Italy). doi:10.13127/STROMBOLI/STRCATALOG
Bonaccorso, A., Calvari, S., Garfì, G., Lodato, L., and Patanè, D. (2003). Dynamics of the December 2002 flank failure and tsunami at Stromboli volcano inferred by volcanological and geophysical observations. Geophys. Res. Lett. 30. doi:10.1029/2003GL017702
Bonilauri, E. M., Aaron, C., Cerminara, M., Paris, R., Esposti Ongaro, T., Calusi, B., et al. (2024). Inundation and evacuation of shoreline populations during landslide-triggered tsunami: an integrated numerical and statistical hazard assessment. EGUsphere 2024, 1–36. doi:10.5194/egusphere-2024-221
Bougouin, A., Paris, R., and Roche, O. (2020). Impact of fluidized granular flows into water: implications for tsunamis generated by pyroclastic flows. J. Geophys. Res. Sol. Ea. 125, 319–417. doi:10.1029/2019JB018954
Bougouin, A., Paris, R., Roche, O., Siavelis, M., and Pawlak Courdavault, A. (2024). Tsunamis generated by pyroclastic flows: experimental insights into the effect of the bulk flow density. Bull. Volcanol. 86, 35. doi:10.1007/s00445-024-01704-0
Brunet, M., Moretti, L., Le Friant, A., Mangeney, A., Fernández Nieto, E. D., and Bouchut, F. (2017). Numerical simulation of the 30–45 ka debris avalanche flow of Montagne Pelée volcano, Martinique: from volcano flank collapse to submarine emplacement. Nat. Hazards 87, 1189–1222. doi:10.1007/s11069-017-2815-5
Calvari, S., Di Traglia, F., Ganci, G., Bruno, V., Ciancitto, F., Di Lieto, B., et al. (2022). Multi-parametric study of an eruptive phase comprising unrest, major explosions, crater failure, pyroclastic density currents and lava flows: stromboli volcano, 1 december 2020–30 june 2021. Front. Earth Sci. 10, 899635. doi:10.3389/feart.2022.899635
Calvari, S., Di Traglia, F., Ganci, G., Giudicepietro, F., Macedonio, G., Cappello, A., et al. (2020). Overflows and pyroclastic density currents in march-april 2020 at Stromboli volcano detected by remote sensing and seismic monitoring data. Remote Sens. 12, 3010. doi:10.3390/rs12183010rs12183010
Casalbore, D., Passeri, F., Tommasi, P., Verrucci, L., Bosman, A., Romagnoli, C., et al. (2020). Small-scale slope instability on the submarine flanks of insular volcanoes: the case-study of the Sciara del Fuoco slope (Stromboli). Int. J. Earth Sci. 109, 2643–2658. doi:10.1007/s00531-020-01853-5
Casalbore, D., Romagnoli, C., Bosman, A., and Chiocci, F. L. (2011). Potential tsunamigenic landslides at Stromboli Volcano (Italy): insight from marine DEM analysis. Geomorphology 126, 42–50. doi:10.1016/j.geomorph.2010.10.026026
Castro, M., and Fernández-Nieto, E. (2012). A class of computationally fast first order finite volume solvers: PVM methods. SIAM J. Sci. Comput. 34, A2173–A2196. doi:10.1137/100795280
Cecioni, C., and Bellotti, G. (2010). Inclusion of landslide tsunamis generation into a depth integrated wave model. Nat. Hazards Earth Syst. Sci. 10, 2259–2268. doi:10.5194/nhess-10-2259-2010nhess-10-2259-2010
Chiocci, F. L., Romagnoli, C., Tommasi, P., and Bosman, A. (2008). The Stromboli 2002 tsunamigenic submarine slide: characteristics and possible failure mechanisms. J. Geophys. Res. 113, 173–211. doi:10.1029/2007JB005172
Chorin, A. J. (1968). Numerical solution of the Navier-Stokes equations. Math. Comput. 22, 745–762. doi:10.1090/S0025-5718-1968-0242392-2
Clous, L., and Abadie, S. (2019). Simulation of energy transfers in waves generated by granular slides. Landslides 16, 1663–1679. doi:10.1007/s10346-019-01180-0
[Dataset] Cerminara, M., Esposti Ongaro, T., de’ Michieli Vitturi, M., Tadini, A., Trolese, M., Fornaciai, A., et al. (2024). Simulated scenarios of volcanic mass movements and associated tsunamis at Stromboli (Aeolian archipelago, Tyrrhenian sea, Italy). Version 1. doi:10.13127/stromboli/sciara_del_fuoco_tsunami
de’Michieli Vitturi, M., Bevilacqua, A., Tadini, A., and Neri, A. (2024). Elicipy 1.0: a python online tool for expert elicitation. SoftwareX 25, 101641. doi:10.1016/j.softx.2024.101641
Dipartimento della Protezione Civile (2015). Isola di Stromboli, Piano nazionale di emergenza a fronte di eventi vulcanici di rilevanza nazionale. Tech. Rep. Pres. del Consiglio dei Minist. (Italy). Available online at: https://rischi.protezionecivile.gov.it/static/3b89029643532bdb10a49064c0504cc5/pianonazionalestromboli2015.pdf.
Di Roberto, A., Bertagnini, A., Pompilio, M., and Bisson, M. (2014). Pyroclastic density currents at Stromboli volcano (Aeolian Islands, Italy): a case study of the 1930 eruption. Bull. Volcanol. 76, 827. doi:10.1007/s00445-014-0827-5
Di Traglia, F., Borselli, L., Nolesini, T., and Casagli, N. (2023a). Crater-rim collapse at stromboli volcano: understanding the mechanisms leading from the failure of hot rocks to the development of glowing avalanches. Nat. Hazards 115, 2051–2068. doi:10.1007/s11069-022-05626-y
Di Traglia, F., Calvari, S., Borselli, L., Cassanego, L., Giudicepietro, F., Macedonio, G., et al. (2023b). Assessing flank instability of stromboli volcano (Italy) by reappraising the 30 december 2002 tsunamigenic landslides. Landslides 20, 1363–1380. doi:10.1007/s10346-023-02043-5
Escalante, C., de Luna, T. M., and Castro, M. J. (2018). Non-hydrostatic pressure shallow flows: GPU implementation using finite volume and finite difference scheme. Appl. Math. Comput. 338, 631–659. doi:10.1016/j.amc.2018.06.035
Escalante, C., Fernández-Nieto, E. D., de Luna, T. M., and Castro, M. J. (2019). An efficient two-layer non-hydrostatic approach for dispersive water waves. J. Sci. Comput. 79, 73–320. doi:10.1007/s10915-018-0849-9
Esposti Ongaro, T., de’ Michieli Vitturi, M., Cerminara, M., Fornaciai, A., Nannipieri, L., Favalli, M., et al. (2021). Modeling tsunamis generated by submarine landslides at Stromboli volcano (aeolian islands, Italy): a numerical benchmark study. Front. Earth Sci. 9, 1–21. doi:10.3389/feart.2021.628652feart.2021.628652
Fernández-Nieto, E. D., Parisot, M., Penel, Y., and Sainte-Marie, J. (2018). A hierarchy of dispersive layer-averaged approximations of euler equations for free surface flows. Commun. Math. Sci. 16, 1169–1202. doi:10.4310/CMS.2018.v16.n5.a1
Fine, I. V., Rabinovich, A. B., Thomson, R. E., and Kulikov, E. A. (2003). “Numerical modeling of tsunami generation by submarine and subaerial landslides,” in Submarine landslides and tsunamis. Editors A. C. Yalçiner, E. N. Pelinovsky, E. Okal, and C. E. Synolakis (Dordrecht: Springer). doi:10.1007/978-94-010-0205-9_9
Fornaciai, A., Favalli, M., and Nannipieri, L. (2019). Numerical simulation of the tsunamis generated by the Sciara del Fuoco landslides (Stromboli Island, Italy). Sci. Rep. 9, 18542–12doi. doi:10.1038/s41598-019-54949-7
Fritz, H. M., Hager, W. H., and Minor, H. E. (2004). Near field characteristics of landslide generated impulse waves. J. Waterw. Port. Coast. Ocean. Eng. 130, 287–302. doi:10.1061/(ASCE)0733-950X(2004)130:6(287)
Gibbons, S. J., Lorito, S., de la Asunción, M., Volpe, M., Selva, J., Macías, J., et al. (2022). The sensitivity of tsunami impact to earthquake source parameters and Manning friction in high-resolution inundation simulations. Front. Earth Sci. 9, 757618. doi:10.3389/feart.2021.757618
Giordano, G., and De Astis, G. (2020). The summer 2019 basaltic Vulcanian eruptions (paroxysms) of Stromboli. Bull. Volcanol. 83, 1–27doi. doi:10.1007/s00445-020-01423-2
Giudicepietro, F., Calvari, S., De Cesare, W., Di Lieto, B., Di Traglia, F., Esposito, A. M., et al. (2023). Seismic and thermal precursors of crater collapses and overflows at stromboli volcano. Sci. Rep. 13, 11115. doi:10.1038/s41598-023-38205-7
Grilli, S. T., Tappin, D. R., Carey, S., Watt, S. F. L., Ward, S. N., Grilli, A. R., et al. (2019). Modelling of the tsunami from the december 22, 2018 lateral collapse of anak krakatau volcano in the sunda straits, Indonesia. Sci. Rep. 9, 11946–13doi. doi:10.1038/s41598-019-48327-6
Guignard, S., Grilli, S. T., Marcer, R., and Rey, V. (1999). “Computation of shoaling and breaking waves in nearshore areas by the coupling of bem and vof methods,” in ISOPE international Ocean and polar engineering conference (ISOPE), isope–I.
Harbitz, C. B., Løvholt, F., Pedersen, G. K., and Masson, D. G. (2006). Mechanisms of tsunami generation by submarine landslides: a short review. Norw. J. Geol. 86, 255–264.
Heller, V., and Hager, W. H. (2010). Impulse product parameter in landslide generated impulse waves. J. Waterw. Port, Coast. Ocean Eng. 136, 145–155. doi:10.1061/(ASCE)WW.1943-5460.0000037
Huang, B., Zhang, Q., Wang, J., Luo, C., Chen, X., and Chen, L. (2020). Experimental study on impulse waves generated by gravitational collapse of rectangular granular piles. Phys. Fluids 32, 033301. doi:10.1063/1.5138709
Jop, P., Forterre, Y., and Pouliquen, O. (2006). A constitutive law for dense granular flows. Nature 441, 727–730. doi:10.1038/nature04801
Kirby, J., Grilli, S., Zhang, C., Horrillo, J., Nicolsky, D., and Liu, P. (2018). The NTHMP landslide tsunami benchmark workshop, Galveston. Tech. Rep. Available online at: https://www1.udel.edu/kirby/landslide/report/kirby-etal-cacr-18-01.pdf.
Kozelkov, A., Tyatyushkina, E., Kurulin, V., and Kurkin, A. (2022). Influence of turbulence effects on the runup of tsunami waves on the shore within the framework of the Navier–Stokes equations. Fluids 7, 117. doi:10.3390/fluids7030117
Lacanna, G., and Ripepe, M. (2020). “Genesis of tsunami waves generated by pyroclastic flows and the early-warning system,” in Rittmann Conference 2020, Session S13. The summer 2019 Stromboli paroxysms:a precious opportunity to expand the knowledge on the volcano.
Lipiejko, N., Whittaker, C. N., Lane, E. M., and Power, W. L. (2023). Wave generation by fluidized granular flows: experimental insights into the maximum near-field wave amplitude. J. Geophys. Res. Oceans 128, e2022JC019583. doi:10.1029/2022JC019583
Løvholt, F., Harbitz, C. B., and Haugen, K. B. (2005). A parametric study of tsunamis generated by submarine slides in the Ormen Lange/Storegga area off western Norway. Mar. Petrol. Geol. 22, 219–231. doi:10.1016/b978-0-08-044694-3.50023-82004.10.017
Macías, J., Escalante, C., and Castro, M. J. (2021a). Multilayer-hysea model validation for landslide-generated tsunamis – part 1: rigid slides. Nat. Hazards Earth Syst. Sci. 21, 775–789. doi:10.5194/nhess-21-775-2021nhess-21-775-2021
Macías, J., Escalante, C., and Castro, M. J. (2021b). Multilayer-hysea model validation for landslide-generated tsunamis – part 2: granular slides. Nat. Hazards Earth Syst. Sci. 21, 791–805. doi:10.5194/nhess-21-791-2021nhess-21-791-2021
Maramai, A., Graziani, L., Alessio, G., Burrato, P., Colini, L., Cucci, L., et al. (2005a). Near- and far-field survey report of the 30 December 2002 Stromboli (Southern Italy) tsunami. Mar. Geol. 215, 93–106. doi:10.1016/j.margeo.2004.11.009
Maramai, A., Graziani, L., and Tinti, S. (2005b). Tsunamis in the aeolian islands (southern Italy): a review. Mar. Geol. 215, 11–21. doi:10.1016/j.margeo.2004.03.018
Marani, M. P., Gamberi, F., Rosi, M., Bertagnini, A., and di Roberto, A. (2008). Subaqueous density flow processes and deposits of an island volcano landslide (Stromboli Island, Italy). Sedimentology 56, 1488–1504. doi:10.1111/j.1365-3091.2008.01043.x1365-3091.2008.01043.x
Marsella, M., Proietti, C., Sonnessa, A., Coltelli, M., Tommasi, P., and Bernardo, E. (2009). The evolution of the Sciara del Fuoco subaerial slope during the 2007 Stromboli eruption: Relation between deformation processes and effusive activity. J. Volcanol. Geotherm. Res. 182, 201–213. doi:10.1016/j.jvolgeores.2009.02.002
Murty, T. S. (2003). Tsunami wave height dependence on landslide volume. Pure Appl. Geophys. 160, 2147–2153. doi:10.1007/s00024-003-2423-z
Nolesini, T., Di Traglia, F., Del Ventisette, C., Moretti, S., and Casagli, N. (2013). Deformations and slope instability on stromboli volcano: integration of gbinsar data and analog modeling. Geomorphology 180-181, 242–254. doi:10.1016/j.geomorph.2012.10.014geomorph.2012.10.014
Okal, E. A., and Synolakis, C. E. (2016). Sequencing of tsunami waves: why the first wave is not always the largest. Geophys. J. Int. 204, 719–735. doi:10.1093/gji/ggv457
Pistolesi, M., Bertagnini, A., di Roberto, A., Ripepe, M., and Rosi, M. (2020). Tsunami and tephra deposits record interactions between past eruptive activity and landslides at Stromboli volcano, Italy. Geology 48, 436–440. doi:10.1130/g47331.11
Pistolesi, M., Rosi, M., Pioli, L., Renzulli, A., Bertagnini, A., Andronico, D., et al. (2008). “The paroxysmal event and its deposits,” in The Stromboli Volcano: an integrated study of the 2002–2003 eruption. Editors S. Calvari, S. Inguaggiato, G. Puglisi, M. Ripepe, and M. Rosi (American Geophysical Union), Geophysical Monograph Series).
Poulain, P., Le Friant, A., Mangeney, A., Viroulet, S., Fernández-Nieto, E., Castro Diaz, M., et al. (2023). Performance and limits of a shallow-water model for landslide-generated tsunamis: from laboratory experiments to simulations of flank collapses at montagne pel´ ee (Martinique). Geophys. J. Int. 233, 796–825. doi:10.1093/gji/ggac482
Pouliquen, O., and Forterre, Y. (2002). Friction law for dense granular flows: application to the motion of a mass down a rough inclined plane. J. Fluid Mech. 453, 133–151. doi:10.1017/S0022112001006796
Ripepe, M., and Lacanna, G. (2024). Volcano generated tsunami recorded in the near source. Nat. Commun. 15, 1802. doi:10.1038/s41467-024-45937-1
Robbe-Saule, M., Morize, C., Henaff, R., Bertho, Y., Sauret, A., and Gondret, P. (2021). Experimental investigation of tsunami waves generated by granular collapse into water. J. Fluid Mech. 907, A11. doi:10.1017/jfm.2020.807807
Romagnoli, C., Kokelaar, P., Casalbore, D., and Chiocci, F. L. (2009). Lateral collapses and active sedimentary processes on the northwestern flank of Stromboli volcano, Italy. Mar. Geol. 265, 101–119. doi:10.1016/j.margeo.2009.06.01306.013
Romano, A., Bellotti, G., and Di Risio, M. (2013). Wavenumber–frequency analysis of the landslide-generated tsunamis at a conical island. Coast. Eng. 81, 32–43. doi:10.1016/j.coastaleng.2013.06.0071016/j.coastaleng.2013.06.007
Rosi, M., Bertagnini, A., and Landi, P. (2000). Onset of the persistent activity at Stromboli volcano (Italy). Bull. Volcanol. 62, 294–300. doi:10.1007/s004450000098
Rosi, M., Levi, S. T., Pistolesi, M., Bertagnini, A., Brunelli, D., Cannavò, V., et al. (2019). Geoarchaeological evidence of middle-age tsunamis at stromboli and consequences for the tsunami hazard in the southern tyrrhenian sea. Sci. Rep. 9, 677. doi:10.1038/s41598-018-37050-3
Rosi, M., Pistolesi, M., Bertagnini, A., Landi, P., Pompilio, M., and Di Roberto, A. (2013). Chapter 14 Stromboli volcano, Aeolian Islands (Italy): present eruptive activity and hazards. Geol. Soc. Lon. Mem. 37, 473–490. doi:10.1144/m37.14M37.14
Savage, S. B., and Hutter, K. (1989). The motion of a finite mass of granular material down a rough incline. J. Fluid Mech. 199, 177–215. doi:10.1017/s0022112089000340
Schindelé, F., Kong, L., Lane, E. M., Paris, R., Ripepe, M., Titov, V., et al. (2024). A review of tsunamis generated by volcanoes (tgv) source mechanism, modelling, monitoring and warning systems. Pure Appl. Geophys., 1–48. doi:10.1007/s00024-024-03515-y
Selva, J., Amato, A., Armigliato, A., Basili, R., Bernardi, F., Brizuela, B., et al. (2021). Tsunami risk management for crustal earthquakes and non-seismic sources in Italy. La Riv. del Nuovo Cim. 44, 69–144. doi:10.1007/s40766-021-00016-9
Shigihara, Y., Imai, K., Iwase, H., Kawasaki, K., Nemoto, M., Baba, T., et al. (2022). Variation analysis of multiple tsunami inundation models. Coast. Eng. J. 64, 344–371. doi:10.1080/21664250.2021.1991730
Tadini, A., de’ Michieli Vitturi, M., Bevilacqua, A., Neri, A., Esposti Ongaro, T., Cerminara, M., et al. (2024). The ELICIPY expert elicitation tool applied to tsunami hazard assessment at Stromboli volcano. In Advancement in reliability, safety and security - esrel 2024. Available online at: https://esrel2024.com/wp-content/uploads/articles/ea1/the-elicipy-expert-elicitation-tool-applied-to-tsunami-hazard-assessment-at-stromboli-volcano.pdf
Tibaldi, A. (2001). Multiple sector collapses at stromboli volcano, Italy: how they work. Bull. Volcanol. 63, 112–125. doi:10.1007/s004450100129
Tinti, S., and Bortolucci, E. (2000). Energy of water waves induced by submarine landslides. Pure Appl. Geophys. 157, 281–318. doi:10.1007/s000240050001
Tinti, S., Bortolucci, E., and Romagnoli, C. (2000). Computer simulations of tsunamis due to sector collapse at Stromboli, Italy. J. Volcanol. Geoth. Res. 96, 103–128. doi:10.1016/S0377-0273(99)00138-9
Tinti, S., Maramai, A., Armigliato, A., Graziani, L., Manucci, A., Pagnoni, G., et al. (2005). Observations of physical effects from tsunamis of December 30, 2002 at Stromboli volcano, southern Italy. Bull. Volcanol. 68, 450–461. doi:10.1007/s00445-005-0021-x
Tinti, S., Pagnoni, G., and Zaniboni, F. (2006). The landslides and tsunamis of the 30th of December 2002 in Stromboli analysed through numerical simulations. Bull. Volcanol. 68, 462–479. doi:10.1007/s00445-005-0022-9
Tinti, S., Zaniboni, F., Pagnoni, G., and Manucci, A. (2008). Stromboli island (Italy): scenarios of tsunamis generated by submarine landslides. Pure Appl. Geophys. 165, 2143–2167. doi:10.1007/s00024-008-0420-y
Turchi, A., Di Traglia, F., Gentile, R., Fornaciai, A., Zetti, I., and Fanti, R. (2022). Relative seismic and tsunami risk assessment for Stromboli Island (Italy). Int. J. Disaster Risk Reduct. 76, 103002. doi:10.1016/j.ijdrr.2022.103002
Yavari-Ramshe, S., and Ataie-Ashtiani, B. (2016). Numerical modeling of subaerial and submarine landslide-generated tsunami waves—recent advances and future challenges. Landslides 13, 1325–1368. doi:10.1007/s10346-016-0734-2
Yavari-Ramshe, S., and Ataie-Ashtiani, B. (2019). On the effects of landslide deformability and initial submergence on landslide-generated waves. Landslides 16, 37–53. doi:10.1007/s10346-018-1061-6s10346-018-1061-6
Keywords: stromboli volcano, volcanic mass movements, tsunami, multilayer depth-averaged model, non-hydrostatic model, inundation, hazard assessment, volcanic islands
Citation: Esposti Ongaro T, Cerminara M, de’ Michieli Vitturi M, Tadini A, Trolese M, Fornaciai A, Nannipieri L, Calusi B, Macías J, Castro MJ, Escalante C, Ortega S, González-Vida JM and Rodríguez-Gálvez JF (2025) Modeling and simulation of volcanic mass movements and induced tsunamis at Stromboli volcano (Aeolian archipelago, Tyrrhenian sea, Italy). Front. Earth Sci. 13:1548961. doi: 10.3389/feart.2025.1548961
Received: 20 December 2024; Accepted: 24 March 2025;
Published: 22 April 2025.
Edited by:
Chong Xu, Ministry of Emergency Management, ChinaReviewed by:
William Power, GNS Science, New ZealandNatalia Lipiejko, Lancaster University, United Kingdom
Philippe Heinrich, Commissariat à l'Energie Atomique et aux Energies Alternatives (CEA), France
Copyright © 2025 Esposti Ongaro, Cerminara, de’ Michieli Vitturi, Tadini, Trolese, Fornaciai, Nannipieri, Calusi, Macías, Castro, Escalante, Ortega, González-Vida and Rodríguez-Gálvez. This is an open-access article distributed under the terms of the Creative Commons Attribution License (CC BY). The use, distribution or reproduction in other forums is permitted, provided the original author(s) and the copyright owner(s) are credited and that the original publication in this journal is cited, in accordance with accepted academic practice. No use, distribution or reproduction is permitted which does not comply with these terms.
*Correspondence: Tomaso Esposti Ongaro, dG9tYXNvLmVzcG9zdGlvbmdhcm9AaW5ndi5pdA==