 Zheng Kong
 Xuyang Chen
 Xufeng Wang1
 Liang Chen
- 1School of Mines, China University of Mining and Technology, Xuzhou, China
- 2State Key Laboratory for Fine Exploration and Intelligent Development of Coal Resources, China University of Mining and Technology, Xuzhou, China
- 3School of Architectural Construction, Jiangsu Vocational Institute of Architectural Technology, Xuzhou, China
Coal seam mining induces disturbances in underground floors, leading to plastic failure, which presents significant safety risks, particularly in areas with underlying pressurized water. Accurately assessing the maximum depth of such floor failure is crucial for ensuring safe mining operations. This study investigates the evolution of apparent resistivity in the floor of the 4,301 working face using the network parallel electrical method. The observed maximum failure depth was found to be 19.3 m. Based on these measurements, the plastic slip theory for a homogeneous rock layer was applied, incorporating mining parameters such as burial depth and mining height. Five mechanical models for plastic slip failure in multi-layer composite floors were developed, with the maximum failure depth calculated to be 18.26 m. The study also explores the impact of factors such as mining height, burial depth, and the internal friction angle of the rock layers on floor failure depth. The results demonstrate that multi-layer composite floors exhibit a 23.1% reduction in failure depth on average compared to homogeneous floors. Numerical simulations confirmed that the maximum failure depth under mining disturbance is 19.2 m, with shear failure identified as the predominant failure mode. The findings from the theoretical analysis, numerical simulations, and field measurements align closely, validating the applicability of the plastic slip theory for multi-layer composite floors. This research provides critical theoretical support for safe mining operations in coal seams above confined aquifers and effective water control strategies.
1 Introduction
Longwall coal mining induces support pressure on the floor, leading to damage in the underlying strata within a certain depth range (Xu et al., 2019; Zhang et al., 2018; Wu et al., 2022; Wu et al., 2024), which poses significant safety risks to the mining of coal seams under confined water. Thus, determining the depth of floor damage is a critical issue in mining coal seams under confined water. Experts have extensively studied this topic, yielding valuable results (Zhang et al., 2024; Xuyang et al., 2022; Li et al., 2020; Yang et al., 2025; Wu et al., 2025a).
Numerous theoretical studies on floor damage mechanisms have been conducted, revealing the effects under various conditions (Liu et al., 2022b; Jia et al., 2019; Guo et al., 2021; Wu et al., 2025b). Zhang proposed the classic plastic slip line field theory, which clarified the process of floor compression damage and provided a method for calculating the maximum depth of floor damage (Zhang and Liu, 1990). Li developed a mechanical model of floor water inrush induced by confined water, based on the plastic slip line theory. He derived expressions for confined water pressure and waterproof coal pillar width under limit equilibrium, and analyzed the deformation and damage characteristics of the floor under various coal pillar widths (Li et al., 2021). Sun developed a mechanical model for floors in inclined working faces, deriving the stress at any point on the inclined floor and providing a method to calculate the maximum depth of floor damage in inclined coal seams (Sun et al., 2019). He incorporated multiple stress superimpositions and developed a mechanical model of floor damage based on elastic foundation theory and the superposition principle. He also proposed a criterion for floor damage depth, comprehensively determining the range of damage (He et al., 2022).
Research on the plastic damage characteristics of the floor using numerical simulation has matured, supporting the understanding of stress field, deformation field, and plastic zone evolution during working face advancement (Meng et al., 2019; Zhu et al., 2016; Liu et al., 2022a; Zhu et al., 2017). Liang developed a FLAC3D numerical model for mining under confined water, finding that floor damage depth increases with working face advancement. At 160 m, the maximum depth of floor damage reaches 16.71 m (Liang et al., 2020). Zhu developed a numerical model for mining coal seams under confined water, finding that floor stress decreases with depth and eventually returns to the original rock stress state (Zhu et al., 2014). In field measurements, researchers often combine multiple detection techniques to determine the depth and characteristics of floor disturbance and damage (Chang et al., 2020). Commonly used field detection techniques include direct current resistivity (Zhou et al., 2019), three-dimensional CT (Tao and Zheng, 2018), mine geological radar (Xu et al., 2018), distributed optical fiber sensing (Bernini et al., 2011), borehole imaging (Liu et al., 2023), acoustic wave detection (Shan et al., 2022), and microseismic technology (Gai et al., 2024). Zeng combined in-situ strain testing and borehole imaging to measure the depth of floor damage in five coal mines in the Yanzhou mining area, finding that damage depth ranged from 8.4 to 20 m (Zeng et al., 2020). Yu proposed a global optimization algorithm for acoustic wave tomography, achieving an accuracy of 0.56 m after 7 iterations. This method was used to determine that the floor damage depth after mining No. 3 coal seam in Bao’an coal mine was 17 m (Yu et al., 2020).
The theoretical research above is based on the plastic slip theory, extended in various dimensions, yet still simplifies the floor as a single homogeneous rock layer. In reality, the floor of coal seams is typically a composite rock layer consisting of multiple rock types, and calculations based on a single rock layer may introduce errors. Based on field measurements, this paper integrates mining conditions, such as mining height and burial depth, into the classic plastic slip theory. It constructs a multi-layer composite floor damage model, derives analytical solutions for maximum floor damage depth under different states, and verifies the theory’s scientific validity and practicality through numerical simulation. The research provides theoretical support for mining coal seams under confined water and water control operations.
2 Field measurement of the damage depth of floor
2.1 Overview of the study area
Longquan Coal Mine is located in Loufan County, Taiyuan City, Shanxi Province (Figure 1a). The mine contains three coal seams suitable for mining: 4#, 7#, and 9#. The main mining seam, 4#, is nearly horizontal, with an average thickness of 6.47 m. The coal seam structure is complex, consisting of several layers of mudstone and carbonaceous mudstone intercalated with gangue. The 4,301 working face, located in the third mining area, is the first to be mined. It has a strike length of 720 m, a dip width of 180 m, an average burial depth of approximately 600 m, an average mining height of 6.25 m, and a roof treatment method involving full collapse (Figure 1b). Drilling records near the 4,301 working face show that the immediate roof of the 4# coal seam consists of 3.53 m of siltstone, while the old roof is 7.24 m thick sandy mudstone. The immediate floor is 6.75 m of fine sandstone, and the old floor is 11.63 m of sandy mudstone, forming a typical hard-soft-hard composite structure. The geological columnar diagram is shown in Figure 1c.
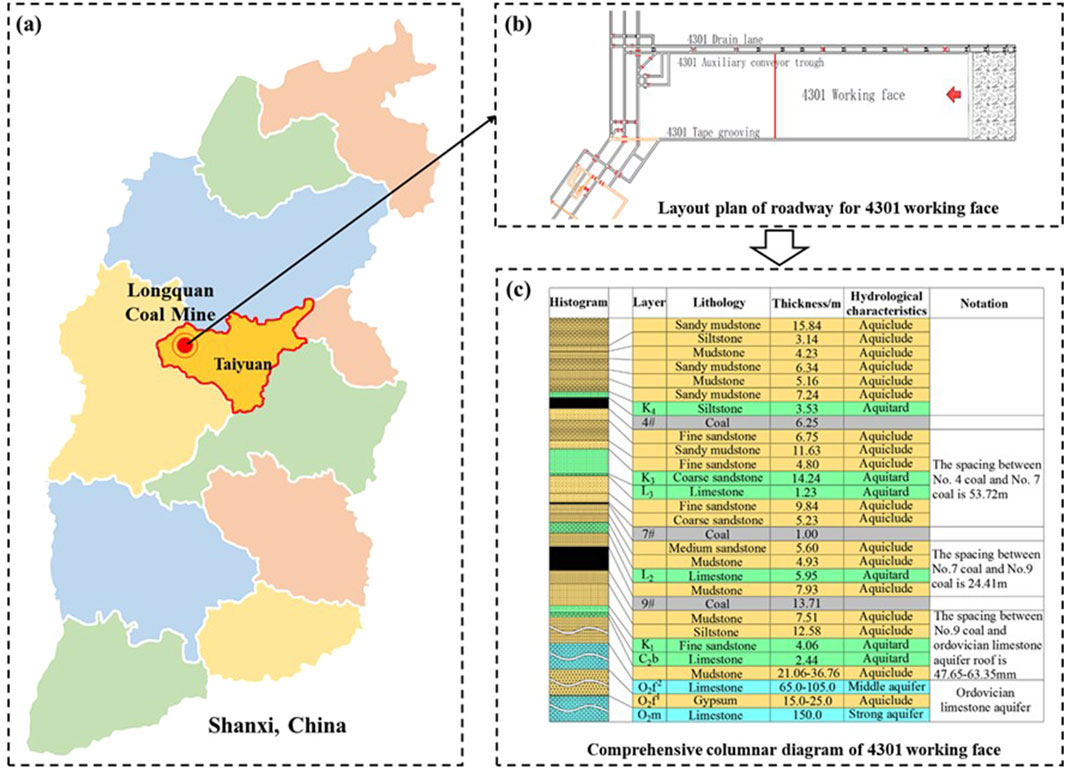
Figure 1. Overview of the study area: (a) Study area location; (b) Layout plan of roadway for 4301 working face; (c) Comprehensive columnar diagram of 4301 working face.
The 4# coal seam is mined under pressure from Taihui and Ordovician limestone aquifers. The aquifer groups impacting the 4# coal seam mining include the K3 sandstone, L3 limestone aquifer, L2 limestone aquifer group, and the Ordovician limestone aquifer, which poses the greatest threat to mining safety. The Ordovician limestone aquifer is, on average, 153.5 m from the floor of the 4,301 working face, with a water pressure of approximately 6 MPa. The water inrush coefficient of the Ordovician limestone aquifer in the 4# coal seam ranges from 0.036 to 0.097 MPa/m, with some areas of the third mining area exceeding the critical value of 0.06 MPa/m. Additionally, a floor water inrush of 140 m3/h occurred during the mining of the 4,301 working face. The interaction between the floor mining damage zone and the aquifer pressure elevation zone is considered a key factor in the floor water inrush at the working face. Therefore, clarifying the floor damage depth is crucial for the safe and efficient mining of the working face and for early water disaster warning.
2.2 Monitoring program design
To clarify the floor damage depth at the 4,301 working face, this study employs the network parallel electrical method to continuously monitor the evolution of the floor’s apparent resistivity during mining advancement, analyzing the damage characteristics and maximum depth of floor damage.
In the return air roadway, four measuring lines are arranged in a hole-road combination to detect the apparent resistivity of the waterproof layer. Two floor boreholes are drilled, with one measuring line placed in each borehole (measuring lines 1 and 2), and two measuring lines (measuring lines 3 and 4) are installed on the coal wall of the return air roadway. As a result, the two measuring lines in the roadway and the two in the boreholes form a hole-road three-dimensional electrical observation system. Each measuring line is equipped with 16 electrodes, spaced 4 m apart. Each electrode is connected to a measuring point, resulting in a total of 64 measuring points. The layout of the electrical detection system’s measuring lines is shown in Figure 2.
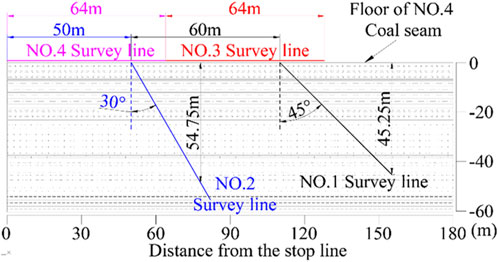
Figure 2. Schematic diagram of hole-lane 3D electrical observation system.
2.3 Monitoring results of floor damage depth
The first monitoring was conducted after the installation of the hole-lane three-dimensional electrical observation system was completed. At this point, the working face was 103 m from the opening of the 1# borehole. The floor rock layer within the effective detection range of the network parallel electrical system was largely unaffected by the mining-induced stress of the working face. Thus, the apparent resistivity of the impermeable layer at this point was used as the background value, as shown in Figure 3. In the figure, the ordinate at 0 m represents the junction of the coal seam and the floor, while the abscissa represents the distance from the stop-mining line. To ensure the accuracy and continuity of the detection results, floor apparent resistivity measurements were taken every 4 h after the initial detection.
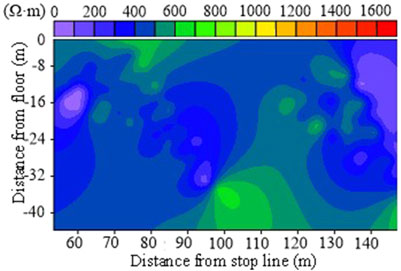
Figure 3. Background value of apparent resistivity of the floor.
As illustrated in Figure 3, the apparent resistivity of the aquiclude unaffected by mining predominantly ranges from 200 to 500 Ω m, with localized values between 600 and 800 Ω m. It is widely accepted that the resistivity in the fracture development zone increases by a factor of 1.5–2.5. Consequently, when the apparent resistivity exceeds 1,200 Ω m, it indicates that the floor has experienced plastic failure induced by mining. The evolution of apparent resistivity in the floor aquiclude during the mining process of the working face is depicted in Figure 4.
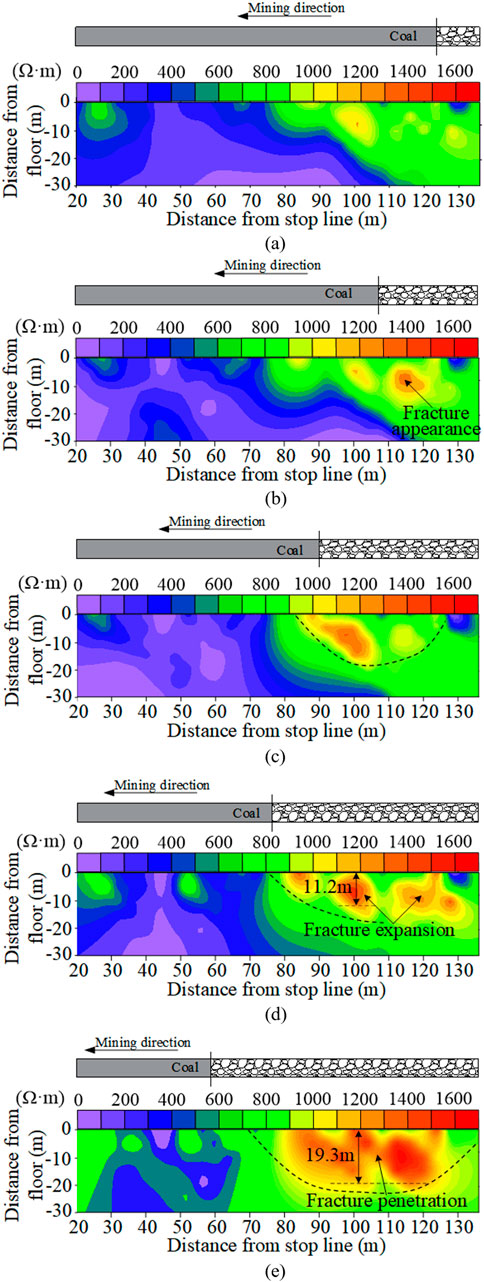
Figure 4. Evolution characteristics of apparent resistivity of the floor: (a) Working face advances 22.84 m; (b) Working face advances 52.28 m; (c) Working face advances 84.28 m; (d) Working face advances 109.48 m; (e) Working face advances 141.72 m.
As illustrated in Figure 4:
(1) When the working face advanced 22.84 m, the apparent resistivity of the floor increased due to the influence of advance stress (Figure 4a), but no significant damage was observed. As the working face progressed, areas of the floor where resistivity exceeded 1,200 Ω m began to appear (Figures 4b, c), indicating the initiation and gradual development of floor cracks. Subsequently, regions with resistivity exceeding 1,200 Ω m expanded (Figure 4d), with the maximum damage depth reaching 11.2 m. When the working face advanced to 141.72 m, areas with resistivity greater than 1,200 Ω m merged, and the maximum damage depth extended to 19.3 m (Figure 4e).
(2) Under the influence of advance stress, damage initially occurs in the floor of the working face, extending from the coal wall to the peak of the advance support pressure. As mining progresses, cracks develop in the floor of the goaf, extending horizontally and increasing in depth. Beyond a certain distance, the destruction depth of the floor ceases to increase.
(3) The morphology of high-value apparent resistivity regions indicates that the floor damage range is arc-shaped, exhibiting slip characteristics. As the working face advances, the damage area expands while maintaining its overall shape. The resistivity values gradually increase, signifying plastic failure of the floor.
3 Multilayer composite floor plastic slip theory
3.1 Plastic slip theory and classification of multilayer floors
The measured results indicate that the failure of the working face floor aligns with the classical plastic slip theory (Zhang and Liu, 1990). Based on the characteristics of coal seam support pressure, ignoring pore water pressure, and based on the theory of elastic-plastic mechanics, the calculation method of ultimate bearing capacity and failure depth of floor rock mass is proposed, as shown in Figure 5. The floor rock mass conforms to isotropic and static boundary conditions and other relevant assumptions. In Figure 5, L0 represents the distance from the coal face to the peak of the advanced support pressure, m; L1 and L2 are the horizontal distances from the coal face to the points of maximum floor failure depth and the left end of the plastic slip line, m; H0 is the maximum depth of the active limit failure zone, m; Hm represents the maximum failure depth of the floor, m; l0 and lm denote the initial and endpoint radii of the logarithmic spiral line, m; l is the radius of the logarithmic spiral line at point E, representing the maximum floor failure depth, m; α is the angle between l0 and l, °; θ is the angle between l and Hm.
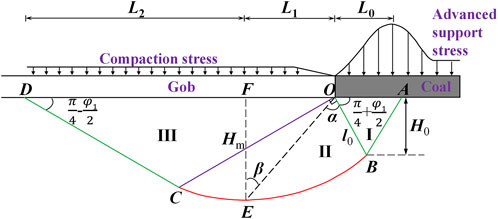
Figure 5. Mechanical model of the floor failure depth under limit state.
Under the influence of the advancing support pressure, the floor, extending from the coal wall of the working face to the peak of the support pressure, experiences normal extrusion stress, leading to tensile failure and the formation of an active limit failure zone (zone I in Figure 5). Once the rock mass in the active limit failure zone deforms, additional extrusion stress is applied to the transition zone (zone II in Figure 5), leading to plastic failure. The rock mass in the transition zone further compresses the rock mass in the passive limit failure zone (zone III in Figure 5), resulting in plastic flow until complete failure. The maximum failure depth of the floor is expressed as follows:
Based on the above, assuming the coal body is a homogeneous isotropic material and applying elastic-plastic theory along with the principle of stress equilibrium, the expression for the distance L0 from the peak point to the coal wall is as follows:
In this equation, M and H represent the mining thickness and burial depth of the coal seam, m;k is the stress concentration factor; γ denotes the average unit weight of the overlying rock strata, kN/m3;φf is the internal friction angle of the overlying strata, °; C is the cohesion of the coal body, MPa; φ is the internal friction angle of the coal body, °; ξ is the stress coefficient, ξ =
By substituting Equation 2 into Equation 1, we obtain the expression for the maximum failure depth Hm of the floor, which incorporates the characteristics of the coal seam occurrence and the impact of mining techniques:
Equation 3 provides a method for calculating floor failure depth by simplifying the floor rock strata as a single homogeneous layer. However, this simplification does not accurately reflect actual conditions, resulting in some discrepancy between the calculated floor failure depth and field observations. Therefore, the following section integrates factors such as mining pressure in the working face, coal seam characteristics, and the lithology of the coal seam floor. By considering variations in the floor failure depth (H0) caused by the advanced concentrated stress at different stratigraphic positions, the plastic slip failure states of multilayer composite floors are categorized into five types, as illustrated in Figure 6. Here, H1 represents the thickness of the first (upper) rock layer beneath the coal seam floor, and H2 represents the thickness of the second (middle) rock layer. Each layer has different properties and interfaces between composite layers are perfectly bonded, with no slippage or delamination.
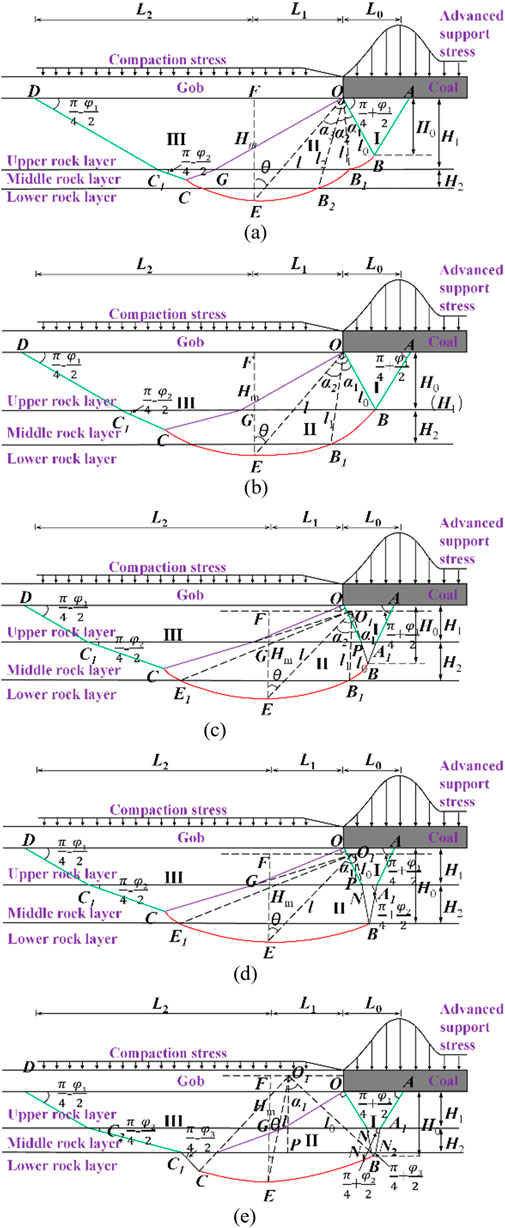
Figure 6. Calculation model of plastic slip failure zone depth of multi-layer floor: (a) The floor failure state: H0 < H1; (b) The floor failure state: H0 = H1; (c) The floor failure state: H1 < H0 < H1+H2; (d) The floor failure state: H0 = H1+H2; (e) The floor failure state: H0 > H1+H2.
3.2 Failure depth of the floor under operating conditions
3.2.1 Failure depth of the floor under H0 < H1
When H0 < H1, as shown in Figure 6a, the thickness of the upper rock layer H1 of the floor is expressed by the endpoint radius l1 of the logarithmic spiral line BB1:
By performing a Taylor expansion on the unknown coefficient α1 in Equation 4 and substituting the first two terms into Equation 4, the expression for the thickness H1 of the upper rock layer of the floor is obtained as follows:
By performing a Taylor expansion on Equation 5, its expression can be written as follows:
Let:
Then Equation 6 can be transformed into a univariate quartic equation containing only the unknown coefficient α1, and its expression is as follows:
By applying Ferrari’s solution to the quartic equation, the expression for the unknown coefficient α1 is derived as follows:
In the equation,
The endpoint radius of the first logarithmic spiral l1 can be expressed as:
By substituting Equation 8 into Equation 9, the expression for l1 can be obtained as follows:
The endpoint radius of the second logarithmic spiral l2 can be determined by solving the following system of equations:
In the equation: α2 represents the angle between the radii of the endpoints of the logarithmic spiral for the median rock layer, °; H2 is the thickness of the median rock layer, m.
Solving Equation 10 yields:
By performing a Taylor expansion on Equation 11, with the calculation process following the same procedure as in Equations 6–8, the expression for the maximum failure depth Hm of the multilayer composite floor under the first failure condition is given by:
When
By setting the value inside the brackets of Equation 13 to 0, the value of α3 is obtained as follows:
By substituting Equation 14 into Equation 12, the expression for Hm, representing the maximum failure depth of the multi-layer composite floor under the first failure condition, is obtained as follows:
3.2.2 Failure depth of the floor under H0 = H1
According When H0 = H1, as shown in Figure 6b, the logarithmic spiral line is located between the middle and lower rock layers, with the initial radius of the first segment of the spiral line positioned at the interface between the upper and middle rock layers. Based on the solution process for the first failure condition, the endpoint radius of the logarithmic spiral in the middle rock layer l1 can be obtained by solving the following system of equations (Equation 16):
From Equations 8, 9 for α1 and l1, and based on Figure 2b, the expression for the maximum failure depth Hm of the multi-layer composite floor under the second failure condition is obtained as follows:
When
By setting the value inside the brackets of Equation 18 to 0, the value of α2 is obtained as follows:
Substituting Equation 19 into Equation 17, the expression for the maximum failure depth of the multi-layer composite floor under the second failure condition Hm (Equation 20) is obtained as follows:
3.2.3 Failure depth of the floor under H1 < H0 < H1+H2
When H1 < H0 < H1+H2, as shown in Figure 6c, the logarithmic spiral is located within the middle and lower rock layers. However, the starting radius of the first segment of the spiral lies within the middle rock layer, and the center of rotation for the spiral is at the intersection point O1 of the extended line connecting the starting and ending radii of the spiral. The starting radius of the first segment of the spiral l0 can be expressed as follows:
The value of the endpoint radius l1 of the logarithmic spiral within the middle rock layer is:
The expressions for α1 and l1 are given by Equations 8, 9. Based on Figure 6c, the expression for the maximum failure depth Hm of the multi-layer composite floor under the third failure state is as follows:
When
By setting the value inside the brackets of Equation 24 to 0, the value of α2 is obtained as:
By substituting Equations 22, 25 into Equation 23, the expression for the maximum failure depth Hm of the multi-layer composite floor under condition three (Equation 26) is obtained as:
3.2.4 Failure depth of the floor under H0 = H1+H2
When H0 = H1+H2, as shown in Figure 6d, the starting radius l0 of the logarithmic spiral is located at the contact surface between the middle and lower layers, with the center of rotation at the intersection point O1 of the extended line connecting the starting and ending radii of the spiral. The starting radius of the spiral is given by Equation 21. Based on Figure 6d, the expression for the maximum failure depth Hm of the multi-layer composite floor under condition four is obtained as:
When
By setting the value inside the brackets in Equation 28 to 0, the value of α1 is obtained as follows:
Substituting Equation 29 into Equation 27, the expression for the maximum failure depth Hm of the multi-layer composite floor under the fourth failure state is obtained as follows:
3.2.5 Failure depth of the floor under H0 > H1+H2
When H0 > H1+H2, as shown in Figure 6e, the active limit failure zone penetrates through three layers of the floor rock. At this point, the entire logarithmic spiral is located within the lower layer of rock. The initial radius l0 of the spiral is given by Equation 21, and in
When
By substituting Equations 30, 32 into Equation 31 and simplifying, the expression for the maximum failure depth Hm of the multi-layer composite floor under the fifth failure state (Equation 33) is obtained as follows:
3.3 Calculation of floor failure depth
For the 4,301 working face, the mining height M is 6.25 m, the burial depth H is 600 m, the average overlying rock unit weight γ is 25 kN/m3, and the average internal friction angle of the rock layers is 32°, The coal seam cohesion C and internal friction angle φ are 1.2 MPa and 28°, respectively. The average internal friction angle φ0 of the floor rock layer is 39°, and the stress concentration factor k is taken as 2.5. Substituting these parameters into Equation 3, the maximum failure depth of the single-layer homogeneous floor is calculated to be 23.94 m.
For the composite floor, the internal friction angles of the upper, middle, and lower layers of the floor are 39°, 37°, and 39°, respectively. The thicknesses of the upper and middle layers H1 and H2 are 6.75 m and 11.63 m, respectively. By substituting these parameters into the floor failure depth calculation formula, the maximum failure depth of the hard-soft-hard composite floor of the 4,301 working face is calculated to be 18.26 m. This result aligns more closely with field measurements compared to calculations based on the single-layer homogeneous floor.
4 Numerical simulation
4.1 Establishment of numerical model
Using the geological comprehensive columnar diagram of the 4,301 working face (Figure 1c), a FLAC3D numerical model was developed to investigate the failure characteristics of the mining floor. The model dimensions are set to 400 m × 400 m × 300 m (length × width × height), with a mining length of 300 m. To account for boundary effects, protective coal pillars of 50 m are included on each side of the model, both laterally and longitudinally. In the floor, multiple survey lines were placed to monitor the evolution of stress during mining. The spacing between survey lines and measurement points on each line is 5 m. To improve computational efficiency, the model uses a lower grid density for the roof, while increasing the grid density in the floor mesh. The four sides and bottom of the model are constrained to simulate displacement boundary conditions, while a vertical stress of 12.142 MPa is applied on the model’s top surface to represent the overburden pressure. Additionally, a groundwater pressure of 6 MPa is applied to the Ordovician aquifer at the model base, with a lateral pressure coefficient set to 0.8. The numerical model configuration is shown in Figure 7, and the physical and mechanical parameters of each rock layer are provided in Table 1.
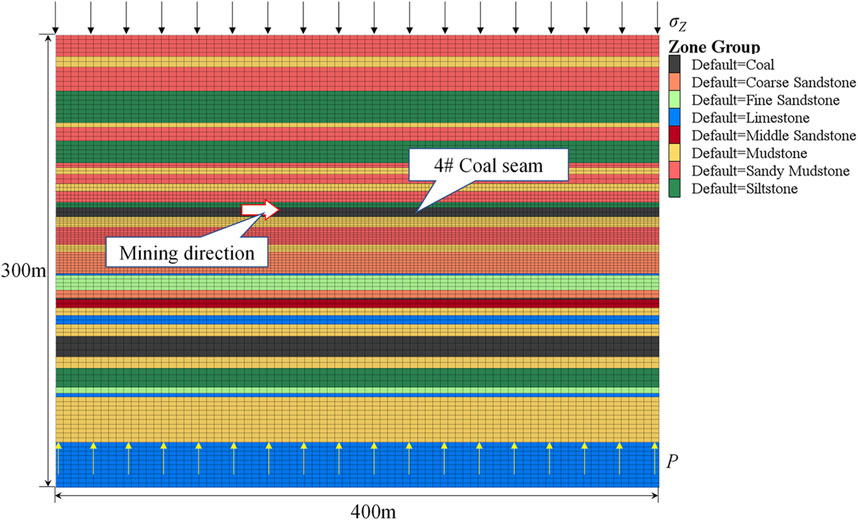
Figure 7. Schematic diagram of numerical model.
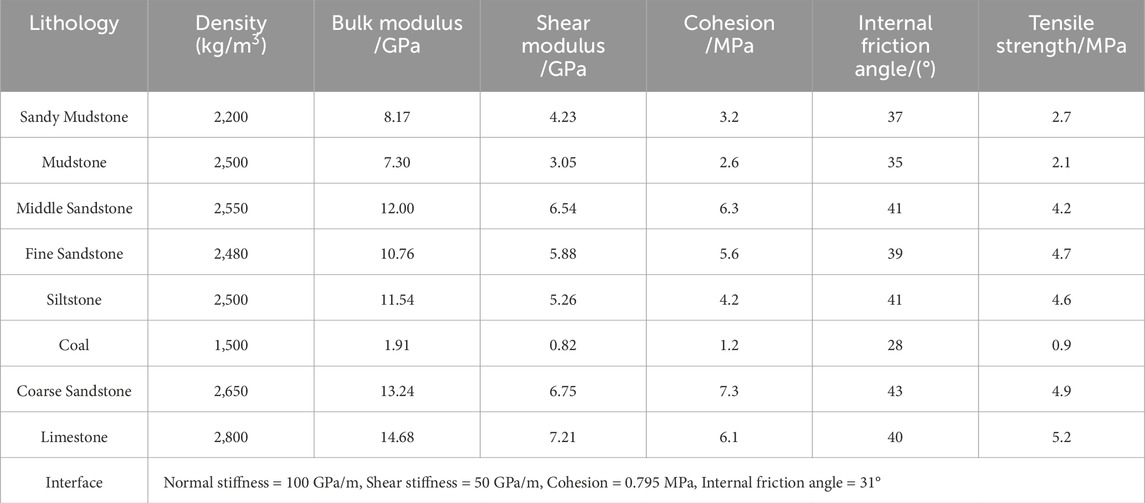
Table 1. Physical and mechanical parameters of typical coal and rock masses.
4.2 Characteristics of floor mining damage
The calculations are performed using the numerical model illustrated in Figure 7. Mining of the 4,301 working face progresses from left to right. The working face advances 10 m per mining cycle, with the goaf roof collapsing naturally. In the model, the opening eye is positioned at X = 50 m, and the stop line is at X = 350 m. Figure 8 presents the floor damage characteristics observed as the 4,301 working face advances 300 m. Figure 8 comprises six sub-figures, each depicting the plastic zone and vertical stress distribution of the floor.
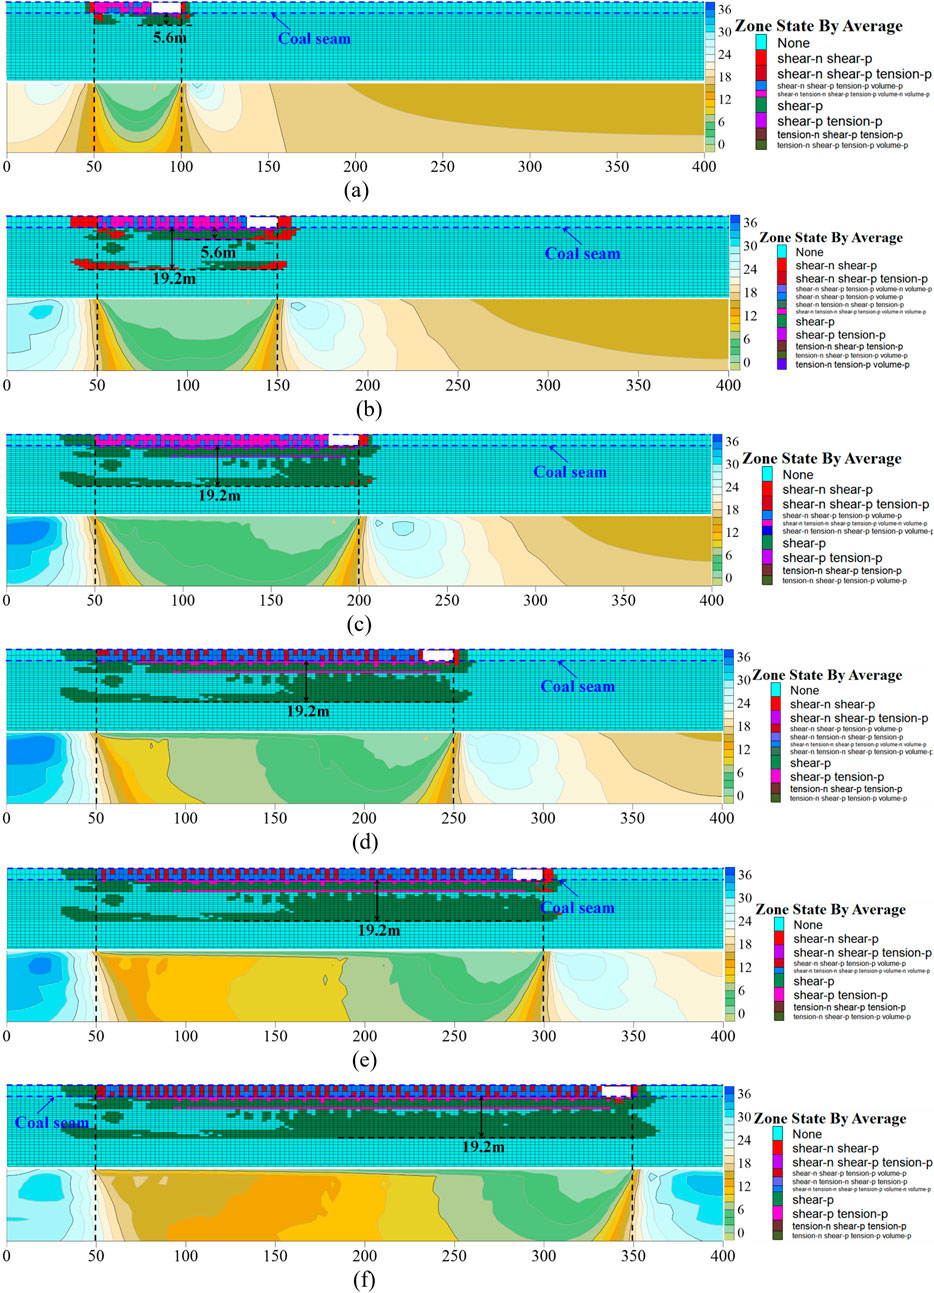
Figure 8. Mining damage characteristics of multi-layer floor during working face advancement: (a) Working face advances 50 m; (b) Working face advances 100 m; (c) Working face advances 150 m; (d) Working face advances 200 m; (e) Working face advances 250 m; (f) Working face advances 300 m.
As depicted in Figure 8:
At a working face advance of 50 m (Figure 8a), the maximum floor failure depth reaches 5.6 m, while the load on the immediate floor remains minimal, peaking at 0.44 MPa. In terms of failure morphology, shear failure predominates in the floor, although some rock layers near the coal seam and immediate floor exhibit shear-tension failure. At a working face advance of 100 m (Figure 8b), the primary disturbance depth of floor failure remains 5.6 m, but discontinuous shear failure extends to a maximum vertical depth of 19.2 m. Composed primarily of low-strength mudstone, this layer experiences shear failure as mining stress surpasses its bearing capacity. Elsewhere, shear failure remains the dominant failure mode.
At 150 m (Figure 8c), shear failure continues to dominate, while the junction between mudstone and sandy mudstone exhibits shear-tension failure. The plastic failure zone beneath the working face gradually penetrates, reaching a maximum depth of 19.2 m. At 200 m (Figure 8d), the maximum floor failure depth remains at 19.2 m without further downward extension. As the working face progresses, the floor’s bearing capacity increases to 8.5 MPa. Notably, despite adjustments in vertical stress, shear failure remains the predominant damage mode, showing no significant changes.
At 250 m (Figure 8e), the maximum floor failure depth remains 19.2 m, with shear failure continuing as the predominant mode without notable variation. At 300 m (Figure 8f), the floor failure depth stabilizes at 19.2 m, with shear failure remaining dominant. The rock formations at the coal-mudstone and mudstone-sandy mudstone junctions consistently exhibit shear-tension failure.
5 Discussion
5.1 Results comparison
The measured data indicate a maximum floor failure depth of 19.3 m for the 4,301 working face, while theoretical calculations estimate it at 18.26 m and numerical simulations at 19.2 m. A comparative analysis (Figure 9) reveals that the relative error between theoretical calculation and numerical simulation and measurement results is small, ranging from 0.5% to 5.4%. Compared with traditional statistical formulas (Lu et al., 2022), the calculation results of plastic slip theory are more reliable.
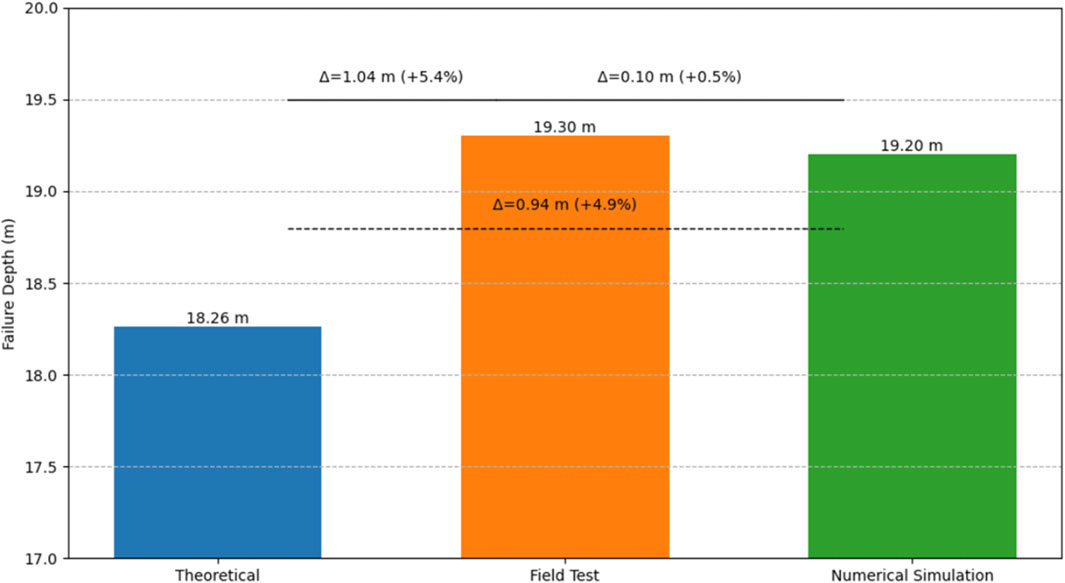
Figure 9. Statistics of floor damage depth under different methods.
5.2 Influencing factor analysis
Existing studies have shown that mining height (Dong et al., 2024), burial depth (Li et al., 2022), and the characteristics of the underlying rock strata (Cicek, S., 2020) influence the depth of floor failure. To further analyze the impact of coal seam occurrence characteristics and mining operations on the floor failure depth, variation curves of the maximum floor failure depth under different burial depths and mining heights are plotted, as shown in Figure 10. From the graph, it is evident that the maximum floor failure depth exhibits a linear correlation with burial depth and a logarithmic relationship with mining height, with the latter showing diminishing returns at greater heights.
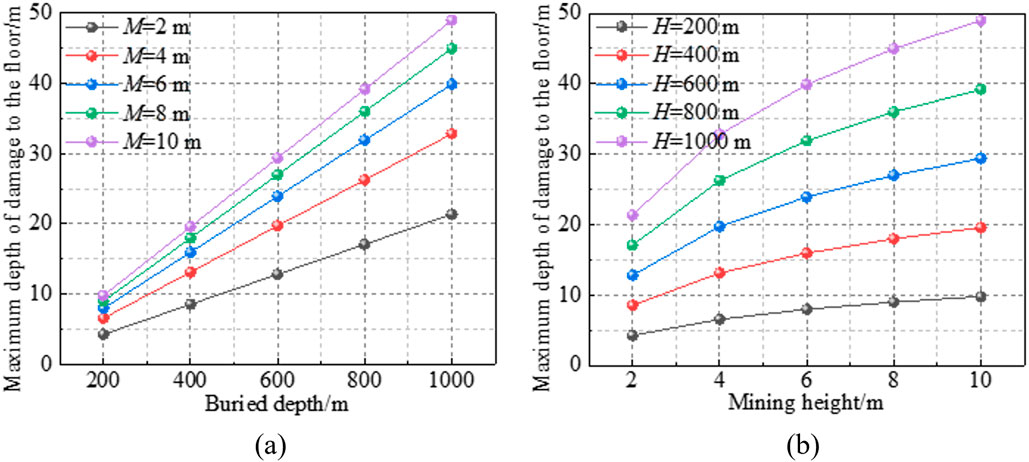
Figure 10. Maximum damage depth of single homogeneous floor under different mining conditions: (a) Buried depth; (b) Mining height.
Considering the hard-soft-hard composite floor of the 4,301 working face as an example, the immediate floor beneath the coal seam remains a 6.75 m thick fine sandstone layer, with constant rock parameters. The maximum floor failure depth variations were calculated under different burial depths and mining heights. Furthermore, while maintaining constant burial depth and mining height, the maximum floor failure depth was calculated under varying mechanical parameters of the second and third rock layers beneath the immediate floor. During the calculations, the floor failure state applicable to different mining conditions was determined. The calculation results are presented in Figure 11.
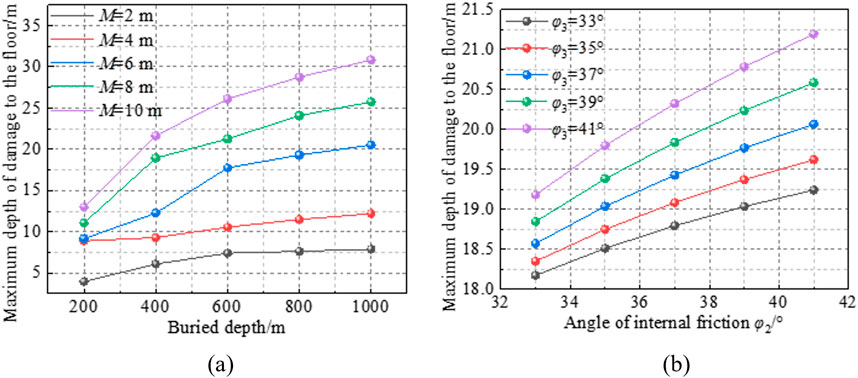
Figure 11. Maximum damage depth of multi-layer floor under different mining conditions: (a) Effects of different burial depths and mining heights; (b) Effect of different internal friction angles.
Figure 11 illustrates that:
(1) The maximum failure depth of a multi-layer composite floor increases with burial depth and mining height. However, unlike the trend seen in single-layer floors, the rate of increase varies under different calculation methods for different failure states. Within the same failure state, changes in mining conditions yield similar failure depths to those of a single homogeneous floor. Additionally, the floor failure depth increases as the internal friction angle of the second and third layers below the immediate floor increases, though the overall rate of increase remains relatively low.
(2) Notably, for the 4,301 working face, where the immediate floor is a 6.75 m-thick fine sandstone layer, calculations with a burial depth H = 200 m and mining height M = 2 m show that both H0 and Hm are less than H1. Consequently, the floor failure depth calculated using Equation (3) is smaller than the result from Equation (15), indicating that layer characteristics significantly influence floor failure. Further comparison of the results from Figures 10, 11 shows that, compared to a single homogeneous floor, the maximum failure depth of a multi-layer composite floor is reduced by (−35.5%) to 63.1% under the same mining conditions, with an average reduction of 23.1%, quantifying the constraining effect of a multi-layer composite structure on floor failure depth. This finding is consistent with the research results of Zhu and Mo (Shuyun et al., 2013; Mo et al., 2019).
In addition, Cao and Liang pointed out that the water pressure of the bottom plate will also affect the bottom plate failure depth (Cao et al., 2021; Liang et al., 2020), but this study did not involve this. Further studies will introduce water pressure into the bottom plate failure depth calculation formula based on plastic slip theory to achieve more accurate prediction.
6 Conclusion
(1) The apparent resistivity evolution during the working face advancement indicates that the floor damage depth increases progressively due to mining disturbance. The measured maximum damage depth of the floor is 19.3 m, characterized by plastic slip failure.
(2) Mining factors, including burial depth and mining height, are incorporated into the plastic slip failure theory of a single homogeneous rock layer. This theory is extended to a plastic slip line model for multi-layer floors, deriving the theoretical solution for the maximum damage depth across five damage states. For the 4,301 working face, this depth is calculated as 18.26 m.
(3) A numerical model for the 4,301 working face was established. The floor failure depth increased to 19.2 m during working face advancement and then stabilized. Shear failure was identified as the primary failure mode, while shear-tensile failure occurred at rock layer junctions. Stress adjustment in the floor restored its stress environment without altering its failure mode.
(4) The theoretical and numerical results are consistent with the field results. The maximum relative error is only 5.4%, which verifies the multilayer plastic slip theory. By analyzing examples, the effects of mining height, burial depth, and rock internal friction angle on floor damage depth are elucidated. Compared to single homogeneous floors, multi-layer composite floors exhibit a 23.1% reduction in damage depth on average, quantifying the rock structure’s restrictive influence. These findings offer theoretical support for coal seam mining and water prevention efforts above confined aquifers.
Data availability statement
The original contributions presented in the study are included in the article/supplementary material, further inquiries can be directed to the corresponding author.
Author contributions
ZK: Methodology, Resources, Writing – original draft, Writing – review and editing. XC: Project administration, Validation, Writing – original draft, Writing – review and editing. XW: Writing – original draft, Formal Analysis, Investigation. DZ: Supervision, Writing – review and editing. LC: Conceptualization, Funding acquisition, Validation, Writing – original draft, Writing – review and editing. SG: Software, Visualization, Writing – original draft.
Funding
The author(s) declare that financial support was received for the research and/or publication of this article. This research was funded by National Natural Science Foundation of China (No. 52104100) and the Independent Research Project of the State Key Laboratory for Fine Exploration and Intelligent Development of Coal Resources, CUMT (SKLCRSM23X003).
Conflict of interest
The authors declare that the research was conducted in the absence of any commercial or financial relationships that could be construed as a potential conflict of interest.
Generative AI statement
The author(s) declare that no Generative AI was used in the creation of this manuscript.
Publisher’s note
All claims expressed in this article are solely those of the authors and do not necessarily represent those of their affiliated organizations, or those of the publisher, the editors and the reviewers. Any product that may be evaluated in this article, or claim that may be made by its manufacturer, is not guaranteed or endorsed by the publisher.
References
Bernini, R., Minardo, A., and Zeni, L. (2011). Distributed sensing at centimeter-scale spatial resolution by BOFDA: measurements and signal processing. IEEE Photonics J. 4 (1), 48–56. doi:10.1109/jphot.2011.2179024
Cao, M., Yin, S., and Xu, B. (2021). Water inrush and failure characteristics of coal seam floor over a confined aquifer. Energy Rep. 7, 8298–8311. doi:10.1016/j.egyr.2021.09.023
Chang, J., Li, D., and He, K. (2020). Mining failure response characteristics of stope floor: a case of renlou coal mine. Adv. Civ. Eng. 2020 (1), 8832520. doi:10.1155/2020/8832520
Cicek, S. (2020). Adaptation of coal mine floor rating (CMFR) to eastern US coal mines. West Virginia University.
Dong, F., Yin, H., Xie, D., Wang, F., Cheng, W., Li, Y., et al. (2024). Floor failure behavior and water disaster prevention system of ultra-wide opposite pulling working face mining on confined aquifer. Eng. Fail. Anal. 165, 108736. doi:10.1016/j.engfailanal.2024.108736
Gai, Q., Gao, Y., Zhang, X., and He, M. (2024). A new method for evaluating floor spatial failure characteristics and water inrush risk based on microseismic monitoring. Rock Mech. Rock Eng. 57 (4), 2847–2875. doi:10.1007/s00603-023-03626-3
Guo, X., Li, Y., Li, J., Liu, H., Ma, X., Li, J., et al. (2021). Surrounding rock failure characteristics and water inrush mechanism of roadway above the aquifer in nonuniform stress field. Geofluids 2021 (1), 1–10. doi:10.1155/2021/6674616
He, T., Li, G. D., Sun, C., Luo, F., and Li, X. Q. (2022). Floor failure characteristics of thick coal seam mining above confined aquifer. Min. Metallurgy and Explor. 39 (4), 1553–1562. doi:10.1007/s42461-022-00623-y
Jia, H., Wang, L., Fan, K., Peng, B., and Pan, K. (2019). Control technology of soft rock floor in mining roadway with coal pillar protection: a case study. Energies 12 (15), 3009. doi:10.3390/en12153009
Li, A., Ji, B. N., Ma, Q., Liu, C., Wang, F., Ma, L., et al. (2021). Design of longwall coal pillar for the prevention of water inrush from the seam floor with through fault. Geofluids 2021 (1), 1–14. doi:10.1155/2021/5536235
Li, A., Ma, Q., Lian, Y., Ma, L., Mu, Q., and Chen, J. (2020). Numerical simulation and experimental study on floor failure mechanism of typical working face in thick coal seam in Chenghe mining area of Weibei, China. Environ. Earth Sci. 79, 118–122. doi:10.1007/s12665-020-8839-2
Li, C., Zuo, J., Xing, S., Du, W., and Chuai, X. (2022). Failure behavior and dynamic monitoring of floor crack structures under high confined water pressure in deep coal mining: a case study of Hebei, China. Eng. Fail. Anal. 139, 106460. doi:10.1016/j.engfailanal.2022.106460
Liang, Z., Song, W., and Liu, W. (2020). Theoretical models for simulating the failure range and stability of inclined floor strata induced by mining and hydraulic pressure. Int. J. Rock Mech. Min. Sci. 132, 104382. doi:10.1016/j.ijrmms.2020.104382
Liu, H., Hao, C., Wang, Z., Li, C., Guo, L., Liang, J., et al. (2023). Study on stability of underlying room and pillar old goaf in close coal seam and mining of the upper coal seam. Front. Earth Sci. 10, 1071250. doi:10.3389/feart.2022.1071250
Liu, Y., Zhao, H., Ding, H., and Li, Y. (2022a). Characterization of arching effect and failure mode of longwall panel floor. Eng. Fail. Anal. 138, 106427. doi:10.1016/j.engfailanal.2022.106427
Liu, Y., Zhao, H., Liu, S., and Sun, W. (2022b). Asymmetric damage mechanism of floor roadway based on zonal damage characteristics of longwall panel floor: a case study. Nat. Hazards 114 (1), 1015–1041. doi:10.1007/s11069-022-05421-9
Lu, C., Xu, J., Zhao, H., Zhang, H., Zhang, Y., and Chen, M. (2022). Floor disturbance and failure characteristics of super-large mining height working face. Geofluids 2022 (1), 1–13. doi:10.1155/2022/1279642
Meng, X., Liu, W., and Mu, D. (2018). Influence analysis of mining’s effect on failure characteristics of a coal seam floor with faults: a numerical simulation case study in the Zhaolou coal mine. Mine Water Environ. 37 (4), 754–762. doi:10.1007/s10230-018-0532-2
Meng, X., Liu, W., Zhao, J., and Ding, X. (2019). In situ investigation and numerical simulation of the failure depth of an inclined coal seam floor: a case study. Mine Water Environ., 1–9. doi:10.1007/s10230-019-00596-3
Mo, S., Tutuk, K., and Saydam, S. (2019). Management of floor heave at Bulga Underground Operations–A case study. Int. J. Min. Sci. Technol. 29 (1), 73–78. doi:10.1016/j.ijmst.2018.11.015
Shan, R., Li, Z., Wang, C., Meng, C., Wei, Y., Li, Y., et al. (2022). Study on distortion energy and stability of gob floor based on stress deviator field. Energy Sci. and Eng. 10 (8), 2756–2771. doi:10.1002/ese3.1165
Shuyun, Z., Zhenquan, J., Dingtao, C., Qiang, S., and Chaowei, Y. (2013). Restriction function of lithology and its composite structure to deformation and failure of mining coal seam floor. Nat. hazards 68, 483–495. doi:10.1007/s11069-013-0623-0
Sun, J., Wang, L., and Zhao, G. (2019). Stress distribution and failure characteristics for workface floor of a tilted coal seam. KSCE J. Civ. Eng. 23, 3793–3806. doi:10.1007/s12205-019-0786-7
Tao, K., and Zheng, W. (2018). Real-time damage assessment of hydrous sandstone based on synergism of AE-CT techniques. Eng. Fail. Anal. 91, 465–480. doi:10.1016/j.engfailanal.2018.04.046
Wu, J., Jing, H., Gao, Y., Meng, Q., Yin, Q., and Du, Y. (2022). Effects of carbon nanotube dosage and aggregate size distribution on mechanical property and microstructure of cemented rockfill. Cem. Concr. Compos. 127, 104408. doi:10.1016/j.cemconcomp.2022.104408
Wu, J., Wong, H. S., Zhang, H., Yin, Q., Jing, H., and Ma, D. (2024). Improvement of cemented rockfill by premixing low-alkalinity activator and fly ash for recycling gangue and partially replacing cement. Cem. Concr. Compos. 145, 105345. doi:10.1016/j.cemconcomp.2023.105345
Wu, J., Yang, S., Williamson, M., Wong, H., Bhudia, T., Pu, H., et al. (2025a). Microscopic mechanism of cellulose nanofibers modified cemented gangue backfill materials. Adv. Compos Hybrid. Mater 8, 177. doi:10.1007/s42114-025-01270-9
Wu, J., Yang, S., Wong, H. S., Yin, Q., Zhang, H., Chen, W., et al. (2025b). Reinforcement mechanisms of cellulose nanofibers on cemented rockfill: macroscopic, microscopic and molecular insights. Constr. Build. Mater. 466, 140192. doi:10.1016/j.conbuildmat.2025.140192
Xu, X., Peng, S., and Yang, F. (2018). Development of a ground penetrating radar system for large-depth disaster detection in coal mine. J. Appl. Geophys. 158, 41–47. doi:10.1016/j.jappgeo.2018.07.006
Xu, Y., Pan, K., and Zhang, H. (2019). Investigation of key techniques on floor roadway support under the impacts of superimposed mining: theoretical analysis and field study. Environ. Earth Sci. 78 (15), 436. doi:10.1007/s12665-019-8431-9
Xuyang, C., Xufeng, W., Dongsheng, Z., Dongdong, Q., Ya, W., Jiyao, W., et al. (2022). Creep and control of the deep soft rock roadway (DSRR): insights from laboratory testing and practice in Pingdingshan mining area. Rock Mech. Rock Eng. 55, 363–378. doi:10.1007/s00603-021-02670-1
Yang, R., Ma, T., Kang, Y., Du, H., Xie, S., and Ma, D. (2025). A fractal model for gas-water relative permeability in inorganic shale considering water occurrence state. Fuel 381, 133664. doi:10.1016/j.fuel.2024.133664
Yu, S., Zhang, X., Zhang, B., and Kong, B. (2020). Research on inversion and application of failure depth of coal seam roof and floor based on triangular network acoustic CT tomography. Environ. Earth Sci. 79 (13), 337. doi:10.1007/s12665-020-09090-4
Zeng, W., Huang, Z., Wu, Y., Li, S., Zhang, R., and Zhao, K. (2020). Experimental investigation on mining-induced strain and failure characteristics of rock masses of mine floor. Geomatics, Nat. Hazards Risk 11 (1), 491–509. doi:10.1080/19475705.2020.1734102
Zhang, J. C., and Liu, T. (1990). On depth of fissured zone in seam floor resulted from coal extraction and its distribution characteristics. Mei T'an Hsueh Pao J. China Coal Society 15 (2). doi:10.13225/j.cnki.jccs.1990.02.00
Zhang, S., Zhang, D., Feng, G., and Chi, M. (2024). Modelling method of heterogeneous rock mass and DEM investigation of seepage characteristics. Geomechanics Geophys. Geo-Energy Geo-Resources 10 (1), 46. doi:10.1007/s40948-024-00744-2
Zhang, W., Zhang, D., Qi, D., Hu, W., He, Z., and Zhang, W. (2018). Floor failure depth of upper coal seam during close coal seams mining and its novel detection method. Energy Explor. and Exploitation 36 (5), 1265–1278. doi:10.1177/0144598717747622
Zhou, W., Zhang, P., Wu, R., and Hu, X. (2019). Dynamic monitoring the deformation and failure of extra-thick coal seam floor in deep mining. J. Appl. Geophys. 163, 132–138. doi:10.1016/j.jappgeo.2019.02.007
Zhu, S., Jiang, Z., Zhou, K., Peng, G., and Yang, C. (2014). The characteristics of deformation and failure of coal seam floor due to mining in Xinmi coal field in China. Bull. Eng. Geol. Environ. 73, 1151–1163. doi:10.1007/s10064-014-0612-x
Zhu, S., Liu, R., Zhang, S., and Hu, D. (2016). Characteristics of deformation and failure of deep coal seam floor affected by fully mechanized mining. Geotechnical Test. J. 39 (1), 20150042–20150112. doi:10.1520/gtj20150042
Keywords: multi-layered floor, apparent resistivity, plastic slip theory, failure depth, failure characteristics
Citation: Kong Z, Chen X, Wang X, Zhang D, Chen L and Guo S (2025) Theory and numerical simulation study on the plastic slip failure mechanism of multi-layered coal seam Floors-A case analysis. Front. Earth Sci. 13:1563202. doi: 10.3389/feart.2025.1563202
Received: 19 January 2025; Accepted: 25 March 2025;
Published: 16 April 2025.
Edited by:
Hao Shi, Anhui University of Science and Technology, ChinaReviewed by:
Wenshuai Li, Shandong University of Science and Technology, ChinaBailong Ma, Fuyang Normal University, China
Copyright © 2025 Kong, Chen, Wang, Zhang, Chen and Guo. This is an open-access article distributed under the terms of the Creative Commons Attribution License (CC BY). The use, distribution or reproduction in other forums is permitted, provided the original author(s) and the copyright owner(s) are credited and that the original publication in this journal is cited, in accordance with accepted academic practice. No use, distribution or reproduction is permitted which does not comply with these terms.
*Correspondence: Xuyang Chen, Y2hlbnh1eWFuZ0BjdW10LmVkdS5jbg==