 Jianfeng Wang1,2
 Jungang Niu3
 Chao Yang4*Wenmin Jiang1,2Yun Li1,2Yijun Zheng1,2
 Yuhong Liao1,2Dingyu Feng4
 Ping’an Peng1,2Yongqiang Xiong1,2
- 1State Key Laboratory of Organic Geochemistry, Guangzhou Institute of Geochemistry, Chinese Academy of Sciences, Guangzhou, China
- 2CAS Center for Excellence in Deep Earth Science, Guangzhou, China
- 3Gansu No. 212, Geological Party for Nuclear Industry, Wuwei, China
- 4Guangzhou Institute of Energy Conversion, Chinese Academy of Sciences, Guangzhou, China
Shale is a typical source rock and reservoir rock for oil and gas production. Accurate estimation of its mechanical properties and creep behavior is challenging due to the multiphase and multiscale structure of this rock. In this study, we conducted X-ray diffraction, organic geochemical analysis, and nanoindentation tests on Niutitang shale samples collected from outcrop in the north of Sichuan Province and a shallow well drilled in Guizhou Province, China, to investigate Young’s modulus (E) and contact creep modulus (C) at different scales. To upscale these parameters, we used the Voigt-Reuss-Hill (VRH) model; and analyzed the controlling factors on the variations of mechanical and creep properties for these shales. The results showed that the E of organic matter of the Niutitang Formation shales varied slightly, while the hardness (H) and C varied widely. Grid nanoindentation and k-means clustering revealed three mechanically distinct clusters for these Niutitang Formation shales, with the softest phase being the clay matrix phase, with E, H, and C values of 26.6–52.0, 1.7–3.1, and 869–1945 GPa, respectively. Based on the VRH model, the E and C values of the Niutitang shale are 25.8–43.6 and 1131–2643 GPa, respectively. The constituent content has a relatively stronger controlling effect on the contact creep modulus than the Young’s modulus for the Niutitang Formation shale. This study will help us optimize hydraulic fracture design and evaluate well stability, as well as assess the fracturability and recovery potential of Niutitang shale reservoirs, thereby guiding the efficient development of its shale gas.
1 Introduction
Due to advances in technologies such as horizontal drilling and multistage hydraulic fracturing, unconventional shale oil and gas production has received considerable attention (Wang et al., 2017; Yuan and Wang, 2018). The successful application of these methods requires an adequate understanding of the mechanical and creep properties of shale. Traditional macroscopic mechanical testing methods, such as uniaxial and triaxial compression tests, help to understand the macroscopic mechanical or creep properties of rocks. However, they require relatively large and high quality core samples, and coring is difficult and costly (Alramahi and Sundberg, 2012; Sone and Zoback, 2013), and cannot reflect the multiphase heterogeneous properties of shale mechanics. Therefore, nanoindentation techniques have been gradually introduced into the micromechanical characterization of geological rocks (Kumar et al., 2012a; Ulm and Abousleiman, 2006; Wang et al., 2022a; Wang et al., 2022b; Yang et al., 2020).
Nanoindentation technology was initially used mainly to obtain mechanical parameters of rock composition phases (Zeszotarski et al., 2004). In theory, the mechanical or creep data measured by nanoindentation can only represent the microscopic scale of rock mechanics and cannot be directly used as the macroscopic mechanics of rocks. As a result, some scientists have subsequently conducted scale upscale studies on the mechanics or creep of rock micromechanics (Charlton et al., 2021; Goodarzi et al., 2017; Li et al., 2018; Liu K. et al., 2018; Liu et al., 2024a; Liu et al., 2024b; Liu et al., 2024c; Luo et al., 2021; Wang et al., 2023). In particular, they used homogenization models established for polymers in materials science, such as Mori-Tanaka (MT) (Mori and Tanaka, 1973), Self-Consistency (SC) (Berryman, 1980) and Voigt-Reuss-Hill Mean (VRH) (Hill, 1952), to estimate rock mechanics or creep properties at the macroscopic scale, and these models have a certain feasibility. In addition, the mechanical behavior of organic-rich shales is closely related to their composition and structure. For the multi-scale structure of shale, it can be divided into four levels from the nanoscale to the macroscale (see the multiscale structure in Figure 1) (Wang et al., 2024b). i.e., level III refers to the centimeter shale sample; Level II refers to the clay matrix (or clay minerals) mixed with brittle minerals (e.g., silt size quartz or feldspar grains); Level I refers to the organic matter (OM), porous clay minerals, and clay matrix in the shale; Level 0 refers to the unit of OM or clay minerals. Among them, the OM in shale can not only produce oil/gas, but also affect the macroscopic mechanical behavior of the shale, especially for shale rich in organic matter (e.g., total organic carbon (TOC) content ≥10%). In addition, shale is formed by the compaction, dehydration and cementation of clay minerals. Fine grained plate-like clay mineral particles can form a clay matrix (Level II in Figure 1) with other relatively smaller sized minerals such as carbonate minerals, pyrite and OM (Hornby et al., 1994; Liu Y. et al., 2022; Luo et al., 2020; Luo et al., 2021). The clay matrix can also greatly influence the mechanical and creep properties of blocky shales. Therefore, a comprehensive study of the mechanical and creep properties of OM, clay matrix, and the shale as a whole at the micro-scale is crucial for the development of physical rock mechanics models.
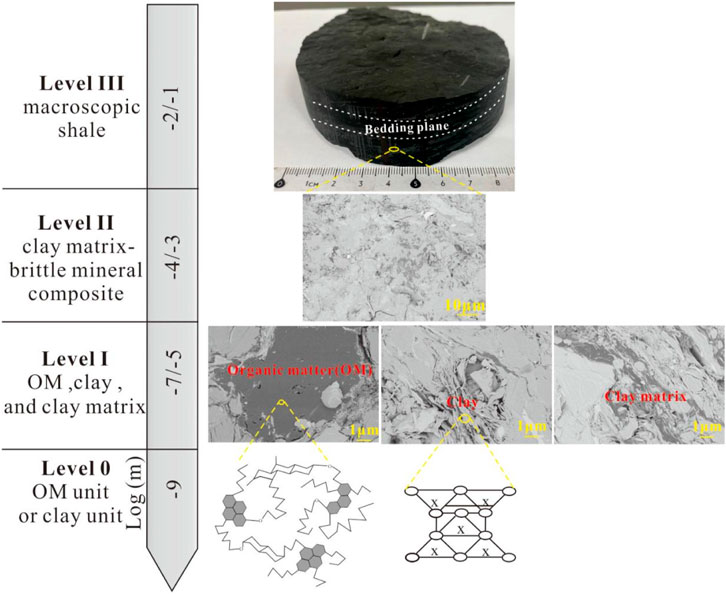
Figure 1. Schematic diagram of multi-scale structure for the Niutitang Formation shale. From top to bottom, level III refers to the centimeter shale sample, and the bedding plane is approximately horizontal. Level II refers to the clay matrix (or clay minerals) mixed with brittle minerals (e.g., silt size quartz or feldspar grains); Level I refers to the OM, porous clay minerals, and clay matrix in the shale; Level 0 refers to the unit of OM or clay minerals. Modified from Wang et al. (2024b).
Previous work has been carried out on the Young’s modulus (E) or contact creep modulus (C) of organic matter, clay matrix and the bulk shale from upscaling method, including Bakken Formation (Li et al., 2018); Wufeng-Longmaxi Formation (Wang et al., 2023); Marcellus, Haynesville, Antrim, Barnett, and Woodford formation (Slim et al., 2019), Posidonia formation (Charlton et al., 2021) and so on. However, for the over mature and high organic carbon content Niutitang shale, previous studies have mostly focused on the macromechanical properties through compressive strength and acoustic emission tests to discuss the main controlling factors of the geomechanical properties for this formation (He et al., 2022; Liu et al., 2018b). There is little research on the micro-mechanics (Lei et al., 2025) or creep behavior, especially the transition from micro-creep in components to micro-creep behavior in the bulk shale, which is almost blank. On the one hand, unlike shale gas formations located in tectonically stable regions, such as North America, the overmature marine Niutitang shale gas reservoirs in southern China have been altered by numerous tectonic events over multiple time periods, resulting in the formation of a significant number of intricate deformation structures, while being one of the key layers for shale gas exploration in the Middle and Upper Yangtze regions and an important reservoir for shale gas resources in China (Yu et al., 2022; Zou et al., 2013). On the other hand, due to the multi-scale heterogeneity of the shale and the easy fragmentation of the black shale in the Niutitang Formation during sampling, the understanding of the mechanical and creep properties of different types of Niutitang Formation shale is limited. Therefore, from a microscopic perspective, to obtain the variation of mechanical properties and creep behavior for OM, the clay matrix and bulk shale are crucial for the efficient development of this formation.
In this work, eight shales from the Niutitang Formation, China, were analyzed using a combination of experimental, statistical, and theoretical methods. High resolution optical microscopy, X-ray diffraction (XRD) and nanoindentation measurements, and mechanical upscaling based on the VRH model were carried out. The objectives of this study are 1) to obtain the mechanical properties and creep behavior of OM, clay matrix and upscaling mechanical parameters of Niutitang shale from the VRH model, and 2) to discuss the effect of mineralogy and organic matter on the mechanical properties and creep behavior of Niutitang shale samples. This study will help us to optimize hydraulic fracture design and evaluate well stability, as well as assess the fracturability and recovery potential of Niutitang shale reservoirs, thereby guiding the efficient development of its shale gas.
2 Materials and method
2.1 Shale samples
Four outcrop shale samples (named GY-12, YB-25, YB-27, and FC-35) and four core shale samples (named JDS-55a, JDS-77b, JDS-78b, and JDS-80b, as the samples were collected continuously every 0.5 m, the letters “a” and “b” appended to the value are merely specific designations to distinguish between different samples) belonging to the Niutitang Formation were collected from the north of Sichuan Province and a shallow well was drilled in Jindingshan Town, Huagang District, Zunyi City, Guizhou Province, China, respectively. The outcrop samples can usually reflect the geological characteristics of the surface or near surface, while the core samples can provide the geological information of the deep subsurface. This combination can comprehensively cover the shale characteristics at different depths and geological conditions. For the shale samples, the numbers after JDS represent the depth (the unit is m) of the collected samples. The same shale samples were used in previous studies (Fang et al., 2022; Zheng et al., 2022).
These shale samples were divided into two parts, one of which was partially crushed to a mesh size of about 200 and dried for X-ray diffraction (XRD) and Rock-Eval analysis. The other part of the powder sample was treated with 5% hydrochloric acid (HCl) at 80°C to remove the carbonates, and then washed to neutral with deionized water, and finally measured for total organic carbon (TOC). The detailed procedures that related to the determination of TOC, XRD analysis and Rock-Eval analysis are given in our previous studies (Zheng et al., 2022). The other part of the shale sample was subjected to polishing treatment. We collected shale samples oriented perpendicular to their bedding planes. These samples were first cut into thin sections of approximately 1 mm thickness. They were then impregnated and hardened with resin. To achieve a smooth surface, we used silicon carbide abrasive discs in a range of grits, from a coarse 50 grit to a very fine 2000 grit, for grinding and polishing. In addition, we used diamond slurry with particle diameters of 9, 3 and 1 micron for a meticulous final polish (Yang et al., 2020).
2.2 Nanoindentation scheme
We performed nanoindentation tests using an Anton Paar TTX NHT3 instrument (Figure 2A) with a diamond Berkovich tip (50–100 nm radius). The system includes a high-resolution microscope (Figure 2B) for precise surface observation and OM location prior to testing. Figure 2C shows a typical optical microscopy image of the shale sample after nanoindentation. Nanoindentation involves pressing a diamond tip into the surface of a material and analyzing the load and depth of contact to determine its mechanical properties. Figure 2D illustrates the nanoindentation process and Figure 2E shows a typical load-displacement curve (P-h curve) divided into loading (10 s), holding (90 s), and unloading (10 s) phases. Both elastic and plastic deformations occur during loading, and elastic recovery occurs during unloading. The P-h curve can be used to calculate the hardness (H) and reduced Young’s modulus (Er) of a material:
where,
where Ei = 1,140 GPa and νi = 0.07, respectively. The Young’s modulus (E) and Poisson’s ratio (ν) of the tested samples can be calculated. In this research, the Poisson’s ratio of the rock samples was assumed to be 0.3 based on previous studies (Li et al., 2018). Furthermore, if the Poisson’s ratios of the shale samples varied between 0.05 and 0.3, this would introduce an uncertainty of 8% in the measured Young’s modulus (Kumar et al., 2012b). Previous studies have shown that hardness and Young’s modulus decreased by less than 15% and 2.5%, respectively, after a 180- second holding time compared to a 5-s holding time, and that a 10-s unloading time is short enough to measure an indentation modulus unbiased by viscous effects (Vandamme and Ulm, 2013). Therefore, we report the hardness and Young’s modulus after a 90-second holding time and 10-second unloading time.
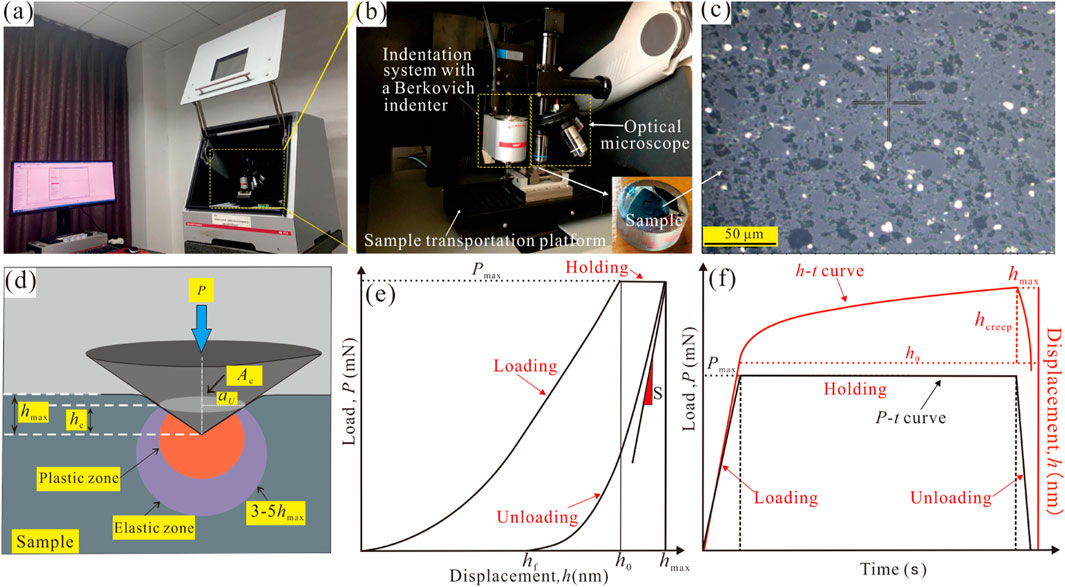
Figure 2. (a) Anton Paar TTX NHT3 instrument, (b) the main components of the test instrument, with the polished sample, (c) a typical optical microscopy image of the Niutitang Formation shale sample. (d) schematic diagram of the indentation profile, (e) Load–displacement (P–h) curve, (f) load-time (P-t) with displacement-time (h-t) curves, the applied peak load (Pmax) produces the maximum displacement (hmax). The elastic-plastic deformation zone is approximately 3–5 times the maximum displacement (Larsson et al., 1996). αU is the contact radius. hf, and h0 are the residual displacement and the displacement at the beginning of the holding stage during nanoindentation, respectively. hcreep is the increase in displacement during the holding stage. Modified from Wang et al. (2024b).
Figure 2F shows the load profile, which illustrates how the load varies with loading time during the creep test. Creep displacement (hcreep) is defined as the increasing displacement that occurs during the holding stage of the test (as shown in Figure 2F). Therefore, increasing the dwell time is critical when performing creep tests. In this study, a holding time of 90 s was used to obtain an accurate contact creep modulus (Liu et al., 2021). A higher contact creep modulus correlates with a reduced creep rate in the material. After achieving thermal equilibrium at room temperature (25 °C) for more than 2 hours, the thermal drift was less than 0.01 nm/s. Furthermore, due to the unique design of the Anton Paar TTX NHT3 instrument, which includes a reference ring, the thermal drift was automatically corrected to ensure data stability. A maximum load of 1 mN was applied to observe changes in the mechanical properties of OM, which helps to mitigate the influence of both substrate and size effects (Wang et al., 2022a; Yang et al., 2020; Yang et al., 2023).
2.3 Grid nanoindentation
The grid nanoindentation experiment was performed using a matrix tailored to the size of the OM, applying a peak load of 1 mN (shown in Figure 3A). To determine the Young’s modulus or contact creep modulus of three different mineral phases, an array of 15 × 15 indentations was created, with a spacing of 25 μm between adjacent indentations, using a peak load of 8 mN (Liu et al., 2021). Phase I is assumed to be the clay matrix (shown in Figure 3B). The representative elemental area (REA) of the rock measure approximately 380 × 380 μm2, which is large enough to evaluate numerous minerals and other phases within the shale, ensuring a statistically unbiased characterization (Liu et al., 2018a). Prior to nanoindentation testing, a standard fused silica sample was used to calibrate the tip shape, ensuring the accuracy of the mechanical data obtained. The contact creep modulus (C) was determined using a formula derived from previous research (Liu et al., 2021; Slim et al., 2019; Vandamme and Ulm, 2009; Wang et al., 2023).
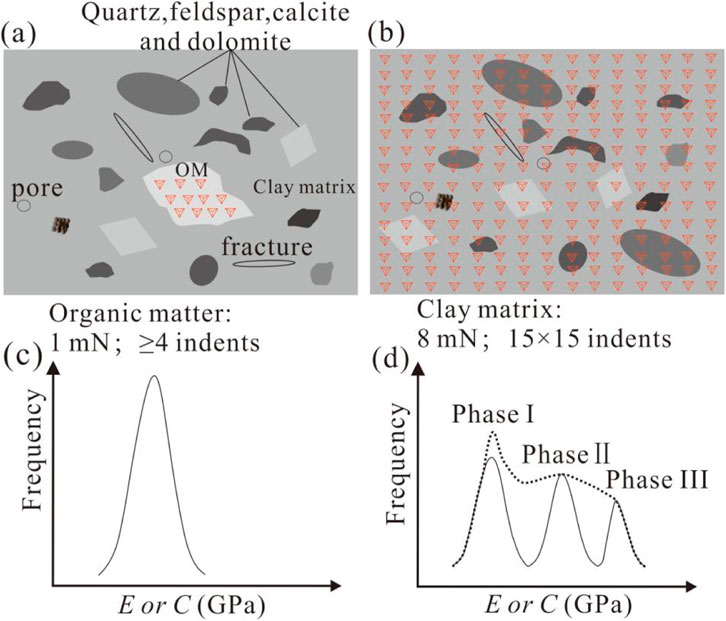
Figure 3. The schematic diagram for obtaining the Young’s modulus (E) and contact creep modulus (C) of organic matter (OM) (a,c) and clay matrix (b,d). (a) refers to indents produced by a peak load of 1 mN and located only on the OM. (b) refers to indents produced by a peak load of 8mN, i.e., a 15 × 15 indentation pattern, located on different minerals. These indents can give E or C values for three different phases. We assume that Phase Ⅰ represents the clay matrix (d). Modified from Wang et al. (2024b).
Given the multiscale heterogeneity and mineralogical diversity of the rocks, we first examined their surfaces using a high-resolution optical microscope to identify representative elemental area (REAs) for testing. These selected areas were chosen to reflect the overall mineralogical characteristics of the rock surface, while avoiding regions with micro- or macro-fractures and those overly rich in specific minerals such as quartz or calcite. To mitigate boundary effects, indentations on the edge of the specimen were positioned at least 500 μm from the perimeter of the specimen. Occasionally, due to rock heterogeneity, some load-displacement curve data may appear inaccurate. Consequently, not all nanoindentation results can be used for upscaling calculations. Instead, at least 200 valid indentations from each sample were used for the upscaling analysis.
2.4 K-mean clustering
Shale is composed of different mineral phases. For the complex natural shale rock, the mechanical property of a specific phase is not a constant value, so we used the k-means clustering algorithm to classify clusters and determine the mechanical properties of different phases. To obtain reliable phase-specific properties, we set the number of clusters to three (K = 3), representing soft, medium, and hard phases. We then applied k-means clustering to the valid H, E, and C data. The mean of each cluster, called the cluster “centroid” was taken as representative of each class. The detailed calculation method can be found in the previous studies (Hartigan and Wong, 1979).
2.5 Voigt-Reuss-Hill average (VRH) upscaling method
The Voigt-Reuss-Hill (VRH) mean provides a reliable approach to estimating the modulus of elasticity in multiphase composites (Hill, 1952). For heterogeneous rocks with j different phases, the Voigt upper limit can be derived by assuming uniform strain throughout. Conversely, the Reuss lower limit is obtained by assuming uniform stress throughout the aggregate. These limits can be calculated using specific formulations:
where k and Ej are the number of distinct phases and elastic modulus of the jth phase with a volumetric fraction of fj, respectively. Then the effective Young’s modulus of the bulk shale can be estimated by:
The upscaled contact creep modulus, CVRH, can be determined by analogy to the method used to upscale the bulk shale effective Young’s modulus:
where CVoigt and CReuss are the contact creep modulus of Voigt upper bound and Reuss lower bound, respectively.
3 Results
3.1 Rock mineralogy and geochemistry characteristics
Mineral composition and geochemical parameters including TOC content, vitrinite reflectance equivalent (EqVRo %), and the total hydrocarbons generated by thermal cracking of nonvolatile organic matter (S2) are shown in Table 1. Quartz and clay minerals are the major constituents of both the outcrop and core shale samples. The quartz varies from 24.1% to 74.0% and clay minerals from 19.9% to 43.1% of sample. Feldspar is the third major component in shale. In addition, the shale samples contained other minerals: calcite (1.3%–4.0%), dolomite (1.5%–4.5%), and pyrite. The TOC values of the Niutitang Formation shale in the JDS-1 well range from 2.0–4.4 wt%, which is relatively higher than those (0.8–3.9 wt%) in the outcropping shales. The EqVRo % values range from 2.90%–3.73% (Fang et al., 2022; Zheng et al., 2022) and the S2 value is nearly 0, suggesting that the Niutitang Formation shales are at an over-mature stage.

Table 1. Geochemical parameters and mineral contents of Niutitang formation shale samples.
Figures 4A–F show the optical micrographs of typical samples to illustrate the microstructure of the shale. The typical shale matrix contains quartz and feldspar, carbonate minerals, and clay matrix. Quartz grains show various irregular shapes with straight and sharp edges, with sizes mostly in the range of 15–40 μm (Figures 4B,D,F). Pyrite generally appears as the form of framboidal aggregates with sizes ranging from 1 to 8 μm (Yang et al., 2020). Clay matrix is a homogenized composite composed of high-density tabular clay particles (illite or chlorite) and relatively small size of grains such as carbonate minerals, pyrite, and organic matter (Liu Y. et al., 2022; Luo et al., 2021). Generally, the intensity of reflected light of shale matrix under the optical microscope is pyrite > silicate > clay matrix. Due to the limitations of the microscope attached to our nanoindentation system, which does not allow clear identification of feldspar and carbonate minerals. Additionally, Samples YB-27 and JDS-77b have much more hard mineral phases (e.g., quartz) than sample FC-35, suggesting much stronger mechanical properties of them. Clay matrix is continuously distributed and acts as a supporting framework in the FC-35 shale rock, while the hard minerals may act as a supporting framework for the other two shale samples.
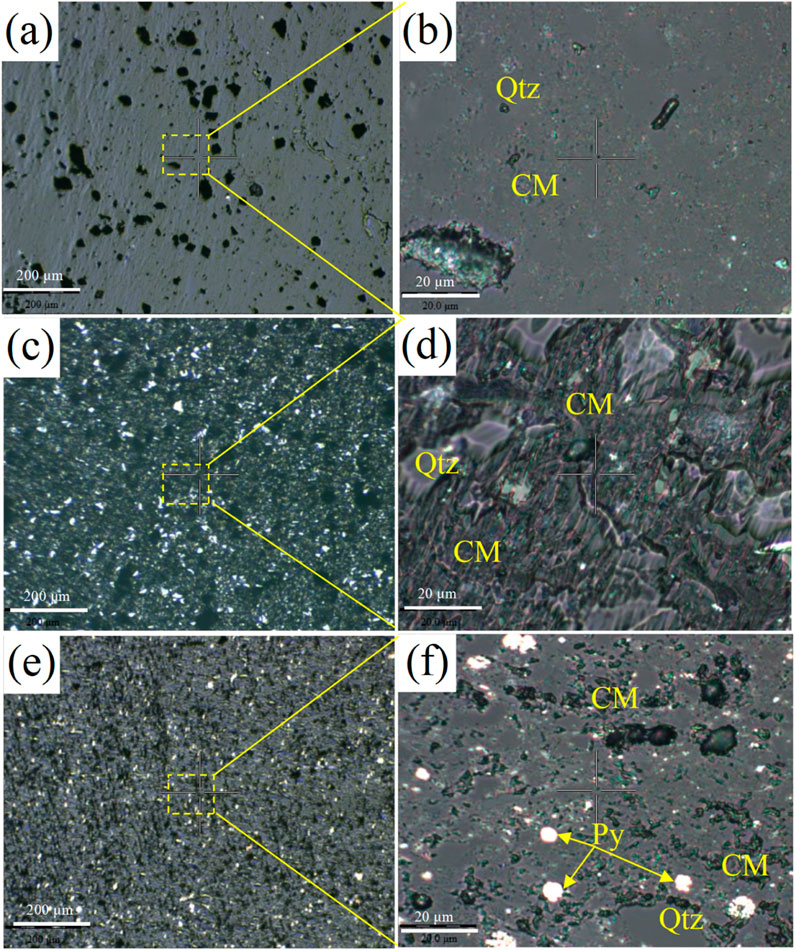
Figure 4. Optical microscopy images of shale matrix shown in different shale samples ((a, b), YB-27, (c, d), FC-35, and (e, f), JDS-77b). Quartz = Qtz, Clay matrix = CM, Pyrite = Py. The yellow rectangle represents the enlarged part.
3.2 Nanoindentation results
3.2.1 Indentation response of organic matter (OM)
Figure 5 shows the typical optical microscope images taken by a nanoindenter at indentation sites on OM in different shale samples. Due to the high maturity of OM in the Niutitang Formation shale, the indentation marks on the organic matter became indistinguishable. Consistent results have been reported for OM at comparable maturity levels (Wang et al., 2022a; Wang et al., 2023; Wang et al., 2024a). The OM in the Niutitang Formation shale is predominantly composed of amorphous OM, which exhibits various morphologies such as banded (Figures 5C,D) or agglomerated (Figure 5B) forms dispersed as amorphous bodies. They are mainly distributed in pores and fractures, and their shapes vary depending on the pore or fracture structure. The larger grains of OM are mainly solid bitumen. Unlike the reflective colors of minerals, the OM exhibits a white reflective color under the nanoindentation microscope, making it easily identifiable. In the FC-35 shale samples, the OM is primarily encapsulated by clay minerals, whereas in the other three samples, the OM is associated with hard minerals (i.e., quartz), which may result in different mechanical behaviors.
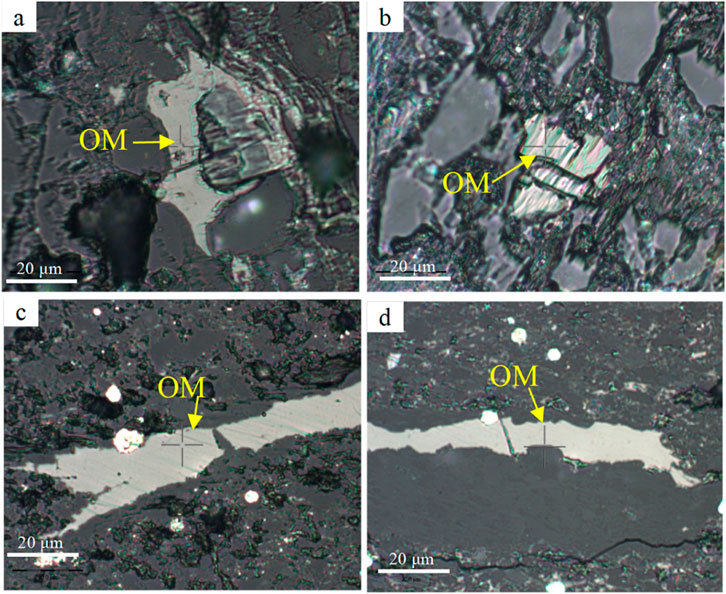
Figure 5. The typical optical microscope images taken by a nanoindenter at indentation sites on organic matter in shale samples, shown in different samples ((a) YB-25, (b) FC-35, (c) JDS-77b, and (d) JDS-80b). OM = organic matter.
Figure 6 shows the load-displacement curve and creep displacement-time curves of organic matter in representative shale samples. For the load-displacement curve, the maximum displacement of organic matter in the JDS-77b shale sample is almost the smallest, about 160 nm, while the displacement of organic matter in the FC-35 sample is the largest, and its distribution range is relatively large, from 250 to 350 nm (Figure 6C). Furthermore, the unloading curve shows a lower degree of unrecoverable deformation in the OM. For all the organic matter, the unrecoverable deformation (i.e., elastic deformation) of their unloading curves is relatively large, especially for YB-25, JDS-77b, and JDS-80A samples, indicating that the deformation of organic matter in over-mature samples is mainly elastic, which is consistent with previous studies (Wang et al., 2023). For the creep displacement, YB-25 has the smallest creep displacement of organic matter in the range of 11–14 nm, while FC-35 sample has the largest creep displacement of organic matter in the range of 25–35 nm. For all the creep displacement-creep time curves, the creep displacement undergoes a rapid increase during the initial phase of the holding stage. However, as the creep time progresses towards its final stage, the creep rate (i.e., dhcreep/dt) stabilizes at a constant value, indicating the emergence of steady-state creep behavior (Wang et al., 2023).

Figure 6. Load-displacement curves of the organic matter in shale samples for (a) YB-25, (c) FC-35, (e) JDS-77b, and (g) JDS-80b, creep displacement-creep time of the organic matter in shale samples for (b) YB-25, (d) FC-35, (f) JDS-77b and (h) JDS-80b. (i) and (j) are the fitting results for YB-25 and FC-35 based on the logarithmic equation (i.e., h(t) = x1ln(1 + t/x2)+x3t + x4), respectively.
Table 2 shows the mechanical and creep parameters of the organic matter in these four samples, and Figures 6I,J are the fitting results for YB-25 and FC-35, respectively, where R2 values are calculated for fitting the logarithmic equation to obtain the contact creep modulus, all of which are greater than 0.99, indicating that the logarithmic equation can be well used to characterize the creep properties of organic matter. The Young’s modulus, hardness, and contact creep modulus of JDS-77b organic matter are the highest, with values of 14.6 ± 0.9, 1.94 ± 0.10, and 2,273 ± 248 GPa, respectively. However, the sample in FC-35 has the lowest values, with values of 8.9 ± 1.5, 0.48 ± 0.13, and 166 ± 49 GPa, respectively. Their contact creep moduli differ by an order of magnitude, mainly due to the fact that the organic matter in the sample is mainly surrounded by the clay matrix. The Young’s modulus, hardness, and contact creep modulus of the outcrop shales (i.e., YB-25 and FC-35) are lower than those of the core shale samples (JDS-77B and JDS-80b) because the latter may have experienced greater compaction during geological evolution. The Young’s modulus of OM (13.12–15.54 GPa) in the Niutitang Formation obtained in this study, which is relatively consistent with those of OM (13.12–15.54 GPa) in the Niutitang Formation calculated by atomic force microscopy at the similar maturity (Lei et al., 2025).
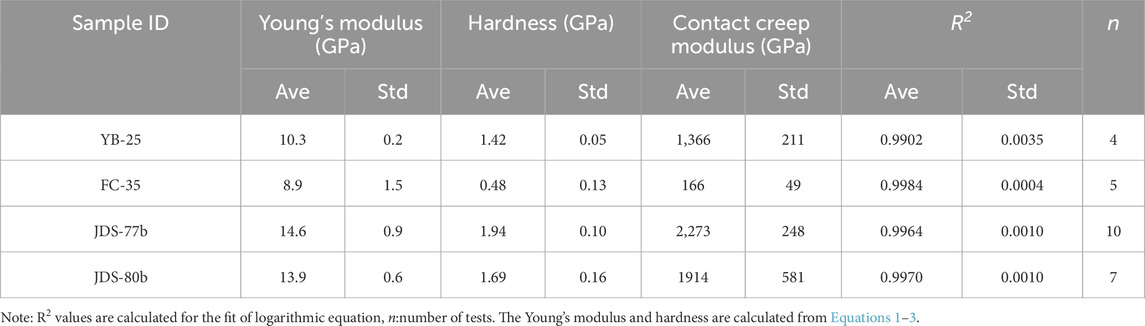
Table 2. Results of nanoindentation tests of the organic matter in shale.
3.2.2 Indentation response of shale matrix
The indentation load-displacement and creep displacement-creep time curves for the typical shale samples (YB-27, FC-35, and JDS-77b) are shown in Figure 7. Figures 7A,C,E illustrate all the curves of load-displacement of the typical shale samples (YB-27, FC-35, and JDS-77b). For the YB-27 shale, the displacement is the smallest, ranging from approximately 200–1,200 nm with the mean displacement of 286.6 ± 127.8 nm, while for the FC-35 shale, the displacement is the largest, ranging from about 200 to 1,500 nm with a mean displacement of 503.7 ± 282.4 nm. Different from those of OM, the load-displacement curves of the three samples show the “pop-in” behavior, which is characterized by a sudden jump of the displacement in the load curve. The “pop in” event may be attributed to crack initiation or the action on the micro- or nano-scale pores in the shale during the experiment (Li et al., 2019; Wang et al., 2022b). For these three samples, the creep displacement of the YB-27 are the smallest, and most of them are less than 20 nm, while those of the FC-35 are the largest, and most of them are larger than 20 nm. It is noted that we can also observe the “pop in” behavior in some of the creep displacement for FC-35 sample, which may also be related to crack initiation in the shale during the experiment. Since the R2 values from the fit of logarithmic equation for the creep displacement is poor (e.g., less than 0.8), these curves cannot be used to calculate the contact creep modulus. For the creep curve, we can also divide them into two stages based on the creep rate: primary creep stage and steady-state creep.
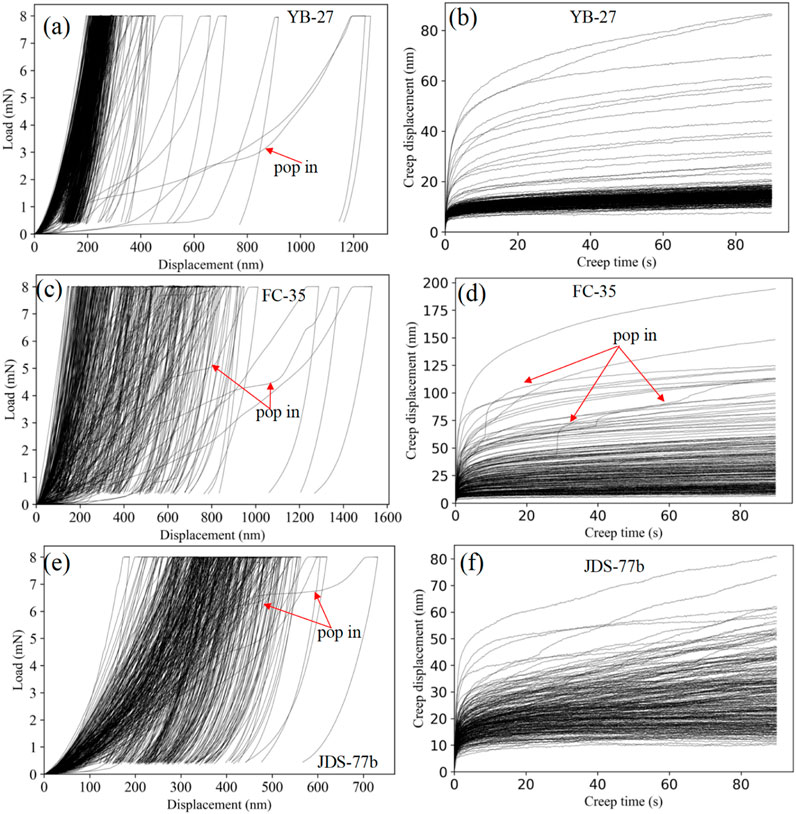
Figure 7. Load-displacement curves of the shale samples for (a) YB-27, (c) FC-35, and (e) JDS-77b, creep displacement-creep time of the shale samples for (b) YB-27, (d) FC-35, and (f) JDS-77b.
3.2.3 Statistical analysis of nanoindentation data
Figure 8 shows the k-mean clustering results for Young’s modulus and contact creep modulus of all the eight samples. The Young’s modulus and contact creep modulus of FC-35 shale are mostly at ∼20–40 GPa and ∼500–1,000 GPa, respectively, while those of the YB-27 shale are mostly at ∼50–70 GPa and ∼4,000–6,000 GPa, respectively. For the other six shale samples, the Young’s modulus and contact creep modulus are mostly at ∼40–60 GPa and ∼1,000–2000 GPa, respectively. Based on the distribution of the indentation Young’s modulus, hardness, and contact creep modulus, and XRD results of mineralogy, we can identify three different clusters (Figure 8), i.e., the soft, medium, and hard mineral clusters. The indentation response of Cluster 1 has a mean Young’s modulus value of 26.6–52.0 GPa, hardness value of 1.9–3.1 GPa, and contact creep modulus value of 869–1945GPa, Cluster 2 has these three mechanical values of 55.6–73.6 GPa, 3.6–8.1GPa and 2,286–6,773 GPa, and those of Cluster 3 are 75.8–101.9 GPa, 7.8–13.6 GPa and 5,228–17718 GPa (Table 3). According to the mineralogy of the shales, the Cluster 1 is the softest and should be the clay matrix, the Cluster 2 should be the mixture of minerals containing calcite, clay mineral-silicate interfaces, clay minerals-carbonate interfaces, or the boundaries of hard minerals. The Cluster 3 with the highest Young’s modulus and contact creep modulus contains the hard minerals, such as quartz, feldspar, dolomite, and pyrite. Except for the YB-27 shale, the largest fraction by k-mean clustering analysis is Cluster 1, ranging from 68.4% to 88.0%. This result suggests that the clay matrix is the main cluster in these shale samples. The Cluster 2 is in the middle of the three clusters, varying from 13.9% to 27%, and finally Cluster 3 with fractions less than 13%. Since the quartz is the major component for the YB-27 shale (as seen in Figures 4A,B), Cluster 2 is the dominant cluster in this sample. The mean Young’s modulus and contact creep modulus of all the indents for these shale samples are also calculated and they are all between those of Cluster 1 and Cluster 3 (Table 4). Since all the samples have large standard deviations for the Young’s modulus and contact creep modulus, and the standard deviation for contact creep modulus for some shale samples (e.g., YB-25 and JDS-55a) is even larger than the mean values (Table 4), the bulk shale sample’s Young’s modulus and contact creep modulus cannot be represented by averaging the mean value at a load of 8 mN. Therefore, it is necessary to upscale mechanical and creep properties from the nanoscale to the macroscale to obtain the physical properties of the bulk shale.
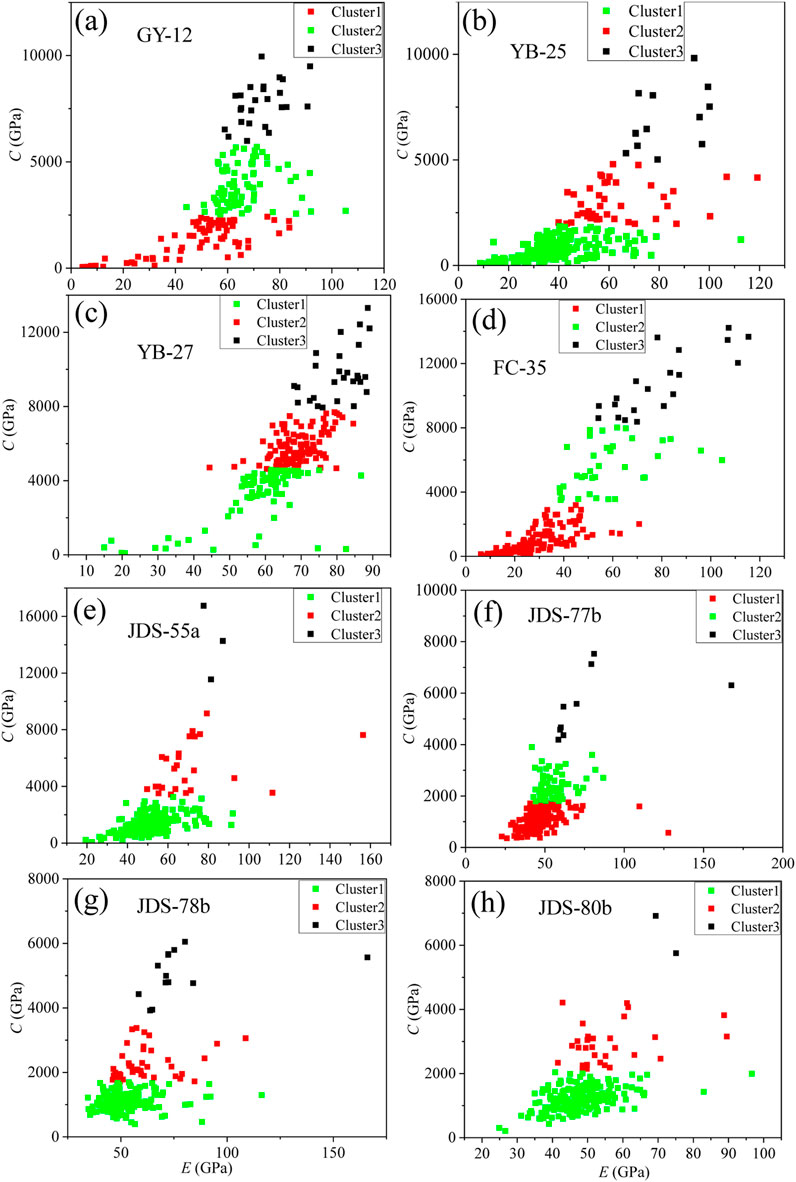
Figure 8. (Color) Clustering analysis results from indentation data of different shales, (a) GY-12, (b) YB-25, (c) YB-27, (d) FC-35, (e) JDS-55a, (f) JDS-77b, (g) JDS-78b, and (f) JDS-80b. Inputs to the clustering analysis are C, and E, (a-h) the C-E plot shows a top view of the k-mean clustering results of three clusters (i.e., phases), Cluster 1, Cluster two and Cluster 3.
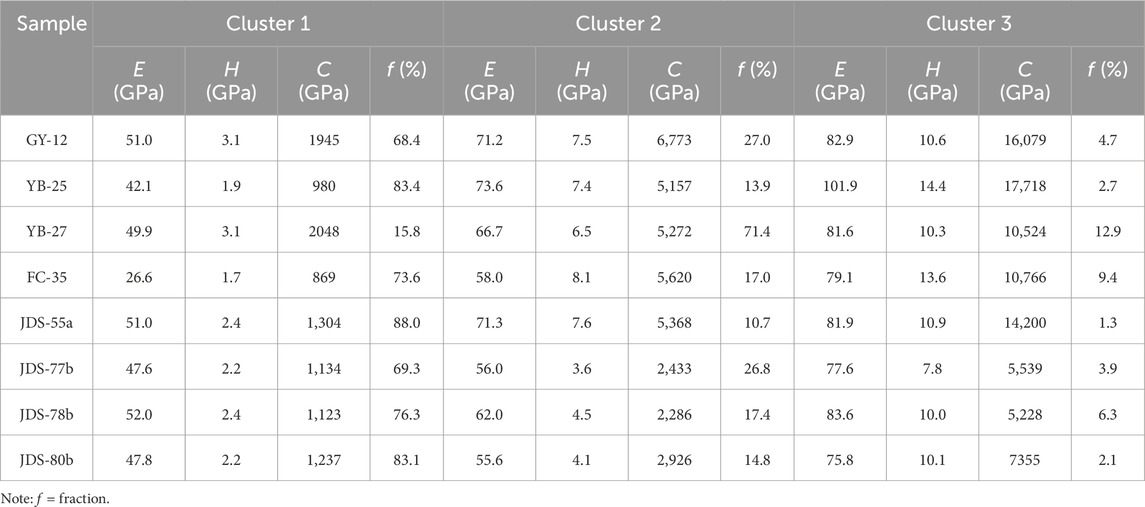
Table 3. k-mean clustering results of mechanical parameters obtained from nanoindentation on shales.
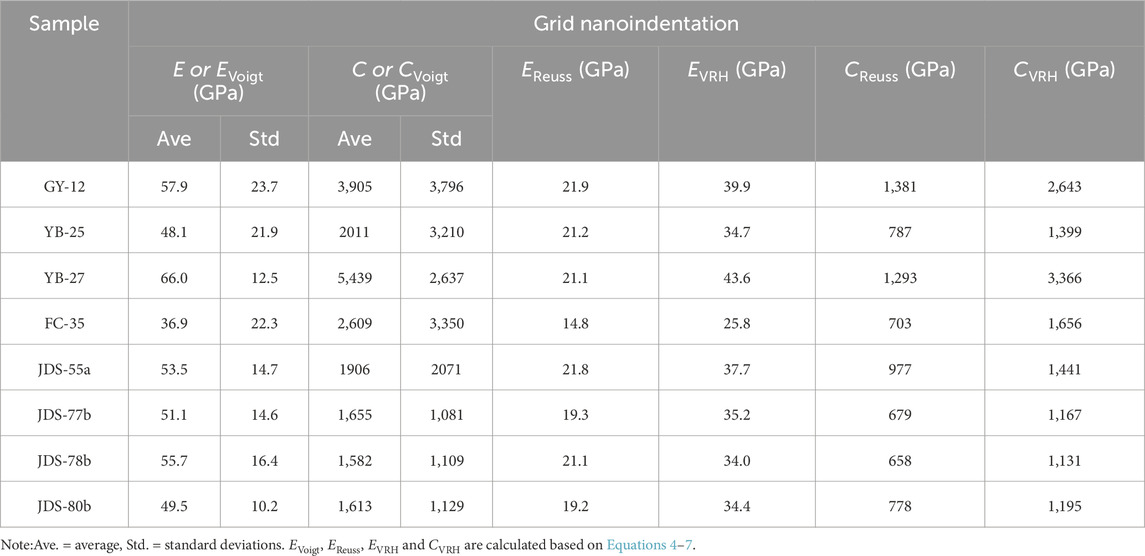
Table 4. Summary of the mean and upscaling values from grid nanoindentation for Young’s modulus and contact creep modulus.
3.3 Upscaling results
We used the VRH model to obtain the Young’s modulus and contact creep modulus of the bulk shale. Table 4 shows the results of upscaling results for all samples. Young’s moduli and contact creep moduli based on the VRH model for all the samples fall between those of the Reuss lower bound (14.8–21.9 GPa and 679–3,366 GPa) and the Voigt upper bound (36.9–66.0 GPa and 1,582–5,439 GPa). Similar to the variation of Young’s modulus and contact creep modulus for clay matrix, GY-12 and YB-27 samples have larger Young’s modulus (39.9–43.6 GPa) and contact creep modulus (2,643–3,366 GPa), while other shale samples have relatively smaller Young’s modulus (25.8–37.7 GPa) and contact creep modulus (1,131–1,656 GPa).
4 Discussion
4.1 Influence factors on mechanical and creep properties of bulk shale
Figures 9A,B show that there is a positive correlation between Young’s modulus and contact creep modulus for both the clay matrix and the bulk shale, which is consistent with the previous studies (Liu K. et al., 2022; Mighani et al., 2019). This may be related to factors such as molecular structure and chemical bonding strength within the material. Furthermore, the Young’s modulus and contact creep modulus values of the bulk shale show a good positive correlation (R2 ≥ 0.64) with those of the clay matrix (i.e., cluster 1 in Figure 8), but show almost no correlation with the values of cluster two and cluster 3. This indicates that the micromechanical and creep properties of the bulk shale are closely related to the corresponding mechanical and creep properties of its clay matrix, while the mechanical and creep parameters of other components have a relatively small effect on the bulk shale. This is consistent with the results of our previous thermal simulation studies (Wang et al., 2024b). The influence of the mechanical and creep parameters of organic matter on the overall mechanical behavior of the shale may be related to the mode of occurrence of organic matter in the shale. Large blocks of organic matter encapsulated by the clay matrix may have a more pronounced weakening effect on the Young’s modulus and contact creep modulus of the shale compared to organic matter encapsulated by hard minerals such as quartz (Table 2).
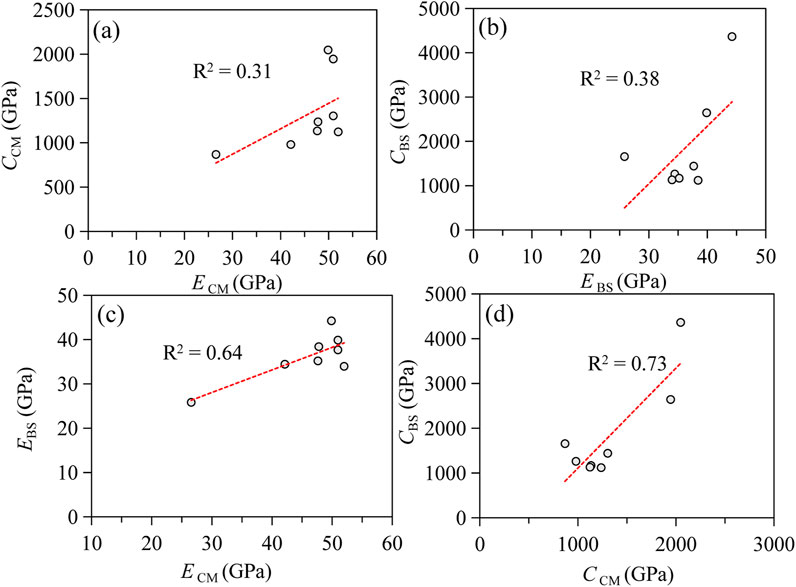
Figure 9. Relationships between CCM and ECM (a), CBS and EBS (b); EBS and ECM (c) and CBS and CCM (d). Young’s modulus of clay matrix (ECM) and bulk shale (EBS); Contact creep modulus of clay matrix (CCM) and bulk shale (CBS).
Figure 10 shows the relationships between upscaled Young’s modulus and contact creep modulus with TOC content, clay + TOC content and QFCP (total quartz, feldspar, carbonate and pyrite) contents. As expected, Young’s modulus and contact creep modulus increase with higher contents of hard minerals, such as quartz, feldspar, carbonate and pyrite, and decrease with higher contents of soft components, such as organic matter and the sum of TOC and clay contents. These results are similar to previous findings (Kumar et al., 2012b; Li et al., 2018; Wang et al., 2024c). Notably, the R2 value for the relationship between contact creep modulus and constituent content is better than that between Young’s modulus and constituent content, suggesting that the constituent content has a relatively stronger controlling effect on the contact creep modulus than Young’s modulus for the Niutitang Formation shale studied. Given the relatively similar maturity of these samples, variations in maturity have little effect on these parameters. However, constituent content has a certain influence on the micromechanical and creep properties of the Niutitang Formation shale. In particular, contact creep modulus show better correlations with organic matter and organic matter/clay mineral (i.e., organic clay composite) content, indicating that the creep properties of the Niutitang Formation are more influenced by organic matter and organic matter/clay mineral than by other constituents.
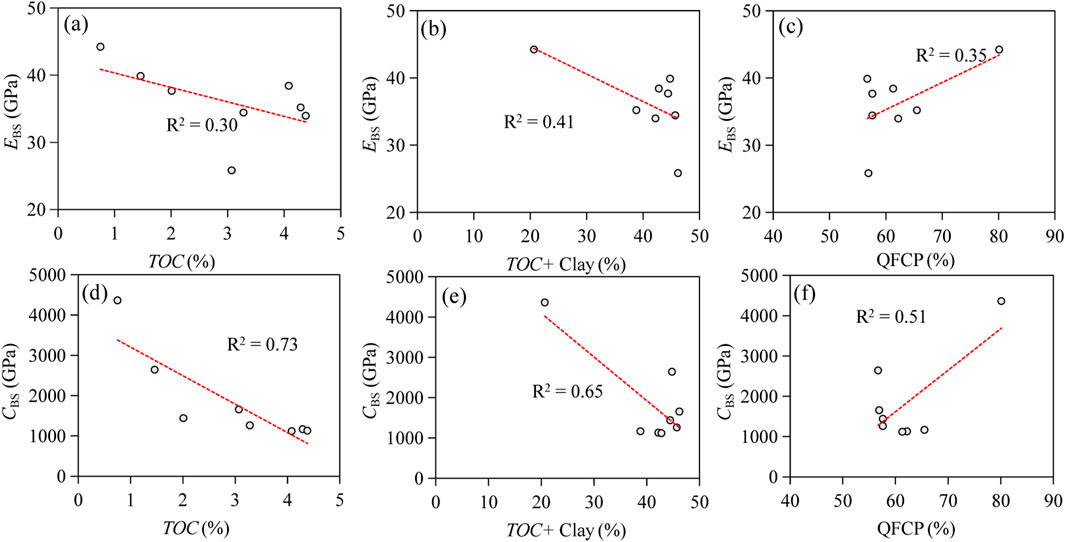
Figure 10. Plots of Young’s modulus of bulk shale (EBS) versus (a) TOC content, (b) TOC + Clay content and (c) QFCP (Quartz + Feldspar + Carbonate + Pyrite) content, contact creep modulus of bulk shale (CBS) versus (d) TOC content, (e) TOC + Clay content and (f) QFCP content.
4.2 Implications and limitations of statistical nanoindentation in this study
Compared to traditional uniaxial/triaxial compression tests and ultrasonic measurements, nanoindentation technology offers a refined analysis of the mechanical and creep properties of various shale components. It not only reflects the multiphase heterogeneous nature of shale mechanics, but also has tremendous potential for predicting reservoir mechanics and creep properties by obtaining relevant mechanical and creep parameters through micromechanical and creep testing of drill cuttings, especially in the absence of intact core samples or in the context of horizontal well coring difficulties. The mechanical and creep performance parameters of organic matter and clay matrix obtained in this research provide excellent baseline parameters for cross-scale upscaling of actual shale mechanical or creep parameters. Furthermore, the Young’s modulus and contact creep modulus obtained by the VRH model are relatively close to those of the Niutitang Formation shale (Liu et al., 2018c) and the similar maturity and similar constituents of the marine shale in China (Wang et al., 2023) obtained by uniaxial compression experiments, respectively, indicating that the grid nanoindentation and upscaling methods have great potential for accurately predicting the macroscopic Young’s modulus and contact creep modulus of shales in the petroleum industry.
However, grid nanoindentation methods have limitations. The results may be influenced by the randomly selected areas in grid nanoindentation tests, as well as the content and distribution of each single-phase component in the composite. Multivariate clustering techniques rely on the mean and standard deviation of the indentation modulus and contact creep modulus values for each mechanical phase. Given the mathematical nature of clustering techniques, the distinction between different mechanical phases is based on the probability of an event belonging to a particular cluster. For example, if a data point lies on the boundary between two clusters, the algorithm determines the result based on the probability of that value occurring in other clusters or in the overall data set. Therefore, the level of uncertainty in statistically based clustering techniques lies in the assignment of a measured mechanical modulus value to a particular phase (Li et al., 2018). In other words, if some indents are located at the edges of single-phase minerals or at interfaces between single phase minerals, they are automatically assigned to the phase with the highest probability, introducing a degree of uncertainty. In addition, this study only obtained the bulk mechanics and creep performance of shale are upscaled by the VRH method. However, due to the complexity of shale composition, the effects of pores and fractures are not considered, and the bulk mechanics and creep properties obtained by this simple upscaling method still need to be compared and validated with macroscopic uniaxial/triaxial compression tests. More accurate upscaling methods are needed in the future to obtain the bulk mechanics and creep properties of shales.
5 Conclusion
In this study, eight shale rocks from Niutitang formation, China, were analyzed using a combination of experimental, statistical, and theoretical methods. High-resolution optical microscopy, XRD, and nanoindentation measurements, and mechanical upscaling based on the VRH model were conducted. The following conclusions can be drawn:
(1) The organic matter Young’s modulus of the shales in the Niutitang formation varies slightly, from 8.9 to 14.6 GPa, while the hardness and contact creep modulus vary widely, from 0.8 to 1.94 GPa, and 166–2,273 GPa, respectively.
(2) Grid nanoindentation and k-means clustering revealed three mechanically distinct clusters for these Niutitang formation shales, with the softest phase being the clay matrix phase, with Young’s modulus, hardness and contact creep modulus values of 26.6–52.0, 1.7–3.1 and 869–1945 GPa, respectively.
(3) According to the VRH model upscaling results, the Young’s modulus and contact creep modulus values of Niutitang shale are 25.8–43.6 and 1,131–2,643 GPa, respectively. There is a positive correlation between Young’s modulus and contact creep modulus values.
(4) Constituent content has a relatively stronger controlling effect on the contact creep modulus than Young’s modulus for the Niutitang Formation shale.
These results showed that the grid nanoindentation methods combined with k-mean clustering can provide a reliable assessment of the mechanical properties and creep behavior of shales from the nano/micro scale (e.g., organic matter and clay matrix) and can also predict the macroscopic behavior of shales. This study demonstrates the great potential of nanoindentation for the assessment of mechanical properties and creep behavior in the petroleum industry. Future research can develop models to accurately predict the macroscopic mechanical and creep properties of shale by considering the shape, size and contact relationship of particles, as well as the effects of pores and fractures.
Data availability statement
The original contributions presented in the study are included in the article/supplementary material, further inquiries can be directed to the corresponding author.
Author contributions
JW: Data curation, Formal Analysis, Funding acquisition, Investigation, Methodology, Visualization, Writing–original draft, Writing–review and editing. JN: Methodology, Writing–original draft. CY: Data curation, Funding acquisition, Investigation, Methodology, Resources, Visualization, Writing–original draft, Writing–review and editing. WJ: Methodology, Data curation, Writing–review and editing. YL: Data curation, Methodology, Writing–review and editing. YZ: Data curation, Methodology, Writing–review and editing. YhL: Data curation, Methodology, Writing–review and editing. DF: Investigation, Visualization, Writing–review and editing. PP: Supervision, Writing–review and editing. YX: Methodology, Supervision, Writing–review and editing.
Funding
The author(s) declare that financial support was received for the research, authorship, and/or publication of this article. This research was supported by the Basic and Applied Basic Research Project of Guangzhou City (Grant No. 2023A04J0208), the China Postdoctoral Science Foundation (2024M763277), the Postdoctoral Fellowship Program of CPSF (Grant No. GZC20241735), National Natural Science Foundation of China (Grant No. 42272182 and Grant No. 41802165), and the Natural Science Foundation of Guangdong Province (Grant No. 2023A1515030280).
Acknowledgments
We would like to express our gratitude to Dr. Yangcheng Zheng for his help with the scripts written in Python for fitting creep curves. We also appreciate Editor Dr. Guoxi Cheng and anonymous reviewers for their constructive comments and suggestions that significantly improved this manuscript. This is contribution No.IS-3619 from GIGCAS.
Conflict of interest
The authors declare that the research was conducted in the absence of any commercial or financial relationships that could be construed as a potential conflict of interest.
Generative AI statement
The authors declare that no Generative AI was used in the creation of this manuscript.
Publisher’s note
All claims expressed in this article are solely those of the authors and do not necessarily represent those of their affiliated organizations, or those of the publisher, the editors and the reviewers. Any product that may be evaluated in this article, or claim that may be made by its manufacturer, is not guaranteed or endorsed by the publisher.
References
Alramahi, B., and Sundberg, M. I. (2012). “Proppant embedment and conductivity of hydraulic fractures in shales,” in Paper presented at the 46th U.S. Rock mechanics/geomechanics symposium.
Berryman, J. G. (1980). Long-wavelength propagation in composite elastic media II. Ellipsoidal inclusions. J. Acoust. Soc. Am. 68 (6), 1820–1831. doi:10.1121/1.385172
Charlton, T. S., Goodarzi, M., Rouainia, M., Aplin, A. C., and Cubillas, P. (2021). Effect of diagenesis on geomechanical properties of organic-rich calcareous shale: a multiscale investigation. J. Geophys. Res. Solid Earth 126 (7), 1–23. doi:10.1029/2020JB021365
Fang, X., Geng, A., Liang, X., Cheng, B., Li, Y., Jiang, W., et al. (2022). Comparison of the ediacaran and cambrian petroleum systems in the tianjingshan and the micangshan uplifts, northern sichuan basin, China. Mar. Pet. Geol. 145, 105876. doi:10.1016/j.marpetgeo.2022.105876
Goodarzi, M., Rouainia, M., Aplin, A. C., Cubillas, P., and de Block, M. (2017). Predicting the elastic response of organic-rich shale using nanoscale measurements and homogenisation methods. Geophys. Prospect. 65 (6), 1597–1614. doi:10.1111/1365-2478.12475
Hartigan, J. A., and Wong, M. A. (1979). Algorithm as 136: a K-means clustering algorithm. J. R. Stat. Soc. Ser. C-Appl. 28 (1), 100–108. doi:10.2307/2346830
He, Q., Li, D., Sun, Q., Wei, B., and Wang, S. (2022). Main controlling factors of marine shale compressive strength: a case study on the cambrian Niutitang Formation in Dabashan Mountain. Energy 260, 125100. doi:10.1016/j.energy.2022.125100
Hill, R. (1952). The elastic behaviour of a crystalline aggregate. Proc. Phys. Soc. Lond. Sect. A 65 (5), 349–354. doi:10.1088/0370-1298/65/5/307
Hornby, B., Schwartz, L., and Hudson, J. (1994). Anisotropic effective medium modeling of the elastic properties of shales. Geophysics 59, 1570–1583. doi:10.1190/1.1443546
Kumar, V., Curtis, M., Gupta, N., Sondergeld, C., and Rai, C. (2012a). “Estimation of elastic properties of organic matter in Woodford shale through nanoindentation measurements,” in SPE Canada unconventional resources conference (Calgary, AB: SPE), SPE–162778. doi:10.2118/162778-MS
Kumar, V., Sondergeld, C. H., and Rai, C. S. (2012b). “Nano to macro mechanical characterization of shale,” in SPE annual technical conference and exhibition. doi:10.2118/159804-MS
Larsson, P. L., Giannakopoulos, A. E., Sderlund, E., Rowcliffe, D. J., and Vestergaard, R. (1996). Analysis of Berkovich indentation. Int. J. Solids and Struct. 33 (2), 221–248. doi:10.1016/0020-7683(95)00033-7
Lei, H., Wenjibin, S., Zuo, Y., Zhonghu, W., Dai, Q., Lv, W., et al. (2025). Impact of micromechanical properties of organic matter on the micro-mesopore structures of the over-mature shale in the Niutitang Formation. Sci. Rep. 15 (1), 1–19. doi:10.1038/s41598-025-89164-0
Li, C., Ostadhassan, M., Abarghani, A., Fogden, A., and Kong, L. (2018). Multi-scale evaluation of mechanical properties of the Bakken shale. J. Mater. Sci. 54 (3), 2133–2151. doi:10.1007/s10853-018-2946-4
Li, C., Ostadhassan, M., Kong, L., and Bubach, B. (2019). Multi-scale assessment of mechanical properties of organic-rich shales: a coupled nanoindentation, deconvolution analysis, and homogenization method. J. Petro. Sci. Eng. 174, 80–91. doi:10.1016/j.petrol.2018.10.106
Liu, J., Ding, W., Wang, R., Wu, Z., Gong, D., Wang, X., et al. (2018b). Quartz types in shale and their effect on geomechanical properties: an example from the lower Cambrian Niutitang Formation in the Cen'gong block, South China. Appl. Clay Sci. 163, 100–107. doi:10.1016/j.clay.2018.07.019
Liu, J., Ding, W., Wang, R., Yang, H., Wang, X., and Li, A. (2018c). Methodology for quantitative prediction of fracture sealing with a case study of the lower Cambrian Niutitang Formation in the Cen'gong block in South China. J. Petro. Sci. Eng. 160, 565–581. doi:10.1016/j.petrol.2017.10.046
Liu, K., Jin, Z., Zeng, L., Ozotta, O., Gentzis, T., and Ostadhassan, M. (2022a). Alteration in the mechanical properties of the Bakken during exposure to supercritical CO2. Energy 262, 125545. doi:10.1016/j.energy.2022.125545
Liu, K., Ostadhassan, M., Bubach, B., Ling, K., Tokhmechi, B., and Robert, D. (2018a). Statistical grid nanoindentation analysis to estimate macro-mechanical properties of the Bakken Shale. J. Nat. Gas. Sci. Eng. 53, 181–190. doi:10.1016/j.jngse.2018.03.005
Liu, K., Rassouli, F., Liu, B., and Ostadhassan, M. (2021). Creep behavior of shale: nanoindentation vs. Triaxial creep tests. Rock Mech. Rock Eng. 54 (1), 321–335. doi:10.1007/s00603-020-02255-4
Liu, Y., Liu, Q., Feng, G., Lyu, Q., Liu, S., Wang, Y., et al. (2024b). Upscaling mechanical properties of shale obtained by nanoindentation to macroscale using accurate grain-based modeling (AGBM). Energy 314, 134126. doi:10.1016/j.energy.2024.134126
Liu, Y., Liu, Q., Wu, Z., Liu, S., Kang, Y., and Tang, X. (2024a). Cross-scale mechanical softening of Marcellus shale induced by CO2-water-rock interactions using nanoindentation and accurate grain-based modeling. Undergr. Space. 19, 26–46. doi:10.1016/j.undsp.2024.02.001
Liu, Y., Yang, C., Wang, J., Xiong, Y., and Peng, P. a. (2022b). New insights into hydration-induced creep behavior of shale: a comparison study of brittle black shale and clayey oil shale at micro-scale. Mar. Pet. Geol. 138, 105554. doi:10.1016/j.marpetgeo.2022.105554
Liu, Y., Zhang, G., Qiao, J., and Tang, X. (2024c). Micromechanical testing and property upscaling of planetary rocks: a critical review. Int. J. Min. Sci. Technol. 34 (9), 1217–1241. doi:10.1016/j.ijmst.2024.08.002
Luo, S., Kim, D., Wu, Y., Li, Y., Wang, D., Song, J., et al. (2021). Big data nanoindentation and analytics reveal the multi-staged, progressively-homogenized, depth-dependent upscaling of rocks’ properties. Rock Mech. Rock Eng. 54 (3), 1501–1532. doi:10.1007/s00603-020-02337-3
Luo, S., Lu, Y., Wu, Y., Song, J., DeGroot, D. J., Jin, Y., et al. (2020). Cross-scale characterization of the elasticity of shales: statistical nanoindentation and data analytics. J. Mech. Phys. Solids 140, 103945. doi:10.1016/j.jmps.2020.103945
Mighani, S., Bernabé, Y., Boulenouar, A., Mok, U., and Evans, B. (2019). Creep deformation in vaca muerta shale from nanoindentation to triaxial experiments. J. Geophys. Res. Solid Earth 124 (8), 7842–7868. doi:10.1029/2019jb017524
Mori, T., and Tanaka, K. (1973). Average stress in matrix and average elastic energy of materials with misfitting inclusions. Acta Metall. 21 (5), 571–574. doi:10.1016/0001-6160(73)90064-3
Oliver, W. C., and Pharr, G. M. (1992). An improved technique for determining hardness and elastic modulus using load and displacement sensing indentation experiments. J. Mater. Res. 7 (6), 1564–1583. doi:10.1557/JMR.1992.1564
Oliver, W. C., and Pharr, G. M. (2004). Measurement of hardness and elastic modulus by instrumented indentation: advances in understanding and refinements to methodology. J. Mater. Res. 19 (1), 3–20. doi:10.1557/jmr.2004.19.1.3
Slim, M., Abedi, S., Bryndzia, L. T., and Ulm, F.-J. (2019). Role of organic matter on nanoscale and microscale creep properties of source rocks. J. Eng. Mech. 145 (1), 04018121. doi:10.1061/(asce)em.1943-7889.0001538
Sone, H., and Zoback, M. D. (2013). Mechanical properties of shale-gas reservoir rocks — Part 2: ductile creep, brittle strength, and their relation to the elastic modulus. Geophysics 78 (5), D393–D402. doi:10.1190/geo2013-0051.1
Ulm, F.-J., and Abousleiman, Y. (2006). The nanogranular nature of shale. Acta Geotech. 1 (2), 77–88. doi:10.1007/s11440-006-0009-5
Vandamme, M., and Ulm, F. J. (2009). Nanogranular origin of concrete creep. P. Natl. Acad. Sci. USA. 106 (26), 10552–10557. doi:10.1073/pnas.0901033106
Vandamme, M., and Ulm, F. J. (2013). Nanoindentation investigation of creep properties of calcium silicate hydrates. Cem. Concr. Res. 52, 38–52. doi:10.1016/j.cemconres.2013.05.006
Wang, J., Dziadkowiec, J., Liu, Y., Jiang, W., Zheng, Y., Xiong, Y., et al. (2024a). Combining atomic force microscopy and nanoindentation helps characterizing in-situ mechanical properties of organic matter in shale. Int. J. Coal Geol. 281, 104406. doi:10.1016/j.coal.2023.104406
Wang, J., Liu, D., Shi, J., Yang, C., Liu, Y., Wang, G., et al. (2024b). Evolution of mechanical properties of organic-rich shale during thermal maturation. Sci. Rep. 14 (1), 24327. doi:10.1038/s41598-024-75035-7
Wang, J., Liu, Y., Yang, C., Jiang, W., Li, Y., Xiong, Y., et al. (2022a). Evolution of mechanical properties of kerogen with thermal maturity. Mar. Pet. Geol. 145, 105906. doi:10.1016/j.marpetgeo.2022.105906
Wang, J., Liu, Y., Yang, C., Zheng, Y., Jiang, W., Menegon, L., et al. (2023). Upscaling the creep behavior of clay-rich and quartz-rich shales from nanoindentation measurements: application to the Wufeng-Longmaxi shale, China. Int. J. Rock Mech. Min. Sci. 171, 105580. doi:10.1016/j.ijrmms.2023.105580
Wang, J., Yang, C., Liu, Y., Jiang, W., Zheng, Y., Xiong, Y., et al. (2024c). Creep behavior of marine wufeng–longmaxi Formation shales in the sichuan basin, southwest China characterized at micro scale: a case study of exploration well SQ-1 in sanquan Town, nanchuan District, chongqing. Nat. Gas. Ind. B 11 (4), 357–367. doi:10.1016/j.ngib.2024.07.002
Wang, J., Yang, C., Liu, Y., Li, Y., and Xiong, Y. (2022b). Using nanoindentation to characterize the mechanical and creep properties of shale: load and loading strain rate effects. ACS Omega 7 (16), 14317–14331. doi:10.1021/acsomega.2c01190
Wang, L., Tian, Y., Yu, X., Wang, C., Yao, B., Wang, S., et al. (2017). Advances in improved/enhanced oil recovery technologies for tight and shale reservoirs. Fuel 210, 425–445. doi:10.1016/j.fuel.2017.08.095
Yang, C., Liu, Y., Wang, J., Wu, D., Liu, L., Su, Z., et al. (2023). Application of nanoindentation technique in mechanical characterization of organic matter in shale: attentive issues, test protocol, and technological prospect. Gas. Sci. Eng. 113, 204966. doi:10.1016/j.jgsce.2023.204966
Yang, C., Xiong, Y., Wang, J., Li, Y., and Jiang, W. (2020). Mechanical characterization of shale matrix minerals using phase-positioned nanoindentation and nano-dynamic mechanical analysis. Int. J. Coal Geol. 229, 103571. doi:10.1016/j.coal.2020.103571
Yu, Y., Wang, Z., Zhang, K., Feng, X., and Cheng, M. (2022). Effects of shear on development characteristics of organic matter pores in shale: a case study of shale in the Niutitang Formation of the well XAD1. J. Petro. Sci. Eng. 211, 110166. doi:10.1016/j.petrol.2022.110166
Yuan, S., and Wang, Q. (2018). New progress and prospect of oilfields development technologies in China. Pet. Explor. Dev. 45 (4), 698–711. doi:10.1016/S1876-3804(18)30073-9
Zeszotarski, J. C., Chromik, R. R., Vinci, R. P., Messmer, M. C., Michels, R., and Larsen, J. W. (2004). Imaging and mechanical property measurements of kerogen via nanoindentation. Geochim. Cosmochim. Acta 68 (20), 4113–4119. doi:10.1016/j.gca.2003.11.031
Zheng, Y., Liao, Y., Wang, Y., Xiong, Y., and Peng, P. a. (2022). Effects of regional differences in shale floor interval on the petrophysical properties and shale gas prospects of the overmature Niutitang shale, middle-upper yangtz block. Minerals 12 (5), 539. doi:10.3390/min12050539
Keywords: niutitang shale, clay matrix, mechanical property, creep behavior, nanoindentation
Citation: Wang J, Niu J, Yang C, Jiang W, Li Y, Zheng Y, Liao Y, Feng D, Peng P and Xiong Y (2025) Nanoindentation measurements of mechanical properties and creep behavior of Niutitang formation shale rocks, China. Front. Earth Sci. 13:1564286. doi: 10.3389/feart.2025.1564286
Received: 21 January 2025; Accepted: 24 February 2025;
Published: 17 March 2025.
Edited by:
Guoxi Cheng, China University of Mining and Technology, ChinaCopyright © 2025 Wang, Niu, Yang, Jiang, Li, Zheng, Liao, Feng, Peng and Xiong. This is an open-access article distributed under the terms of the Creative Commons Attribution License (CC BY). The use, distribution or reproduction in other forums is permitted, provided the original author(s) and the copyright owner(s) are credited and that the original publication in this journal is cited, in accordance with accepted academic practice. No use, distribution or reproduction is permitted which does not comply with these terms.
*Correspondence: Chao Yang, eWFuZ2NoYW9AbXMuZ2llYy5hYy5jbg==