 Zhiwen Ding1,2
 Chun Wang3*
- 1State Key Laboratory of Geohazard Prevention and Geoenvironment Protection, Chengdu University of Technology, Chengdu, China
- 2College of Environment and Civil Engineering, Chengdu University of Technology, Chengdu, China
- 3Sichuan Institute of Nuclear Geological Survey, Chengdu, China
On 5 September 2022, an Ms 6.8 earthquake occurred in Luding County, Sichuan Province, China, triggering numerous landslides and causing extensive damage to buildings and casualties. A comprehensive study of the characteristics of coseismic landslide distribution in this area is highly important for postearthquake emergency response. In this paper, coseismic landslides in high-intensity areas were interpreted through remote sensing images, and 5,386 landslides with a total area of 22.2 km2 were identified. The spatial distribution of coseismic landslides was analyzed in relation to seismic, topographic, and geological factors to assess their susceptibility at the regional scale. The results revealed that the majority of coseismic landslides occurred on both sides of the Xianshuihe fault, which is the causative fault, and the landslides exhibited a linear distribution. These landslides were concentrated mainly at elevations between 1,000 and 1,800 m, with slopes of 30°–50°, and they occurred in areas with hard intrusive rock masses. The spatial distribution of coseismic landslides in the study area was predicted using three models: Random Forest (RF), Gradient Boosting Decision Tree (GBDT) and eXtreme Gradient Boosting (XGBoost). Furthermore, SHapley Additive exPlanations (SHAP) theory was used to conduct a quantitative analysis of the main geomorphological factors controlling the landslides. This paper revealed that different topographic factors had varying degrees of nonlinear impacts on landslide formation and that the combined effects of multiple factors, such as the Peak Ground Acceleration (PGA), slope, and lithology, controlled the formation of landslides. This paper highlights the significant advantages of machine learning-based intelligent identification and analytical techniques in landslide disaster emergency surveys and analysis of formation conditions. Rapid prediction of the spatial location and distribution pattern of coseismic landslides provides effective support and guidance for emergency response, risk mitigation, and reconstruction planning.
1 Introduction
An earthquake is caused by the sudden release of energy from the Earth’s lithosphere, which can lead to intense vibrations on the Earth’s surface, causing large blocks of rock to separate from the mountains and form landslides triggered by earthquakes; landslides triggered by earthquakes are usually called coseismic landslides (Budimir et al., 2014; Fan et al., 2019; Gorum et al., 2013; Zhuang et al., 2018; Wen et al., 2024). Numerous studies have reported that the Qinghai‒Tibet Plateau may be a typical area prone to coseismic landslides, especially at its eastern edge. High ground stress, deep canyons, and densely distributed faults and cracks make the eastern edge very sensitive to earthquakes, and even slight shaking may cause the collapse of rocky slopes (Williams et al., 2018). For example, since 2000, at least 7 earthquakes have triggered massive landslides at the eastern edge; these earthquakes include the 2008 Ms 8.0 Wenchuan earthquake (197481 landslides), the 2010 Ms 7.3 Yushu earthquake (2036 landslides), the 2013 Ms 7.0 Lushan earthquake (15645 landslides), and the 2017 Ms 7.0 Jiuzhaigou earthquake (Zhao et al., 2022; Xu and Xu, 2014; Xu et al., 2014) (5,633 landslides). These coseismic landslides have catastrophic consequences for local people, such as villages being flooded, deaths, and lakes being dammed.
The occurrence of landslides after earthquakes is not only affected by seismic vibrations, but may also be exacerbated by meteorological factors such as precipitation (Mao et al., 2024), which can cause soil moisture and increase slope instability. This plays an important role in the occurrence of landslides triggered by earthquakes. Although this study mainly focuses on earthquake induced landslides, combining precipitation data may improve the accuracy of landslide prediction in subsequent research. The occurrence of coseismic landslides is driven mainly by seismic dynamics and geological and topographic conditions. The driving mechanisms include surface movement caused by earthquakes, fault activity, and complex interactions between topography and geological characteristics. The key influential factors include slope, topographic curvature, lithology, vegetation cover, groundwater conditions, distance to epicentre or fault, etc. (Nowicki Jessee et al., 2018) Rapid and accurate identification of the locations of coseismic geological hazards is crucial for risk mitigation and future reconstruction in earthquake-affected areas. In addition, a detailed catalog of earthquake geological hazard events can be used to study the patterns of coseismic landslide distribution. Compared with onsite surveys, which require considerable time and humanpower, remote sensing images can reveal a wide range of Earth observations but have a short revisit time, providing an excellent opportunity to monitor surface processes in a wide geographical area. On this basis, the mapping of landslides via remote sensing technology has rapidly developed and has become the most important means of realizing their distribution and patterns (Guo et al., 2021).
Detailed coseismic landslide maps are usually made through onsite surveys or the interpretation of optical remote sensing images obtained from satellites and unmanned aerial vehicles (UAVs). However, effective satellite images are often limited by weather conditions. In addition, because of field conditions, it is difficult to meet the standards of onsite surveys and UAV missions. Therefore, coseismic landslide prediction is highly important for guiding and making decisions in emergency rescue during the postearthquake period without images and during the survey period. At present, statistical analysis-based methods for predicting landslides, such as logistic regression, linear regression, and support vector machines, are widely used in many studies. These methods provide predictions of the spatial distribution of landslides on the basis of various conditional factors (Fan et al., 2018).
Despite the advantages of machine learning models in terms of accuracy, their “black box” nature limits their wide application in geological landslides. In recent years, the SHapley Additive exPlanations (SHAP) method, as a tool for model interpretation, has been used to quantify the contribution of each feature to the model’s prediction results, thereby improving the transparency and scientificity of the model. This method is particularly suitable for studying the mechanism of the effects of complex geological variables in landslide prediction.
On 5 September 2022, a Ms 6.8 earthquake, with an epicentre at 29.59°N and 102.08°E and a focal depth of 16 km, shook Luding County, Sichuan Province, China (Xu and Xu, 2014). The earthquake lasted for 20 s, and 2,715 aftershocks were subsequently recorded. The earthquake strongly affected many provinces in the west, including Chengdu, Chongqing, and Xi’an, which are approximately 226 km, 444 km, and 830 km away from the epicentre, respectively. According to the seismic intensity map (Dai et al., 2023) published by the Ministry of Emergency Management of China on the Modified Mercalli (MM) scale (GB/T17, 742–2020), the area where the seismic intensity was greater than VI was 19,089 km2, and the maximum intensity reached IX, with an area of 280 km2. The earthquake triggered many landslides, causing damage to houses and blocking roads in the affected areas, resulting in serious casualties and property losses. According to statistics, as of 11 September 2022, the earthquake had caused 93 deaths and 25 missing people. In this paper, the 2022 Luding earthquake is taken as a typical case, and a comprehensive framework for evaluating landslides induced after a strong earthquake is proposed. First, we recorded and analyzed the distribution patterns of postearthquake landslides on the basis of remote sensing images. Second, we constructed a machine learning-based prediction model for postearthquake landslides by combining multisource geological, seismic, and topographic data (Fan et al., 2021; Tanyas et al., 2019; Budimir et al., 2015; Alvioli et al., 2020). Finally, we used SHAP values for model interpretation. The aim of this work is to (Budimir et al., 2014) identify the key factors affecting landslide occurrence and their mechanisms of action (Fan et al., 2019); evaluate the prediction ability and applicability of the machine learning model; and (Gorum et al., 2013) explore an interpretation framework based on SHAP values for geological processes, providing a scientific basis for the prevention and control of future coseismic landslides and risk assessment.
2 Study area
The epicentre of the “9.5” Luding earthquake is near the Moxi fault in the southeastern section of the Xianshuihe fault zone on the southeastern edge of the Qinghai‒Tibet Plateau (Xiong et al., 2023) (Figure 1). The Xianshuihe fault zone stretches from the vicinity of Donggu in Ganzi in the north, generally extends in a northwest‒southeast direction, passes through Longho, Daofu, Qianning, and Kangding, and extends to the southern part of Moxi in Luding. It intersects with the Longmenshan Fault Zone and the Anning River Fault Zone near Shimian, forming the famous “Y-shaped” fault zone in western Sichuan. The total length is approximately 350 km. It is a highly active large-scale left-lateral strike‒slip fault zone, and it is prone to earthquake development and a high risk of geological landslides (Guihua et al., 2016). In terms of the geological structure, the Xianshuihe fault zone is located within the Songpan–Ganzi Geosynclinal Fold System, which is a first-order tectonic unit. The northeast side of the fault is the Bayan Har Block, and the southwest side is the Sichuan–Yunnan Rhombic Block. The fault is the dividing line between the two second-order tectonic units, and the tectonic units on both sides of the fault are different, resulting in fault contact (Zhao et al., 2023). The study area is located within the Xianshuihe Fault Zone, a seismically active region with complex geological structures and diverse lithological formations. According to the 1:200,000 regional geological map, the main lithologies outcropping in the area include hard intrusive rocks (granite, diorite), layered metamorphic rocks (schist, phyllite), weakly cemented clastic rocks (sandstone, shale), and loose Quaternary deposits. These lithological units play a critical role in controlling landslide susceptibility, as different rock types respond differently to seismic shaking. The area near the Xianshuihe fault zone has historically been prone to strong seismic activity. Since 1700, 22 earthquakes with magnitudes greater than Ms 6.0 have occurred along this fault zone, including 8 earthquakes with magnitudes greater than Ms 7.0. The closest spatial distance to this Luding earthquake was the M7.75 earthquake in Kangding-Luding, Sichuan, on 1 June 1786, and the closest spatial distance was the M7.9 earthquake in Longho, Sichuan, on 6 February 1973. Relevant studies have shown that after the Wenchuan earthquake in 2008 and the Lushan earthquake in 2013, the Coulomb stress near the Xianshuihe fault increased significantly, and the strike-slip rate of the fault zone showed an increasing trend from northwest to southeast, suggesting the possibility of triggering a major earthquake (Huang et al., 2023; Wang, 2015; Dai et al., 2011).
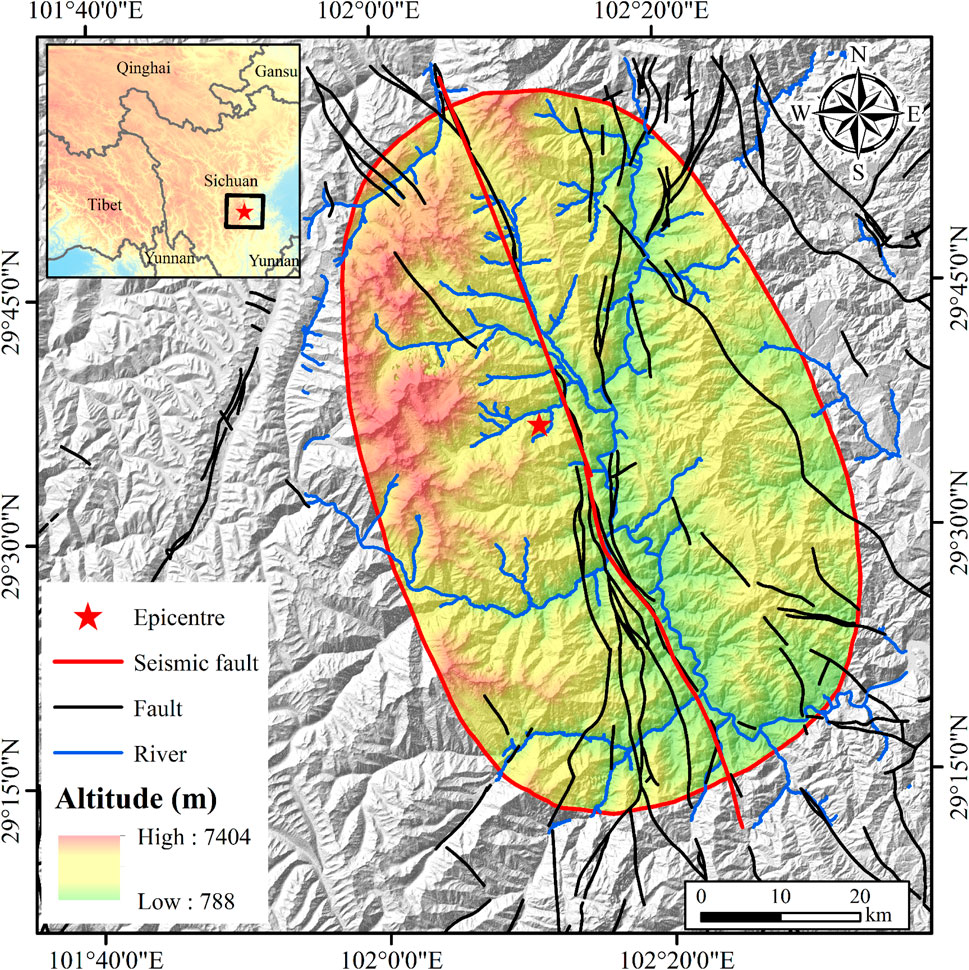
Figure 1. 2022 Luding earthquake location and map of the distribution of the fault zone
The landforms of the Xianshuihe fault zone and its adjacent areas are controlled by tectonics, forming a pattern of mountains and rivers parallel to each other. The direction gradually deviates to the south from northwest–southeast and finally becomes nearly north–south. The fault zone spans two water systems: the Yalong River and the Dadu River. Along the fault zone, the longest Xianshui River, Qingda River and Liqi River in the central part of the fault zone are part of the Yalong River water system. Tributaries such as the Yala River and Zheduo River at the southeast end of the fault converge into the Wasi River and then flow into the Dadu River, which is part of the Dadu River water system (Yang et al., 2023). The main peaks in the area include Haizi Mountain, Dapaonan Mountain and Zheduo Mountain, all of which are greater than 4,500 m above sea level. Along the fault zone in the area, there are several graben basins, such as the Qianning Basin, Longdeng Basin and Daofu Basin, all of which are approximately 3,000 m above sea level. The overall area is generally bounded by the trend of the Xianshuihe fault zone. According to the differences in landforms and relative cutting depth, the area can be divided into the Qiangxi hill plateau area in the northeast and the Qiangxi plateau area in the southwest, both of which are alpine plateau landforms. The changes in the crustal thickness on both sides of the Xianshuihe fault zone are relatively gradual. The closer to the fault location, the more obvious the changes in crustal thickness are. At the northwestern end of the Ganzi–Yushu fault, the bottom layer thickness changes from nearly north‒south to northwest‒southeast. In the southeastern part of the Longmen Mountain fault zone, the direction in which the crustal thickness changes also significantly changes, which to some extent reflects the complexity of the deep structure in this area.
3 Data and methods
3.1 Landslide identification
A detailed and accurate catalog of coseismic landslides is the premise and foundation for conducting landslide assessments. An ideal catalog map should cover the entire earthquake area and should accurately delineate the location and shape of landslides in the form of polygons. More detailed catalogs of coseismic landslides began in the 1950s, using mainly aerial interpretation methods and field surveys, which are inefficient and have difficulty covering the entire area affected by earthquakes. In recent years, with the rapid development of remote sensing and GIS technology, high-precision satellite remote sensing has been continuously applied to the fine interpretation of geological landslides caused by earthquakes, and many detailed and accurate hazard cataloging maps have been produced.
The establishment of a catalog of coseismic landslides is an important part of the analysis of coseismic landslides, and a reliable source of imaging data is the basis for the accuracy of the database, which is also an important guarantee for the analysis of patterns and the establishment of models (He et al., 2024; He and Xu, 2022; Shao and Xu, 2022). The basic data used to study the spatial distribution of landslides during the Luding earthquake and the subsequent prediction of landslides include multisource and multiperiod optical remote sensing images, which are used for the detailed cataloging of coseismic landslide data. The optical remote sensing data come from the Planet satellite constellation, which can realize high-frequency and full-coverage high-resolution observations of the whole globe once a day. The satellite images selected in this paper include single-band panchromatic images and multispectral images composed of four bands: red, blue, green, and near-infrared. By registering and fusing the panchromatic and multispectral images, we can obtain a multispectral fused image with a spatial resolution of 3 m (Figure 2).
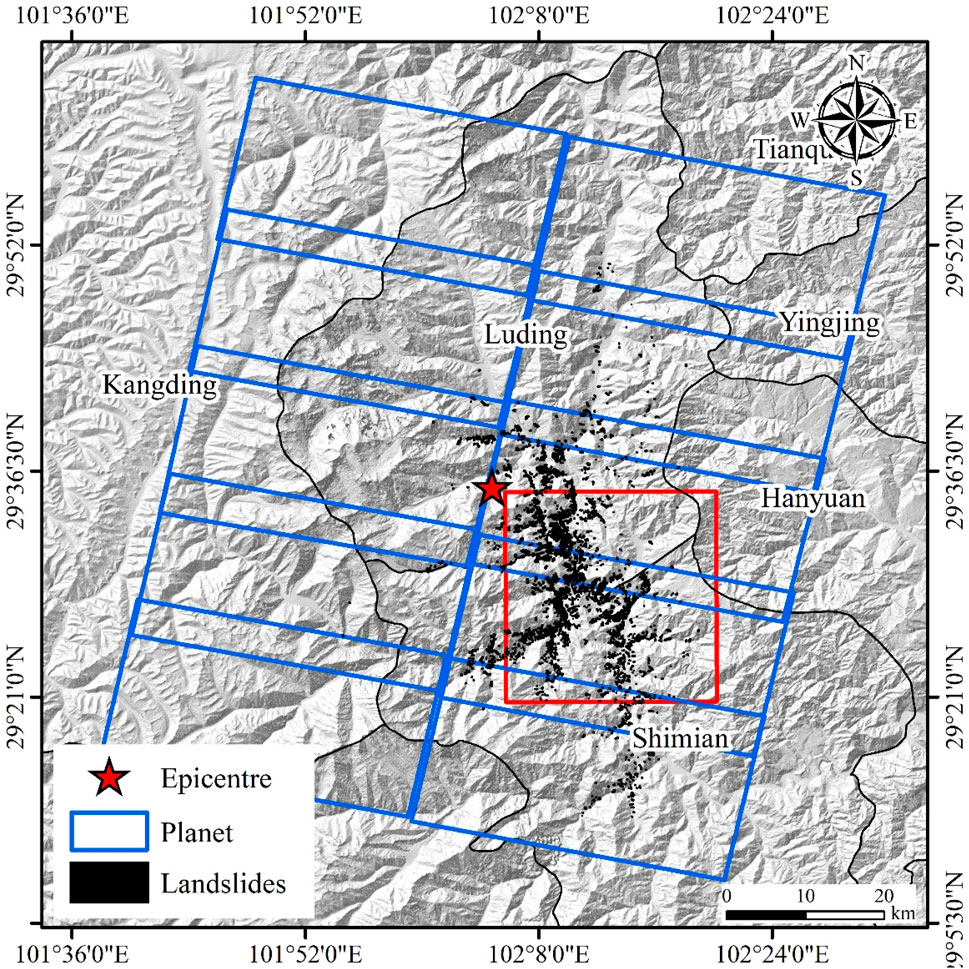
Figure 2. Range of remote sensing image acquisition.
To identify coseismic landslides, we performed a pre- and post-earthquake image comparison using PlanetScope 3 m resolution imagery. The pre-earthquake image (August 2022) provided a baseline, while the post-earthquake image (October 2022) captured surface changes caused by the earthquake. Landslides were identified based on newly exposed bedrock, vegetation loss, and morphological changes (Figure 3).
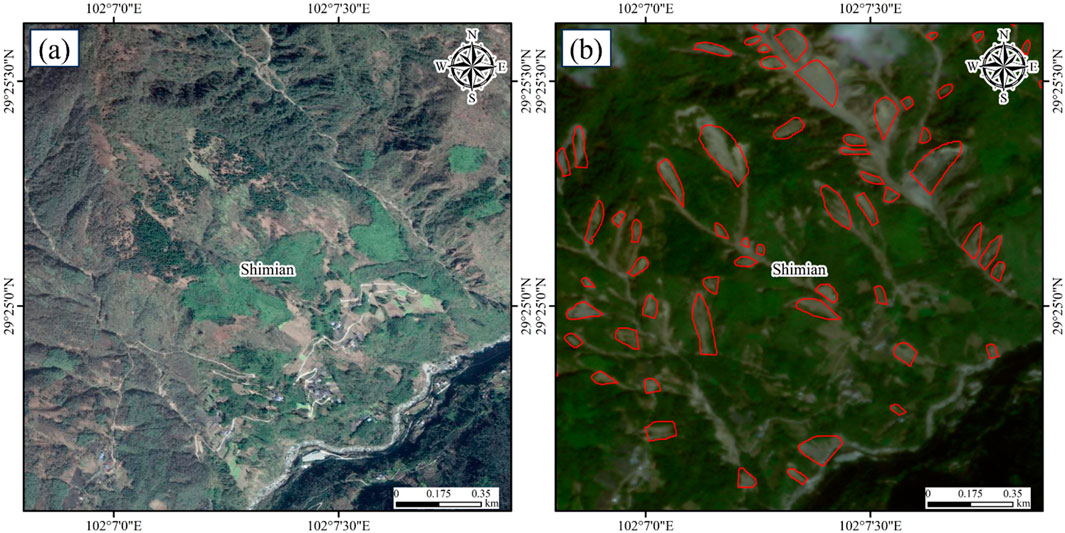
Figure 3. Example of coseismic landslide identification. (a) Pre-earthquake PlanetScope image (August 2022). (b) Post-earthquake PlanetScope image (October 2022), with newly identified landslides outlined in red polygons.
Figure 3 shows an example of landslide identification, where a comparison of pre- and post-earthquake images highlights newly formed landslides. To further clarify the mapping process, we overlaid the identified landslide polygons on the post-earthquake image, allowing for a clear visualization of the affected areas.
3.2 Data on the influential factors
The spatial distribution of landslides triggered by earthquakes is influenced by the seismic, topographic and geological conditions of the earthquake area (Cemiloglu et al., 2023). On the basis of the characteristics of landslide distribution in the study area and their influential factors and on the basis of previous studies (Chen, 2017; Xu et al., 2015; Zhang et al., 2023; Zhao et al., 2024), we selected 10 factors for evaluating coseismic landslides (Table 1), including the PGA, distance to seismic fault, intensity, altitude, slope, aspect, plan curvature, distance to closest fault, lithology, and distance to river. We obtained the intensity and PGA data of the earthquake through the United States Geological Survey (USGS) Shakemap System and used ArcGIS to process the digital elevation map (DEM) data to obtain altitude, slope, aspect, and plan curvature data. We extracted faults and rivers from topographic maps and used software to generate distance maps. Finally, we used the spatial statistical analysis function of ArcGIS to study the spatial correlation of 10 evaluation factors, thus systematically summarizing the spatial distribution patterns of geological landslides triggered by earthquakes.
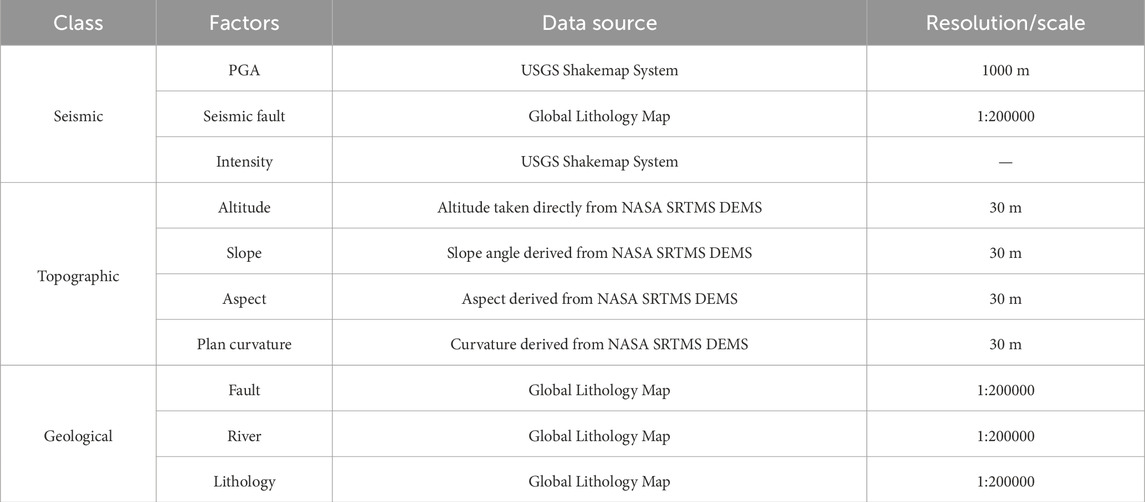
Table 1. General description of conditioning factors adopted in this paper.
3.3 Landslide susceptibility models
Machine learning technology is considered one of the ideal techniques for solving nonlinear geological environmental problems. For regression or classification problems, machine learning technology can learn the correlation between the occurrence of landslides and the prediction of their causes without the need for a structural model. In this work, we selected classic methods from two types of integrated models to establish a prediction model and compared the random forest (RF) and Gradient Boosting Decision Tree (GBDT) methods. In addition, we selected the eXtreme Gradient Boosting (XGBoost) model, which was improved on the basis of the GBDT method, for prediction comparison.
RF is a powerful ensemble learning method that can be used for classification, regression, and unsupervised learning. This method has been widely applied in many fields and has shown good performance (Calderoni et al., 2015; Kohestani et al., 2015; Liu et al., 2024). In solving classification problems, RF prediction is considered the unweighted majority of class votes. The bagging technique is used to select random variable samples as the training dataset for model calibration. For each variable, if the value of the variable is arranged in the bagging observation values, the function determines the prediction error of the model.
The GBDT is a machine learning model originally proposed by Jerome Friedman in 1999 (Wang and Dong, 2024). GBDT is also a member of the boosting family of ensemble learning. GBDT uses the forward distribution algorithm for iteration, and each iteration produces a weak learner. In the next iteration, it is trained according to the residuals of the previous round of weak learners. In this way, the iteration continues until the error is reduced to a certain range. Finally, all weak learners are weighted and summed to obtain the final strong learner (Lin et al., 2023).
XGBoost is an extensible machine learning system for tree boosting that was proposed by Chen and Guestrin in 2016 (Chen and Guestrin, 2016). It is one of the most widely used regression algorithms and has high regression accuracy. XGBoost has the advantages of parallel computing, optimized memory usage, and efficient processing of sparse data. When making predictions, the accuracy of XGBoost is often higher than that of linear models, but it also lacks the interpretability of linear models. The workflow consists of the following parts: 1. create a decision tree and initialize the prediction value of each sample; 2. define the loss function; 3. calculate the derivative of the loss function for each sample’s prediction value; 4. create a new decision tree on the basis of derivative information; 5. use the new decision tree to predict samples and accumulate them to the original value; 6. repeat the process of creating decision trees. Repeat the process of creating decision trees multiple times until the accuracy reaches its maximum value.
To test the accuracy of the prediction model, we use the receiver operating characteristic (ROC) curve for accuracy verification (Nanehkaran et al., 2021). The area under the curve (AUC) of the ROC curve can be used directly to test the accuracy of landslide prediction results. The larger the AUC value is, the higher the accuracy and the stronger the rationality of the model. The ROC curve is evaluated on the basis of the above confusion matrix, and its horizontal coordinate is the specificity, that is, the number of nonlandslide points that are correctly evaluated, and the vertical coordinate is the sensitivity, that is, the number of landslide points that are correctly evaluated. The criterion for judgment is as follows: when the AUC values are 0.5 ∼ 0.7, the accuracy of the model’s prediction results is relatively low; when the AUC values are 0.7 ∼ 0.9, the accuracy of the model’s prediction results is relatively high. The distribution of the AUC values can also reflect the same pattern.
3.4 SHapley additive exPlanation (SHAP)
As the computational power of machine learning continues to increase, models become increasingly complex, and it becomes difficult to understand the internal operations of models and how they make decisions. Therefore, models may perform well in training but very poorly in actual applications. Scholars generally believe that relying solely on the high prediction accuracy of models is not enough to guarantee their credibility (Caruana et al., 2015). Improving the interpretability of “black box” models, enabling people to understand the reasons for their predictions, is an important measure to enhance the universality and credibility of machine learning algorithm applications. In 2017, Lundberg and Lee proposed SHAP (Lundberg and Lee, 2017), a widely used method whose main idea is cooperative game theory (CGP). It is used to explain the prediction results of various models (classification and regression), especially the reasons for the predictions of difficult-to-understand black box models.
The method regards all input features as “contributors” affecting the model’s prediction results and calculates the SHAP value of each feature for the prediction results as the basis for judging the degree and direction of its impact on the prediction results. Combined with actual physical laws and existing empirical knowledge, it determines whether the model’s prediction results are reliable. SHAP is used to analyze the feature factors for selection to quantify the controlling effect of each feature factor on the formation of landslides. By plotting the relationship between the changes in the values of each feature factor and their SHAP values, we can derive the mechanism of the effect of feature factors and their interactions on the formation of landslides.
4 Results
4.1 Landslide inventory
Through visual interpretation of remote sensing images and verification of geological landslide data, we constructed a detailed landslide database of the Luding earthquake event. Mapping of landslides in the Luding earthquake research area revealed that the 2022 Luding earthquake triggered at least 5,386 landslides in an area of 3,700 km2. The total area of landslides and the average area of landslides are 22.2 km2 and 4,125 m2, respectively. Most of the landslides (5,366 cases, accounting for 99.64% of the total) occurred in Luding County (2,531 cases, accounting for 47.00% of the total) and Shimian County (2,835 cases, accounting for 52.64% of the total). These larger landslides were concentrated mainly near the earthquake fault (Moxi fault), and there were 1,104 landslides with areas greater than 5,000 m2, accounting for 26.77% of the total landslides. There were 756 landslides concentrated within a 2 km range of the Moxi fault, accounting for 33% of the total landslides. More than 90% of the landslides occurred in the sections south of the epicentre, especially in the sections between Moxi and Xinmin town, reflecting the sliding process of the Moxi fault. There was no obvious concentration of landslides near the epicentre. The landslide inventory is constructed based on remote sensing images from the 3 m resolution Planet satellite, and the minimum detectable and observable landslide area is approximately 62 m2.
To further study the distribution of landslides, we conducted a density analysis of the area and number of landslides, and the results are shown in Figure 4. The highest density of landslide areas was 13.8%, and the high-density areas were concentrated mainly in the area of intensity IX and the northeast side of the earthquake fault. The highest density of landslide points was 35.73 km2, which was similar to the distribution of surface density, and the high-density areas were also concentrated in the area of intensity IX and the northeast side of the earthquake fault.
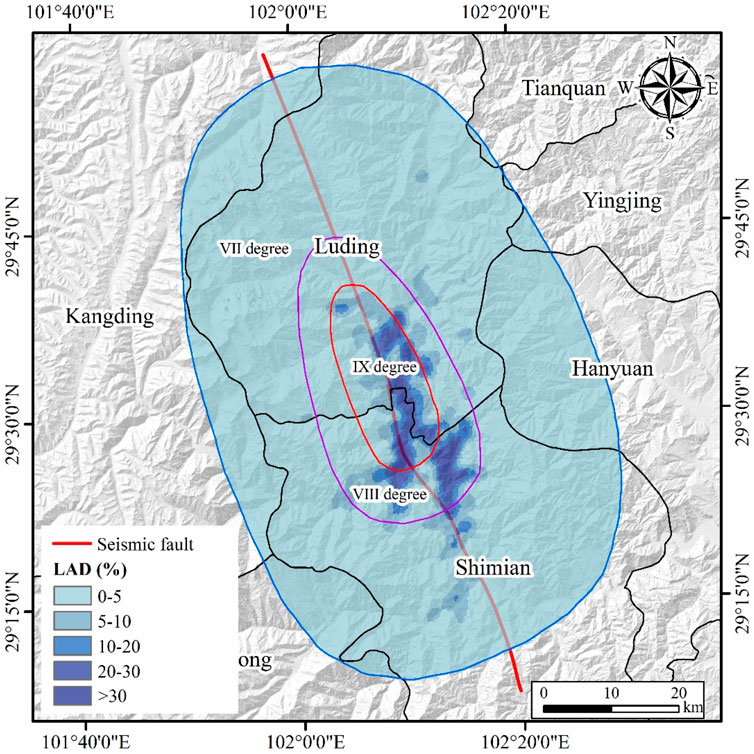
Figure 4. Landslide density map.
4.2 Characteristics of spatial patterns
There was a strong correlation between earthquakes and geological landslides and PGA. Statistical analysis revealed that the total distribution area of geological landslides first increased but then decreased (Figure 5). The area of geological landslides and the gradational surface density reached their peak in the range of 0.12–0.16 g, but the peak gradational surface density of geological landslides was in the range of 0.08–0.24 g. Landslides were concentrated in the range of 0.08–0.24 g, and the proportion of the area of development of geological landslides in this range was as high as 75.4%. The distribution of landslides triggered by earthquakes was controlled mainly by the fault that caused the earthquake. In this paper, we established buffer zones at intervals of 1 km for the fault that caused the earthquake and statistically calculated the area and gradational surface density of geological landslides triggered by earthquakes at different distances from the fault that caused the earthquake. The statistical analysis revealed that the gradational surface density of geological landslides triggered by earthquakes decreased as the distance to closest fault that caused the earthquake increased, which was in line with the general trend of geological landslides triggered by earthquakes. The proportion of landslides decreased from 37.06% in the range of 0–2 km from the fault that caused the earthquake to 4.02% in the range of 8–10 km. In conclusion, the geological landslides triggered by this earthquake were significantly controlled by the fault that caused the earthquake. The area of intensity zone VII in the study area was 4400.99 km2, the area of intensity zone VIII was 505.77 km2, and the area of intensity zone IX was 278.88 km2. The results of the statistical analysis of the coseismic landslides and earthquake intensities revealed that the coseismic landslides were distributed in all three zones, and the distribution of the landslides tended to gradually increase with increasing earthquake intensity. In intensity zone IX, the landslide area reached its maximum value, accounting for approximately 58.4% of the total disaster area, indicating that the energy of earthquakes had a significant impact on the number, area, etc., of coseismic landslides.
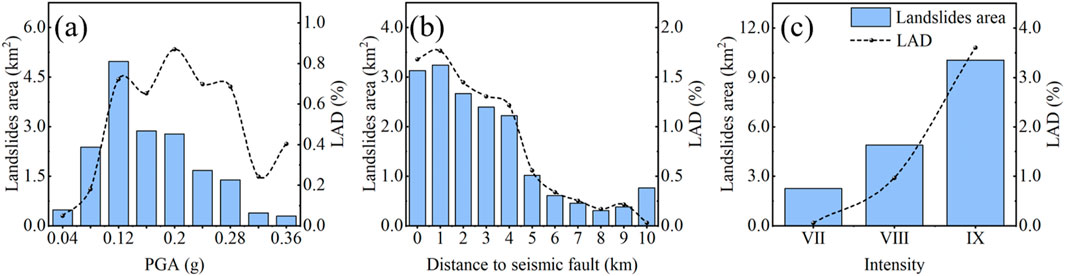
Figure 5. Statistics of seismic factors. (a) PGA, (b) distance to seismic fault, (c) intensity.
Altitude is an important topographic feature affecting the occurrence of coseismic landslides. The statistical results revealed that geological landslides triggered by earthquakes tended to be distributed within a certain altitude range. In 2022, the area of geological landslides triggered by the Luding earthquake and the relative altitude also exhibited an approximate Gaussian distribution. Approximately 79.8% of the geological landslides triggered by the earthquake were concentrated in the altitude range of 1,000–1800 m, which was the main altitude range of geological landslides triggered by this earthquake. In addition, the gradational surface density of geological landslides triggered by earthquakes first increased with altitude, reached a maximum in the altitude range of 1,000–1,200 m, and then gradually decreased. When the altitude was greater than 2,200 m, almost no landslides developed. The stress on the slope increased with increasing slope gradient, as did the probability of landslides (Nanehkaran et al., 2023). The area of geological landslides triggered by earthquakes and the density of gradational surfaces of geological landslides increased rapidly with increasing slope of the terrain, mainly in the range of 30–50°, especially in the range of 30–40°; the area of geological landslide distribution reached its peak, and there was basically no distribution of landslides after the slope exceeded 60°. The slope orientations of the Luding study area were divided into N, NE, E, SE, S, SW, W, and NW, i.e., 8 directions, and the areas of geological landslides triggered by earthquakes and the density of gradational surfaces in different directions were determined. The statistical analysis revealed that the distribution of geological landslides in the E direction was more prominent than that in other directions. Among these directions, the proportion of geological landslides in the E and SE directions reached 42.6%, which was the dominant direction of geological landslides triggered by this earthquake. Curvature is the second derivative of the slope terrain surface. The distribution of geological landslides triggered by this earthquake and the statistical results of the plan curvature of the slope are shown in Figure 6. The statistical results revealed that geological landslides triggered by earthquakes developed within each interval of slope curvature. With the change in the slope curvature, within the interval of the plan curvature of −0.5–0.5, the proportion of the distribution area of landslides reached 50.09%, which was the area with a concentrated distribution of landslides. Overall, the sensitivity of geological landslides triggered by earthquakes in the Luding study area to the plan curvature of the slope was relatively weak.
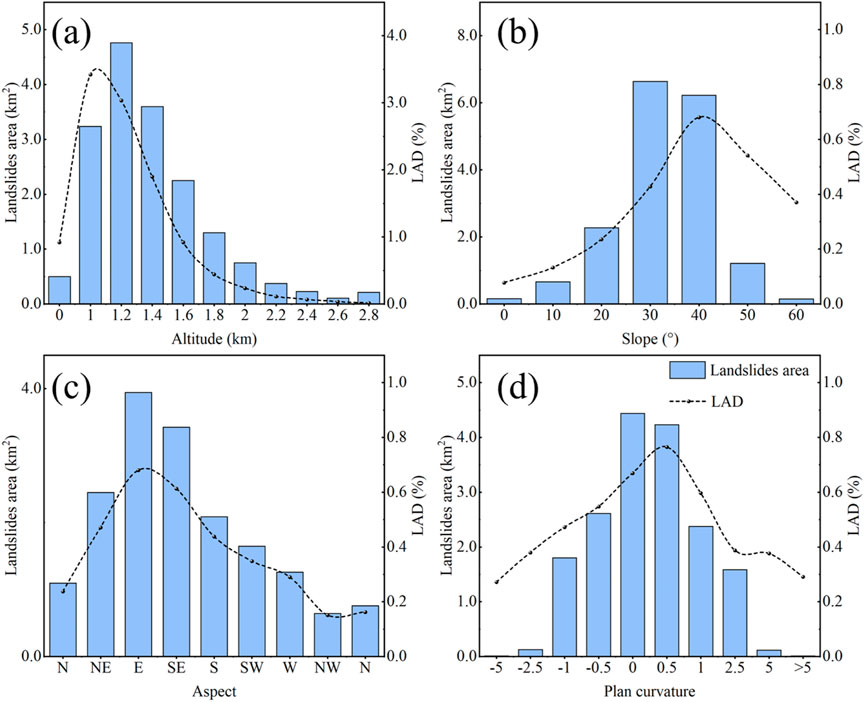
Figure 6. Statistics of topographic factors. (a) Altitude, (b) slope, (c) aspect, (d) plan curvature.
As the distance to river increased, the area of geological landslides and the density of graded geological landslides generally tended to decrease. Therefore, the river had a significant impact on the distribution of coseismic landslides in the study area, which was in line with the general statistical law of the distribution of coseismic landslides. In 2022, the main rivers in the Luding earthquake area were aligned with the direction of the fault that caused the earthquake, resulting in many landslides distributed along the two banks of the rivers. Among these landslides, the proportion of geological landslides within 400 m of the river system reached 42.32%, whereas when the distance of the water system was in the range of 1,800–2,000 m, the proportion of landslides was only 1.8%. Notably, when the distance of the water system was greater than 2000 m, the landslide area slightly increased, which was due to the influence of other factors on the distribution of landslides. The fault development in the Luding research area cut the rock mass into blocks or fragments, reducing the strength of the rock mass and forming structural conditions conducive to the formation and development of geological landslides. The correlation between coseismic landslides and the distance to closest fault is shown in Figure 7. The statistical results indicate that with increasing distance to closest fault, the distribution area and density of landslides significantly decreased, confirming that the fault had an important impact on the development of landslides. Among them, geological landslides were distributed mainly within a range of 4 km from the fault, and the area of landslide development reaches 7.22 km2, accounting for 94.5% of the total area. When the distance to closest fault was >6 km, there was essentially no distribution of landslides. On the basis of the 1:200000 regional geological map, the main lithologies exposed in the Luding research area included hard intrusive rock masses, layered metamorphic rocks with alternating soft and hard layers, weak thin-bedded clastic rocks, hard medium-to thick-bedded carbonate rock masses, hard massive volcanic rocks, and loose rock masses. According to the statistical results of the area and gradational surface density of geological landslides with different lithologies, as shown in Figure 7, the landslides were distributed mainly in the hard intrusive rock mass, and the proportion of landslides reached 64.94%. The other components were sorted by coverage rate and included layered metamorphic rocks with alternating soft and hard layers (16.97%), hard massive volcanic rocks (7.94%), weak thin-bedded clastic rocks (4.93%), loose rock masses (4.27%), and hard medium-to thick-bedded carbonate rock masses (0.95%).
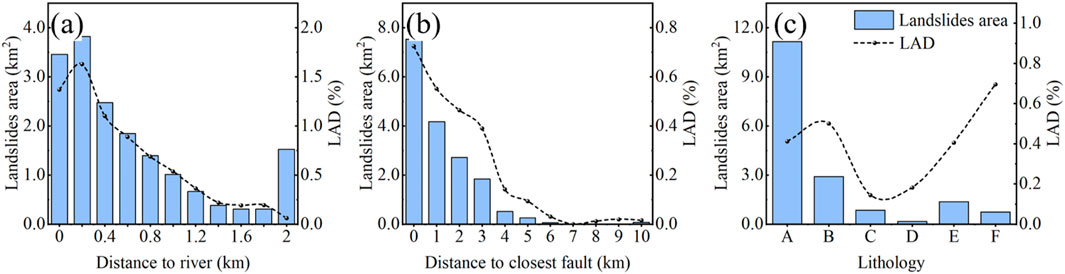
Figure 7. Statistical chart of geological factors. (a) Distance to river, (b) distance to closest fault, (c) lithology (A: hard intrusive rock mass, B: layered metamorphic rocks with alternating soft and hard layers, C: weak thin-bedded clastic rocks, D: hard medium- to thick-bedded carbonate rock mass, E: hard massive volcanic rocks, F: loose rock mass).
4.3 Landslide susceptibility
4.3.1 Factor selection
On the basis of the analysis of the distribution patterns of geological landslides triggered by earthquakes in the previous text, we preliminarily selected the PGA, intensity, distance to seismic fault, altitude, slope, aspect, plan curvature, distance to river, distance to closest fault, and 10 lithology factors as the factors for evaluating the prediction model of geological landslides triggered by earthquakes. In model establishment, if the independent variables interfere with each other, it leads to distortion of the model estimation.
Therefore, it was necessary to conduct a collinearity analysis of the 10 influencing factors initially selected. Figure 8 shows the spearman correlation coefficient matrix of the environmental factors. Among the aforementioned factors, the correlation coefficient between the PGA and intensity was 0.72, which indicated moderate correlation; the correlation coefficient between the altitude and the distance to seismic fault was 0.56, which indicated moderate correlation; and the correlation coefficient between the elevation and the distance to river was 0.62, which indicated moderate correlation. Considering that the PGA can intuitively reflect the release of seismic energy, we did not consider intensity and altitude when establishing the model. Therefore, we input the remaining 8 factors as evaluation factors into the model and established an index system for evaluating the risk of geological landslides triggered by earthquakes via machine learning.
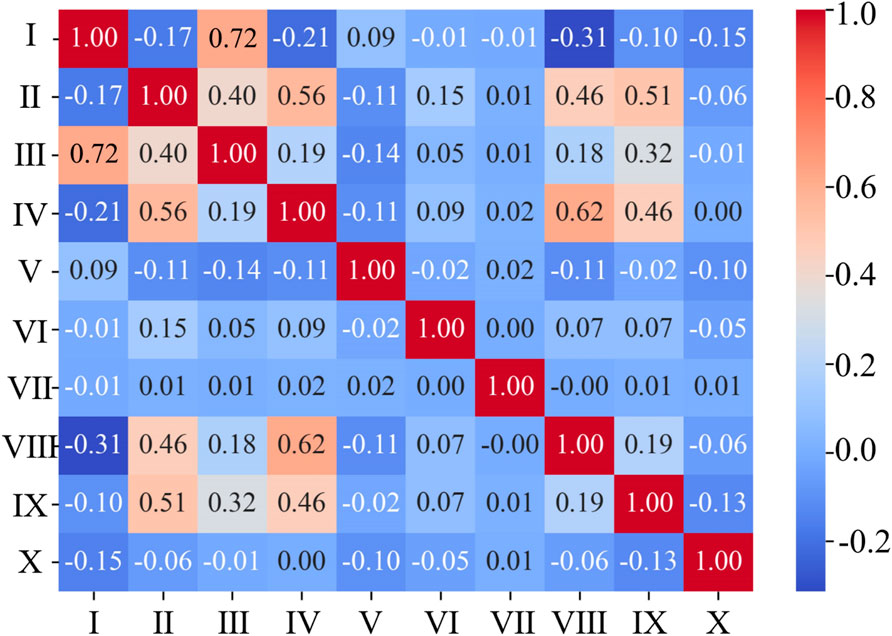
Figure 8. Pearson correlation coefficients (Ⅰ) PGA, (Ⅱ) distance to seismic fault, (III) intensity, (Ⅳ) altitude, (Ⅴ) slope, (Ⅵ) aspect, (Ⅶ) plan curvature, (Ⅷ) distance to river, (Ⅸ) distance to closest fault, and (Ⅹ) lithology.
4.3.2 Landslide susceptibility mapping
On the basis of the catalog of geological landslides triggered by earthquakes and eight evaluation factors, such as slope and aspect, in this study, RF, GBDT and XGBoost were used to establish three spatial distribution prediction models of geological landslides triggered by earthquakes, and the spatial distribution of geological landslides triggered by the Luding earthquake in 2022 were evaluated using these three prediction models. The optimal model was selected through comparison of the ROC curves.
The spatial distribution of geological landslides triggered by the Luding earthquake predicted by the RF machine learning model is shown in Figure 9. The landslides possibly induced by the Luding earthquake were distributed mainly in the eastern and southeastern parts of the epicentre and on both sides of the Dadu River, especially in Moxi town, De Tuo town and Tianwan Yi national township, which are relatively close to the epicentre, where the probability of landslides is the highest. According to the probability of landslides, the area proportion of each probability partition is shown in the Table 2. The extremely high probability area accounted for 7.56% of the total area of the study area. In terms of the distribution of landslides, 89.77% of the landslide points were in the high- and extremely high-probability areas, and 5.76% of the landslide points were in the low-probability areas.
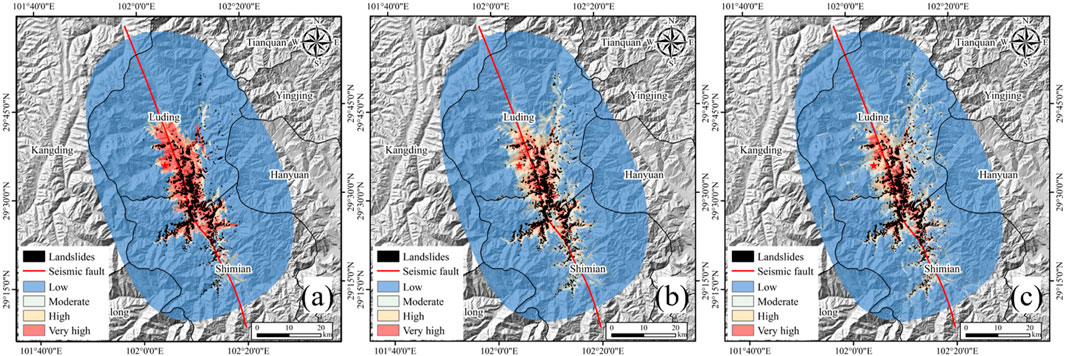
Figure 9. Results of the landslide probability distributions predicted by machine learning models. (a) RF, (b) GBDT, (c) XGBoost.
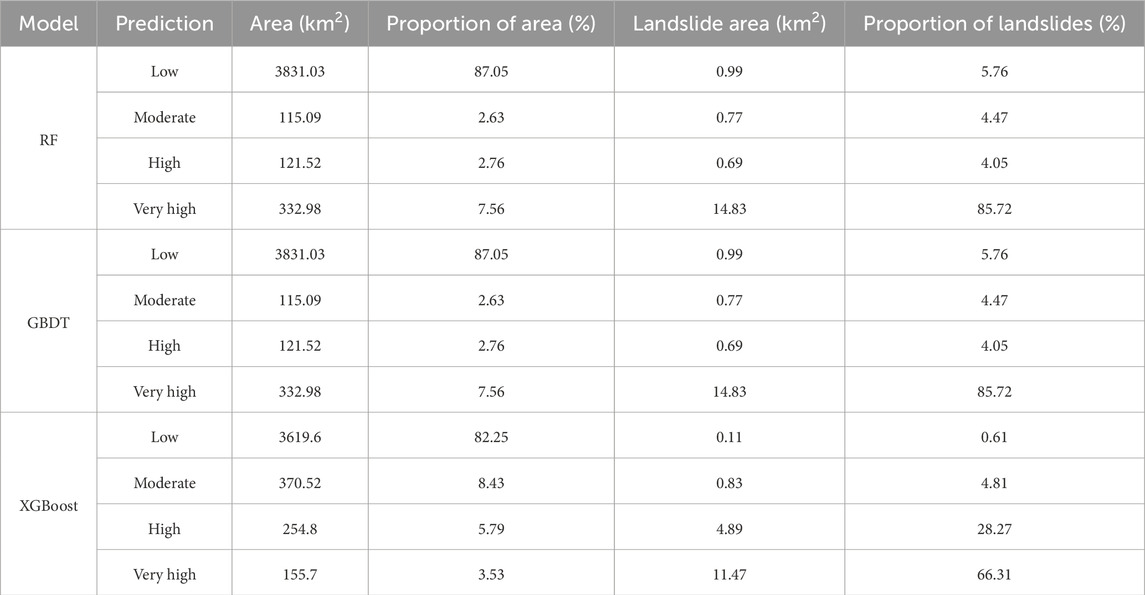
Table 2. Landslide probability distribution based on machine learning models.
The map of the probability distribution of geological landslides triggered by the Luding earthquake using the GBDT machine learning model is basically consistent with the prediction results of the RF model and the XGBoost model. According to the probability of landslide occurrence, the area proportion in each probability partition is shown in the table. The extremely high probability area accounts for 3.53% of the total area of the study area. In terms of the distribution of landslides, 94.58% of the landslide points are in the high- and extremely high-probability areas, and 0.61% of the landslide points are in the low-probability partitions.
The probability distribution map of geological landslides triggered by the Luding earthquake was made based on predictions by the XGBoost machine learning model. The landslides possibly induced by the Luding earthquake were concentrated mainly in the alpine valley area, among which the probability of landslide distribution was the highest in Wanggangping town and De Tuo town, followed by the areas around Caoke town and Moxi town. According to the probability of landslide occurrence, we counted the area proportion in each probability partition. The extremely high probability area accounted for 4.12% of the total area of the study area, and it was distributed along the fault. This was due to the greater distance to seismic fault, the impact of the earthquake, and the greater fragility of the geological environment, which made it easier to form geological landslides under the influence of earthquakes and other factors. The distribution of landslides revealed that 98.16% of the landslide points were in high- and extremely high-probability zones and that 0.13% of the landslide points were in low-probability zones. These findings indicate that the model had good recognition ability for coseismic landslides.
4.3.3 Model performance evaluation and comparison
To quantitatively evaluate the results of the spatial distribution of landslides, we used the ROC curve to evaluate the accuracy of the four models. In the Luding earthquake landslide area, a total of 7,199 landslide points were created, and the same number of non-landslide points were created in areas where landslides did not occur, totaling 14,398 points. The ROC curve is plotted in Figure 10. The AUC value of the XGBoost model was 0.941, the AUC value of the RF model was only 0.9166, and the AUC value of the GBDT model was 0.892, which was the lowest accuracy among the three models. In summary, all three models were significantly better than the reference line and had good predictive capabilities. The XGBoost model had the best prediction accuracy among the three models.
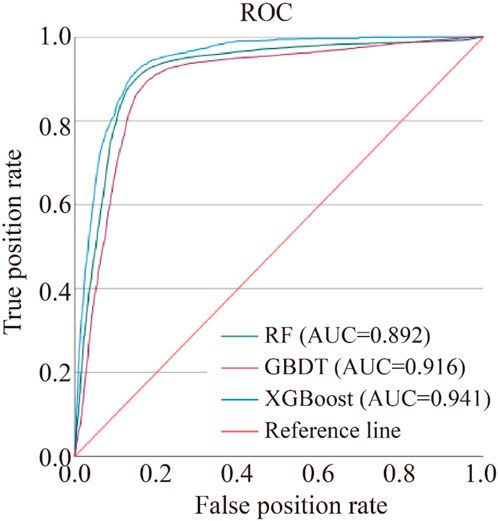
Figure 10. ROC curves of machine learning models.
5 Discussion
5.1 Explaining model predictions of landslide susceptibility with SHAP
In this paper, coseismic landslides in high-intensity areas were interpreted through remote sensing satellite images, and a total of 5,386 landslides were interpreted, covering an area of 22.2 km2. On the basis of the results of the interpretation, we analyzed the spatial distribution pattern of coseismic landslides and studied the relationships between the spatial distributions of coseismic landslides and seismic, topographic, and geological factors. Three models, i.e., RF, GBDT and XGBoost, were used to predict the spatial distribution of coseismic landslides in the study area, and through comparison, we determined that the optimal prediction model among the three models was the XGBoost model.
We used the XGBoost–SHAP algorithm to visualize the interpretation results (Figure 11A). The vertical axis represents the features arranged vertically and sorted from top to bottom according to their influence. The features at the top have a greater overall impact on the model’s output, whereas the features at the bottom have less influence. The horizontal axis represents the size of each feature’s impact on the prediction results. The farther a point is from the centerline (zero point), the greater the feature’s influence on the model’s output. A positive SHAP value indicates a positive impact, whereas a negative SHAP value indicates a negative impact.
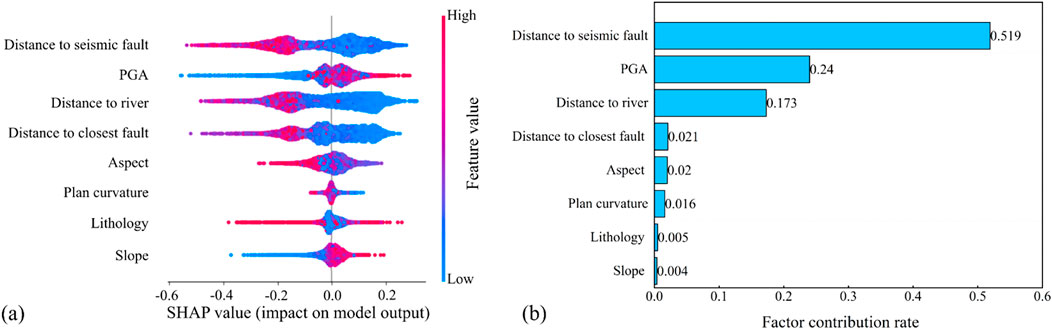
Figure 11. SHAP values of landslide characterization factors. (a) SHAP values of landslide characterization factors; (b) Influencing factor contribution rate.
The average of the absolute values of the SHAP value samples is taken to obtain the importance of each feature and determine the contribution to the model (Figure 11B). The results of the calculation reveal that different characteristic factors have different degrees of nonlinear influence on the formation of coseismic landslides. Among them, the distance to seismic fault (52%), the PGA (24%) and the distance to river (17%) play major controlling roles in the coseismic landslides induced by the Luding earthquake, with a cumulative weight proportion of 93%. On the basis of the SHAP model, we analyzed the mode of control of each characteristic factor for the coseismic landslides induced by the Luding earthquake (Budimir et al., 2014). The distance to seismic fault is the most significant factor in the model, and its range of SHAP values is relatively large, indicating that its contribution to model prediction is significant and that its mode of action is more complex. The influence of high eigenvalues (far from faults) on model predictions tends to be positive, whereas low eigenvalues (close to faults) significantly reduce the predicted values (Fan et al., 2019). The PGA makes a highly concentrated and stable contribution to model predictions, and high eigenvalues significantly enhance model predictions, indicating that it plays an important role in geological hazard-related events.
The mode of action of different characteristics varies in the model: the influence of the distance to river and slope shows a nonlinear distribution, indicating that these topographic features may interact more significantly with specific geological conditions. The influence of lithology and plan curvature on model prediction is relatively small but still shows some pattern differences, which may reflect the importance of secondary features.
SHAP value analysis reveals the interpretability of the results of the model prediction, decomposing the complex “black box” model into the individual contribution values of features to the prediction. This finding is consistent with common-sense knowledge in the field of geology (such as the relationships between seismic faults and earthquake effects, slopes and landslides), thus providing a scientific basis for model reliability. Some features (such as plan curvature) have a small amplitude of impact, which may be due to the insufficient consideration of correlations in the data sampling distribution or feature construction process. Future studies can attempt to add more relevant variables or perform feature engineering optimization.
5.2 Comparison with empirical models of earthquake-induced landslides
Several empirical models have been proposed to estimate the maximum epicentral distance at which earthquake-induced landslides occur. Keefer (1984) provided a widely used relationship based on global earthquake data, while Rodríguez et al. (1999) refined these estimates using a larger dataset. In this study, we found that the maximum landslide epicentral distance was approximately 50 km, which is consistent with the 59 km predicted by Keefer and within the 30–70 km range proposed by Rodríguez et al. for earthquakes of this magnitude. This agreement suggests that these empirical models are applicable to the M 6.8 Luding Earthquake, reinforcing their validity in seismically active mountainous regions. However, while the observed landslide distribution generally follows these empirical relationships, local geological and topographic factors likely played a role in modifying the exact extent of landsliding. The steep slopes, highly fractured lithology, and fault-controlled terrain of the Xianshuihe Fault Zone may have influenced the spatial distribution of landslides, potentially extending their reach beyond the median values predicted by global datasets. These findings highlight the importance of integrating both global empirical models and region-specific geological considerations when assessing landslide hazards following an earthquake. Future studies could refine these empirical models by incorporating additional case studies from active fault zones with complex topography.
5.3 Potential influence of post-earthquake rainfall
While earthquake shaking was the primary trigger for landslides in this study, we cannot entirely rule out the contribution of post-earthquake rainfall to some mapped failures. Similar cases have been reported in previous studies (Martino et al., 2020), where heavy rainfall following an earthquake reactivated slopes already weakened by seismic shaking. To assess the potential impact of post-earthquake rainfall on landslides, we obtained daily rainfall records from meteorological stations for the study area. The recorded rainfall between August and October 2022 was analyzed, covering the period between the acquisition of pre- and post-earthquake satellite images. The rainfall analysis (Figure 12) shows that a 100 mm rainfall event occurred on September 10, 5 day after the earthquake, followed by additional precipitation in the subsequent weeks. This raises the possibility that some landslides could have been triggered solely by rainfall or through a combined effect of seismic shaking and precipitation-induced pore pressure increase. However, our spatial analysis indicates that the landslide distribution aligns closely with areas of high PGA and seismic fault proximity, which supports the hypothesis that most landslides were primarily earthquake-induced. Future research should incorporate time-series landslide detection using multi-temporal remote sensing and hydrological models to better distinguish between seismic and rainfall-induced landslides.
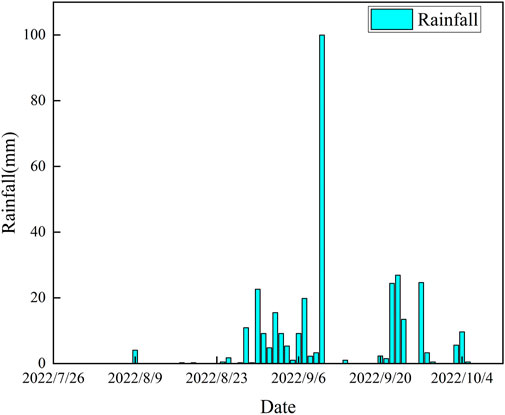
Figure 12. Precipitation data analysis.
6 Conclusion
To clarify the characteristics of the spatial patterns of the coseismic landslides caused by the Luding earthquake in 2022, we interpreted the Planet satellite images with a resolution of 3 m as the basis, took the area above intensity VII of the 2022 Luding Ms 6.8 earthquake as the study area, and intuitively interpreted the coseismic landslides triggered by the earthquake. The 2022 Luding earthquake triggered at least 5,386 landslides in an area of 22.2 km2; more than 99% of the landslides were distributed in Luding County and Shimian County. The correlations between the spatial patterns of coseismic landslides and ten potential controlling factors, such as the PGA, intensity, distance to closest fault, altitude, slope, aspect, plan curvature, distance to river, distance to closest fault, and lithology, were analyzed. The coseismic landslides associated with the Luding earthquake occurred mainly on both sides of the Xianshuihe fault and were distributed in a strip shape. They were mainly concentrated in areas with altitudes ranging from 1,000 to 1,800 m, slopes ranging from 30° to 50°, and hard intrusive rock masses.
On the basis of the historical landslide dataset identified by comprehensive remote sensing recognition technology, grid cells were used for the calculation and evaluation units, 3 different machine learning models were selected, and the spatial distributions of coseismic landslides were predicted on the basis of correlation analysis of the factors used for evaluation. Through ROC curve evaluation and analysis, we evaluated the consistency of the results of the evaluation with the historical landslide data and finally analyzed the prediction accuracy of the prediction model for coseismic landslides. Three models, i.e., RF, GBDT and XGBoost, were used to predict the distribution of earthquake geological landslides, and the XGBoost model performed well in landslide prediction in the study area, with reliable evaluation results and high model accuracy. Through SHAP value analysis, we revealed the contribution and mechanism of each input feature to the model’s prediction results. The distance to seismic fault and the PGA were the most significant features affecting the model, and high or low feature values significantly affected the prediction results. The distance to river and the slope also had a moderate influence, whereas the contributions of the plan curvature and the engineering rock mass were relatively small. The overall results show that geologically and topographically related features had different degrees of influence on model prediction, providing a scientific basis for model interpretability and practical application. The comprehensive interpretation framework based on the XGBoost–SHAP model can quantify the importance and contribution of each factor, which can provide a reference for the study of machine learning interpretation capabilities. It can provide effective support and guidance for emergency rescue, risk mitigation, and reconstruction planning.
Data availability statement
The raw data supporting the conclusions of this article will be made available by the authors, without undue reservation.
Author contributions
ZD: Formal Analysis, Software, Writing – original draft. CW: Methodology, Supervision, Validation, Writing – review and editing.
Funding
The author(s) declare that no financial support was received for the research and/or publication of this article.
Conflict of interest
The authors declare that the research was conducted in the absence of any commercial or financial relationships that could be construed as a potential conflict of interest.
Generative AI statement
The author(s) declare that no Generative AI was used in the creation of this manuscript.
Publisher’s note
All claims expressed in this article are solely those of the authors and do not necessarily represent those of their affiliated organizations, or those of the publisher, the editors and the reviewers. Any product that may be evaluated in this article, or claim that may be made by its manufacturer, is not guaranteed or endorsed by the publisher.
References
Alvioli, M., Guzzetti, F., and Marchesini, I. (2020). Parameter-free delineation of slope units and terrain subdivision of Italy. Geomorphology 358, 107124. doi:10.1016/j.geomorph.2020.107124
Budimir, M. E. A., Atkinson, P. M., and Lewis, H. G. (2014). Earthquake-and-Landslide events are associated with more fatalities than earthquakes alone. Nat. Hazards 72, 895–914. doi:10.1007/s11069-014-1044-4
Budimir, M. E. A., Atkinson, P. M., and Lewis, H. G. (2015). A systematic review of landslide probability mapping using logistic regression. Landslides 12, 419–436. doi:10.1007/s10346-014-0550-5
Calderoni, L., Ferrara, M., Franco, A., and Maio, D. (2015). Indoor localization in a hospital environment using random forest classifiers. Expert Syst. Appl. 42, 125–134. doi:10.1016/j.eswa.2014.07.042
Caruana, R., Lou, Y., Gehrke, J., Koch, P., Sturm, M., and Elhadad, N. (2015). “Intelligible models for HealthCare: predicting pneumonia risk and hospital 30-day readmission,” in Proceedings of the 21th ACM SIGKDD International Conference on Knowledge Discovery and Data Mining (Sydney, NSW, Australia: ACM), 1721–1730.
Cemiloglu, A., Zhu, L., Mohammednour, A. B., Azarafza, M., and Nanehkaran, Y. A. (2023). Landslide susceptibility assessment for maragheh county, Iran, using the logistic regression algorithm. Land 12, 1397. doi:10.3390/land12071397
Chen, T., and Guestrin, C. (2016). XGBoost: a scalable tree boosting system. Proc. Proc. 22nd ACM SIGKDD Int. Conf. Knowl. Discov. Data Min. 785–794. doi:10.1145/2939672.2939785
Chen, W. (2017). A comparative study of logistic model tree, random forest. Classif. Regres. Tree Models Spatial Predict. Landslide Susceptibility. doi:10.1016/j.catena.2016.11.032
Dai, F. C., Xu, C., Yao, X., Xu, L., Tu, X. B., and Gong, Q. M. (2011). Spatial distribution of landslides triggered by the 2008 Ms 8.0 wenchuan earthquake, China. J. Asian Earth Sci. 40, 883–895. doi:10.1016/j.jseaes.2010.04.010
Dai, L., Fan, X., Wang, X., Fang, C., Zou, C., Tang, X., et al. (2023). Coseismic landslides triggered by the 2022 luding Ms6.8 earthquake, China. Landslides 20, 1277–1292. doi:10.1007/s10346-023-02061-3
Fan, X., Scaringi, G., Korup, O., West, A. J., Van Westen, C. J., Tanyas, H., et al. (2019). Earthquake-induced chains of geologic hazards: patterns, mechanisms, and impacts. Rev. Geophys. 57, 421–503. doi:10.1029/2018RG000626
Fan, X., Scaringi, G., Xu, Q., Zhan, W., Dai, L., Li, Y., et al. (2018). Coseismic landslides triggered by the 8th August 2017 Ms 7.0 Jiuzhaigou earthquake (sichuan, China): factors controlling their spatial distribution and implications for the seismogenic blind fault identification. Landslides 15, 967–983. doi:10.1007/s10346-018-0960-x
Fan, X., Yunus, A. P., Scaringi, G., Catani, F., Siva Subramanian, S., Xu, Q., et al. (2021). Rapidly evolving controls of landslides after a strong earthquake and implications for hazard assessments. Geophys. Res. Lett. 48, e2020GL090509. doi:10.1029/2020GL090509
Gorum, T., Van Westen, C. J., Korup, O., Van Der Meijde, M., Fan, X., and Van Der Meer, F. D. (2013). Complex rupture mechanism and topography control symmetry of mass-wasting pattern, 2010 Haiti earthquake. Geomorphology 184, 127–138. doi:10.1016/j.geomorph.2012.11.027
Guihua, C., Xiwei, X., Xueze, W., and Yue-Gau, C. (2016). Late quaternary slip-rates and slip partitioning on the southeastern Xianshuihe Fault system, eastern Tibetan plateau. ACTA Geol. Sin. 90, 537–554. doi:10.1111/1755-6724.12689
Guo, X., Fu, B., Du, J., Shi, P., Li, J., Li, Z., et al. (2021). Monitoring and assessment for the susceptibility of landslide changes after the 2017 Ms 7.0 Jiuzhaigou earthquake using the remote sensing technology. Front. Earth Sci. 9, 633117. doi:10.3389/feart.2021.633117
He, X., and Xu, C. (2022). Spatial distribution and tectonic significance of the landslides triggered by the 2021 Ms6.4 yangbi earthquake, yunnan, China. Front. Earth Sci. 10, 1030417. doi:10.3389/feart.2022.1030417
He, X., Xu, C., Qi, W., and Huang, Y. (2024). Contrasting landslides distribution patterns and seismic rupture processes of 2014 jinggu and ludian earthquakes, China. Sci. Rep. 14, 28470. doi:10.1038/s41598-024-79682-8
Huang, Y., Xie, C., Li, T., Xu, C., He, X., Shao, X., et al. (2023). An open-accessed inventory of landslides triggered by the MS 6.8 luding earthquake, China on september 5, 2022. Earthq. Res. Adv. 3, 100181. doi:10.1016/j.eqrea.2022.100181
Keefer, D. K. (1984). Landslides caused by earthquakes. Geol. Soc. Am. Bull. 95, 406–421. doi:10.1130/0016-7606(1984)95<406:lcbe>2.0.co;2
Kohestani, V. R., Hassanlourad, M., and Ardakani, A. (2015). Evaluation of liquefaction potential based on CPT data using random forest. Nat. Hazards 79, 1079–1089. doi:10.1007/s11069-015-1893-5
Lin, N., Zhang, D., Feng, S., Ding, K., Tan, L., Wang, B., et al. (2023). Rapid landslide extraction from high-resolution remote sensing images using SHAP-OPT-XGBoost. Remote Sens. 15, 3901. doi:10.3390/rs15153901
Liu, Y., Ma, S., Dong, L., Xiao, R., Huang, J., and Zhou, P. (2024). A comparative study of regional rainfall-induced landslide early warning models based on RF, CNN and MLP algorithms. Front. Earth Sci. 12, 1419421. doi:10.3389/feart.2024.1419421
Mao, Y., Li, Y., Teng, F., Sabonchi, A. K. S., Azarafza, M., and Zhang, M. (2024). Utilizing hybrid machine learning and soft computing techniques for landslide susceptibility mapping in a drainage basin. Water 16, 380. doi:10.3390/w16030380
Martino, S., Antonielli, B., Bozzano, F., Caprari, P., Discenza, M. E., Esposito, C., et al. (2020). Landslides triggered after the 16 August 2018 Mw 5.1 molise earthquake (Italy) by a combination of intense rainfalls and seismic shaking. Landslides 17, 1177–1190. doi:10.1007/s10346-020-01359-w
Nanehkaran, Y. A., Chen, B., Cemiloglu, A., Chen, J., Anwar, S., Azarafza, M., et al. (2023). Riverside landslide susceptibility overview: leveraging artificial neural networks and machine learning in accordance with the united nations (UN) sustainable development goals. Water 15, 2707. doi:10.3390/w15152707
Nanehkaran, Y. A., Mao, Y., Azarafza, M., Kockar, M. K., and Zhu, H.-H. (2021). Fuzzy-based multiple decision method for landslide susceptibility and hazard assessment: a case study of Tabriz, Iran. Geomech. Eng. 24, 407–418. doi:10.12989/GAE.2021.24.5.407
Nowicki Jessee, M. A., Hamburger, M. W., Allstadt, K., Wald, D. J., Robeson, S. M., Tanyas, H., et al. (2018). A global empirical model for near-real-time assessment of seismically induced landslides. J. Geophys. Res. Earth Surf. 123, 1835–1859. doi:10.1029/2017JF004494
Rodríguez, C. E., Bommer, J. J., and Chandler, R. J. (1999). Earthquake-induced landslides: 1980-1997. Soil Dyn. Earthq. Eng. 18, 325–346. doi:10.1016/s0267-7261(99)00012-3
Shao, X., and Xu, C. (2022). Earthquake-induced landslides susceptibility assessment: a review of the state-of-the-art. Nat. Hazards Res. 2, 172–182. doi:10.1016/j.nhres.2022.03.002
Tanyas, H., Rossi, M., Alvioli, M., Van Westen, C. J., and Marchesini, I. (2019). A global slope unit-based method for the near real-time prediction of earthquake-induced landslides. Geomorphology 327, 126–146. doi:10.1016/j.geomorph.2018.10.022
Wang, G. (2015). Comparison of the landslides triggered by the 2013 lushan earthquake with those triggered by the strong 2008 wenchuan earthquake in areas with high seismic intensities. Bull. Eng. Geol. Environ. 74, 77–89. doi:10.1007/s10064-014-0574-z
Wang, J., and Dong, L. (2024). Risk assessment of rockburst using SMOTE oversampling and integration algorithms under GBDT framework. J. Cent. South Univ. 31, 2891–2915. doi:10.1007/s11771-024-5782-5
Wen, H., Liu, B., Di, M., Li, J., and Zhou, X. (2024). A SHAP-enhanced XGBoost model for interpretable prediction of coseismic landslides. Adv. Space Res. 74, 3826–3854. doi:10.1016/j.asr.2024.07.013
Williams, J. G., Rosser, N. J., Hardy, R. J., Brain, M. J., and Afana, A. A. (2018). Optimising 4-D surface change detection: an approach for capturing rockfall magnitude–frequency. Earth Surf. Dyn. 6, 101–119. doi:10.5194/esurf-6-101-2018
Xiong, J., Chen, H., Zeng, L., Su, F., Gong, L., and Tang, C. (2023). Coseismic landslide sediment increased by the “9.5” luding earthquake, sichuan, China. J. Mt. Sci. 20, 624–636. doi:10.1007/s11629-022-7770-2
Xu, C., and Xu, X. (2014). Statistical analysis of landslides caused by the mw 6.9 Yushu, China, earthquake of april 14, 2010. Nat. Hazards 72, 871–893. doi:10.1007/s11069-014-1038-2
Xu, C., Xu, X., and Shyu, J. B. H. (2015). Database and spatial distribution of landslides triggered by the Lushan, China Mw 6.6 earthquake of 20 April 2013. Geomorphology 248, 77–92. doi:10.1016/j.geomorph.2015.07.002
Xu, C., Xu, X., Yao, X., and Dai, F. (2014). Three (nearly) complete inventories of landslides triggered by the may 12, 2008 wenchuan Mw 7.9 earthquake of China and their spatial distribution statistical analysis. Landslides 11, 441–461. doi:10.1007/s10346-013-0404-6
Yang, Z., Pang, B., Dong, W., and Li, D. (2023). Spatial pattern and intensity mapping of coseismic landslides triggered by the 2022 Luding earthquake in China. Remote Sens. 15, 1323. doi:10.3390/rs15051323
Zhang, J., Ma, X., Zhang, J., Sun, D., Zhou, X., Mi, C., et al. (2023). Insights into geospatial heterogeneity of landslide susceptibility based on the SHAP-XGBoost model. J. Environ. Manage. 332, 117357. doi:10.1016/j.jenvman.2023.117357
Zhao, B., Hu, K., Yang, Z., Liu, Q., Zou, Q., Chen, H., et al. (2022). Geomorphic and tectonic controls of landslides induced by the 2022 luding earthquake. J. Mt. Sci. 19, 3323–3345. doi:10.1007/s11629-022-7732-8
Zhao, B., Su, L., Qiu, C., Lu, H., Zhang, B., Zhang, J., et al. (2024). Understanding of landslides induced by 2022 luding earthquake, China. J. Rock Mech. Geotech. Eng., S1674775524003093. doi:10.1016/j.jrmge.2024.07.006
Zhao, B., Su, L., Xu, Q., Li, W., Xu, C., and Wang, Y. (2023). A review of recent earthquake-induced landslides on the Tibetan plateau. Earth-Sci. Rev. 244, 104534. doi:10.1016/j.earscirev.2023.104534
Keywords: coseismic landslides, 2022 Luding earthquake, spatial distribution, machine learning, SHAP analysis
Citation: Ding Z and Wang C (2025) Coseismic landslides caused by the 2022 Luding earthquake in China: insights from remote sensing interpretations and machine learning models. Front. Earth Sci. 13:1564744. doi: 10.3389/feart.2025.1564744
Received: 22 January 2025; Accepted: 10 April 2025;
Published: 28 April 2025.
Edited by:
Yunteng Wang, King Abdullah University of Science and Technology, Saudi ArabiaReviewed by:
Mohammad Azarafza, University of Tabriz, IranMatteo Fiorucci, University of Cassino, Italy
Copyright © 2025 Ding and Wang. This is an open-access article distributed under the terms of the Creative Commons Attribution License (CC BY). The use, distribution or reproduction in other forums is permitted, provided the original author(s) and the copyright owner(s) are credited and that the original publication in this journal is cited, in accordance with accepted academic practice. No use, distribution or reproduction is permitted which does not comply with these terms.
*Correspondence: Chun Wang, Y2h1bndhbmcyMDI1NjZAMTYzLmNvbQ==