 Tien Le
 Qian (Chayn) Sun1
 Trinh Duc Tran
- 1School of Science (Geospatial), Royal Melbourne Institute of Technology (RMIT) University, Melbourne, VIC, Australia
- 2Royal Melbourne Institute of Technology (RMIT) University, Ho Chi Minh City, VIC, Australia
- 3The Australian Bureau of Meteorology, Melbourne, VIC, Australia
A challenge in agricultural drought risk assessment is the lack of standardization for selecting indicators and aggregation methods, leading to inconsistent and less reliable outcomes. This issue is particularly evident in Vietnam, where diverse agricultural practices and regional climates add complexity to the assessment process. This study proposes a methodological framework specifically designed for Vietnam’s agricultural sector. It recommends the use of the Standardized Precipitation Index Vegetation Health Index and Soil Moisture (SM) for assessing drought hazards, while socioeconomic indicators such as agricultural land, population, Gross Domestic Product total income, agriculture-based income, literacy rate, and poverty rate are suggested for evaluating exposure and vulnerability. The research assesses drought risk across mainland Vietnam from 2015 to 2022, employing both equal proportion and Principal Component Analysis (PCA) to determine indicator weightings. The study highlights the advantages of Geographic Information System (GIS) and Remote Sensing data in evaluating drought risk across Vietnam. The result of spatiotemporal analysis shows that the drought hazard index varies significantly on a monthly basis, while exposure and vulnerability indices remain relatively stable over the years. During the examined period, 2015 and 2016 were identified as the years with the highest drought risk, followed by 2019 and 2020. The Mekong Delta, Central Highlands, and Northwest regions consistently exhibited high drought risk, reflecting their agricultural practices and socioeconomic vulnerabilities. This dynamic analysis provides critical insights for policymakers and stakeholders to proactively manage drought impacts in Vietnam’s agricultural sector.
1 Introduction
Drought risk refers to the likelihood of experiencing damage and economic losses caused by droughts. The concept of risk is often understood as the probability of adverse outcomes resulting from the interaction between hazards and vulnerability (Blauhut, 2020). Recent research agrees that the occurrence of a drought hazard alone does not necessarily lead to an emergency response. Whether a drought event escalates into an emergency depends on its impact on local stakeholders, communities, and society, which is shaped by their vulnerability to the hazard (Hagenlocher et al., 2023). Following that, the assessment approach proposed by the Intergovernmental Panel on Climate Change (IPCC) emphasizes the need for a comprehensive approach that goes beyond focusing solely on drought hazards and incorporates the experiences of those affected by severe drought events. According to this approach, drought risk is determined by three components: hazard, exposure, and vulnerability (IPCC, 2022). Drought hazard refers to dry weather or climate conditions that have an impact on the study objective or a specific area. It is characterized by the probability of a drought event occurring in a particular region with sufficient severity and duration to cause damage within a given time frame. Exposure, on the other hand, refers to the presence of people, livelihoods, properties, and systems that are susceptible to potential damage caused by drought. In the context of agricultural drought, exposure includes crops, farmers, and other workers in the agricultural sector who are at risk of being negatively impacted by drought (Yang et al., 2023). Vulnerability, the third component, refers to the sensitivity or susceptibility to damage and the lack of adaptive capacity (Bourne et al., 2023).
From a temporal perspective, drought risk assessment (DRA) approach can be described as dynamic, semi-dynamic, or static according to time scale. Dynamic DRAs assess drought risk using time series to reflect the change of drought risk over a relatively short time (e.g., on a monthly basis), while static DRA provides general information of overall risk based on a longer period (e.g., annually or longer). Semi-dynamic, on the other hand, combines both dynamic and static characteristics. Many studies use dynamic hazard data in combination with static socioeconomic data for drought risk calculation, as hazard is the most dynamic part of overall risk, while data unavailability limits exposure and vulnerability to be assessed dynamically (Hoque et al., 2021; Song et al., 2022). Monitoring long-term drought risk progression, not only in terms of hazard dimension but also socioeconomic aspects, has been increasingly acknowledged as important for a more comprehensive understanding of drought risk and the development of adaptation strategies (Ai et al., 2021; Yang et al., 2023). This is because variations in indicators over time can offer insights into risk underlying causes in different geographical areas (Song et al., 2022). Also, the change of risk levels would indicate response degrees made by decision makers to adapt to drought extreme events (Dunne and Kuleshov, 2023). Therefore, dynamic risk assessment is highly recommended for DRA research to increase its common applicability in a particular region.
Among four conventional drought types (Mishra and Singh, 2010), agricultural drought is a type of drought that specifically impacts the agricultural sector. Agricultural activities are highly dependent on water availability, making them particularly vulnerable to the impacts of drought (Mishra et al., 2025). Drought events can disrupt agricultural production, leading to reduced crop yields, food insecurity, economic losses, and potential livelihood crises in rural communities (Elusma et al., 2022). The frequency and severity of agricultural drought events have become a concern (Hoque et al., 2021; Ha et al., 2022; Minh et al., 2022a), especially in the context of climate change (Saha et al., 2023). Therefore, understanding agricultural drought is crucial for effective water resource management and the development of adaptation strategies to its adverse effects on food production and community wellbeing (Islam et al., 2024). Vietnam, a Southeast Asian country with a population heavily reliant on agriculture, has become increasingly vulnerable to drought hazards (Truong et al., 2022). The agricultural sector, employing nearly half of the workforce, ensures national food security and significantly contributes to global food security as a major exporter of rice and coffee (Anh et al., 2023). In the Mekong Delta alone, where nearly 18 million people are engaged primarily in farming, over half of the nation’s rice output and 95% of its rice exports are produced. Recently, the country experienced unprecedented droughts, notably in 2015–2016 and more recently in 2019–2020, which prompted the government to declare a state of emergency during both drought crisis periods (ODV, 2022; UNDP, 2016). According to UNDP (2016), 659,245 ha of cropland, including more than 273,000 ha of rice have been damaged to various degrees during the 2015–2016 drought. The 18 most affected provinces were identified in the Mekong Delta, South-Central Vietnam, and Central Highlands experiencing losses of 70% or more in 161,030 ha of cropland, classified as “extreme loss” by the government. Subsequently, the intense drought and resulting increase in salinity levels in 2019–2020 further damaged significant areas of rice fields, fruit orchards, and vegetable plots. This severe drought also caused water shortages for 96,000 households or 430,000 people in the Mekong Delta (ODV, 2022).
With droughts expected to be more severe and frequent in the future, identifying drought risk at the appropriate spatial and temporal scale is crucial for decision-making in adaptation strategies, especially in the agricultural sector (Xu et al., 2021; Blauhut, 2020). In recent years, research in agricultural drought risk assessment has been expanded in different directions. A significant portion of existing studies continues to focus on drought hazard monitoring, which typically involves the application of various drought indicators such as the Standardized Precipitation Index (SPI), the Standardized Precipitation Evapotranspiration Index (SPEI), and the Palmer Drought Severity Index (PDSI) to evaluate drought severity and track its propagation (Yang et al., 2023; Kumar and Chu, 2024). Concurrently, there has been a notable shift toward examining drought vulnerability from a socioeconomic perspective (Islam et al., 2024; Shiravand and Bayat, 2023; Hedayat and Seyed Kaboli, 2024) as well as applying a more comprehensive approach to conduct a drought risk index incorporating hazard, exposure, and vulnerability (Wu et al., 2025; Liou et al., 2024; Babel et al., 2024). In addition, the rapid advancement of geospatial technologies such as remote sensing and GIS has significantly improved the ability to quantify and visualize agricultural drought risk by integrating multiple factors across varying spatial and temporal scales (Senapati and Das, 2024). Therefore, an increasing number of studies have adopted these technologies to conduct comprehensive drought risk assessments and support spatially explicit decision-making.
However, there are persistent gaps in quantifying and mapping drought risk as pointed out by many scholars (Le et al., 2024). First, the selection of indicators is usually subject to data availability and researchers’ assumptions, as discussed by Kim et al. (2023) and Hagenlocher et al. (2019). It is emphasized that the justification for chosen indicators needs to be in line with the research objective and the diversity of socioecological contexts. In addition, the existing approach for computing composite risk indicators is a matter of contention. As explored by Sahana et al. (2021) and Aitkenhead et al. (2023), although various weighting methods and aggregation approaches utilized in the literature, there is insufficient validation regarding the accuracy of assessment results. This results in significant uncertainty within this research field. Furthermore, there is a deficiency in establishing a connection between drought risk assessment (DRA) research and adaptation strategies, even though the ultimate goal of DRAs is to lay the foundation for the development of drought management strategies. Scholars including Villani et al. (2022) and Blauhut (Blauhut, 2020) also emphasized the importance of integrating scientific assessments with policy-making to enhance drought resilience.
In Vietnam, DRA studies remain limited in both number and methodological depth. Much of the existing research has predominantly focused on analysing drought hazards patterns, trends and characteristics (Stojanovic et al., 2020; Phan et al., 2020; Le et al., 2019; Minh et al., 2022b; Ha D. H. et al., 2024; Ha T. V. et al., 2024). While the study by Pham et al. (2022) incorporated some social factors to assess vulnerability, it primarily emphasizes the hazard component of drought risk in Phu Yen province of Vietnam, focusing on generating the Normalized Difference Drought Index maps as the main output. The research lacks integration of exposure and vulnerability for a comprehensive risk assessment and does not include robust validation methods to support the accuracy of its results. Only a few studies have attempted to comprehensively assess drought risk by integrating hazard, exposure, and vulnerability components, such as those conducted by Thao et al. (2019), Buurman et al. (2020), Le et al. (2021), and Pham et al. (2022). However, these efforts still exhibit several methodological limitations in terms of indicator selection, data sources, and the consideration of spatio-temporal dynamics. For instance, the studies by Thao et al. (2019) and Buurman et al. (2020) are constrained by limited data availability, relying solely on in-situ data and using a single hazard indicator (i.e., SPI) which may not sufficiently capture the multifaceted impacts of drought. Meanwhile, Le et al. (2021) advanced the assessment by incorporating all three components of risk, yet adopted a static approach that does not account for the temporal variation of drought risk. Overall, advancing DRA research in Vietnam requires significant investment in both the quantity and quality of studies, particularly in overcoming data accessibility challenges. In this context, remote sensing and GIS technologies offer promising solutions due to their affordability, broad spatial coverage, and high spatial and temporal resolution.
This study aims to support decision-makers in agricultural drought risk management by providing a comprehensive drought risk assessment in mainland of Vietnam. To achieve this aim, the research has the following objectives: (i) identify the most pertinent indicators and aggregation methodologies for DRA tailored to the unique characteristics of the study area based on sound justification; (ii) conduct temporal and spatial DRA in mainland Vietnam for 2015 to 2022, employing chosen indicators and robust aggregation methods; (iii) to identify high drought risk areas, validated with available historical drought-related agricultural losses within the country, and link the findings with adaptation strategies. This research contributes to the scientific field of drought risk assessment by providing a comprehensive rationale for the selection of indicators and aggregation methods tailored specifically to Vietnam’s agricultural landscape. By customizing these indicators to align with Vietnam’s specific requirements, the study not only enhances the accuracy of DRA but also ensures their applicability to local contexts. Furthermore, this research endeavors to progressively bridge the gap in the field of DRA by accounting for the dynamic nature of drought risk, enhancing the reliability of findings through validation with historical impact records, and linking the results to informed adaptation strategies.
2 Materials and methods
2.1 Theoretical framework
Contemporary research in the field of DRA exhibits distinctive characteristics aimed at enhancing the robustness and applicability of risk evaluation. A notable trend is the adoption of a comprehensive approach that considers all crucial risk components—hazard, exposure, and vulnerability—rather than concentrating solely on the hazard aspect. This holistic perspective ensures a more robust understanding of the multifaceted nature of drought risks. Moreover, researchers frequently employ index-based methods to quantitatively assess, compare, and monitor the intricate complexities of these risks, as demonstrated by Aitkenhead et al. (2023). This methodological choice emphasizes a systematic and standardized approach to capturing the various dimensions of drought impact. Another significant development lies in the integration of Satellite Remote Sensing (SRS) and GIS technologies, as highlighted by Belal et al. (2014). These technological advancements have substantially improved the operational capabilities of DRA by enabling the seamless incorporation of spatial-temporal dynamic changes in climate and socioeconomic data. Consequently, this integration enhances the accuracy and timeliness of drought risk assessments, providing a more comprehensive understanding of the evolving landscape. In essence, the current trajectory of DRA research reflects a commitment to holistic frameworks, sophisticated methodologies, and cutting-edge technologies to capture the intricate spatial-temporal dynamics inherent in climate and socioeconomic data. This study applied comprehensive agricultural DRA to understand the dynamic of risk in Vietnam context. The research workflow is demonstrated in Figure 1.
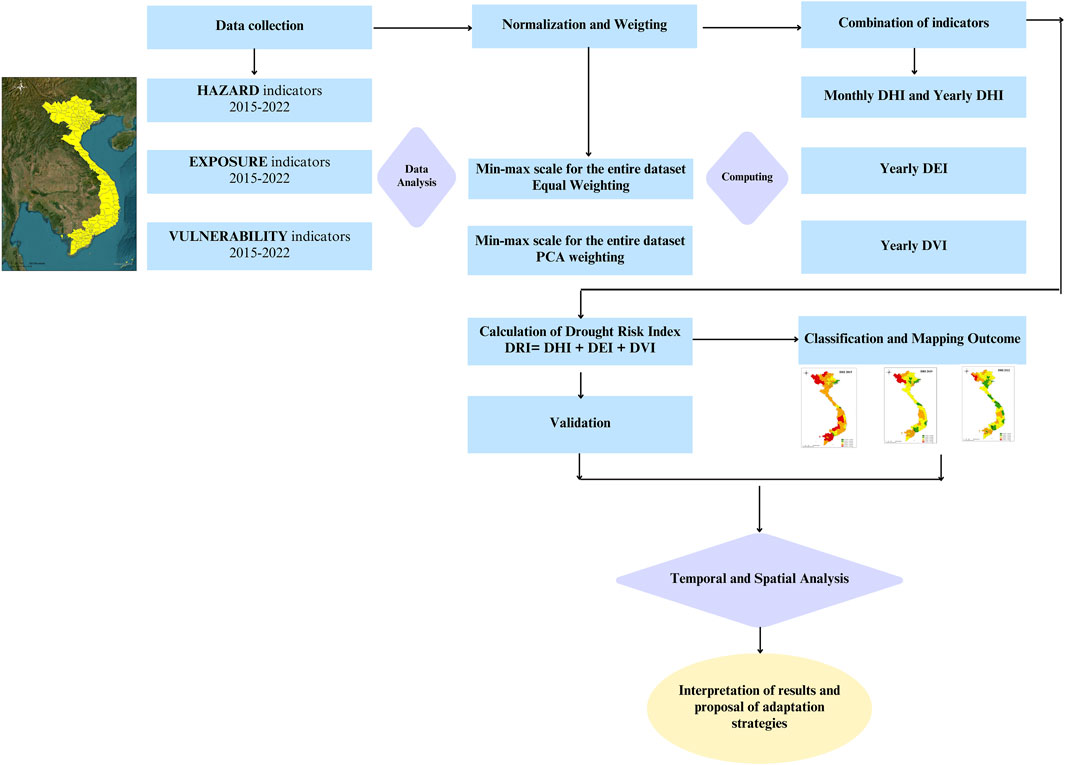
Figure 1. Research workflow.
2.2 Study area
The study area encompasses mainland Vietnam (Figure 2) with the total area of approximately 331,000 km2. The country is predominantly mountainous, with mountain terrain covering three-quarters of its land area and peaks reaching up to 3,000 m. Vietnam is rich in hydrological resources, featuring nine major river systems. The country’s complex topography, along with varying precipitation and temperature conditions, divides Vietnam into seven climatic sub-regions including: Northwest (S1), Northeast (S2), Red River Delta (S3), North Central (S4), South Central (S5), Central Highland (S6), and the Southest (S7), and Mekong Delta (S8) (Stojanovic et al., 2020). Vietnam’s climate is notably diverse, with significant influence from monsoonal patterns and topography. Positioned centrally between the southwest and northeast monsoons, Vietnam experiences a main tropical monsoon climate. This results in distinct wet and dry seasons, with the wet season occurring from May to October and the dry season from November to April (Le et al., 2019). In the north, the tropical monsoon climate, impacted by the northeast monsoon, brings dry conditions early in winter and highly humid conditions later in the season. By contrast, Southern Vietnam, affected by the southwest monsoon, has a moderate tropical climate with clearly defined dry and rainy seasons. The rainy season in the northern and southern central subregions typically spans from mid-August to mid-December, followed by a dry season from January to July (Chandrasekara et al., 2021).
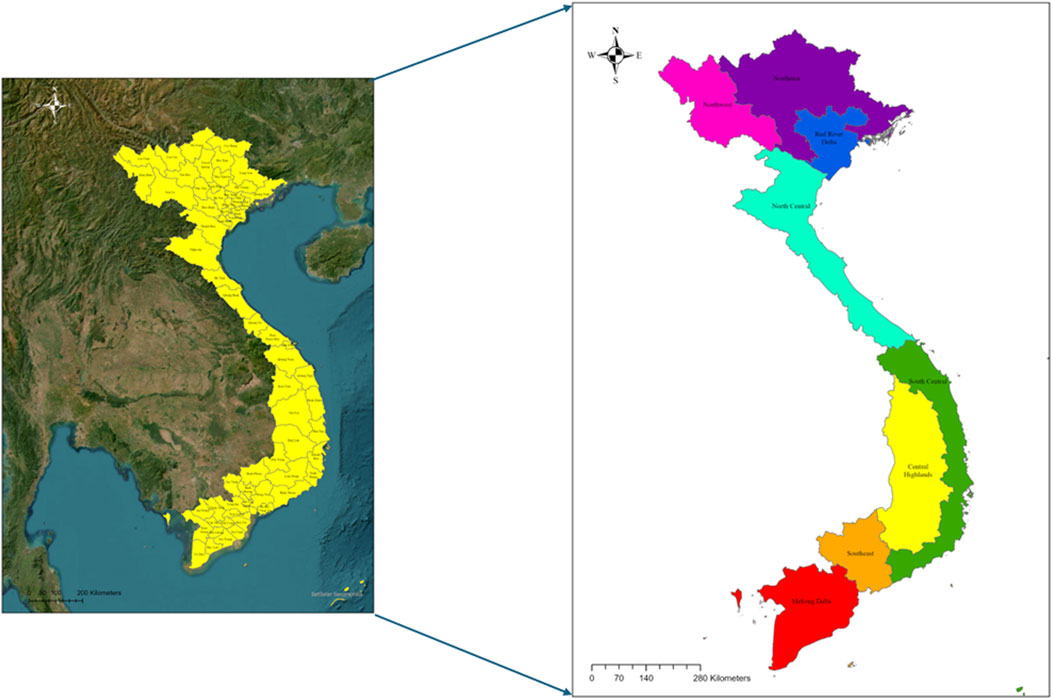
Figure 2. Study area of Vietnam (left) and climatic sub-regions (right).
Regarding socioeconomic conditions, Vietnam had a population of approximately 99.46 million people in 2022. The agriculture, forestry, and fishery sector account for 11.88% of the country’s GDP. The agricultural sector has consistently been crucial to Vietnam’s economic development and food security, providing 29% of employment in 2022 (GSO, 2022). The output of the agriculture, forestry, and fishery sectors sustains the economy by providing increasing quantities and quality of food for domestic consumption and export. The estimated paddy area was 7,109 thousand hectares, with a paddy yield of 60 quintals per hectare in 2022 (World Bank Group, 2024). Socioeconomic conditions vary across different regions of Vietnam. The northern region of Vietnam includes the Northwest, Northeast, and Red River Delta. The mountainous Northwest and Northeast have low GDP per capita and income levels, while the densely populated Red River Delta, home to the capital Hanoi, is the country’s economic, political, and cultural hub. Central Vietnam comprises the North Central and South Central Coast regions. The North Central region, with its narrow coastal strip, relies on agriculture and fishing, resulting in modest economic development. In contrast, the South Central Coast is more industrialized, benefiting from its strategic location and industrial hubs. The Central Highlands face socio-economic challenges, including poor infrastructure and low living standards, but are rich in natural resources, particularly fertile soil for crops like coffee and tea. Southern Vietnam includes the Southeast and Mekong Delta. The Southeast, home to major urban centers such as Ho Chi Minh City, is Vietnam’s most economically developed region. The Mekong Delta, with flat terrain and low altitude (Phan et al., 2020), is a major agricultural hub, contributing 50% of the country’s rice production and achieving 7.8% GDP growth in 2022 (GSO, 2022).
2.3 Selection of indicators and data collection
2.3.1 Utilization of satellite remote sensing data for drought hazard analysis
In this study, the use of satellite remote sensing data as a primary source for drought analysis is justified due to the limitations of precipitation data from rain gauge stations in Vietnam. The transition to diverse remote sensing datasets offers several advantages for drought assessment. Firstly, satellite remote sensing provides near real-time measurements, allowing for timely and up-to-date information on drought conditions (Ty et al., 2022). This is crucial for effective drought management and response. Secondly, satellite sensors offer global coverage, enabling the assessment of drought hazards in regions that may be inaccessible or lacking in-situ observations. This is particularly important for drought assessment in Vietnam, which has some areas with limited ground-based observations. Lastly, satellite remote sensing provides relatively high spatial resolution, which enhances the observation capacity over land surfaces. This is essential for accurately capturing and monitoring drought conditions at a finer scale, especially in agricultural remote areas.
To ensure a comprehensive assessment of drought hazards in Vietnam’s agricultural sector, this study utilized a combination of hazard indicators, including the Standardized Precipitation Index (SPI), Vegetation Health Index (VHI), and Soil Moisture (SM). A summary of selected hazard indicators and data sources is presented in Table 1. The use of SPI is recommended by the World Meteorological Organization (WMO) for drought monitoring. SPI identifies precipitation shortages over different accumulation periods, providing valuable information on the temporal patterns of drought. SPI was commonly used in drought risk analysis by many scholars including Sharafi et al. (2020) and Villani et al. (2022). However, it is acknowledged that SPI alone may not be sufficient to assess reduced SM and crop stress associated with agricultural drought. To address this limitation, the VHI and SM are included as additional indicators. The VHI, developed by Kogan, combines Vegetation Condition and Temperature Condition Indices to evaluate drought severity based on vegetation health and temperature impact on plants (Kogan, 2019). By considering both vegetation health and temperature conditions, the VHI provides a more comprehensive assessment of drought impacts on agricultural systems, as demonstrated in the studies by Dunne and Kuleshov (2023) and Aitkenhead et al. (2023). Furthermore, SM, indicating relative water content in the topmost layer, serves as an effective indicator of agricultural drought. This indicator is commonly used in DRA (Dunne and Kuleshov, 2023; Han and Singh, 2023). A combination of SPI, VHI, and SM as key indicators is particularly relevant for the agricultural sector in Vietnam, where crop stress and reduced SM are critical factors in drought vulnerability. Le et al. (2021) have demonstrated the usefulness of these indicators to assess the 2019 drought in the Mekong Delta and Central Highlands of Vietnam.
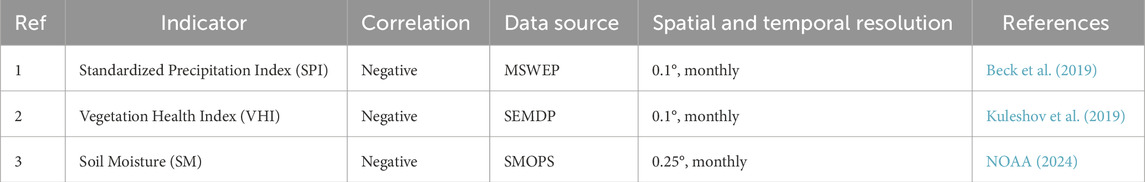
Table 1. Selected hazard indicators in agricultural drought risk assessment.
The time frame from 2015 to 2022 was selected for several key reasons. Primarily, our study focuses on an ad hoc assessment of drought risk using historical data, rather than long-term drought trend analysis. The focus is on understanding how recent drought events, such as the 2015–2016 and 2019–2020 crises (ODV, 2022; UNDP, 2016) interacted with evolving socioeconomic conditions to shape overall drought risk. These events provide valuable opportunities to test and validate the effectiveness of our framework in capturing and analyzing drought impacts. Moreover, the 2015–2022 period was chosen based on the availability of consistent, high-quality data across both hazard and social indicators. While the SPI from the Multi-Source Weighted-Ensemble Precipitation (MSWEP) dataset is available from 1982, other critical indicators have more limited records. For instance, the Vegetation Health Index (VHI), sourced from the WMO’s Space-based Weather and Climate Extremes Monitoring Demonstration Project, is only available from 2013. Soil moisture (SM) data from NOAA’s Soil Moisture Products System (SMOPS)—selected for its reliability in our study area, is available only from 2015 to 2022. As such, this period ensures the consistency and comparability required for robust analysis.
2.3.2 Socioeconomic data for assessment of exposure and vulnerability
Exposure and vulnerability indicators are often used interchangeably, depending on assumptions the researchers make when selecting indicators for their studies. Therefore, it is important to stress the need for a clear justification and explanation of the assumptions behind the selection of indicators. In this study, we selected a set of indicators for the assessment of exposure and vulnerability to drought in Vietnam. The main criteria employed for indicator selection include the relevance to the agricultural sector, availability of quantitative and publicly available data, and specificity to Vietnam’s socio-economic conditions. All exposure and vulnerability indicators are based on socioeconomic data obtained from the Statistical Yearbook of Vietnam for the period from 2015 to 2022.
The percentage of the agricultural population and agricultural land could be included with strong justification to assess exposure. These indicators reflect the extent of agricultural activities in an area, thereby increasing the risk of drought. Agricultural land was selected as a measure of exposure, considering that agricultural activities are particularly susceptible to drought due to water scarcity. A higher percentage of agricultural land area implies an elevated vulnerability to drought. Additionally, agricultural population signifies the number of individuals engaged in the agricultural sector per unit of land area. A heightened agricultural population density indicates a greater population exposure to drought risks. To maintain consistency and comparability throughout the examined period, we use the rural population indicator instead of the agricultural population, as data for the agricultural population is unavailable from 2015 to 2018, while rural population data is available from 2015 to 2022. This is based on the assumption that most people in rural areas are likely engaged in agricultural production for their livelihood. The percentage of the agricultural population and land is expected to positively correlate with the drought exposure index, as higher values indicate greater exposure to drought.
For the assessment of vulnerability, we considered various socioeconomic factors such as Gross Domestic Product (GDP), income, and education level. Based on data availability and relevance to the agricultural sector, we selected five key indicators: agricultural GDP, agricultural income, total income, poverty rate, and literacy rate. Agricultural GDP measures the value of agricultural production in an area. A higher agricultural GDP indicates greater vulnerability to drought due to the area’s economic dependence on agriculture. Agricultural income shows the population’s reliance on agriculture, thus, it positively correlates with vulnerability, while total income indicates their ability to cover living costs, therefore negatively correlates with overall risk. The poverty rate captures the socio-economic vulnerability of the population, with higher poverty rates indicating greater vulnerability to drought due to limited resources and resilience. Lastly, the adult literacy rate was included to measure education levels. Higher education levels indicate better farming skills and access to new technology, reducing vulnerability to drought. Key exposure and vulnerability indicators are presented in Table 2.
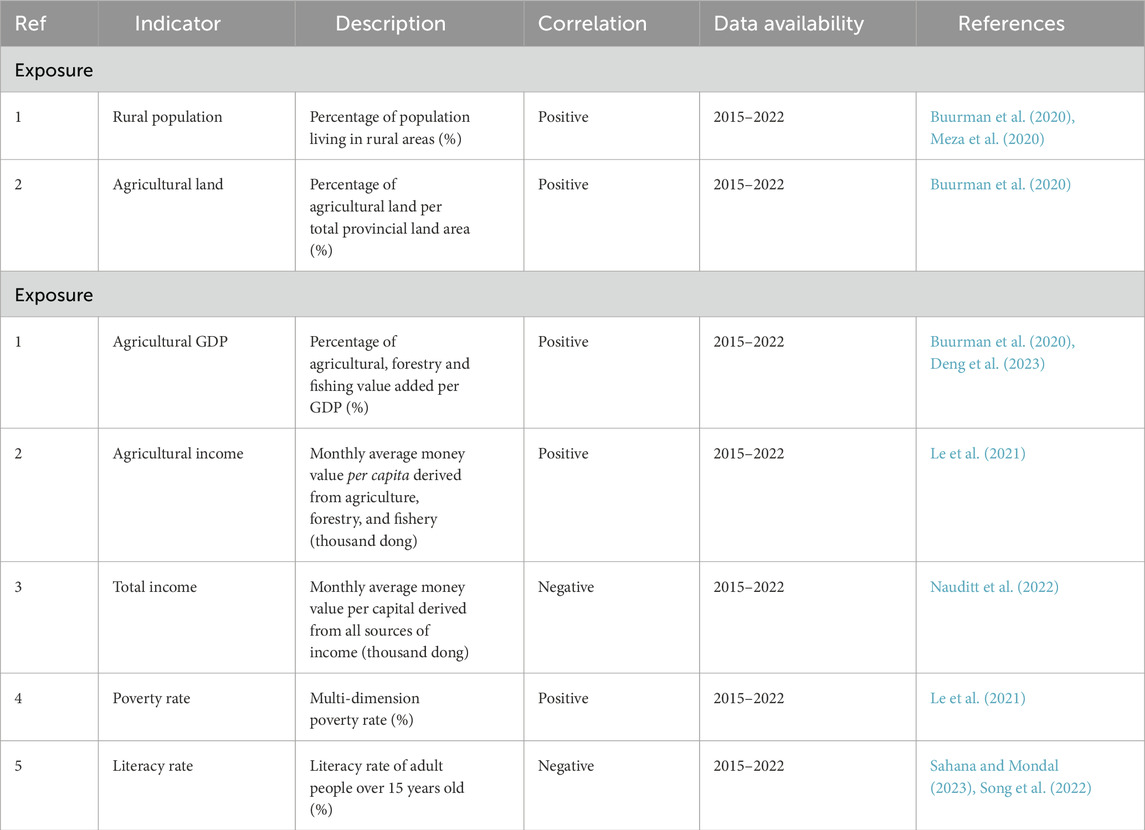
Table 2. Key socioeconomic indicators for assessment of exposure and vulnerability.
Some indicators were not selected for the DRA in Vietnam despite their relevance and common use by other authors, due to their unsuitability in the Vietnamese context and the unavailability of data. For example, elevation and slope were utilized by researchers such as Elusma et al. (2022) and Hoque et al. (2021) as exposure indicators. However, there are conflicting views on their contribution to drought risk. Some argue that high elevation and slope lead to increased run-off flow, thus exacerbating drought exposure (Guo et al., 2021a; Fan et al., 2017; Dayal et al., 2018), while other studies found a positive correlation between highly elevated areas and drought (Le et al., 2019; Feng et al., 2020). Given the varied geographical features in Vietnam, the elevation and slope may offer inconsistent indicators to assess drought risk. Therefore, we exclude this indicator from our assessment. Similarly, rice yield was used by some researchers including Zhao et al. (2020), Luo et al. (2020), and Avia et al. (2023) to measure communities’ response capacity and environmental conditions. However, rice productivity is influenced by too many factors, including biophysical elements such as air temperature, soil condition, storms, and flooding (Abhishek et al., 2021; Minh et al., 2022a; Nguyen et al., 2022), as well as social factors like farming practices, technology and modernization, fertilizer application, and sowing and harvest dates (Guo et al., 2021b; Valverde-Arias et al., 2018). Thus, there is a high uncertainty of rice yield in measuring drought vulnerability across various geographical areas of Vietnam, leading us not to include this indicator in our study. Additionally, irrigation and reservoir networks, are excluded due to the ongoing controversy over their impact on drought vulnerability and the lack of data in most provinces. The presence of irrigation and reservoirs is normally seen as a positive factor in reducing risk as they are designed to supply water to crops during periods of water scarcity and maintain agricultural productivity (Kim et al., 2023; Tingsanchali and Piriyawong, 2018; Sahana et al., 2021; Meza et al., 2021). However, research by Di Baldassarre et al. (2018) shows that reliance on reservoirs might reduce the incentive for adaptive action, which in turn increases drought vulnerability. The selection or omission of indicators for DRA is based on well-founded reasoning tailored to the specific context. As a result, research in a different study area may involve a different set of chosen indicators.
2.4 Assessment of multicollinearity
Multicollinearity refers to the presence of linear relationships among independent variables. It arises when multiple predictors are strongly correlated with the dependent variable and with each other. Ideally, variables should be largely independent, with minimal correlation among them. Conducting multicollinearity analysis ensures there is no overrepresentation of the selected indicators (Villani et al., 2022). In recent years, numerous studies have employed this test to highlight key factors contributing to drought vulnerability conditions (Arabameri et al., 2021; Villani et al., 2022). The Variance Inflation Factor (VIF) and Tolerance (TOL) are key indicators used to assess multicollinearity. VIF helps quantify how much the variance of a regression coefficient increases due to collinearity among the independent variables. It provides insight into the degree of redundancy in the predictors. The VIF is calculated using Equation 1:
Tolerance is the inverse of the Variance Inflation Factor (VIF). A lower tolerance value indicates a higher likelihood of multicollinearity among the variables. A VIF value of one suggests no correlation between independent variables. When VIF values range from 1 to 5, multicollinearity is considered moderate and generally acceptable. Values between 5 and 10 indicate a higher level of correlation, which may need closer examination and justification for retaining the variable (Villani et al., 2022). A VIF of 10 or more typically signals problematic multicollinearity, where regression coefficients may be unstable and the variable is often excluded (Shrestha, 2020).
2.5 Aggregation methods
Highlighting issues for concerns during aggregation is the weighting of indicators with different relative importance before the combination of all using arithmetic algorithms. There are various weighting methods of indicators such as expert knowledge-based weighting, fuzzy membership function, analytic hierarchy process, and principal component analysis (Le et al., 2024; Hochrainer-Stigler et al., 2019). The choice of weighting method simply depends on each research assumption of input variable contribution. There are no standards or rationales for why a particular weighting method is preferred over the others and little effort has been made to validate the reliability of their choice (Dobbie and Dail, 2013). In this study, an effort will be made to justify the use of equal weighting and unequal weighting methods [i.e., principal component analysis (PCA)] for the calculation of each drought risk component. We will justify our choice of using equal weighting for the calculation of the hazard index and exposure index while applying PCA for the vulnerability index.
2.5.1 Equal weighting
Equal weighting is a subjective method that normalizes data and averages all indicators with equal proportional weight (Le et al., 2021). This approach constructs the composite index based on the mean of all equally weighted indicators, assuming that each contributes equally to the overall measurement and does not prioritize any specific indicator. In our study, we applied equal weighting to calculate DHI and DEI. The rationale for using equal weighting in our paper lies in the conceptual significance of the indicators. SPI, VHI, and SM represent equally critical dimensions of drought hazard. SPI captures precipitation levels, which serve as an external driver of drought conditions. VHI reflects vegetation health, highlighting ecological impacts, while SM indicates soil moisture, a factor essential for agriculture and hydrology. Similarly, two indicators including rural population and agricultural land are considered equally important for understanding the level of exposure to drought. In this case, the conceptual parity of indicators justifies the use of equal weights for aggregation.
This approach is supported by established methodologies. The OECD Handbook on Constructing Composite Indicators (2008) (OECD, 2008) recommends equal weighting when all indicators are conceptually significant, and no robust empirical basis exists for assigning differential weights. Additionally, Hedayat and Seyed Kaboli (2024) compared several weighting methods, such as Fuzzy Logic and the Analytic Network Process (ANP), and suggested that assigning equal weight to all factors can be a valid alternative to more complex techniques. They noted that equal weighting offers a useful approach to address the inconsistency in judgments of indicator importance.
Before aggregating the indicators with equal weighting, it is crucial to ensure that all data are on the same scale. Nardo et al. (2005) emphasize the importance of normalization to address inconsistencies in magnitude when constructing composite indices. This involves transforming the data into a common unit of measurement. In our study, we will apply min-max scaling, as described in Equations 2 and 3, for normalization. These techniques will standardize the data to a comparable range, allowing for meaningful aggregation. The minimum and maximum values are established based on the value range (whether from a single year or multiple years) that we intend to compare.
2.5.2 Unequal weighting: principal component analysis
As a method for applying unequal weighting, PCA enables the combination of various datasets with differing levels of importance into a single composite index, assuming that each input variable contributes differently (Bhardwaj et al., 2023). By using PCA, we can create a composite index where the weights of the variables are based on their variance and loadings in the principal components. This approach ensures that the variables with the most variance and significant loadings have the highest weights in the index (Kim et al., 2021a). Given that PCA relies on a computational method, it is seen as more objective than the equal-weighting method (Wei et al., 2022). In our study, we used PCA to explore the correlations between variables and determine their respective weights within the vulnerability components. PCA is a robust method for evaluating the contribution of each indicator and reducing dimensionality in the presence of potential redundancy between variables. The vulnerability component consists of five indicators (Table 2), each contributing differently to the composite index. Given the uncertainty regarding the appropriate weight for each variable, PCA provides an effective solution for objectively determining their relative importance.
For the PCA-weighted method, several steps were taken. First, the dataset was checked to correct issues with missing values and outliers using statistical techniques. Second, the data was standardized to bring all indicators to the same data scale using Equations 2 and 3. A correlation matrix was then computed to assess the interrelationships among the variables in the dataset. This step helped to identify any multicollinearity issues that could affect the PCA results (Jaadi et al., 2024). After that, the eigenvalues and eigenvectors were calculated to determine the principal components, with the number of principal components being equal to the number of variables (Haobo et al., 2023). The eigenvalues represent the amount of variance explained by each component, while the eigenvectors represent the loadings of each variable on the components. Each variable will have its own loadings and variance explanation. Based on these two important factors, we can calculate the weighting of each variable when combining datasets of all variables into a multivariate drought exposure and vulnerability index. The Equations (4–6) were applied following similar methods conducted by Kim et al. (2021a), David and Harvey (2022) and Bulut and Thompson (2023).
Whereas: n is the number of provinces; m is the number of selected principal components; x is the normalized values of variables; c is the loading of each variable at a particular principal component, v is the explained variance of a particular principal component.
2.5.3 Drought risk analysis
As noted by Bravo et al. (2021) and Le et al. (2024), integrating hazard, exposure, and vulnerability components into a composite Drought Risk Index (DRI) is commonly achieved through either multiplicative or additive models. The multiplicative approach is often favored for its theoretical consistency, particularly the premise that risk should approach zero if any component is null (Avia et al., 2023; Khoshnazar et al., 2023; Wang and Sun, 2023; Zhou et al., 2023). However, a significant number of studies also adopt additive models, especially when the goal is to generate comparative indices for spatial prioritization (Dumitraşcu et al., 2018; Park et al., 2021; Pham et al., 2022).
In our study, we adopted an additive approach with the objective of identifying and comparing high-risk areas across Vietnam, rather than predicting absolute risk values. This method allows us to avoid “zero” values and highlight relative differences in drought risk intensity across regions. The additive index is normalized, ensuring comparability across components, and is consistent with several recent studies using a similar rationale. Additionally, while the multiplicative model assumes full interdependence of components, the additive model is more suitable when the indicators may contribute independently to overall risk. Following this rationale, the composite drought risk index (DRI) will be constructed using the summation function of the drought hazard index (DHI), drought exposure index (DEI), and drought vulnerability index (DVI), following Equation (7).
In our study, drought risk analysis with handling a large amount of data needs the aid of programming languages such as Python and R. The development of Python scripts integrated with the ArcGIS tool has played a pivotal role in streamlining and enhancing the analytical processes. Incorporating loops in Python facilitates scalability and automation in data processing of repeatable tasks including the “Extract by Mask,” Zonal statistics, classification, and symbology. Furthermore, R statistics scripts introduce advanced analytical techniques for DRA. R scripts are utilized to calculate mean monthly values for key indicators, function min-max normalization, and conduct weighting and aggregation. The development and deployment of these Python and R scripts have proven useful in enhancing the efficiency, accuracy, and comprehensiveness of the DRA process.
3 Results
3.1 Multicollinearity analysis
The VIF and TOL are calculated for two exposures and five vulnerability indicators. For exposure indicators, since there are only two variables, the VIF values remain at 1 across all years. Therefore, there is no issue with multicollinearity when processing the exposure component. On the other hand, the VIF and TOL values for the selected vulnerability indicator across all assessed years range from 2.21 to 7.51 and 0.13 to 0.45, respectively (Table 3). VIF values exceeding 5 were observed for the poverty rate, which is understandable given its conceptual relationship with variables such as income and literacy rate. However, we opted to retain this indicator due to its critical relevance in representing socioeconomic vulnerability within the study context.
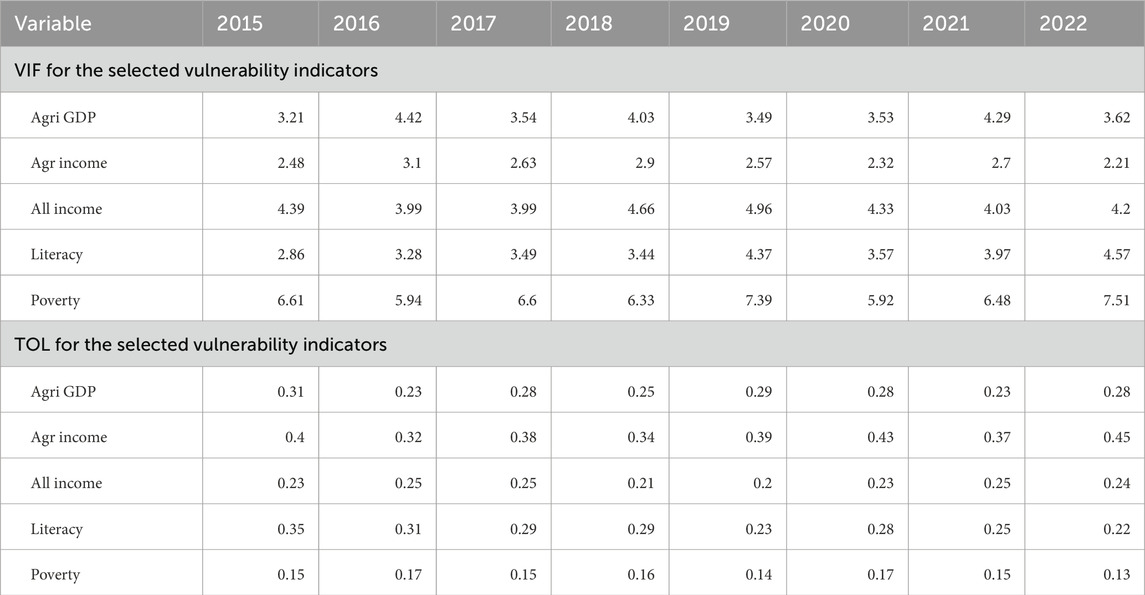
Table 3. VIF and TOL for the selected vulnerability indicators.
3.2 Drought hazard assessment
The monthly Drought Hazard Index (DHI) was calculated for 8 years from 2015 to 2022 to observe changes in drought conditions across the country. SPI, VHI, and SM data were normalized to a range of 0–1 using the minimum and maximum values of the entire 8-year dataset. The normalized SPI, VHI, and SM were then combined with equal weighting. The classification of the computed DHI data was performed using manual intervals in ArcGIS Pro. Each month’s data was classified into seven breaks based on the highest DHI value of 0.84 (April 2016) and the lowest value of 0.23 (February 2018). This process resulted in a series of monthly DHI maps for Vietnam from 2015 to 2022, totaling 96 maps, which are presented in Appendix 1. A series of drought hazard index maps in Vietnam from 2015 to 2022. Temporal analysis of the DHI indicates that the most intense droughts occurred nationwide in 2015 and 2016, with less severe droughts recurring in 2019–2020. The map of DHI for April 2016, which represents the most intense drought month, along with its corresponding SPI, VHI, and SM, is illustrated in Figure 3.
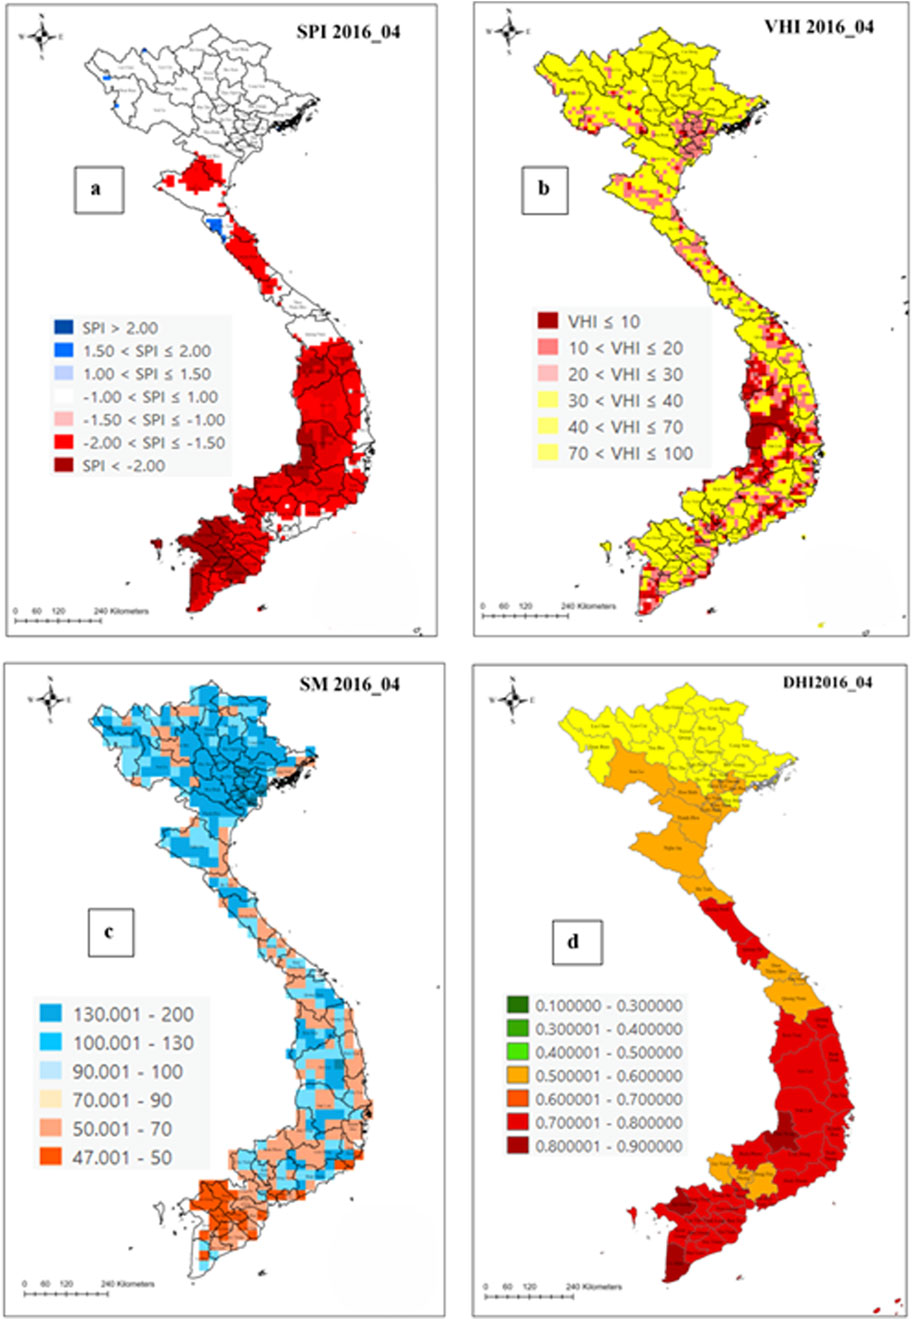
Figure 3. The DHI in April 2016 (d)- a combination of SPI (a), VHI (b), and SM (c).
During the drought year of 2015, the entire country faced extremely dry conditions, with the Central and Southern regions experiencing more severe droughts compared to the North. Seasonal variations were also evident, with the drought being most intense from March to July. The intense drought began in March, peaked in May, and then became less severe by August. A similar trend was observed in 2016, with the Southern part of Vietnam experiencing particularly severe drought conditions from March to June, peaking in April. In 2017, dry conditions arrived later and were less intense compared to the previous years, but the Central and Southern regions remained consistently drier than the North. Notably, the Southern region experienced drought from August to November, rather than the usual period from November to April, which could be due to the time lag in the VHI and SM following reduced rainfall.
In 2018, the drought was not intense and did not follow the usual seasonal pattern. Drought conditions were highlighted in the Central and Southern regions in October and November, which are typically the wet season. The Central provinces and Mekong Delta were most affected this year. In 2019, cumulative dry conditions lasted from April to December, with June being the most intense month. Although not severe, the drought extended over a longer period and was more widespread across the country, particularly affecting the Central and Mekong Delta regions. Continuing from the long-term dry conditions of 2019, 2020 was also a drought year, though less intense than in 2015 and 2016. The drought occurring from April to August followed the typical seasonal pattern, with the drought period beginning in April, peaking in May for the South, and in July for the North. The Central and Southern regions remained more impacted by drought hazards this year. In 2021, the country did not experience an intense drought year, with the most impacted months being from July to September, peaking in August. Similarly, 2022 was marked by greener colors, indicating a wet year with minimal drought impact.
The analysis of drought hazard indices for these years reveals a consistent pattern, with the severity of drought being notably more pronounced in the southern regions, especially the Highlands and lower Mekong areas. This recurrent trend underscores the heightened vulnerability and challenges faced by these regions. However, 2019 showed a variation where the northwest region experienced relatively more severe drought conditions compared to other regions, highlighting the dynamic nature of drought patterns. This regional disparity emphasizes the importance of temporal and spatial analysis in understanding drought hazards. These insights are crucial for regional planning and proactive drought management strategies. Recognizing the consistent vulnerability of the southern regions while acknowledging temporal variations, particularly in the northwest during 2019, underscores the need for tailored approaches and targeted interventions. This understanding enhances the effectiveness of mitigation and adaptation measures, ensuring a more resilient response to drought challenges across diverse geographical areas.
3.3 Drought exposure assessment
Drought exposure in Vietnam was assessed over 8 years from 2015 to 2020, using two indicators: the percentage of agricultural land and the percentage of rural population in each province. These indicators were normalized using a min-max function and combined with equal weighting, assuming that each indicator contributes equally to the final Drought Exposure Index (DEI). To oversee the change in DEI across the years, the min and max values were determined based on the range of values from the entire 8-year dataset. DEI values were then classified with manual intervals and mapped using ArcGIS Pro, resulting in the production of eight DEI maps, one for each year. The DEI maps for 2015 and 2022 are presented in Figure 4 to illustrate the temporal variation of DEI over the examined period. A further series of DEI maps from 2015 to 2022 can be seen in Appendix 2. A series of drought exposure index maps in Vietnam from 2015 to 2022.
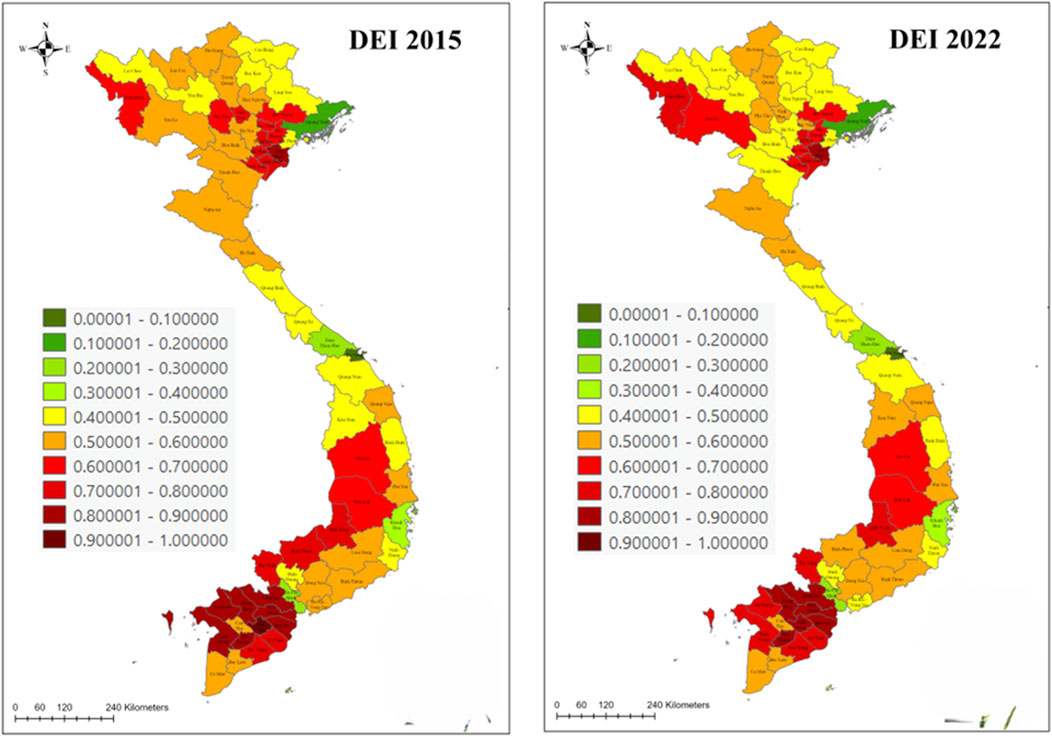
Figure 4. Drought exposure index maps for 2015 and 2022.
The temporal analysis indicates minimal changes in DEI across provinces over the years, with the maps showing little reduction in the extent of drought exposure across the provinces of Vietnam. The DEI maps also compare the level of exposure of provinces in Vietnam, spatially. Through spatial analysis, we identify that the Mekong Delta, particularly provinces like Vinh Long, Hau Giang, Ben Tre, An Giang, Kien Giang, Tien Giang, and Dong Thap, exhibits the highest DEI values. This is largely due to the region’s extensive agricultural activities. Following the Mekong Delta, the Central Highlands (including provinces such as Daklak, Gia Lai, and Kontum) and some Northeast provinces (such as Thai Binh, Hung Yen, Ha Nam, and Nam Dinh) also show relatively high DEI values. In contrast, provinces such as Ho Chi Minh, Da Nang, Khanh Hoa, and Thua Thien Hue, which focus on the industrial and tourism sectors, are less exposed to drought. The remaining areas exhibit moderate to average levels of exposure to drought.
3.4 Drought vulnerability assessment
This assessment aims to analyze drought vulnerability across Vietnam over 8 years from 2015 to 2022. Year-by-year comparisons of drought vulnerability levels from 2015 to 2022 are conducted to identify regions that exhibit higher vulnerability relative to others. The components of drought vulnerability are represented by five indicators: agricultural income, total income, agricultural GDP, poverty rate, and literacy rate. Adopting the same method as for exposure, min-max normalization is applied using the minimum and maximum values of each indicator obtained from the entire dataset spanning the 8 years from 2015 to 2022. Applying PCA analysis, the weight of each indicator is determined based on the loadings and the proportion of variance for each principal component (PC). The loadings of PCs in year 2022 (for demonstration), and the weights for each vulnerability indicator from 2015 to 2022 are presented in Table 4 and Table 5. The analysis indicates that poverty rate (Po), total income (Ti), and literacy Li) have greater weight compared to the other two indicators–agricultural income (Ai) and agricultural GDP (AG), highlighting their higher contribution to the overall drought vulnerability index. These factors are important in shaping vulnerability, with changes in poverty rates, income levels, and literacy rates having a greater impact on the overall drought vulnerability of different regions.
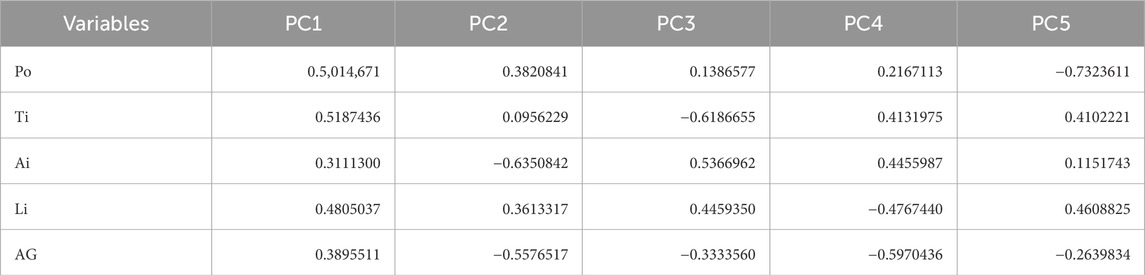
Table 4. Loadings of PCs in 2022.
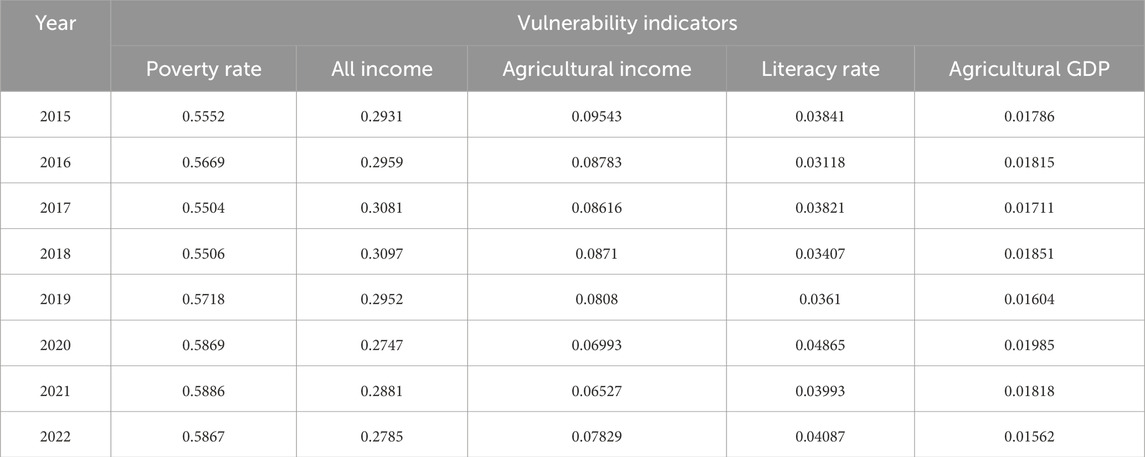
Table 5. PCA–determined weight of vulnerability indicators.
After the calculation of the DVI value using PCA weight, the classification of drought vulnerability was conducted using manual interval breaks in ArcGIS Pro, and a series of DVI maps are generated and presented in Figure 5. From the analysis, it is observed that drought vulnerability exhibits a decreasing trend over the years, with 2015 identified as the most vulnerable year. This trend can be attributed to a significant reduction in poverty rates and an increase in total income and literacy rates over time. Such improvements are likely supported by government policies aimed at economic development and enhancing the living standards of the population, particularly after 2018. Spatially, regions such as the Red River Delta and the Southeast emerge as the least vulnerable to drought, indicating their resilience. Conversely, the Northwest region experiences the highest levels of vulnerability, although this has diminished from 2015 to 2022. The Central Highlands demonstrate high vulnerability, whereas the Mekong Delta and Central region are characterized by moderate vulnerability levels. These spatial patterns highlight the varying impacts of drought across different regions and underscore the importance of targeted adaptation to drought vulnerability in the most affected areas.
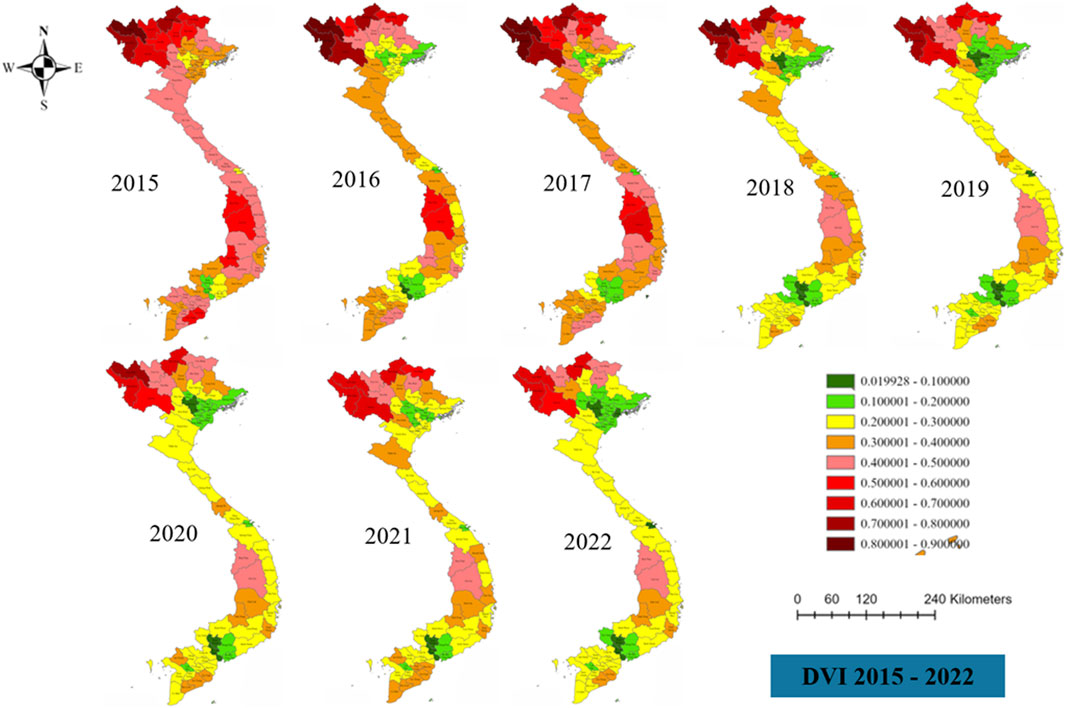
Figure 5. Drought vulnerability index of Vietnam from 2015 to 2022.
3.5 Drought risk assessment
The drought risk index (DRI) was calculated using three components: the Drought Hazard Index (DHI), the Drought Exposure Index (DEI), and the Drought Vulnerability Index (DVI), with equal weighting. The final results were classified into pre-determined intervals with 05 levels from very low (dark green) to very high (dark red) to facilitate year-to-year comparisons. The series of DRI maps, presented in Figure 6, illustrate the dynamics of drought risk both spatially and temporally. As analyzed in the previous section, the hazard component exhibited the most variation on a monthly scale, while the vulnerability component showed moderate changes, and the exposure component remained relatively static. When combined, these factors reveal changes in risk levels, although these changes are not significant. Notably, 2015 and 2016 emerged as the years with the highest levels of risk across the examined provinces, followed by 2019 and 2020. The other years showed lower levels of risk. Spatially, the Mekong Delta, Central Highlands, and Northwest regions consistently experienced high drought risk. These areas are particularly drought-prone due to their agricultural activities and heightened social and economic vulnerabilities. Consequently, these regions should be prioritized for adaptation strategies to drought risk.
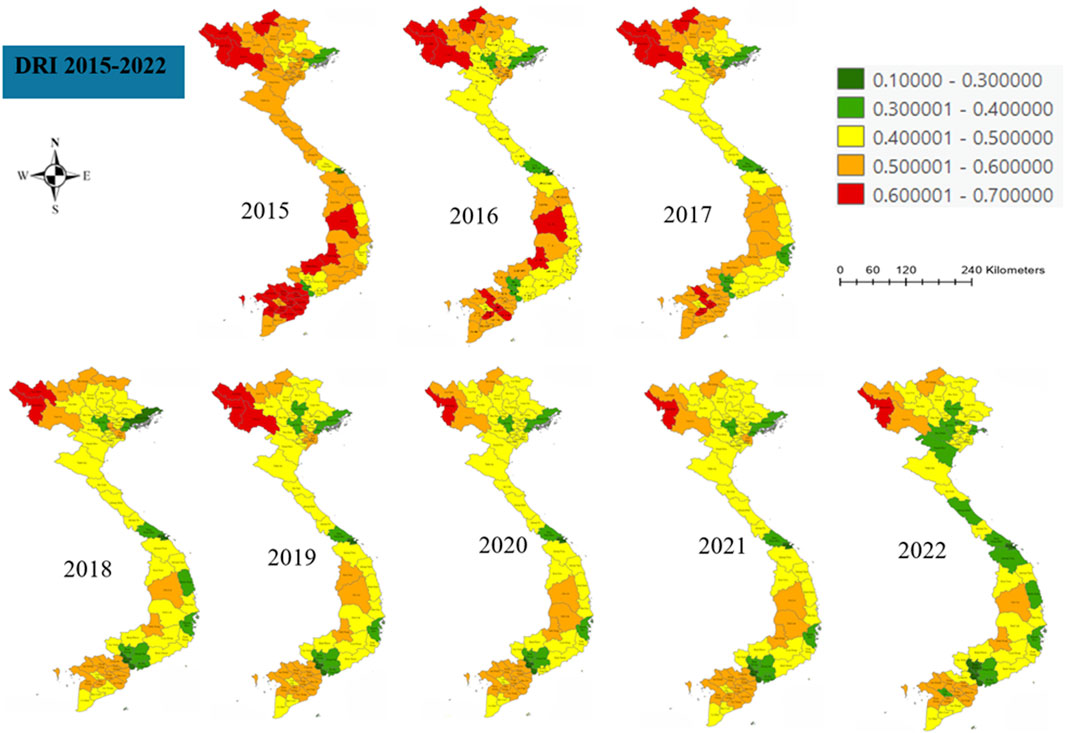
Figure 6. Drought risk index in Vietnam from 2015 to 2022.
3.6 Accuracy assessment for drought risk index
It is essential to assess the reliability and practical value of the drought risk index and mapping product. In this case, we presented key observations from historical events to help validate our results. First, the performance of the drought hazard index was compared against declared drought years 2015/2016 and 2019/2020 (MARD, 2020). Through the examination, the months with low SPI, VHI, and SM are identified from April to July, indicating dry conditions in these months. This is in line with the seasonal patterns of drought hazard in most of the country at the time. Additionally, the UNDP (2016) reported significant crop damage and losses during the 2015/2016 drought crisis, identifying the regions with severe impact including the Mekong Delta, South-Central Vietnam, and Central Highlands. Specifically, rice and fruit tree losses were reported in the Mekong Delta, while damage to perennial crops was documented in the Central Highlands. These regions that experienced the most severe impacts correspond closely with the areas identified in our study as having high drought risk levels. This agreement between our results and documented impacts validates the reliability of our drought hazard index.
To evaluate the reliability of our DRI, we focused on provinces in the Mekong Delta that were significantly affected by the major drought events of 2015/2016 and 2019/2020. According to reports from the Ministry of Agriculture and Rural Development (MARD), 10 provinces in the region experienced substantial agricultural losses during both drought periods. The DRI values and the corresponding agricultural damage loss, expressed in monetary terms, are summarized in Table 6. To validate our findings, we performed a correlation analysis between the DRI and the reported agricultural loss values for the years 2015 and 2020. The results indicate a moderate positive correlation, with Pearson correlation coefficients of 0.41 for 2015 and 0.52 for 2020 (Figure 7). While these values are not statistically strong, they nonetheless suggest a reasonable level of alignment between the DRI and actual economic losses, thereby lending support to the DRI validity. It is important to note that this validation is constrained by the availability and quality of historical agricultural loss data. As more comprehensive and consistent data become accessible, future analyses can further enhance the robustness and accuracy of the DRI validation process.
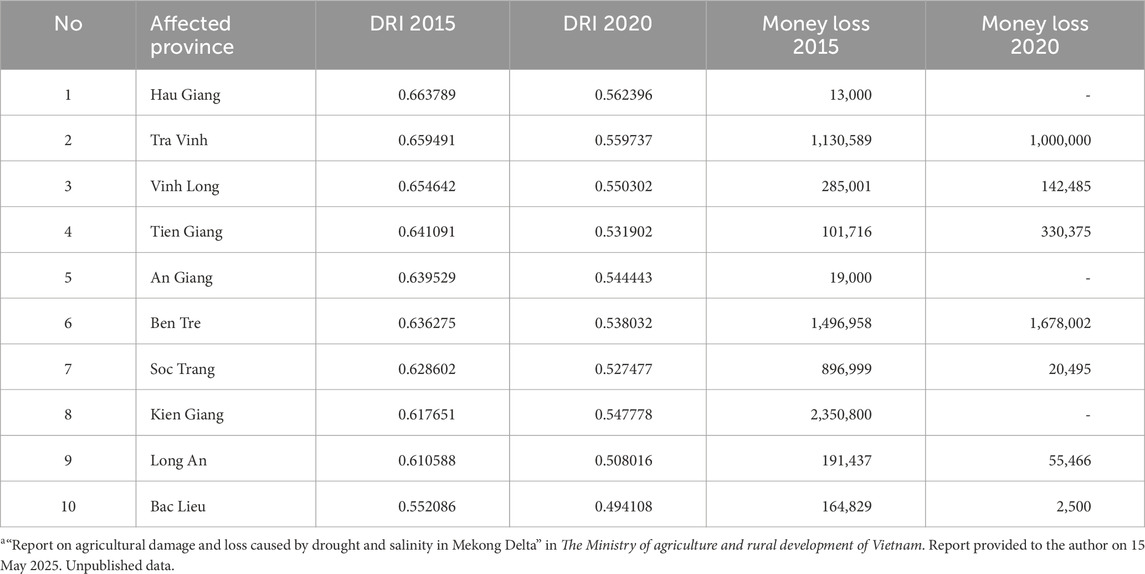
Table 6. Economic loss, estimated in VND, in the Mekong Delta’s provinces during the drought crisis of 2015–2016 and 2019-2020 (MARD, 2024)a.
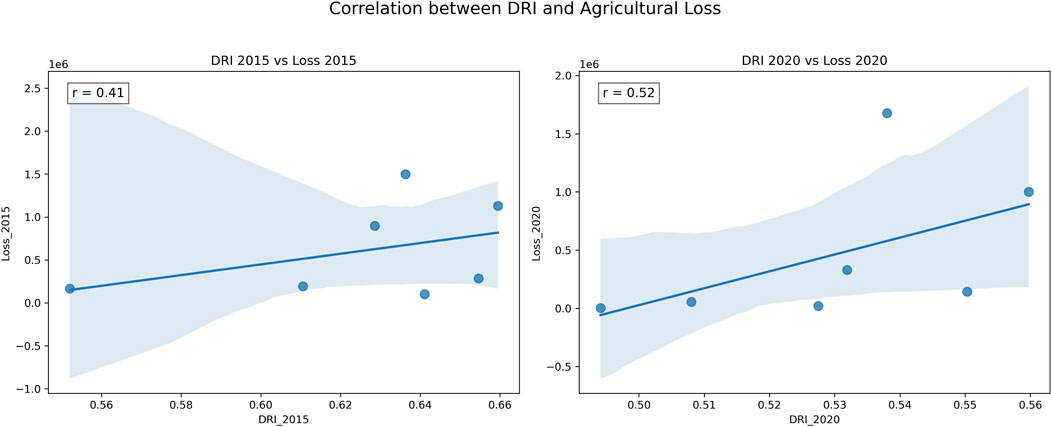
Figure 7. Pearson correlation coefficients between the DRI and the reported agricultural loss values.
Furthermore, an analysis of rice yield data from 2013 to 2022 reveals a noticeable decline during the drought crisis years of 2015/2016 and 2019/2020 in four high-ranking DRI provinces in the Mekong Delta: Ben Tre, Ca Mau, Tra Vinh, and Vinh Long, as shown in Figure 8. These provinces, which our study identified as having high drought risk, experienced significant rice yield reductions. While rice yield can be influenced by various factors beyond climate conditions (Minh et al., 2022b; Abhishek et al., 2021; Li et al., 2015; Guo et al., 2021a; Nguyen et al., 2022), the observed decline in these provinces aligns well with the high drought risk indicated by our study, further validating our results.
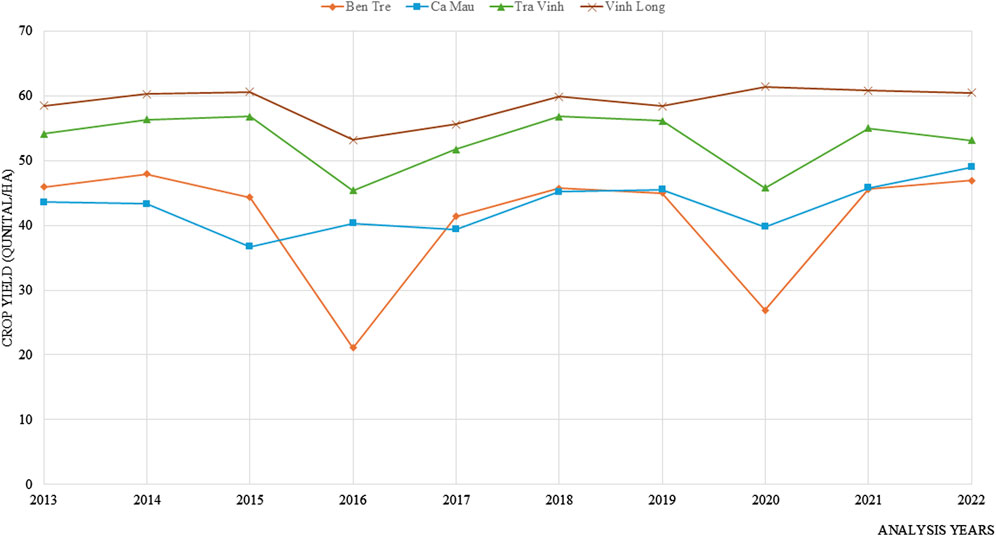
Figure 8. Rice yield drops during drought years 2015/2016 and 2019/2020 in the most severely affected provinces of the Mekong Delta.
4 Discussions
4.1 Justification of indicator selection and aggregation methods for DRA in Vietnam
Currently, there is no universally accepted framework for DRA, leading to considerable variability in methodologies and results across different studies and regions (Wu et al., 2025). Many previous DRA efforts in Vietnam such as Thao et al. (2019) and Buurman et al. (2020) have relied on single drought indices, which, while useful, offer a limited perspective on the complexity of drought phenomena. In contrast, this study quantifies drought hazard using a combination of three drought indices, each selected to capture different aspects of agricultural drought severity and tailored to the Vietnamese context. Our research findings emphasize the appropriateness of utilizing the SPI, VHI, and SM for quantifying drought hazard indices specifically tailored to the agricultural sectors in Vietnam. The SPI, by assessing precipitation variations over different time scales, provides valuable insights into meteorological conditions. The VHI, incorporating both vegetation health and temperature indices, offers a holistic perspective on the impact of drought on crops, considering the relation between plant health and temperature stress. Furthermore, the inclusion of SM as an indicator is particularly relevant for the agricultural sector, as it directly reflects the water content in the soil for plant growth. The choice of SPI, VHI, and SM as indicators for drought hazard quantification in Vietnam’s agricultural sectors is highly relevant to the unique conditions faced by the agricultural landscape and justified by our research findings.
The selection of indicators for exposure and vulnerability assessment is highly dependent on the local context, making it distinct from studies conducted in other regions. For instance, Yang et al. (2023) selected indicators such as grain crop area, crop output, and agricultural insurance to assess exposure and vulnerability in Shandong province of China, which are not directly applicable to Vietnam. In this study, indicator selection was guided by criteria including relevance to the agricultural sector, data availability, and alignment with Vietnam’s socio-economic conditions. After careful consideration, two exposure indicators including the percentage of agricultural land and rural population, were selected, along with five vulnerability indicators - agricultural GDP, agricultural income, total income, poverty rate, and literacy rate. These indicators reflect the economic dependence on agriculture, socio-economic vulnerability, and education levels, all of which influence the population’s resilience to drought. The DEI and DVI findings, incorporating these indicators, effectively capture the spatial distribution of exposure and vulnerability across regions of Vietnam.
One key contribution of this study lies in its integration of dynamic temporal analysis, which is often underrepresented in existing literature (Khoshnazar et al., 2023; Islam et al., 2024). By tracking the evolution of drought risk over time, we observe that hazard indicators tend to fluctuate more dynamically compared to exposure and vulnerability components. This insight is crucial for adaptation planning, as it highlights the need to prioritize flexible and responsive hazard adaptation strategies in high-risk regions. This strength in our research is facilitated by the application of GIS and remote sensing in conducting drought risk assessment. The use of these techniques enables the collation of complex climate, socio-economic, and ecological information into a single image, resulting in maps that depict areas of high drought risk (Belal et al., 2014; Kumari and Kumar, 2023). The visualization of risk through maps is proven to be useful in communicating drought risk to stakeholders across different scales and sectors, facilitating decision-making processes related to drought disaster risk management.
4.2 DRA-informed adaptation strategies
DRA plays a critical role in supporting decision-makers by providing a comprehensive understanding of the areas with high drought risk and the factors contributing to this risk. The creation of drought risk maps for Vietnam serves as a crucial tool for policymakers in strategic decision-making processes related to drought resilience and management. These maps provide a visual representation of high-risk areas, enabling policymakers to prioritize resources and interventions in areas that are most vulnerable to drought. The findings emphasize the importance of focusing on regions such as the Mekong Delta, Central Highlands, and Northwest, which consistently face high drought risks due to their exposure to hazards, agricultural practices, and socioeconomic vulnerabilities. By identifying the high-risk areas, decision-makers can allocate resources more effectively and prioritize interventions to adapt to the impact of drought. For example, improvements in irrigation infrastructure (Babel et al., 2024; Delfiyan et al., 2021) can be implemented in regions such as the Mekong Delta, where agricultural activities are prevalent and severe hazardous conditions frequently occur. Alternatively, other adaptation strategies, such as modifying farming practices, changing crop types, and providing post-drought financial relief (Aliyar et al., 2022; Villani et al., 2022), can be directed toward high-vulnerability areas such as the Central Highlands and Northwest. Based on the DRA results for administrative regional divisions (Figure 2), we propose tailored adaptation strategies that align with the specific characteristics of exposure and vulnerability unique to each region in Table 7 as demonstration. It is noted that a more detailed, smaller-scale analysis would be necessary to further refine the adaptation strategies. Given that the scope of this research focuses on providing DRA, the proposed adaptation strategies are relatively general.
Additionally, the dynamic analysis of hazard, exposure, and vulnerability factors provides valuable insights into the evolving nature of drought risk, enabling a more comprehensive understanding of the issue, rather than solely focusing on the final results. Hazard is a dynamic component that can change frequently over short timeframes, such as monthly or quarterly. This is caused by the frequent changes in climate factors such as rainfall, vegetation health, and soil moisture within the examined time range. In contrast to hazard, the exposure component, represented by the percentage of agricultural land and population, shows minimal variation over the period of 8 years. This suggests that the areas exposed to drought remain relatively constant, indicating a static nature of exposure. The vulnerability index, on the other hand, demonstrates slight variations year by year, with an overall decreasing trend. This implies that the factors contributing to vulnerability, including level of income and education are subject to gradual changes over time. This finding highlights the need for long-term strategies in drought risk management, as exposure remains a consistent factor that needs to be addressed irrespective of temporal variations in hazard and vulnerability. The decreasing trend of vulnerability is a positive outcome, suggesting some effective measures for improving socioeconomic conditions and living standards. However, it is essential to continue monitoring vulnerability to ensure that it remains at a manageable level and to identify any emerging trends or factors that may increase vulnerability in the future. Regular monitoring is crucial to understanding these patterns and enabling prompt responses to changes, ensuring that risk management strategies remain effective and responsive to emerging threats.
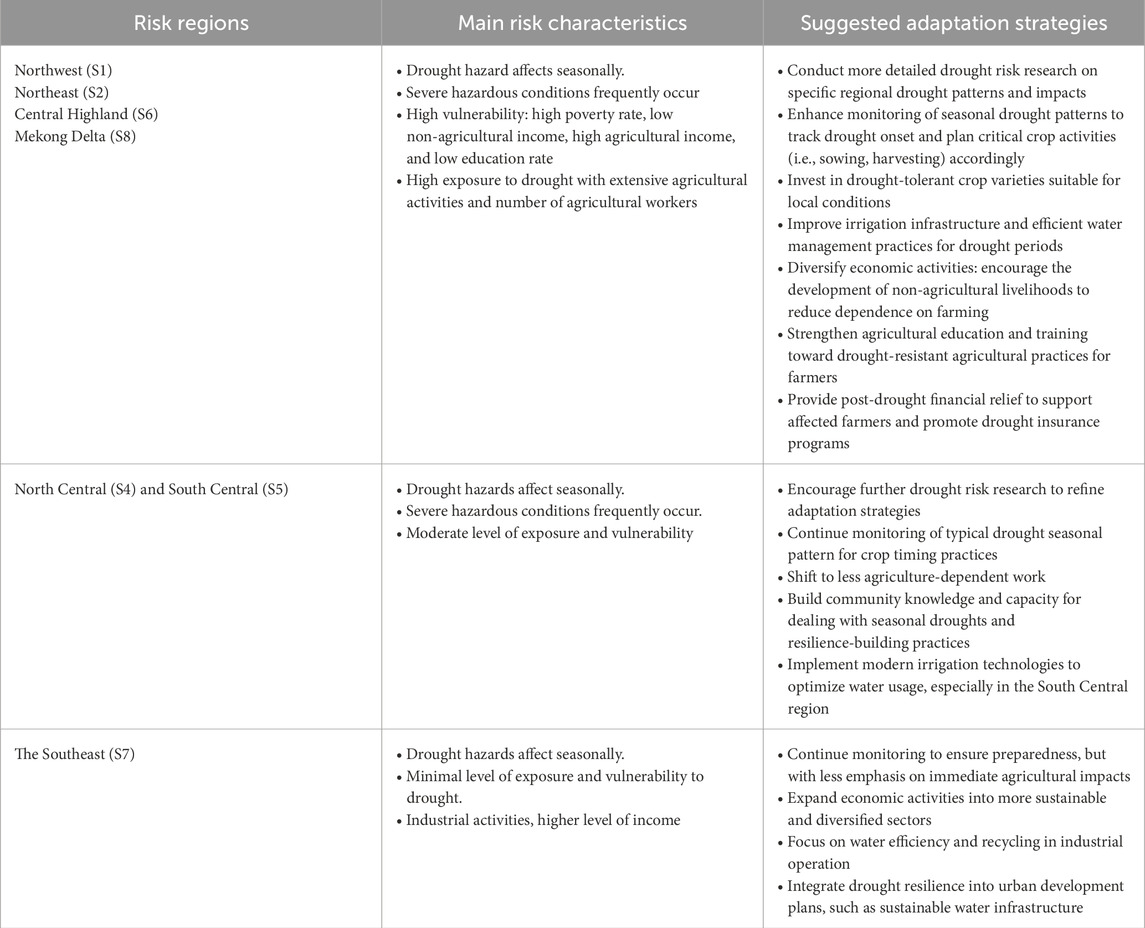
Table 7. Suggested specific adaptation strategies for seven administration regions.
4.3 Study limitations
Some limitations can be identified in this study. First, the selection of indicators in this study was constrained by the availability of data. For instance, we recognize the importance of “irrigation coverage” as a key indicator of water resource utilization in agricultural drought risk assessments. Irrigation coverage, which reflects the extent of irrigated areas, can be viewed as an indicator of exposure, as discussed by Meza et al. (2021), or as a factor that mitigates vulnerability by providing water during droughts (Elusma et al., 2022). Ideally, we would have included this indicator in our assessment; however, reliable and high-resolution data on irrigation coverage are not available in Vietnam, either in terms of spatial resolution or temporal coverage. Consequently, its inclusion was not feasible for this study. Future research could explore the incorporation of such indicators, depending on data availability at the time, to enhance the accuracy and effectiveness of the DRA framework.
Furthermore, the validation of agricultural drought vulnerability remains a methodological challenge due to the absence of direct and universally accepted mechanisms. Also, due to the slow onset and widespread impacts of droughts, collecting comprehensive validation data, such as economic losses or damages during drought crises, is complicated. This limitation is widely acknowledged in DRA research, as noted by Blauhut (2020). Several studies, including those by Kim et al. (2021b), Nauditt et al. (2022), and Elusma et al. (2022) did not provide validation for their methodologies or results. While some studies employ comparative analyses of drought events across years or examine empirical correlations with agricultural losses, validation remains partial (Aitkenhead et al., 2023; Wang and Sun, 2023; Oh et al., 2023). In our study, we address this gap by validating our risk assessment through historical drought events and crop yield data. Although constrained by the availability of historical records, the positive correlation between risk estimates and yield losses provides empirical support for the robustness of our approach. Our research, therefore, highlights the importance of recording and maintaining relevant monitoring data, such as economic losses and yield impacts, to enable the application of robust statistical methods for validating and refining the assessment framework.
Another limitation is the spatial scale of the assessment. In this study, data were available only at the provincial level, which may have introduced some spatial accuracy limitations. To improve the precision of drought risk identification and enable better resource allocation for adaptation efforts, future work should consider incorporating data at finer resolutions, such as district level or even pixel level. This would provide more detailed insights into the areas most at risk and allow for more targeted and effective drought management strategies.
5 Conclusion
This study applied a comprehensive risk assessment framework encompassing hazard, exposure, and vulnerability to evaluate agricultural drought risk in Vietnam from 2015 to 2022. It aimed to identify high-risk areas and support the development of drought adaptation strategies through integrated spatial and temporal analyses. By employing tailored indicators and a systematic quantification method, the study successfully achieved its objectives and offers valuable insights for future DRA. First, our study emphasizes the advantage of using a combination of drought indices such as SPI, VHI and SM over relying on a single index for more robust hazard evaluation. In addition, the study recommends a context-specific set of indicators for exposure and vulnerability, carefully selected based on Vietnam’s unique socio-economic and agricultural characteristics. Second, the dynamic assessment of drought risk reveals that hazard is the most variable component, vulnerability shows a slight downward trend, and exposure remains relatively stable. These temporal dynamics provide insights into the underlying causes of risk and can inform policy priorities and the effectiveness of response measures. Furthermore, high-risk regions, including the Mekong Delta, South-Central Vietnam, and the Central Highlands, were identified through spatial analysis using GIS. The assessment was validated using historical agricultural loss data, showing strong alignment with severe drought impacts recorded during the 2015–2016 and 2019–2020 periods. While the study offers general adaptation strategies, it also underscores the importance of advancing spatially explicit assessments in critical areas to enable the development of more localized and actionable adaptation measures.
Data availability statement
The original contributions presented in the study are included in the article/Supplementary Material, further inquiries can be directed to the corresponding author.
Author contributions
TL: Conceptualization, Data curation, Formal Analysis, Investigation, Methodology, Project administration, Resources, Software, Validation, Visualization, Writing – original draft, Writing – review and editing. CS: Conceptualization, Investigation, Methodology, Project administration, Supervision, Validation, Writing – review and editing. TT: Conceptualization, Investigation, Methodology, Supervision, Validation, Writing – review and editing. SC: Conceptualization, Methodology, Supervision, Validation, Writing – review and editing. YK: Investigation, Methodology, Supervision, Validation, Writing – review and editing.
Funding
The author(s) declare that no financial support was received for the research and/or publication of this article.
Acknowledgments
The authors gratefully acknowledge the support and resources provided by the Geospatial Department of RMIT University, Melbourne, Victoria, Australia.
Conflict of interest
The authors declare that the research was conducted in the absence of any commercial or financial relationships that could be construed as a potential conflict of interest.
Generative AI statement
The author(s) declare that Generative AI was used in the creation of this manuscript. Generative AI was utilized in this manuscript solely to enhance readability and ensure clarity of expression.
Publisher’s note
All claims expressed in this article are solely those of the authors and do not necessarily represent those of their affiliated organizations, or those of the publisher, the editors and the reviewers. Any product that may be evaluated in this article, or claim that may be made by its manufacturer, is not guaranteed or endorsed by the publisher.
Supplementary material
The Supplementary Material for this article can be found online at: https://www.frontiersin.org/articles/10.3389/feart.2025.1564900/full#supplementary-material
References
Abhishek, A., Das, N. N., Ines, A. V. M., Andreadis, K. M., Jayasinghe, S., Granger, S., et al. (2021). Evaluating the impacts of drought on rice productivity over Cambodia in the Lower Mekong Basin. J. Hydrol. 599, 126291. doi:10.1016/j.jhydrol.2021.126291
Ai, P., Chen, B., Yuan, D., Hong, M., and Liu, H. (2021). Dynamic risk assessment of drought disaster: a case study of Jiangxi Province, China. J. Water Clim. Change 12, 1761–1777. doi:10.2166/wcc.2020.141
Aitkenhead, I., Kuleshov, Y., Bhardwaj, J., Chua, Z. W., Sun, C., and Choy, S. (2023). Validating a tailored drought risk assessment methodology: drought risk assessment in local Papua New Guinea regions. Nat. Hazards Earth Syst. Sci. 23, 553–586. doi:10.5194/nhess-23-553-2023
Aliyar, Q., Zulfiqar, F., Datta, A., Kuwornu, J. K. M., and Shrestha, S. (2022). Drought perception and field-level adaptation strategies of farming households in drought-prone areas of Afghanistan. Int. J. Disaster Risk Reduct. 72, 102862. doi:10.1016/j.ijdrr.2022.102862
Anh, D. L. T., Anh, N. T., and Chandio, A. A. (2023). Climate change and its impacts on Vietnam agriculture: a macroeconomic perspective. Ecol. Inf. 74, 101960. doi:10.1016/j.ecoinf.2022.101960
Arabameri, A., Chandra Pal, S., Santosh, M., Chakrabortty, R., Roy, P., and Moayedi, H. (2021). Drought risk assessment: integrating meteorological, hydrological, agricultural and socio-economic factors using ensemble models and geospatial techniques. Geocarto Int. 37, 6087–6115. doi:10.1080/10106049.2021.1926558
Avia, L. Q., Yulihastin, E., Izzaturrahim, M. H., Muharsyah, R., Satyawardhana, H., Sofiati, I., et al. (2023). The spatial distribution of a comprehensive drought risk index in Java, Indonesia. Kuwait J. Sci. 50, 753–760. doi:10.1016/j.kjs.2023.02.031
Babel, M. S., Chawrua, L., Khadka, D., Tingsanchali, T., and Shanmungam, M. S. (2024). Agricultural drought risk and local adaptation measures in the Upper Mun River Basin, Thailand. Agric. Water Manag. 292, 108655. doi:10.1016/j.agwat.2023.108655
Beck, H. E., Wood, E. F., Pan, M., Fisher, C. K., Miralles, D. G., Van Dijk, A. I., et al. (2019). MSWEP V2 global 3-hourly 0.1 precipitation: methodology and quantitative assessment. Bull. Am. Meteorol. Soc. 100, 473–500. doi:10.1175/bams-d-17-0138.1
Belal, A. A., El-Ramady, H. R., Mohamed, E. S., and Saleh, A. M. (2014). Drought risk assessment using remote sensing and GIS techniques. Arabian J. Geosciences 7, 35–53. doi:10.1007/s12517-012-0707-2
Bhardwaj, J., Kuleshov, Y., Chua, Z.-W., Watkins, A. B., Choy, S., and Sun, C. (2023). Pairing monitoring datasets with probabilistic forecasts to provide early warning of drought in Australia. J. Hydrol. 626, 130259. doi:10.1016/j.jhydrol.2023.130259
Blauhut, V. (2020). The triple complexity of drought risk analysis and its visualisation via mapping: a review across scales and sectors. Earth-Science Rev. 210, 103345. doi:10.1016/j.earscirev.2020.103345
Bourne, A. R., Bruce, J., Guthrie, M. M., Koh, L. A., Parker, K., Mastrantonis, S., et al. (2023). Identifying areas of high drought risk in southwest Western Australia. Nat. Hazards 118, 1361–1385. doi:10.1007/s11069-023-06065-z
Bravo, R. Z. B., Cunha, A. P. M. d. A., Leiras, A., and Cyrino Oliveira, F. L. (2021). A new approach for a drought composite index. Nat. Hazards 108 (1), 755–773. doi:10.1007/s11069-021-04704-x
Bulut, E., and Thompson, H. (2023). Performing principal component analysis (PCA) to determine weights for index indicators. ArcGIS Blog [Online]. Available online at: https://www.esri.com/arcgis-blog/products/api-python/analytics/performing-principal-component-analysis-pca-to-determine-weights-for-index-indicators
Buurman, J., Bui, D. D., and Du, L. T. T. (2020). Drought risk assessment in Vietnamese communities using household survey information. Int. J. Water Resour. Dev. 36, 88–105. doi:10.1080/07900627.2018.1557038
Chandrasekara, S. S. K., Kwon, H.-H., Vithanage, M., Obeysekera, J., and Kim, T.-W. (2021). Drought in South Asia: a review of drought assessment and prediction in South Asian countries. Atmosphere 12, 369. doi:10.3390/atmos12030369
David, T., and Harvey, B. A. H. (2022). A comparison of functions for PCA. Cran.R Project Organization. Available online at: https://cran.r-project.org/web/packages/LearnPCA/vignettes/Vig_07_Functions_PCA.pdf.
Dayal, K. S., Deo, R. C., and Apan, A. A. (2018). Spatio-temporal drought risk mapping approach and its application in the drought-prone region of south-east Queensland, Australia. Nat. Hazards 93 (2), 823–847. doi:10.1007/s11069-018-3326-8
Delfiyan, F., Yazdanpanah, M., Forouzani, M., and Yaghoubi, J. (2021). Farmers’ adaptation to drought risk through farm–level decisions: the case of farmers in Dehloran county, Southwest of Iran. Clim. Dev. 13, 152–163. doi:10.1080/17565529.2020.1737797
Deng, H. Y., Yin, Y. H., Zong, X. Z., and Yin, M. J. (2023). Future drought risks in the Yellow River Basin and suggestions for targeted response. Int. J. Disaster Risk Reduct. 93, 103764. doi:10.1016/j.ijdrr.2023.103764
Di Baldassarre, G., Wanders, N., Aghakouchak, A., Kuil, L., Rangecroft, S., Veldkamp, T., et al. (2018). Water shortages worsened by reservoir effects. Nat. Sustain. 1, 617–622. doi:10.1038/s41893-018-0159-0
Dobbie, M. J., and Dail, D. (2013). Robustness and sensitivity of weighting and aggregation in constructing composite indices. Ecol. Indic. 29, 270–277. doi:10.1016/j.ecolind.2012.12.025
Dumitraşcu, M., Mocanu, I., Mitrică, B., Dragotă, C., Grigorescu, I., and Dumitrică, C. (2018). The assessment of socio-economic vulnerability to drought in Southern Romania (Oltenia Plain). Int. J. Disaster Risk Sci. 27, 142–154. doi:10.1016/j.ijdrr.2017.09.049
Dunne, A., and Kuleshov, Y. (2023). Drought risk assessment and mapping for the Murray–darling basin, Australia. Nat. Hazards 115, 839–863. doi:10.1007/s11069-022-05576-5
Elusma, M., Tung, C.-P., and Lee, C.-C. (2022). Agricultural drought risk assessment in the Caribbean region: the case of Haiti. Int. J. Disaster Risk Reduct. 83, 103414. doi:10.1016/j.ijdrr.2022.103414
Fan, G., Zhang, Y., He, Y., and Wang, K. (2017). Risk assessment of drought in the Yangtze River Delta based on natural disaster risk theory. Discrete Dyn. Nat. Soc. 2017, 1–7. doi:10.1155/2017/5682180
Feng, W., Lu, H., Yao, T., and Yu, Q. (2020). Drought characteristics and its elevation dependence in the Qinghai–Tibet plateau during the last half-century. Sci. Rep. 10, 14323. doi:10.1038/s41598-020-71295-1
GSO (2022). Agriculture, Forestry, and Fishery. Available online at: https://www.gso.gov.vn/en/homepage (Accessed April 19 2024).
Guo, H., Chen, J., and Pan, C. (2021a). Assessment on agricultural drought vulnerability and spatial heterogeneity study in China. Int. J. Environ. Res. Public Health 18, 4449. doi:10.3390/ijerph18094449
Guo, H., Wang, R., Garfin, G. M., Zhang, A., Lin, D., Liang, Q., et al. (2021b). Rice drought risk assessment under climate change: based on physical vulnerability a quantitative assessment method. Sci. Total Environ. 751, 141481. doi:10.1016/j.scitotenv.2020.141481
Ha, D. H., Duc, P. N., Luong, T. H., Duc, T. T., Ngoc, T. T., Minh, T. N., et al. (2024). Application of artificial intelligence to forecast drought index for the mekong delta. Appl. Sci. 14, 6763. doi:10.3390/app14156763
Ha, T. V., Huth, J., Bachofer, F., and Kuenzer, C. (2022). A review of earth observation-based drought studies in Southeast Asia. Remote Sens. 14, 3763. doi:10.3390/rs14153763
Ha, T. V., Uereyen, S., and Kuenzer, C. (2024). Spatiotemporal analysis of tropical vegetation ecosystems and their responses to multifaceted droughts in Mainland Southeast Asia using satellite-based time series. GIScience Remote Sens. 61, 2387385. doi:10.1080/15481603.2024.2387385
Hagenlocher, M., Meza, I., Anderson, C. C., Min, A., Renaud, F. G., Walz, Y., et al. (2019). Drought vulnerability and risk assessments: state of the art, persistent gaps, and research agenda. Environ. Res. Lett. 14, 083002. doi:10.1088/1748-9326/ab225d
Hagenlocher, M., Naumann, G., Meza, I., Blauhut, V., Cotti, D., Döll, P., et al. (2023). Tackling growing drought risks-the need for a systemic perspective. Earths Future 11, e2023EF003857. doi:10.1029/2023ef003857
Han, J., and Singh, V. P. (2023). A review of widely used drought indices and the challenges of drought assessment under climate change. Environ. Monit. Assess. 195, 1438. doi:10.1007/s10661-023-12062-3
Haobo, L., Choy, S., Zaminpardaz, S., Carter, B., Sun, C., Purwar, S., et al. (2023). Investigating the inter-relationships among multiple atmospheric variables and their responses to precipitation. Atmosphere 14 (3), 571. doi:10.3390/atmos14030571
Hedayat, H., and Seyed Kaboli, H. (2024). Drought risk assessment: the importance of vulnerability factors interdependencies in regional drought risk management. Int. J. Disaster Risk Reduct. 100, 104152. doi:10.1016/j.ijdrr.2023.104152
Hochrainer-Stigler, S., Balkovic, J., Silm, K., and Timonina-Farkas, A. (2019). Large scale extreme risk assessment using copulas: an application to drought events under climate change for Austria. Comput. Manag. Sci. 16, 651–669. doi:10.1007/s10287-018-0339-4
Hoque, M. A. A., Pradhan, B., Ahmed, N., and Sohel, M. S. I. (2021). Agricultural drought risk assessment of Northern New South Wales, Australia using geospatial techniques. Sci. Total Environ. 756, 143600. doi:10.1016/j.scitotenv.2020.143600
IPCC (2022). Climate change 2022: impacts, adaptation and vulnerability. Contribution of working group II to the sixth assessment report of the intergovernmental panel on climate change. Editors H.-O. Pörtner, D. C. Roberts, M. Tignor, E. S. Poloczanska, K. Mintenbeck, and A. Alegría (Cambridge, UK: Cambridge University Press), 3056.
Islam, S. M. S., Yeşilköy, S., Baydaroğlu, Ö., YıLDıRıM, E., and Demir, I. (2024). State-level multidimensional agricultural drought susceptibility and risk assessment for agriculturally prominent areas. Int. J. River Basin Manag., 1–18. doi:10.1080/15715124.2024.2304546
Jaadi, Z., Whitfield, B., and Pierre, S. (2024). Principal component analysis (PCA): a step-by-step explanation. Builtin. Available online at: https://builtin.com/data-science/step-step-explanation-principal-component-analysis.
Khoshnazar, A., Corzo Perez, G., and Sajjad, M. (2023). Characterizing spatial–temporal drought risk heterogeneities: a hazard, vulnerability and resilience-based modeling. J. Hydrol. 619, 129321. doi:10.1016/j.jhydrol.2023.129321
Kim, J. E., Yoo, J., Kwon, H. H., and Kim, T. W. (2023). Comprehensive drought risk assessment using structural equation modeling and objective weighting methods. J. Hydrol. Reg. Stud. 50, 101538. doi:10.1016/j.ejrh.2023.101538
Kim, J. E., Yu, J., Ryu, J. H., Lee, J. H., and Kim, T. W. (2021a). Assessment of regional drought vulnerability and risk using principal component analysis and a Gaussian mixture model. Nat. Hazards 109, 707–724. doi:10.1007/s11069-021-04854-y
Kim, S. J., Park, S., Lee, S. J., Shaimerdenova, A., Kim, J., Park, E., et al. (2021b). Developing spatial agricultural drought risk index with controllable geo-spatial indicators: a case study for South Korea and Kazakhstan. Int. J. Disaster Risk Reduct. 54, 102056. doi:10.1016/j.ijdrr.2021.102056
Kogan, F. (2019). Vegetation health method. Remote Sens. Food Secur., 51–73. doi:10.1007/978-3-319-96256-6_4
Kuleshov, Y., Kurino, T., Kubota, T., Tashima, T., and Xie, P. (2019). “WMO space-based weather and climate extremes monitoring demonstration project (semdp): first outcomes of regional cooperation on drought and heavy precipitation monitoring for Australia and Southeast Asia,” in Rainfall-extremes, distribution and properties. IntechOpen. doi:10.5772/intechopen.85824
Kumari, M., Kumar, D., and Vaishnavi, (2023). Dynamic drought risk assessment and analysis with multi-source drought indices and analytical hierarchy process. Int. J. Environ. Sci. Technol. 20, 2839–2856. doi:10.1007/s13762-022-04041-x
Kumar, V., and Chu, H.-J. (2024). Spatiotemporal consistency and inconsistency of meteorological and agricultural drought identification: a case study of India. Remote Sens. Appl. Soc. Environ. 33, 101134. doi:10.1016/j.rsase.2023.101134
Le, P. V., Phan-Van, T., Mai, K. V., and Tran, D. Q. (2019). Space–time variability of drought over Vietnam. Int. J. Climatol. 39, 5437–5451. doi:10.1002/joc.6164
Le, T., Sun, C., Choy, S., and Kuleshov, Y. (2021). Regional drought risk assessment in the Central Highlands and the South of Vietnam. Geomatics, Nat. Hazards Risk 12, 3140–3159. doi:10.1080/19475705.2021.1998232
Le, T., Sun, C., Choy, S., Kuleshov, Y., and Tran, T. D. (2024). Agricultural drought risk assessments: a comprehensive review of indicators, algorithms, and validation for informed adaptations. Geomatics, Nat. Hazards Risk 15, 2383774. doi:10.1080/19475705.2024.2383774
Liou, Y. A., Vo, T. H., Tran, D. P., and Bui, H. A. (2024). Comprehensive drought risk assessment and mapping in Taiwan: an ANP-ANN ensemble approach. Sci. Total Environ. 952, 175835. doi:10.1016/j.scitotenv.2024.175835
Li, T., Angeles, O., Radanielson, A., Marcaida, M., and Manalo, E. (2015). Drought stress impacts of climate change on rainfed rice in South Asia. Clim. Change 133, 709–720. doi:10.1007/s10584-015-1487-y
Luo, D., Zhang, M., and Zhang, H. (2020). Two-stage grey cloud clustering model for drought risk assessment. Grey Syst. 10, 68–84. doi:10.1108/gs-06-2019-0021
MARD (2020). Report on the drought and saltwater intrusion in mekong river delta. The Ministry of Agriculture and Rural Development. Available online at: https://phongchongthientai.mard.gov.vn/en/Pages/mard-report-on-the-drought-and-saltwater-intrusion-in-mekong-river-delta.aspx.
Meza, I., Eyshi Rezaei, E., Siebert, S., Ghazaryan, G., Nouri, H., Dubovyk, O., et al. (2021). Drought risk for agricultural systems in South Africa: drivers, spatial patterns, and implications for drought risk management. Sci. Total Environ. 799, 149505. doi:10.1016/j.scitotenv.2021.149505
Meza, I., Siebert, S., Döll, P., Kusche, J., Herbert, C., Rezaei, E. E., et al. (2020). Global-scale drought risk assessment for agricultural systems. Nat. Hazards Earth Syst. Sci. 20, 695–712. doi:10.5194/nhess-20-695-2020
Minh, H. V. T., Kumar, P., Van Ty, T., Duy, D. V., Han, T. G., Lavane, K., et al. (2022a). Understanding dry and wet conditions in the Vietnamese Mekong delta using multiple drought indices: a case study in Ca Mau province. Hydrology 9, 213. doi:10.3390/hydrology9120213
Minh, H. V. T., Lavane, K., Ty, T. V., Downes, N. K., Hong, T. T. K., and Kumar, P. (2022b). Evaluation of the impact of drought and saline water intrusion on rice yields in the Mekong Delta, Vietnam. Water 14, 3499. doi:10.3390/w14213499
Mishra, A. K., and Singh, V. P. (2010). A review of drought concepts. J. Hydrol. 391, 202–216. doi:10.1016/j.jhydrol.2010.07.012
Mishra, A., Delk, J., Mishra, A., and Zilberman, D. (2025). Drought has varying impacts on the national economy. Stoch. Environ. Res. Risk Assess. 39, 925–936. doi:10.1007/s00477-024-02892-z
Nardo, M., Saisana, M., Saltelli, A., and Tarantola, S. (2005). Tools for composite indicators building. EUR 21682 EN. JRC31473. Available online at: https://publications.jrc.ec.europa.eu/repository/handle/JRC31473.
Nauditt, A., Stahl, K., Rodríguez, E., Birkel, C., Formiga-Johnsson, R. M., Kallio, M., et al. (2022). Evaluating tropical drought risk by combining open access gridded vulnerability and hazard data products. Sci. Total Environ. 822, 153493. doi:10.1016/j.scitotenv.2022.153493
Nguyen, V.-H., Stuart, A. M., Nguyen, T.-M.-P., Pham, T.-M.-H., Nguyen, N.-P.-T., Pame, A. R. P., et al. (2022). An assessment of irrigated rice cultivation with different crop establishment practices in Vietnam. Sci. Rep. 12, 401. doi:10.1038/s41598-021-04362-w
NOAA (2024). NESDIS operational soil moisture products. National Oceanic and Atmospheric Administration - Office of Satellite and Product Operation. Available online at: https://www.ospo.noaa.gov/products/land/smops/algo.html.
ODV (2022). The new normal: Mekong delta faces droughts and saltwater intrusion. Vietnam: Open Development Vietnam.
OECD (2008). Handbook on constructing composite indicators: methodology and user guide. Paris: OECD Publishing.
Oh, H., Kim, H. J., Mehboob, M. S., Kim, J., and Kim, Y. (2023). Sources and uncertainties of future global drought risk with ISIMIP2b climate scenarios and socioeconomic indicators. Sci. Total Environ. 859, 160371. doi:10.1016/j.scitotenv.2022.160371
Park, S. Y., Sur, C., Kim, J. S., Choi, S. J., Lee, J. H., and Kim, T. W. (2021). Projected drought risk assessment from water balance perspectives in a changing climate [Article]. Int. J. Climatol. 41 (4), 2765–2777. doi:10.1002/joc.6988
Pham, M.-P., Nguyen, K. Q., Vu, G. D., Nguyen, N. T. T., Tong, H. T., Trinh, L. H., et al. (2022). Drought risk index for agricultural land based on a multi-criteria evaluation. Model. Earth Syst. Environ. 8, 5535–5546. doi:10.1007/s40808-022-01376-9
Phan, V. H., Dinh, V. T., and Su, Z. (2020). Trends in long-term drought changes in the Mekong river delta of Vietnam. Remote Sens. 12, 2974. doi:10.3390/rs12182974
Saha, A., Pal, S. C., Chowdhuri, I., Roy, P., Chakrabortty, R., and Shit, M. (2023). Vulnerability assessment of drought in India: insights from meteorological, hydrological, agricultural and socio-economic perspectives. Gondwana Res. 123, 68–88. doi:10.1016/j.gr.2022.11.006
Sahana, V., and Mondal, A. (2023). Evolution of multivariate drought hazard, vulnerability and risk in India under climate change. Nat. Hazards Earth Syst. Sci. 23, 623–641. doi:10.5194/nhess-23-623-2023
Sahana, V., Mondal, A., and Sreekumar, P. (2021). Drought vulnerability and risk assessment in India: sensitivity analysis and comparison of aggregation techniques. J. Environ. Manag. 299, 113689. doi:10.1016/j.jenvman.2021.113689
Senapati, U., and Das, T. K. (2024). Geospatial assessment of agricultural drought vulnerability using integrated three-dimensional model in the upper Dwarakeshwar river basin in West Bengal, India. Environ. Sci. Pollut. Res. Int. 31, 54061–54088. doi:10.1007/s11356-022-23663-9
Sharafi, L., Zarafshani, K., Keshavarz, M., Azadi, H., and Van Passel, S. (2020). Drought risk assessment: towards drought early warning system and sustainable environment in western Iran. Ecol. Indic. 114, 106276. doi:10.1016/j.ecolind.2020.106276
Shiravand, H., and Bayat, A. (2023). Vulnerability and drought risk assessment in Iran based on fuzzy logic and hierarchical analysis. Theor. Appl. Climatol. 151, 1323–1335. doi:10.1007/s00704-022-04323-x
Shrestha, N. (2020). Detecting multicollinearity in regression analysis. Am. J. Appl. Math. Statistics 8, 39–42. doi:10.12691/ajams-8-2-1
Song, W., Cao, S., Du, M., Mo, Y., and Li, S. (2022). Investigation of compound drought risk and driving factors in Nepal. Nat. Hazards 114, 1365–1391. doi:10.1007/s11069-022-05429-1
Stojanovic, M., Liberato, M. L., Sorí, R., Vázquez, M., Phan-Van, T., Duongvan, H., et al. (2020). Trends and extremes of drought episodes in Vietnam sub-regions during 1980–2017 at different timescales. Water 12, 813. doi:10.3390/w12030813
Thao, N. T. T., Khoi, D. N., Xuan, T. T., and Tychon, B. (2019). Assessment of livelihood vulnerability to drought: a case study in Dak Nong Province, Vietnam. Int. J. Disaster Risk Sci. 10, 604–615. doi:10.1007/s13753-019-00230-4
Tingsanchali, T., and Piriyawong, T. (2018). Drought risk assessment of irrigation project areas in a river basin. Eng. J. 22, 279–287. doi:10.4186/ej.2018.22.1.279
Truong, D. D., Dat, T. T., Hang, N. D., and Huan, L. H. (2022). Vulnerability assessment of climate change in Vietnam: a case study of Binh Chanh district, Ho Chi Minh city. Front. Environ. Sci. 10. doi:10.3389/fenvs.2022.880254
Ty, T. V., Lavane, K., Nguyen, P. C., Downes, N. K., Nam, N. D. G., Minh, H. V. T., et al. (2022). Assessment of relationship between climate change, drought, and land use and land cover changes in a semi-mountainous area of the Vietnamese Mekong delta. Land 11, 2175. doi:10.3390/land11122175
UNDP (2016). Vietnam drought and salt water intrusion: transitioning from emergency to recovery. United Nations Development Programme (VN). Available online at: https://www.undp.org/sites/g/files/zskgke326/files/migration/vn/Recovery-draft-Sep-2016_final.pdf.
Valverde-Arias, O., Garrido, A., Valencia, J. L., and Tarquis, A. M. (2018). Using geographical information system to generate a drought risk map for rice cultivation: case study in Babahoyo canton (Ecuador). Biosyst. Eng. 168, 26–41. doi:10.1016/j.biosystemseng.2017.08.007
Villani, L., Castelli, G., Piemontese, L., Penna, D., and Bresci, E. (2022). Drought risk assessment in Mediterranean agricultural watersheds: a case study in Central Italy. Agric. Water Manag. 271, 107748. doi:10.1016/j.agwat.2022.107748
Wang, T., and Sun, F. (2023). Integrated drought vulnerability and risk assessment for future scenarios: an indicator based analysis. Sci. Total Environ. 900, 165591. doi:10.1016/j.scitotenv.2023.165591
Wei, W., Zhang, X., Liu, C., Xie, B., Zhou, J., and Zhang, H. (2022). A new drought index and its application based on geographically weighted regression (GWR) model and multi-source remote sensing data. Environ. Sci. Pollut. Res. 30, 17865–17887. doi:10.1007/s11356-022-23200-8
World Bank Group., (2024). The World Bank In Viet Nam: Overview. Available online at:. https://www.worldbank.org/en/country/vietnam/overview.
Wu, F., Yang, X., Cui, Z., Ren, L., Jiang, S., Liu, Y., et al. (2025). Comprehensive drought risk assessment of the Yangtze River Basin considering socio-natural systems — based on PCR-GLOBWB model. J. Hydrology 646, 132315. doi:10.1016/j.jhydrol.2024.132315
Xu, H., Xu, K., and Yang, Y. (2021). Risk assessment model of agricultural drought disaster based on grey matter-element analysis theory. Nat. Hazards 107, 2693–2707. doi:10.1007/s11069-021-04681-1
Yang, W., Zhang, L., and Liang, C. (2023). Agricultural drought disaster risk assessment in Shandong Province, China. Nat. Hazards 118, 1515–1534. doi:10.1007/s11069-023-06057-z
Zhao, J., Zhang, Q., Zhu, X., Shen, Z., and Yu, H. (2020). Drought risk assessment in China: evaluation framework and influencing factors. Geogr. Sustain. 1, 220–228. doi:10.1016/j.geosus.2020.06.005
Keywords: agricultural drought risk, GIS, remote sensing, hazard, exposure, vulnerability
Citation: Le T, Sun QC, Tran TD, Choy S and Kuleshov Y (2025) Spatial-temporal analysis of agricultural drought risk: insights from a Vietnam case study. Front. Earth Sci. 13:1564900. doi: 10.3389/feart.2025.1564900
Received: 22 January 2025; Accepted: 06 May 2025;
Published: 03 June 2025.
Edited by:
Shailesh Kumar Singh, National Institute of Water and Atmospheric Research (NIWA), New ZealandReviewed by:
Abu Reza Md. Towfiqul Islam, Begum Rokeya University, BangladeshHao Guo, Zhejiang Normal University, China
Copyright © 2025 Le, Sun, Tran, Choy and Kuleshov. This is an open-access article distributed under the terms of the Creative Commons Attribution License (CC BY). The use, distribution or reproduction in other forums is permitted, provided the original author(s) and the copyright owner(s) are credited and that the original publication in this journal is cited, in accordance with accepted academic practice. No use, distribution or reproduction is permitted which does not comply with these terms.
*Correspondence: Tien Le, dGllbi5sZTNAcm1pdC5lZHUuYXU=