 Xiaoyan Nie
 Jia Xu
 Ying Ge
- School of Earth Sciences and Engineering, Hohai University, Nanjing, China
The East Nile Basin (ENB) is a major water source for several African countries, and the supply, distribution, and management of water resources in the basin are directly related to the survival and development of millions of people. However, most of the basin falls within arid or semi-arid regions, and the uneven distribution of water resources severely limits the development of the countries within the basin. Achieving accurate monitoring and effective management of water resources has become a critical issue for sustainable development in this region. A robust adaptive threshold method considering boundary optimization was proposed to accurately extract water body information from GF-1and GF-6 WFV imagery. The study analyzed the spatio-temporal dynamic changes of six key lakes in basin countries, including Egypt, Ethiopia, and Sudan from 2019 to 2024. The findings were as follows: (1) The proposed water extraction method effectively addressed the issue of uneven spectral index gradients, with an overall accuracy of over 97.67% and a Kappa value exceeding 95.24%. It was able to accurately and efficiently extract lakes in arid regions. (2) High spatiotemporal resolution monitoring revealed the variation patterns of the lakes. The interannual changes of Tana, Roseires, Merowe, and Nasser were not significant, with notable seasonal variations, the low-water-level period occurring in July and the high-water-level period in September or October. For GERD and Toshka, the interannual variation was large, with each increase occurring between July and October. (3) The variation in lake areas was primarily attributed to precipitation in the upstream Blue Nile, artificial water storage by dams, and other factors. Tana was mainly affected by precipitation, while GERD’s changes were primarily related to precipitation and its own water storage, Roseires, Merowe, and Nasser, as artificial reservoirs, were influenced by their own water storage and the storage in upstream reservoirs, while Toshka’s changes were related to overflow from Nasser’s high water levels. The current research findings could provide scientific guidance for water resources assessment and management in the ENB.
1 Introduction
Lakes account for approximately 95% of the Earth’s surface freshwater resources, and as a vital water resource, they play an irreplaceable role in ecological, economic, and social development (Peter, 1993; Xu et al., 2018). In arid regions, lakes are not only a primary source of water but also sensitive indicators of environmental change, with their area fluctuations accurately reflecting the water balance processes in inland basins (Nilsson and Grelsson, 1995; Tan et al., 2018). Therefore, scientifically and systematically monitoring the dynamic changes in lakes in arid regions is crucial for ensuring regional ecological stability and effective water resource management.
The East Nile Basin (ENB) in Africa encompasses large areas of arid land, and the major countries within the basin (Ethiopia, Sudan, and Egypt) face development challenges due to water resource limitations. In July 2020, Ethiopia began filling the Grand Ethiopian Renaissance Dam (GERD) on the upper Blue Nile to strengthen its water resource management, with plans to complete the process within 5–10 years (Kansara et al., 2021). Recently, the escalation of the Russia-Ukraine conflict has led to restricted grain imports from Russia to countries like Egypt and Sudan, prompting these nations to pay greater attention to their domestic water resource conditions (Gebeltová et al., 2023). The precise monitoring and effective management of water resources have become key issues for sustainable development in this region. Therefore, there is an urgent need for timely and spatially dynamic monitoring of surface water extent in the ENB, which will provide scientific guidance for water management, disaster assessment, and ecological protection in the basin.
Satellite remote sensing technology, with its advantages of wide coverage, high monitoring frequency, and low cost, provides effective support for dynamic lake monitoring, particularly in regions like Africa where ground-based hydrological observations are limited (Chen et al., 2018).
Remote sensing techniques have been widely employed to analyze dynamic changes in lake surface areas, predominantly using internationally available satellite imagery including MODIS, Landsat, and Sentinel systems (Moser et al., 2014). Utilized MODIS time-series imagery to monitor wetland lake variations in semi-arid Burkina Faso (2000–2012), demonstrating that negative water coverage anomalies coincided with drought periods (Wu et al., 2023). Combined MODIS and Landsat data to produce continuous 30-meter resolution surface water time-series datasets, effectively capturing Lake Victoria’s water surface dynamics between 2000 and 2020 (Lan et al., 2024). Developed an automated framework using Landsat series imagery to reconstruct long-term lake area changes across three geographical regions, achieving high temporal data completeness (Ogilvie et al., 2018). Analyzed water surface fluctuations in seven Merguellil Basin reservoirs (1999–2014) through multi-sensor Landsat integration, revealing an average root mean square error of 21,800 m2 when compared with global datasets, while highlighting Landsat’s limitations in monitoring lakes smaller than 3 ha (Song et al., 2022). Used Sentinel-2 images to create a 2020 urban lake dataset for China, demonstrating superior performance in small lake extraction compared to existing datasets (Dong et al., 2021). Implemented Sentinel-1 SAR data for Poyang Lake flood monitoring, successfully overcoming cloud contamination issues inherent to optical sensors but encountering false detections caused by image noise (Li et al., 2022). Achieved improved lake extraction accuracy in complex environments through synergistic use of Sentinel-1 and Sentinel-2 data, particularly for six representative Chinese lakes.
Since the implementation of China High-resolution Earth Observation System, Chinese Gaofen (GF) images have facilitated the construction of an advanced terrestrial observation system, making high-frequency, large-scale monitoring of surface water possible (Chen et al., 2022). This system has provided valuable services and decision support in critical areas such as modern agriculture (Zhang et al., 2021), environmental monitoring (Chen et al., 2024), and public safety (Zhang et al., 2024). Research has shown that GF satellite images meet the requirements for high-precision monitoring and extensive temporal and spatial coverage in water body monitoring, with significant potential for application. These satellites have been successfully used in the monitoring of near-shore areas (Tan et al., 2024), rivers (Yao et al., 2022), and inland lakes (Luo et al., 2024). Notably, the network of Gaofen-6 (GF-6) and Gaofen-1 (GF-1) satellites has reduced data acquisition temporal resolution to 2 days, with Wide Field of View (WFV) image spatial resolution reaching 16 m, significantly enhancing the scale and timeliness of remote sensing data acquisition (Xu et al., 2023). The GF series of satellites greatly meet the demands for high spatial resolution remote sensing data, gradually changing China’s reliance on the purchase of foreign commercial satellite data and strongly supporting the development of remote sensing satellite applications in China (Chen et al., 2022).
However, most existing studies employing GF imagery have primarily concentrated on water body extraction using single-date acquisitions, with a predominant focus on inland lakes in China (Zhang et al., 2017; Guo et al., 2020; Ge et al., 2022). As the Belt and Road (B&R) initiative progresses, Chinese satellites are increasingly providing comprehensive Earth observation data to nations along the B&R corridors. The implementation of lake monitoring in Africa utilizing Chinese satellite imagery carries substantial significance for advancing the global dissemination of China’s remote sensing and geospatial technological capabilities.
Previous water body monitoring methods primarily relied on threshold-based approaches to extract water bodies from water indices (Chang et al., 2015; Lu and Sun, 2023; Naeem et al., 2025). However, the spectral response of water is affected by factors such as water depth and sediment content, making it difficult to extract all water body details accurately with a single threshold in large water areas (Haibo et al., 2011). Inspired by these challenges, various machine learning methods (Nagaraj and Kumar, 2022) and deep learning methods (Gautam and Singhai, 2024) have been applied to water extraction. However, these algorithms are time-consuming when applied to large-scale study areas. In this study, we propose an adaptive threshold method combined with boundary optimization, which can quickly and accurately extract water body information from images for precise monitoring of water body changes in the basin.
In this study, our objective is to collaborate with two Chinere GF images to achieve high spatio-temporal resolution dynamic water body monitoring for lakes in the ENB. More specifically, we aimed: (1) to explore the feasibility of using GF-1/6 WFV images to monitor lake area changes in the ENB; (2) to describe the change patterns of six typical lakes in the basin from 2020 to 2024; (3) to Search for the causes of changes affecting lake dynamics.
2 Study area and data
2.1 Study area
As shown in Figure 1, ENB (3°20′–31°40′N, 21°50′–48°00′E) features a complex and diverse topography, stretching from the rugged Ethiopian Highlands in the east, to the wetlands of Sudan and Ethiopia in the south, and bordered by the deserts of Sudan and Egypt in the north and west (Arsano and Tamrat, 2005). The Blue Nile and the main Nile are the key focus of this study. The source of the Blue Nile is Lake Tana, located in the northwest of the Ethiopian Highlands, where rainfall during the Ethiopian rainy season plays a crucial role in regulating the annual flow of the Blue Nile and downstream water volumes (Kebede et al., 2005). The peak flow of the Blue Nile occurs between June and September (Basheer, 2021; Mengistu et al., 2021), during the Ethiopian rainy season. During the flood period of the Nile River, the Blue Nile contributes approximately 68% of the water, which directly influences the timing of the Nile’s flooding, while in the dry season, it contributes about 17% (Fielding et al., 2017). The Blue Nile is vital to the downstream countries of the ENB, which experience extreme aridity (Diop et al., 2021). In this study, six typical lakes in the ENB were selected, namely, Tana, GERD, and Roseires Lakes in the Blue Nile, and Merowe, Nasser, and Toshka Lakes in the main Nile.
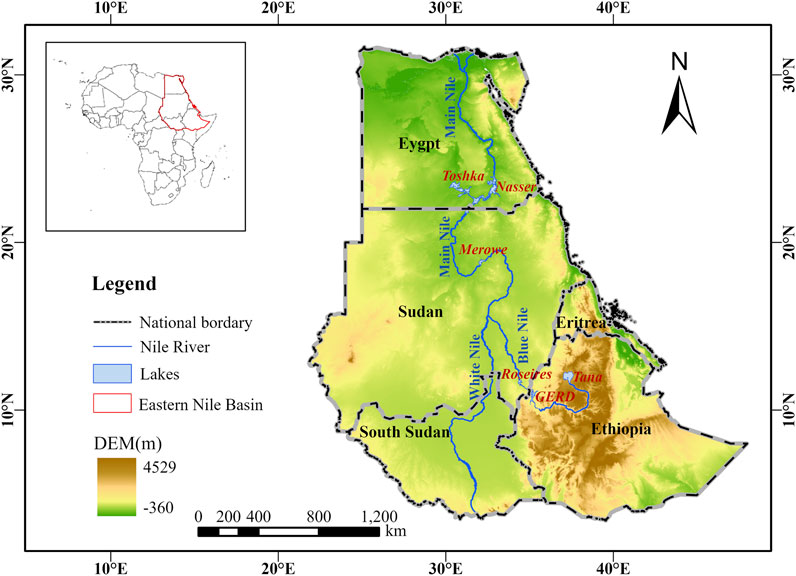
Figure 1. Location map of the study area.
Lake Tana, a shallow, naturally rainfall-fed lake covering an area of 3,156 km2, is the largest lake in Ethiopia and the third-largest in the Nile Basin. Characterized by seasonal water-level fluctuations of approximately 1.6 m, this oligotrophic lake has the Blue Nile as its sole surface outflow (Duan and Bastiaanssen, 2013; Kebede et al., 2006).
GERD, constructed in 2011, began reservoir impoundment in July 2020 and is expected to reach full operational capacity within 5–10 years. With a structural height of 640 m AMSL and a reservoir storage capacity of 74 bcm, GERD had impounded approximately 40 bcm of water between 2020 and 2023. It primarily serves Ethiopia’s hydropower needs, generating 6,450 MW of electricity (Abtew, 2025; Luna et al., 2024).
Situated approximately 115 km downstream of GERD, the Roseires Dam, built in 1966 with a height of 78 m AMSL and a reservoir capacity of 3 bcm, regulates water releases for on-demand irrigation of adjacent agricultural lands and produces 280 MW of hydropower. Its operational dynamics are significantly influenced by upstream water management practices at GERD (Hassan et al., 2023).
The Merowe Dam, located 350 km north of Khartoum and completed in 2009, stands 67 m AMSL with a reservoir capacity of 12.4 bcm. Designed primarily to supply electricity to major urban centers in riparian nations, it also addresses flood control, sediment reduction, and centralized agricultural development, while generating 15 MW of hydropower (Eldeeb et al., 2023; Kansara and Lakshmi, 2022).
Lake Nasser, created in 1968, is one of the world’s largest artificial reservoirs, with a maximum depth of 180 m, a surface area of 5,250 km2, and a storage capacity of 162 bcm. It serves critical roles in irrigation, flood mitigation, and hydropower generation (2,100 MW installed capacity) (Entz, 1978; Goher et al., 2021). The Toshka Spillway, constructed in 1982, which links Lake Nasser to the downstream Toshka Depression. When water levels in Lake Nasser exceed 180 m AMSL, excess flows are diverted through this spillway to the Toshka, ensuring operational safety (Bastawesy et al., 2008).
2.2 Data
2.2.1 Satellite remote sensing imagery
The GF-1 satellite, launched on 26 April 2013, is the first satellite of Chinese High-resolution Earth Observation System. It is equipped with four 16-meter resolution multispectral WFV(Wide Field of View) sensors, each having a swath width of up to 200 km. Together, the four sensors provide a combined swath coverage of nearly 800 km (Zhou et al., 2017). The GF-6 satellite, launched on 2 June 2018, is equipped with a single 16-meter resolution multispectral camera. This camera is capable of capturing imagery with a swath width of 800 km, allowing it to cover extensive areas in a single pass (Xia et al., 2022). These WFV data are particularly useful for large-scale monitoring of terrestrial features.
The data used in this study were sourced from both GF-1 and GF-6 WFV satellites. The GF-1 WFV data include four bands: blue, green, red, and near-infrared. On the other hand, GF-6 WFV data offer additional bands, including red edge I, red edge II, purple, and yellow. Data from the years 2020–2024 were selected based on quality, though some months had missing imagery due to seasonal cloud cover. The number of images and the monitoring frequency for each lake are illustrated in Figure 2. This selection ensures that the analysis accounts for the best available data, considering the potential impact of cloud cover on satellite image acquisition. For all lakes, except for Lake Nasser, where at least two images are required for each period, only one image is typically sufficient to cover the area.
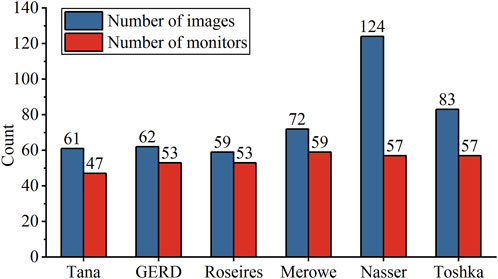
Figure 2. Number of images and monitors.
2.2.2 Meteorological data
The HydroBasins dataset (https://www.hydrosheds.org/products/hydrobasins) was utilized to delineate the sub-basins of the lakes in the study region, enabling a better understanding of their catchment areas (Lehner and Grill, 2013). Meteorological statistics were collected based on these catchments, with precipitation data sourced from the CHIRPS dataset (https://www.chc.ucsb.edu/data/chirps), which provides global rainfall data from 1981 to the present (Funk et al., 2015). For land surface temperature (LST) data, we relied on the GCOM-C dataset (https://suzaku.eorc.jaxa.jp/GCOM_C), which provides long-term and continuous global observations and data collection. The GCOM-C dataset is instrumental in tracking changes in land surface temperature, supporting the analysis of climatic conditions and their effects on the study area. Collaborating with research institutions that utilize climate models, the GCOM-C satellite helps reduce temperature rise prediction errors. It provides global observations approximately every 2 days, particularly in mid-latitude regions near Japan, enabling accurate monitoring and analysis of land surface temperature dynamics. This continuous data collection supports climate research and enhances our ability to predict and understand temperature changes globally (Shimoda, 2004).
For this study, monthly averaged data from the two datasets, covering the period from 2020 to 2024, were collected for each lake’s respective sub-basin.
3 Methods
For multiple lakes within the basin, this study develops a method for fine extraction of water bodies from multispectral images considering boundary optimization. The time series changes of the six lakes in the study area from 2020 to 2024 are extracted and analyzed in conjunction with concurrent climate data. As shown in Figure 3, the process includes satellite image processing, lake water body extraction, climate data collection and analysis. The collection of climate data is discussed in Section 2.2.2, while the other key steps are elaborated below.
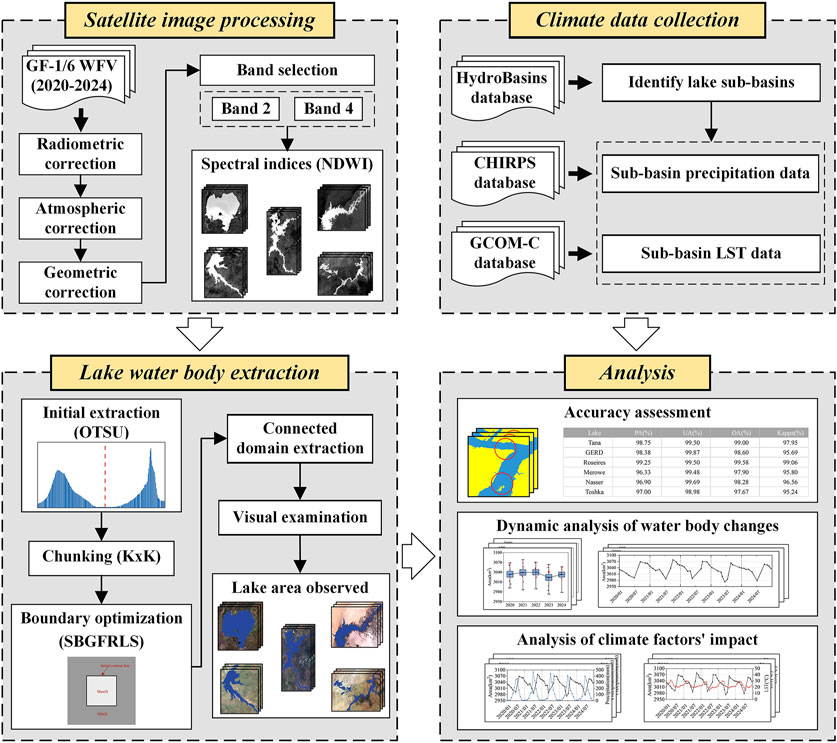
Figure 3. Overall workflow of our study.
3.1 Satellite image preprocessing
First, the GF1/6 WFV imagery data were preprocessed. The absolute calibration coefficients provided by the China Centre for Resources Satellite Data and Application (https://data.cresda.cn) were applied to radiometrically correct all images, eliminating sensor-specific errors and ensuring accurate radiometric measurements. Atmospheric correction was then performed using the FLAASH model to remove atmospheric interference and illumination variations affecting surface reflectance. Finally, the RPC rational function model was employed for orthorectification, correcting geometric distortions induced by terrain relief and sensor viewing geometry.
The water body remote sensing index, based on remote sensing information, is one of the most widely used techniques for water body extraction. In the pre-processed imagery, lakes are extracted using the Normalized Difference Water Index (NDWI) proposed by (McFeeters, 1996), based on the green and near-infrared bands common to both GF-1/6 WFV. The formula for calculating NDWI is as Equation 1:
Where,
3.2 Lake water body extraction
The Otsu method (Ostu, 1979), a widely used and simple technique, is employed to determine the initial threshold in the NDWI grayscale image. This method distinguishes surface water from the background by maximizing the between-class variance, and is not affected by image brightness and contrast. While the Otsu method can efficiently separate large water bodies, it often results in blurred edges for water bodies. To address this, the region-based active contour model method proposed by (Zhang et al., 2010), known as the SBGFRLS model, is introduced. The image is divided into m × n blocks, each of size K × K pixels, where K is determined based on image size and computer processing time. The optimization of the initial water body boundary is performed for each block.
The level set evolution equation of the SBGFRLS model is as Equation 2:
where is the level set,
where
The SPF function, based on regional global grayscale information, ranges from [−1,1]. It has opposite signs near the boundary, as shown in Figure 4. Therefore, when the contour line is outside the target, it can contract, and when it is inside the target, it can expand.
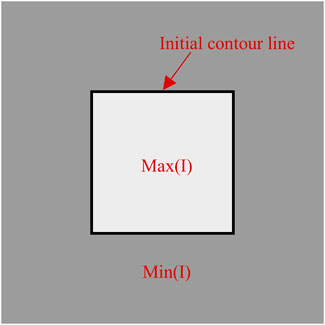
Figure 4. Illustration of the symbol pressure function.
The SBGFRLS model combines the advantages of the GAC (Caselles et al., 1997) and CV (Chan and Vese, 2001) models, providing an efficient method to tightly fit the target boundary. It significantly improves the extraction of complex lake boundary lines, resulting in more accurate segmentation of water bodies. In the optimized results the lake area is obtained by using connected domains according to the lake morphology and only one maximum connected domain is extracted for all the lakes except Toshka lake which has multiple connected domains. Finally, manual checks and corrections are performed on each lake to remove influences caused by connected rivers, cloud cover during rainy seasons, etc., ensuring the accuracy of the data.
3.3 Accuracy assessment
Accuracy assessment is a critical component of the image classification process. In this study, four metrics are used to quantitatively assess the performance of the proposed water body recognition method through the confusion matrix: the producer’s accuracy (PA), user’s accuracy (UA), overall accuracy (OA), and Kappa coefficient (Kappa). PA represents the probability that true reference data for a specific class are correctly classified in the classification results, UA indicates the proportion of validation points assigned to a class in the classification map that are accurately classified as that class, OA quantifies the percentage of all correctly classified validation points relative to the total number of sampled validation points, and Kappa measures how much better the classification results are compared to random classification by accounting for both the agreement between automated classification and reference data and the agreement arising from random sampling and reference classification consistency (Cohen, 1960). PA and UA focus on analyzing omission and commission errors, respectively, but their interpretation may introduce bias in overall evaluation due to class imbalance, whereas OA and the Kappa directly reflect global classification performance, providing robust validation of the method’s generalizability across diverse scenarios (Stehman, 2006; Pontius and Millones, 2011). The calculation formulas can be expressed as Equations 6–11:
With,
Where true positives (TP) denote the number of positive samples correctly classified, true negatives (TN) represent the number of negative samples accurately categorized, false positives (FP) correspond to the number of negative samples erroneously assigned to the positive class, and false negatives (FN) indicate the number of positive samples incorrectly classified as negative.
4 Results
4.1 Water body extraction and accuracy assessment
The boundary optimization effect of Merowe on 18 October 2023, was selected and is shown in Figure 5. Overall, the NDWI image effectively highlights the lake’s water body. However, the NDWI values are unevenly distributed across the lake, with the left side exhibiting brighter spectral indices compared to the right side. Intercepting three of the regions to show the details of the effect. Region a: This area represents a river with relatively low spectral indices. In the initial extraction map, a significant portion of this region was missed. After boundary optimization, these darker spectral areas were accurately extracted. Region b: This is a complex water body area with numerous small tributaries. In the initial extraction, some of the finer branches were missed. Following boundary optimization, these small tributaries were precisely identified. Region c: The initial extraction map already did a good job of delineating the boundary water bodies. After boundary optimization, a small amount of previously unidentified water was also extracted.
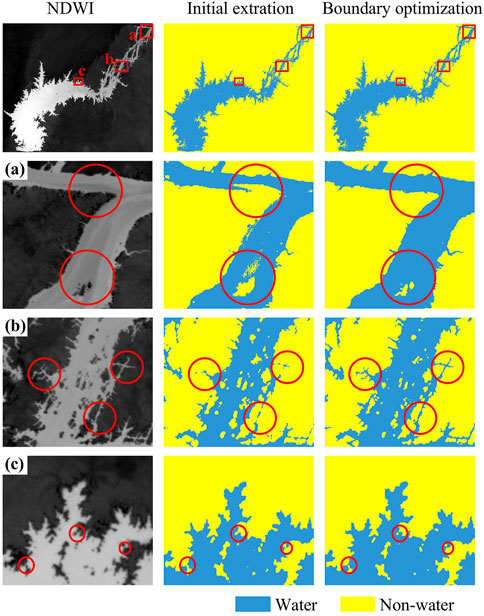
Figure 5. Detail display of boundary optimization effect: From left to right are the NDWI spectral index, the initial extraction, and the boundary optimization result: (a) region a, (b) region b, (c) region c.
For each lake, one classification result from around November 2023 was selected. The accuracy was validated using the method described in Section 3.3.3. Based on lake dimensions, 800 to 2,000 validation sample points were randomly generated within the bounding rectangle of the ROI for each study area. The “water” and “non-water” labels for these points were assigned through visual interpretation of near-simultaneous Sentinel-2 (10 m spatial resolution) and GF-1 PMS (2 m spatial resolution) imagery. Accuracy metrics were then computed by applying the classification validation methodology described in Section 3.3.3 to the labeled validation dataset. Depending on the size of the lake, 800 to 2,000 sample points were chosen.
The extraction accuracy is presented in Table 1. The results show that for all lakes, the PA is above 96.33%, the UA is above 99.48%, the OA is above 97.67%, and the Kappa is above 95.24%. The accuracy metrics obtained in this study are higher than other similar articles (Buma et al., 2018; Lu and Sun, 2023; Ssekyanzi et al., 2021) and most public datasets (Feng et al., 2016; Yu et al., 2013). These results indicate that the proposed water extraction method performs well and can provide reliable data support for subsequent analyses. The proposed method for water extraction demonstrates excellent performance, as evidenced by the high accuracy metrics. This method is capable of providing reliable data for further analysis and applications.
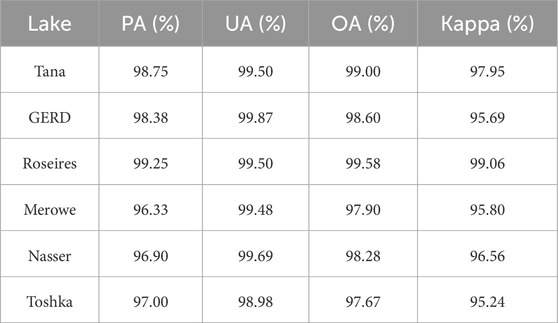
Table 1. Extraction accuracy of different lake water bodies.
4.2 Dynamic analysis of natural and artificial water bodies
The lake images before and after each flood season of the Blue Nile are overlaid in Figure 6, showing the boundary of water body extraction. The lakes with noticeable area changes are presented in Figure 7. From Figure 7, it can be observed that the areas of GERD and Toshka increased significantly during the monitoring period. The boundaries of Merowe and the Roseires exhibited noticeable changes before and after each flood, and the area before and after the 2020 flooding has been selected for presentation in the figure. As mega-lakes, the Tana and Nassser boundaries have not changed significantly.
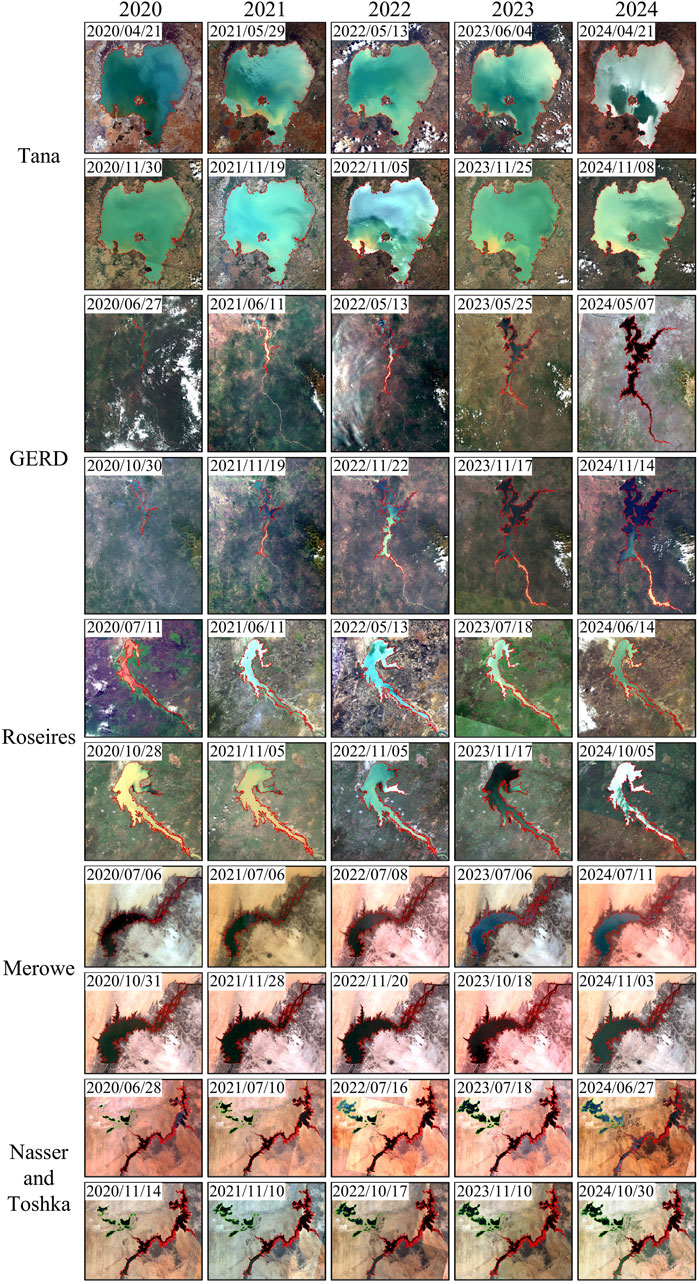
Figure 6. Lake change imagery: Annual satellite images from 2020 to 2024 depicting pre-flood (up) and post-flood (down) conditions.
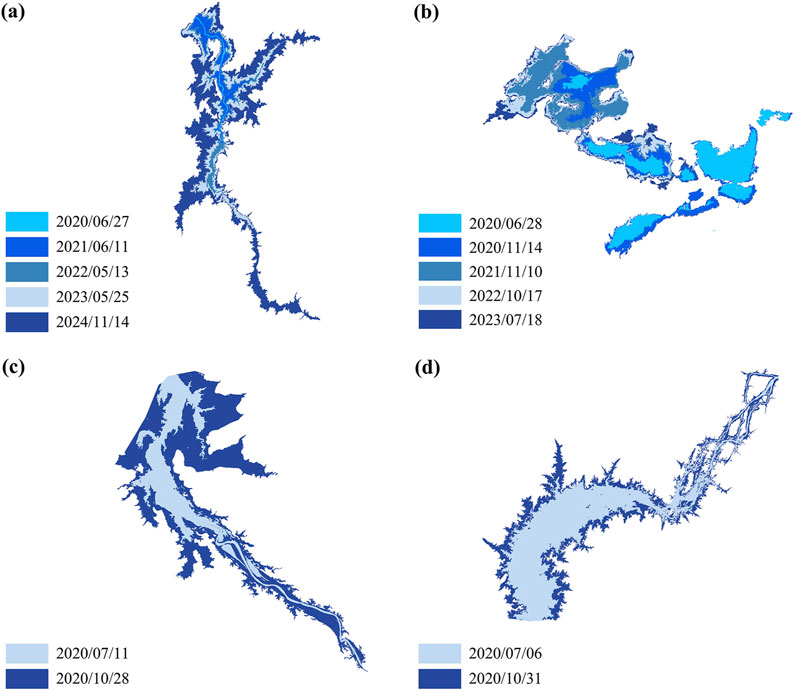
Figure 7. Significant changes in lake area: (a) GERD, (b) Toshka, (c) Roseires, (d) Merowe.
To better understand the variation patterns of each lake, the area of all lakes was statistically analyzed and plotted annually in Figure 8, and by date in a line chart in Figure 9.
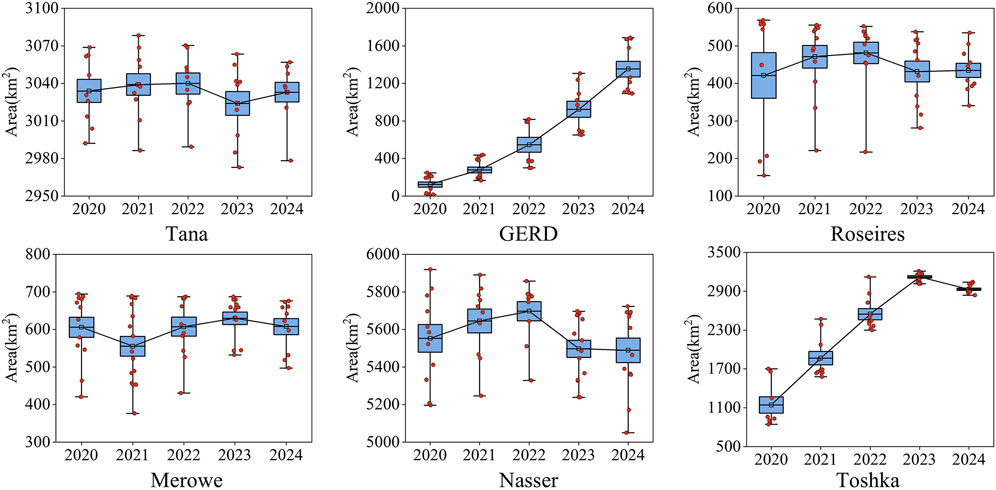
Figure 8. Yearly changes in lake area.
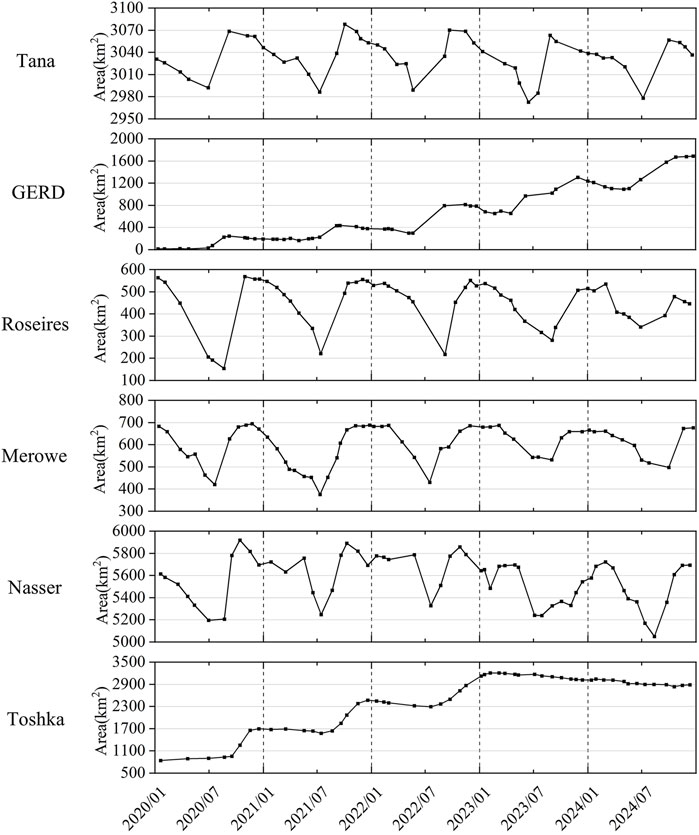
Figure 9. Time-series changes in lake area.
From the annual variation, the annual changes in the areas of Tana, Roseires, Merowe, and Nasser, remain relatively stable. The area of GERD and Toshka grows significantly. GERD has consistently expanded from 2020 to 2024, while Toshka expanded significantly from 2020 to 2023, with a slight decrease in area between 2023 and 2024.
From time-series variation, Tana, Roseires, Merowe, and Nasser exhibit similar seasonal variation patterns. Tana’s low-water-level period occurs around July, and the high-water-level period around September. The water area fluctuated within the range of 2,972.96–3,078.16 km2, with a change of less than 105.2 km2 over 5 years, which is less than 3.6% of the lake’s total area, indicating relatively stable area changes. Roseires, Merowe, and Nasser each experience a low-water-level period around July, with a high-water-level period beginning in October. The area of Roseires fluctuated between 154.63 and 568.33 km2, with the maximum area being 3.7 times larger than the minimum. The seasonal amplitude of area changes has gradually decreased. The area of Merowe fluctuated between 376.34 and 694.17 km2, showing a similar trend with a reduced amplitude of seasonal variation. For Nasser, the highest water level during the high-water-level period has been decreasing annually. In October 2020, the area was 5,919.05 km2, 5,889.89 km2 in October 2021, and 5,887.81 km2 in October 2022. However, in the wet season of 2023, the highest water level was not reached, with the area recorded at only 5,331.06 km2 in October. The high-water-level period appeared to have shifted to February of the following year, with an area of 5722.89 km2, lower than the area during the previous wet seasons.
GERD began impounding water in July 2020. A total of five stages of water storage were carried out from 2020–2024. The images in Figure 6 show that, over the 5 years, the river behind the dam gradually widened, and the reservoir area expanded. In just 5 years, the narrow river in 2020, almost close to zero, grew into a large reservoir by 2024, reaching a maximum area of 1,679.11 km2. On average, about 332.9 km2 of water were stored annually, with significant changes in area each year. From July to October, the lake area expanded rapidly, beginning in July and stopping in October, followed by a slight reduction until the next July, when expansion resumed. The water storage areas during the flood season for the 5 years were 247.15 km2, 270.28 km2, 516.51 km2, 650.13 km2, and 587.39 km2, respectively. The first 2 years had relatively low storage areas, both under 300 km2. Starting from the third year, the storage area increased significantly, and in 2023, the storage area exceeded 600 km2. The fifth year saw a slight reduction, with a storage area of less than 500 km2.
Toshka is a spillway lake in Egypt used to maintain the safe water level of Nasser. When the water level of Nasser exceeds 178 m, excess water is diverted into Toshka via spillways (Bastawesy et al., 2008). Due to climatic factors, Toshka nearly disappeared before 2019 due to the low flow of the Nile (Abd Ellah, 2021). Between 2020 and 2022, the area of Toshka showed a large correlation with the seasonal variation of Nasser. During the flood season, the rapid rise of water levels in Nasser resulted in excess water being diverted into Toshka, causing the area to expand rapidly at the beginning of the flood season. After the flood season ended, the area remained relatively constant until the next year’s flood season. From 2020 to 2022, Toshka’s area increased by 857.6 km2, 788.28 km2, and 677.25 km2, respectively. However, from 2023 to 2024, Toshka exhibited a different trend, with no rapid expansion during the flood season. Instead, its area decreased continuously, shrinking by 246.46 km2 over the 2 years.
4.3 Analysis of climate factors' impact
According to (Ahmed et al., 2024; Luna et al., 2024), the primary drivers of water resource variability in the Nile Basin (NB) include climate change and dam regulation during the GERD impoundment period, consequently, these two factors are exclusively considered in this analysis.
The climate data was plotted alongside the area change results, as shown in Figure 10, to analyze the climate’s effect on lake changes. In terms of precipitation, Tana, GERD, and Roseires receive abundant rainfall, with a clear seasonal variation in precipitation. In contrast, Merowe, Nasser, and Toshka experience very scarce precipitation. A comparison reveals that precipitation decreases as we move from the upstream Blue Nile to the downstream main Nile. As for LST, Tana’s temperature typically does not exceed 30°C, GERD fluctuates within 36.5°C, while the other four lakes reach maximum temperatures nearing 40°C. The average temperature increases from the upstream Blue Nile to the downstream main Nile. The higher the LST, the greater the evaporation from the lakes.
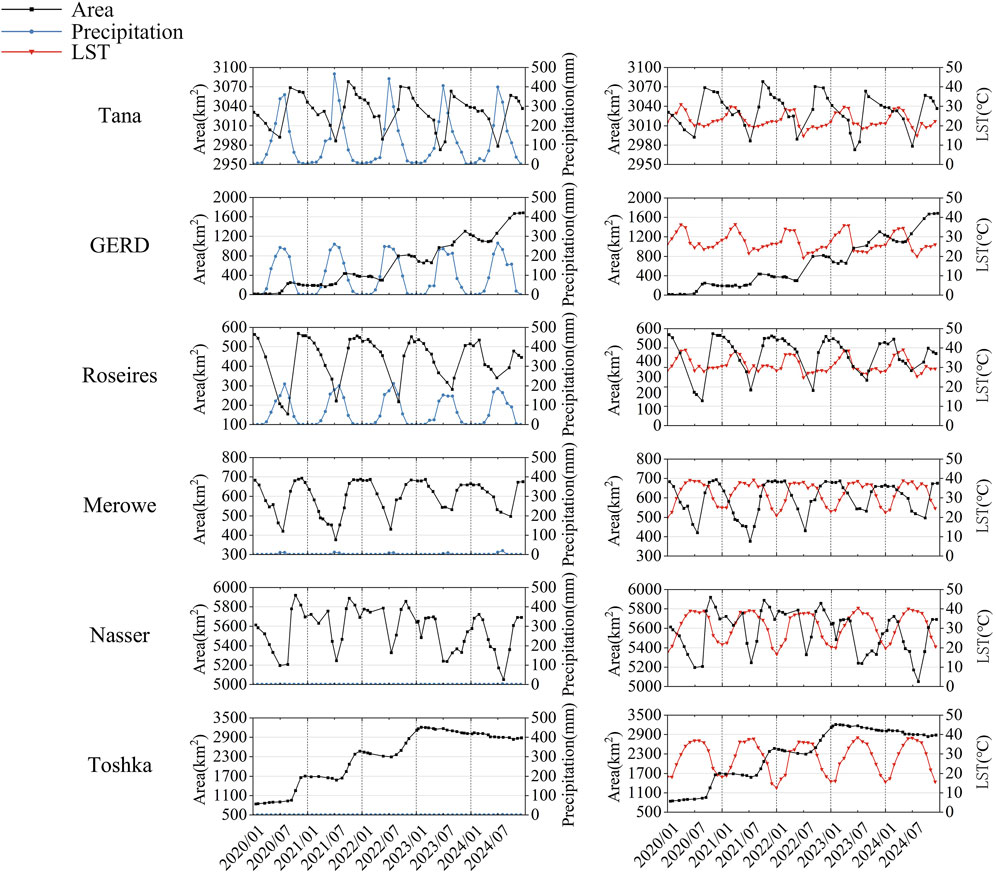
Figure 10. Changes in area, precipitation and LST: the left is the precipitation and lake area change map, and on the right is the LST and lake area change map.
Upstream areas receive more precipitation and have lower temperatures, with the lakes primarily influenced by precipitation. Downstream areas receive less precipitation but have higher temperatures, making temperature an important factor. During the months when Merowe and Nasser lakes’ areas are smallest (in July), temperatures also reach their yearly peaks, leading to maximum evaporation. For Toshka, during the area expansion period from 2020 to 2022, a shrinkage of the lake area was observed when temperatures were at their highest. There is a direct relationship between upstream precipitation and the high-water-level period of the Nile lakes, therefore, next, the effects of precipitation on the lakes are mainly analysed.
Tana, which receives the most precipitation, shows a delayed response to precipitation in terms of area change. The lake area does not increase immediately from the beginning of the rainy season to the time when rainfall peaks, but reaches an annual maximum in the subsequent period. For example, there is a significant increase in rainfall from March-July, but a significant increase in the size of the lake occurs in the subsequent months of July-September, followed by a successive decrease in its size from September-March as rainfall decreases for the dry season. The changes in the area of the GERD are also closely related to precipitation. The area begins to rapidly expand every year in July, when precipitation reaches its peak, and stops growing in October when rainfall decreases. The rainy season in the upper Blue Nile Basin, which typically begins in July, delivers substantial water inflow to the Blue Nile River, resulting in significant water storage within the GERD reservoir. As rainfall diminishes, GERD ceases active impoundment and may initiate gradual water releases. The figure demonstrates an inverse relationship between the surface area variation of Roseires and precipitation patterns. Because of the artificial regulation of water by GERD, the water-level dynamics of the Roseires are predominantly governed by GERD’s artificial regulation. During the rainy season, GERD prioritizes water retention, whereas post-rainy season releases modulate downstream flows to Roseires. As an artificially regulated reservoir, Roseires further exhibits its own operational cycle: its lake area sharply increases during initial flood season storage (July) and declines gradually post-flood (October) through managed releases. The downstream Merowe and Nasser lakes, being artificially regulated reservoirs with nearly negligible precipitation input, exhibit identical seasonal patterns to Roseires. These reservoirs undergo water storage during the upper basin’s rainy season when the Blue Nile experiences peak discharge. Their surface areas typically reach minima in July, followed by rapid expansion to maxima in October, then gradually decline until the next flood season approaches. Toshka, as the spillway lake for Nasser, also receives almost no rainfall throughout the year, with its water source coming from the high-water overflow of Nasser. Every July, the area of Toshka expands rapidly, coinciding with the upstream rainy season.
In conclusion, LST has little effect on lake area changes. Tana’s high precipitation provides sufficient water for storage, with area changes being a delayed response to precipitation in the sub-basin. The area expansion in GERD reservoir is influenced by both precipitation and its own storage cycle. Downstream, Roseires, Merowe, and Nasser reservoirs all store water at the beginning of the flood season, influenced by the upstream rainy season, causing the areas to expand. After the flood season ends, water is slowly released, resulting in a decrease in area. Toshka, on the other hand, is influenced by Nasser’s water levels, indirectly reflecting fluctuations in Nasser’s water height.
5 Conclusion
In this study, we analyzed the spatio-temporal dynamic changes of six typical lakes in the ENB, utilizing time series data from 2020 to 2024 derived from the GF-1 and GF-6 WFV data. The main conclusions are as follows:
(1) This study developed a robust adaptive threshold method considering boundary optimization that closely align with water bodies, based on Chinese GF optical imagery. This method is suitable for monitoring water bodies in arid regions. It efficiently and accurately extracted the six lakes in the study area, with OA of over 97.67% and Kappa exceeding 95.24%, demonstrating excellent extraction performance.
(2) By monitoring the lakes from 2020 to 2024, the seasonal variation patterns of the lakes were identified. The low-water-level period of Tana occurs in July, and the high-water-level period in September. For Roseires, Merowe, and Nasser, the low-water-level period also occurs in July, with the high-water period in October. However, Nasser did not reach its annual maximum water level in October 2023. During the monitoring period, the GERD significantly increased in size, expanding from a narrow river with an area close to zero in 2020 to a large reservoir reaching a maximum area of 1,679.11 km2 in 2024. The major growth occurred predominantly between July and October each year. Toshka saw significant expansion between 2020 and 2022, mainly from July to October, but experienced a continuous reduction in area during 2023 and 2024.
(3) The changes in lake area in the study area are mainly influenced by precipitation in the upper Blue Nile and the artificial water storage from dams. Tana, with abundant precipitation, shows area changes primarily driven by rainfall, with a certain lag effect. The changes in GERD are mainly linked to both precipitation and its own water storage, with significant increases in area during the rainy season, particularly between July and October. As artificial reservoirs, the seasonal changes in Roseires, Merowe, and Nasser are influenced by their own water storage and the storage in upstream reservoirs. The seasonal variation in these lakes is primarily related to the timing of their own water storage. The decreasing visibility of seasonal changes during the monitoring period could be associated with the large-scale water storage during GERD’s flood season and the slow release of water during the dry season. The failure of Nasser to reach its annual peak water level in October 2023 seems to be linked to the significant expansion of GERD during the 2023 flood season. In the case of Toshka, located to the west of Nasser, the significant area expansion observed annually from July to October between 2020 and 2022 was likely due to overflow from Nasser’s high-water period. However, during 2023–2024, Toshka did not experience the same expansion during the flood season and instead saw a continuous reduction in area, possibly due to the large-scale water storage in the GERD, which prevented Nasser from reaching its high-water level of previous years.
The advantage of the Chinese GF-1/6 WFV imagery lies in its wide coverage, high temporal frequency, and spatial resolution, which can meet the monitoring needs of large-scale study areas with relatively fewer images. This is conducive to the routine monitoring and dynamic analysis of water bodies. The observed lake changes are consistent with actual conditions, fully demonstrating the feasibility of extracting water body information from Chinese GF data. It has significant advantages and promising application prospects.
The boundary optimization method employed in this study has improved the accuracy of lake boundary extraction. However, this approach relies on the assumption of homogeneous intensity distributions in both interior and exterior image regions through the SPF function, making it sensitive to image quality and initial water extraction contours, while demonstrating inconsistent computational efficiency. Future research will focus on refining the construction framework of the SPF function and exploring adaptive parameter determination strategies to enhance model robustness and computational efficiency. Moreover, this investigation was limited to monitoring six representative lakes in the ENB. Leveraging the wide-swath advantage of WFV imagery, we plan to progressively expand the monitoring scope to encompass all lake water bodies across the entire ENB and ultimately NB regions. This systematic remote sensing monitoring and analysis of large lake clusters in NB aims to provide comprehensive spatiotemporal data support for regional water resource management and ecological conservation.
In the future, we look forward to fully leveraging the advantages of Chinese remote sensing satellites in terms of high spatial and temporal resolution for water resource monitoring. This will support major strategic and engineering services in cross-basin water resource monitoring. By integrating data from multiple types of remote sensing satellites, we aim to achieve continuous acquisition and comprehensive application of multi-source remote sensing information. Additionally, we seek to build an automated and intelligent production system for high-resolution, large-scale, and long-time series water resource monitoring based on a spatiotemporal big data cloud platform, and we hope to expand the application of Chinese satellite imagery to more scenarios.
Data availability statement
The raw data supporting the conclusions of this article will be made available by the authors, without undue reservation.
Author contributions
XN: Data curation, Investigation, Software, Writing – original draft, Writing – review and editing, Validation, Visualization. JX: Conceptualization, Formal Analysis, Project administration, Resources, Supervision, Writing – review and editing. YG: Conceptualization, Funding acquisition, Methodology, Project administration, Writing – review and editing. WZ: Conceptualization, Supervision, Visualization, Writing – review and editing.
Funding
The author(s) declare that financial support was received for the research and/or publication of this article. This research was funded by Joint Research, Development and Application Demonstration of Remote Sensing Monitoring Technology for Typical Natural Resources Features (Grant No. 2023YFE0207900).
Conflict of interest
The authors declare that the research was conducted in the absence of any commercial or financial relationships that could be construed as a potential conflict of interest.
Generative AI statement
The authors declare that no Generative AI was used in the creation of this manuscript.
Publisher’s note
All claims expressed in this article are solely those of the authors and do not necessarily represent those of their affiliated organizations, or those of the publisher, the editors and the reviewers. Any product that may be evaluated in this article, or claim that may be made by its manufacturer, is not guaranteed or endorsed by the publisher.
References
Abd Ellah, R. G. (2021). Morphometric analysis of Toshka Lakes in Egypt: a succinct review of geographic information systems and remote sensing based techniques. Egypt. J. Aquat. Res. 47 (2), 215–221. doi:10.1016/j.ejar.2021.05.005
Abtew, W. (2025). “The Grand Ethiopian renaissance dam (GERD) filling and operation,” in Nile water conflict and the Grand Ethiopian Renaissance dam (Cham: Springer Nature Switzerland), 99–117.
Ahmed, M., Abdelrehim, R., Elshalkany, M., and Abdrabou, M. (2024). Impacts of the Grand Ethiopian renaissance dam on the Nile River's downstream reservoirs. J. Hydrol. 633, 130952. doi:10.1016/j.jhydrol.2024.130952
Arsano, Y., and Tamrat, I. (2005). Ethiopia and the eastern Nile Basin. Aquat. Sci. 67 (1), 15–27. doi:10.1007/s00027-004-0766-x
Basheer, M. (2021). Cooperative operation of the Grand Ethiopian renaissance dam reduces nile riverine floods. River Res. Appl. 37 (6), 805–814. doi:10.1002/rra.3799
Bastawesy, M. A., Khalaf, F. I., and Arafat, S. M. (2008). The use of remote sensing and GIS for the estimation of water loss from Tushka lakes, southwestern desert, Egypt. J. Afr. Earth Sci. 52 (3), 73–80. doi:10.1016/j.jafrearsci.2008.03.006
Buma, W. G., Lee, S.-I., and Seo, J. Y. (2018). Recent surface water extent of lake Chad from multispectral sensors and GRACE. Sensors 18 (7), 2082. doi:10.3390/s18072082
Caselles, V., Kimmel, R., and Sapiro, G. (1997). Geodesic active contours. Int. J. Comput. Vis., 2261–2279. doi:10.1023/A:1007979827043
Chan, T. F., and Vese, L. A. (2001). Active contours without edges. Ieee Trans. Image Process. 10 (2), 266–277. doi:10.1109/83.902291
Chang, B. R., Li, R. D., Zhu, C. D., and Liu, K. Q. (2015). Quantitative impacts of climate change and human activities on water-surface area variations from the 1990s to 2013 in Honghu lake, China. Water 7 (6), 2881–2899. doi:10.3390/w7062881
Chen, D., Sun, W., Shi, J., Johnson, B. A., Tan, M. L., Pan, Q., et al. (2024). Utilizing GaoFen-2 derived urban green space information to predict local surface temperature. Urban For. Urban Green. 99, 128463. doi:10.1016/j.ufug.2024.128463
Chen, L., Letu, H., Fan, M., Shang, H., Tao, J., Wu, L., et al. (2022). An introduction to the Chinese high-resolution Earth observation system: Gaofen-1∼ 7 civilian satellites. J. Remote Sens. 2022. doi:10.34133/2022/9769536
Chen, Y., Fan, R., Yang, X., Wang, J., and Latif, A. (2018). Extraction of urban water bodies from high-resolution remote-sensing imagery using deep learning. Water 10 (5), 585. doi:10.3390/w10050585
Cohen, J. (1960). A coefficient of agreement for nominal scales. Educ. Psychol. Meas. 20 (1), 37–46. doi:10.1177/001316446002000104
Diop, S., Scheren, P., and Niang, A. (2021). Climate change and water resources in Africa. Springer.
Dong, Z., Wang, G., Amankwah, S. O. Y., Wei, X., Hu, Y., and Feng, A. (2021). Monitoring the summer flooding in the Poyang Lake area of China in 2020 based on Sentinel-1 data and multiple convolutional neural networks. Int. J. Appl. Earth Obs. Geoinformation 102, 102102400. doi:10.1016/j.jag.2021.102400
Duan, Z., and Bastiaanssen, W. (2013). Estimating water volume variations in lakes and reservoirs from four operational satellite altimetry databases and satellite imagery data. Remote Sens. Environ. 134, 134403–134416. doi:10.1016/j.rse.2013.03.010
Eldeeb, H. M., Ibrahim, A., Mowafy, M. H., Zeleňáková, M., Abd-Elhamid, H. F., Pietrucha-Urbanik, K., et al. (2023). Assessment of dams’ failure and flood wave hazards on the downstream countries: a case study of the Grand Ethiopian Renaissance Dam (GERD). Water 15 (8), 1609. doi:10.3390/w15081609
Entz, B. (1978). Sedimentation processes above the aswan high dam in Lake Nasser-Nubia (Egypt—Sudan) with 6 figures and 1 photo in the text. Int. Ver. für Theor. Angew. Limnol. Ver. 20 (3), 1667–1671. doi:10.1080/03680770.1977.11896750
Feng, M., Sexton, J. O., Channan, S., and Townshend, J. R. (2016). A global, high-resolution (30-m) inland water body dataset for 2,000: first results of a topographic-spectral classification algorithm. Int. J. Digital Earth 9 (2), 113–133. doi:10.1080/17538947.2015.1026420
Fielding, L., Najman, Y., Millar, I., Butterworth, P., Ando, S., Padoan, M., et al. (2017). A detrital record of the Nile River and its catchment. J. Geol. Soc. 174 (2), 301–317. doi:10.1144/jgs2016-075
Funk, C., Peterson, P., Landsfeld, M., Pedreros, D., Verdin, J., Shukla, S., et al. (2015). The climate hazards infrared precipitation with stations—a new environmental record for monitoring extremes. Sci. Data 2 (1), 150066. doi:10.1038/sdata.2015.66
Gautam, S., and Singhai, J. (2024). Critical review on deep learning methodologies employed for water-body segmentation through remote sensing images. Multimedia Tools Appl. 83 (1), 1869–1889. doi:10.1007/s11042-023-15764-5
Ge, C. J., Xie, W. J., and Meng, L. K. (2022). Extracting lakes and reservoirs from GF-1 satellite imagery over China using improved U-net. Ieee Geoscience Remote Sens. Lett. 19, 1–5. doi:10.1109/lgrs.2022.3155653
Gebeltová, Z., Hálová, P., Malec, K., Bartoňová, K., Blažek, V., Maitah, M., et al. (2023). Geopolitical risks for Egypt wheat supply and trade. Front. Sustain. Food Syst. 7, 1137526. doi:10.3389/fsufs.2023.1137526
Goher, M. E., Napiórkowska-Krzebietke, A., Aly, W., El-Sayed, S. M., Tahoun, U. M., Fetouh, M. A., et al. (2021). Comprehensive insight into Lake Nasser environment: water quality and biotic communities—a case study before operating the renaissance dam. Water 13 (16), 2195. doi:10.3390/w13162195
Guo, H., He, G., Jiang, W., Yin, R., Yan, L., and Leng, W. (2020). A multi-scale water extraction convolutional neural network (MWEN) method for GaoFen-1 remote sensing images. ISPRS Int. J. Geo- Inf. 9 (4), 189. doi:10.3390/ijgi9040189
Haibo, Y., Zongmin, W., Hongling, Z., and Yu, G. (2011). Water body extraction methods study based on RS and GIS. Procedia Environ. Sci. 10, 102619–102624. doi:10.1016/j.proenv.2011.09.407
Hassan, M. A., Hassan, M. F., Mohamed, Y. A., and Awad, W. A. (2023). Dam operation using satellite data and hydrological models: the case of Roseires dam and Grand Ethiopian Renaissance Dam in the Blue Nile River. Water Int. 48 (8), 975–999. doi:10.1080/02508060.2023.2286412
Kansara, P., and Lakshmi, V. (2022). Water levels in the major reservoirs of the Nile River Basin—a comparison of Sentinel with satellite altimetry data. Remote Sens. 14 (18), 4667. doi:10.3390/rs14184667
Kansara, P., Li, W., El-Askary, H., Lakshmi, V., Piechota, T., Struppa, D., et al. (2021). An assessment of the filling process of the Grand Ethiopian Renaissance Dam and its impact on the downstream countries. Remote Sens. 13 (4), 711. doi:10.3390/rs13040711
Kebede, S., Travi, Y., Alemayehu, T., and Ayenew, T. (2005). Groundwater recharge, circulation and geochemical evolution in the source region of the Blue Nile River, Ethiopia. Appl. Geochem. 20 (9), 1658–1676. doi:10.1016/j.apgeochem.2005.04.016
Kebede, S., Travi, Y., Alemayehu, T., and Marc, V. (2006). Water balance of Lake Tana and its sensitivity to fluctuations in rainfall, Blue Nile basin, Ethiopia. J. Hydrol. 316 (1-4), 233–247. doi:10.1016/j.jhydrol.2005.05.011
Lan, L., Wang, Y-G., Chen, H-S., Gao, X-R., Wang, X-K., and Yan, X-F. (2024). Improving on mapping long-term surface water with a novel framework based on the Landsat imagery series. J. Environ. Manag. 353, 120202. doi:10.1016/j.jenvman.2024.120202
Lehner, B., and Grill, G. (2013). Global river hydrography and network routing: baseline data and new approaches to study the world's large river systems. Hydrol. Process. 27 (15), 2171–2186. doi:10.1002/hyp.9740
Li, M. Y., Hong, L., Guo, J. T., and Zhu, A. X. (2022). Automated extraction of lake water bodies in complex geographical environments by fusing sentinel-1/2 data. Water 14 (1), 30. doi:10.3390/w14010030
Lu, L. C., and Sun, H. L. (2023). Dynamic monitoring of surface water areas of nine plateau lakes in Yunnan Province using long time-series Landsat imagery based on the Google Earth Engine platform. Geocarto Int. 38 (1). doi:10.1080/10106049.2023.2253196
Luna, L., Awange, J., Song, Y. Z., Bui, L. K., Zerihun, A., and Kuhn, M. (2024). Surface water and geomorphological changes of the Blue Nile dynamics associated with the Grand Ethiopian Renaissance Dam (GERD): a multi-temporal analysis. Giscience Remote Sens. 61 (1). doi:10.1080/15481603.2024.2346383
Luo, G., Jiang, W., Liu, L., Wen, Q., Liu, S., and Sun, W. (2024). Urban lakes change extraction using time series GaoFen-1 satellite imagery. Int. Arch. Photogramm., Remote Sens. Spatial Inf. Sci., 48463–48468. doi:10.5194/isprs-archives-xlviii-1-2024-463-2024
McFeeters, S. K. (1996). The use of the Normalized Difference Water Index (NDWI) in the delineation of open water features. Int. J. Remote Sens. 17 (7), 1425–1432. doi:10.1080/01431169608948714
Mengistu, D., Bewket, W., Dosio, A., and Panitz, H.-J. (2021). Climate change impacts on water resources in the upper blue nile (Abay) river basin, ethiopia. J. Hydrol. 592, 125614. doi:10.1016/j.jhydrol.2020.125614
Moser, L., Voigt, S., Schoepfer, E., and Palmer, S. (2014). Multitemporal wetland monitoring in Sub-Saharan West-Africa using medium resolution optical satellite data. IEEE J. Sel. Top. Appl. Earth Obs. Remote Sens. 7 (8), 3402–3415. doi:10.1109/jstars.2014.2336875
Naeem, M., Zhang, Y. Q., Nourani, V., Tian, X. Q., and Miao, P. (2025). Both climate and anthropogenic impacts on recent lake area change in the Erdos Plateau. J. Environ. Manag. 373, 123443. doi:10.1016/j.jenvman.2024.123443
Nagaraj, R., and Kumar, L. S. (2022). Multi scale feature extraction network with machine learning algorithms for water body extraction from remote sensing images. Int. J. Remote Sens. 43 (17), 6349–6387. doi:10.1080/01431161.2022.2136505
Nilsson, C., and Grelsson, G. (1995). The fragility of ecosystems: a review. J. Appl. Ecol. 32, 677–692. doi:10.2307/2404808
Ogilvie, A., Belaud, G., Massuel, S., Mulligan, M., Le Goulven, P., and Calvez, R. (2018). Surface water monitoring in small water bodies: potential and limits of multi-sensor Landsat time series. Hydrol. Earth Syst. Sci. 22 (8), 4349–4380. doi:10.5194/hess-22-4349-2018
Peter, H. G. (1993). Water and conflict: fresh water resources and international security. Int. Secur. 18 (1), 79–112. doi:10.2307/2539033
Pontius, R. G., and Millones, M. (2011). Death to Kappa: birth of quantity disagreement and allocation disagreement for accuracy assessment. Int. J. Remote Sens. 32 (15), 4407–4429. doi:10.1080/01431161.2011.552923
Shimoda, H. (2004). “JAXA future Earth observation programs,” in Conference on Sensors, Systems, and Next-Generation Satellites VIII, Maspalomas, Spain, September 13-15, 2004, 1–9.
Song, C., Jiang, X., Fan, C., and Li, L. (2022). High-resolution circa-2020 map of urban lakes in China. Sci. Data 9 (1), 747. doi:10.1038/s41597-022-01874-6
Ssekyanzi, A., Nevejan, N., Van der Zande, D., Brown, M. E., and Van Stappen, G. (2021). Identification of potential surface water resources for inland aquaculture from sentinel-2 images of the rwenzori region of Uganda. Water 13 (19), 2657. doi:10.3390/w13192657
Stehman, S. V. (2006). Design, analysis, and inference for studies comparing thematic accuracy of classified remotely sensed data: a special case of map comparison. J. Geogr. Syst. 8 (2), 209–226. doi:10.1007/s10109-006-0022-0
Tan, C., Guo, B., Kuang, H., Yang, H., and Ma, M. (2018). Lake area changes and their influence on factors in arid and semi-arid regions along the silk road. Remote Sens. 10 (4), 595. doi:10.3390/rs10040595
Tan, K., Sun, M., Sun, D., Liu, X., Liu, X., Wang, B., et al. (2024). Mapping of nearshore bathymetry using gaofen-6 images for the Yellow River Delta-Laizhou Bay, China. Ecol. Inf. 80, 80102497. doi:10.1016/j.ecoinf.2024.102497
Wu, G., Chen, C., Liu, Y., Fan, X., Niu, H., and Liu, Y. (2023). Developing a high-resolution seamless surface water extent time-series over Lake Victoria by integrating MODIS and Landsat data. Remote Sens. 15 (14), 3500. doi:10.3390/rs15143500
Xia, T., He, Z., Cai, Z., Wang, C., Wang, W., Wang, J., et al. (2022). Exploring the potential of Chinese GF-6 images for crop mapping in regions with complex agricultural landscapes. Int. J. Appl. Earth Obs. Geoinformation 107, 107102702. doi:10.1016/j.jag.2022.102702
Xu, B., Wei, H., Cai, Z., Yang, J., Zhang, Z., Wang, C., et al. (2023). Exploring the potential of Gaofen-1/6 for crop monitoring: generating daily decametric-resolution leaf area index time series. IEEE Trans. Geoscience Remote Sens. 61, 611–614. doi:10.1109/tgrs.2023.3257290
Xu, X., Jiang, B., Tan, Y., Costanza, R., and Yang, G. (2018). Lake-wetland ecosystem services modeling and valuation: progress, gaps and future directions. Ecosyst. Serv. 33, 3319–3328. doi:10.1016/j.ecoser.2018.08.001
Yao, R., Shao, W., Jiang, X., and Yu, T. (2022). Wind speed retrieval from Chinese Gaofen-3 synthetic aperture radar using an analytical approach in the nearshore waters of China’s seas. Int. J. Remote Sens. 43 (8), 3028–3048. doi:10.1080/01431161.2022.2079019
Yu, L., Wang, J., and Gong, P. (2013). Improving 30m global land-cover map FROM-GLC with time series MODIS and auxiliary data sets: a segmentation-based approach. Int. J. Remote Sens. 34 (16), 5851–5867. doi:10.1080/01431161.2013.798055
Zhang, G., Zheng, G., Gao, Y., Xiang, Y., Lei, Y., and Li, J. (2017). Automated water classification in the Tibetan plateau using Chinese GF-1 WFV data. Photogramm. Eng. Remote Sens. 83 (7), 509–519. doi:10.14358/pers.83.7.509
Zhang, K., Zhang, L., Song, H., and Zhou, W. (2010). Active contours with selective local or global segmentation: a new formulation and level set method. Image Vis. Comput. 28 (4), 668–676. doi:10.1016/j.imavis.2009.10.009
Zhang, X., Cheng, B., Chen, J., and Liang, C. (2021). High-resolution boundary refined convolutional neural network for automatic agricultural greenhouses extraction from GaoFen-2 satellite imageries. Remote Sens. 13 (21), 4237. doi:10.3390/rs13214237
Zhang, Y., Zhao, C., Chen, H., Feng, X., Lu, Z., and Khan, B. A. (2024). Detection and monitoring of mining-induced subsidence with Gaofen-3 and Sentinel-1A SAR datasets. Remote Sens. Lett. 15 (5), 537–547. doi:10.1080/2150704x.2024.2346182
Keywords: GF-1, GF-6, arid region, East Nile Basin, lake area, dynamic monitoring
Citation: Nie X, Xu J, Ge Y and Zhou W (2025) High spatio-temporal resolution dynamic water monitoring using multi-source Chinese Gaofen imagery: a case study in the Eastern Nile Basin. Front. Earth Sci. 13:1569178. doi: 10.3389/feart.2025.1569178
Received: 31 January 2025; Accepted: 23 April 2025;
Published: 02 May 2025.
Edited by:
Qian Sun, RMIT University, AustraliaCopyright © 2025 Nie, Xu, Ge and Zhou. This is an open-access article distributed under the terms of the Creative Commons Attribution License (CC BY). The use, distribution or reproduction in other forums is permitted, provided the original author(s) and the copyright owner(s) are credited and that the original publication in this journal is cited, in accordance with accepted academic practice. No use, distribution or reproduction is permitted which does not comply with these terms.
*Correspondence: Jia Xu, aGh1eGpAaGh1LmVkdS5jbg==