 Chuyuan Guo1,2,3
 Guoyi Hu2*
 Jin Li2Xingwang Tian4
 Lianjie Tian2
 Jinhao Guo2Huiying Cui2Zhen Liu1,2,3Xianqing Li1,3*
- 1State Key Laboratory for Fine Exploration and Intelligent Development of Coal Resources, China University of Mining and Technology−Beijing, Beijing, China
- 2PetroChina Research Institute of Petroleum Exploration and Development, Beijing, China
- 3College of Geoscience and Surveying Engineering, China University of Mining and Technology−Beijing, Beijing, China
- 4Research Institute of Exploration and Development, PetroChina Southwest Oil & Gas field Company, Chengdu, China
The Triassic marine gas reservoir in the Moxi Gas Field is one of the large gas fields initially discovered in the Sichuan Basin. However, the origin of its natural gas has long been debated. To study the genetic types and origin of natural gas, the light hydrocarbons (LHs) composition, carbon isotopes, chemical compositions, and stable carbon and hydrogen isotopic compositions were analyzed in the Triassic strata of Moxi gas field in the Sichuan Basin. The natural gases from the second member of the Jialingjiang Formation (T2j2) and the first member of the Leikoupo Formation (T2l1) have dryness coefficients higher than 0.997 and contain low content non−alkane gases such as CO2 and N2. The δ13C1 values of natural gas in the Moxi (MX) gas field range from −35.3‰ to −32.9‰, the δ13C2 values range from −34.0‰ to −30.3‰, and the δD1 values range from −144‰ to −120‰. As for light hydrocarbons composition, the C7 LHs are dominated by the methylcyclohexane (MCH), and the C6−C7 LHs have low normal alkane contents. The individual carbon isotopes of light hydrocarbons have the characteristics of δ13C > −28‰. The origin identification indicates that the natural gas in this area is oil−type gas that results from the secondary cracking of crude oil. Our results show that the natural gas in T2j2 of the MX gas field is sourced from the shale gas of the Є1q, the T2l1 gas is a mixed−source gas from different thermal evolution stages of the Є1q source rocks, shale gas and oil−cracking gas. The mixing effect is the main reason for the reversed phenomenon (δ13C1 > δ13C2).
Highlights
1. The T2l1 gas is a mixed−source gas from the shale gas and oil−cracking gas of the Є1q Fm.
2. The mixing effect gives T2l1 gas δ13C1 > δ13C2.
3. The dominance of MCH relative to C7 LHs, δ13CCH > −24‰ and δ13CMCP < δ13CCH distinguish shale gas from oil−cracking gas.
1 Introduction
The MX gas field is located in the southern part of the central Sichuan low−flat tectonic area. The gas−bearing structure is at the top of the eastern segment of the Leshan−Longnyusi Caledonian Paleo−uplift. From bottom to top, there are three pay zones, namely, the gas reservoir in the T2j2 and T2l1of the marine strata, and the gas reservoir in the Xujiahe Formation (T2x) of the continental strata. This gas field spatially overlays the Anyue gas field, a super−large gas field in the Sinian−Cambrian System in central Sichuan. The gas−bearing range of the MX gas field is smaller than that of the Anyue Gas Field. The Leshan−Longnyusi Paleo−uplift developed in the Gaoshiti−Moxi area is the dominant direction for the long−term accumulation of oil and gas migration.
The MX gas field is a large scale gas field discovered relatively early in the Sichuan Basin. The T2l1 gas reservoir was proven in 1988, and it took 26 years for the T2j2 gas reservoir to be proven (Wang et al., 1998). However, the gas source has been less discussed and exists significant dispute over the source of the gas. Some scholars believe that the gas in T2l1 sourced from the coal measures of the Longtan Formation (P2l) (Wang et al., 1998; Li et al., 2006), and the gas in T2j2 is contributed by the Permian carbonate source rocks (Li et al., 2006). However, the burial depth of the Triassic gas reservoir is only more than 2,600 m. The inclusion detection show that the temperature of the fluids trapped in the reservoir is 111–165°C, which has just reached the stage of oil−cracking gas generation, corresponding to the condensate oil and gas generation (Jin et al., 2019). But the gas dryness coefficient is extremely high, with δ13C1 being heavy while δ13C2 is light, which is obviously inconsistent with the thermal evolution history of the Permian−Triassic source rocks such as the P2l and the third member of Leikoupo Formation (T2l3) in the central region Sichuan Basin (CRSB) (Yu, 2022). In prior research regarding the gas−source identification in the CRSB, the emphasis has been placed on the utilization of natural gas compositions, carbon and hydrogen isotopes of gas components, and biomarker indexes of reservoir bitumen. Nevertheless, the indicator parameters of the LHs associated with natural gas are yet to be researched.
Although the content of LHs compounds associated with natural gas is low, their geochemical characteristics play an important role in determining the genetic types of natural gas, gas−source correlation, and secondary transformation (Thompson, 1983; Hu et al., 2010). This paper provides data on the LHs components and its individual carbon isotopes. Combining with the data of natural gas components and the carbon and hydrogen isotopes of each component, a systematic analysis of the natural gas characteristics of T2l1 and T2j2 in the Triassic System of the MX gas field was carried out. The origin of natural gas in the marine carbonate rock strata of the MX gas field in the CRSB were discussed, providing a basis for the subsequent exploration of the marine natural gas-rich area in the MX region.
2 Geological setting
The Sichuan Basin is located on the northwestern margin of the Yangtze Platform. It is a superimposed basin that has experienced multiple tectonic movements. The multiple tectonic−sedimentary cycles are related to the opening and closing evolution of the Tethys Ocean. The differentiation period of the marine craton can be divided into three stages, the Sinian−Silurian is the development period of the marine craton fault−depression basin (Ma et al., 2018), the Carboniferous−Middle Triassic is the period of the marine craton depression basin, and the Late Triassic−Cenozoic is the foreland basin period. During the multi−stage tectonic evolution, multiple marine strata have developed, including multiple source rock strata. From the oldest to the youngest, the strata are the Lower Sinian Doushantuo Formation (Z1ds), the Lower Cambrian Qiongzhusi Formation (Є1q), the Upper Ordovician Wufeng Formation−Lower Silurian Longmaxi Formation (O1w−S1l), the Middle Permian Qixia Formation−Maokou Formation (P2q−P2m), the Upper Permian Longtan Formation (Wujiaping Formation) and Dalong Formation (P3l−P3d) (Figure 1). The vertical distribution of conventional marine carbonate gas reservoirs is mainly controlled by the source rock strata, forming multiple composite petroleum systems.
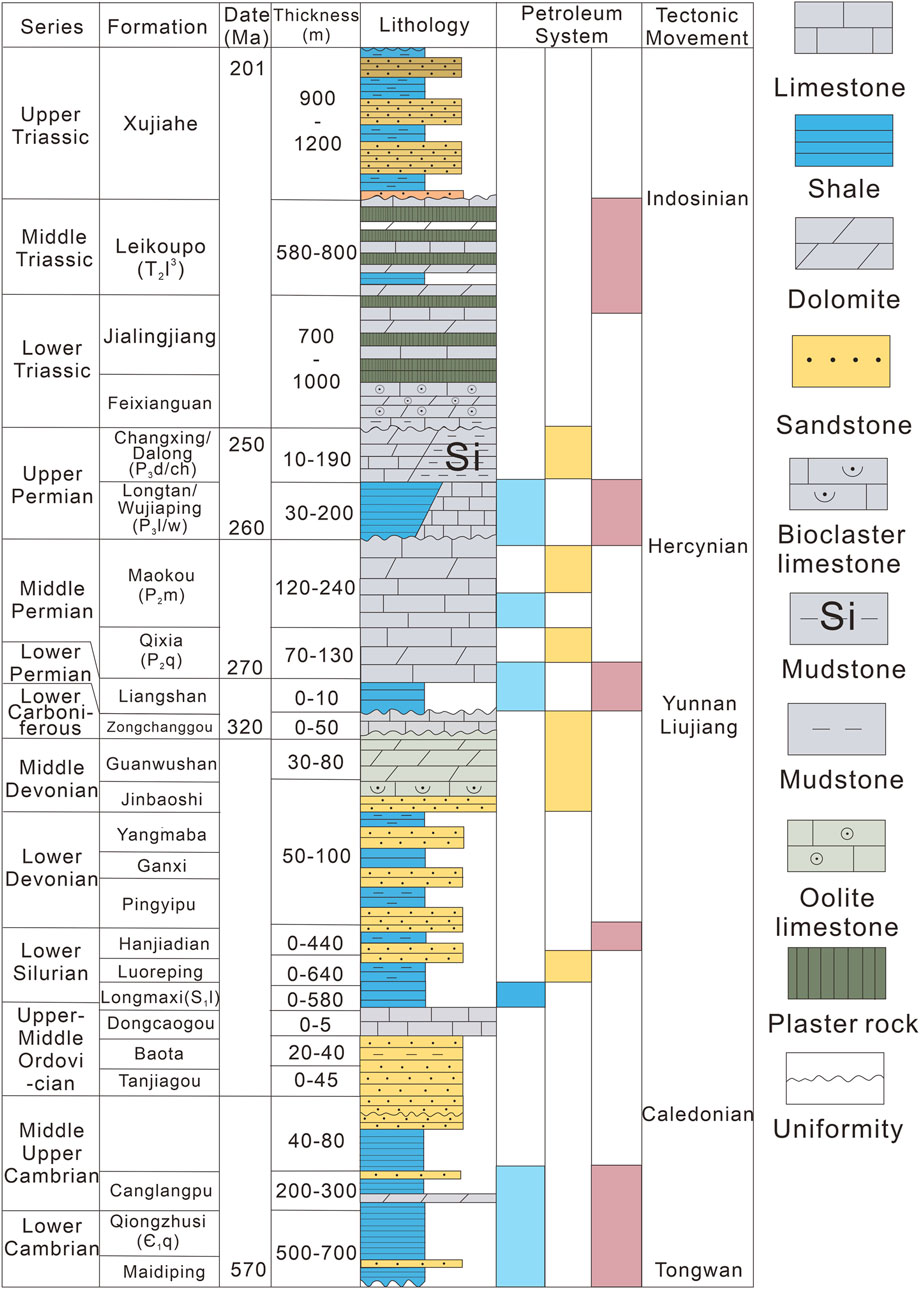
Figure 1. Strata column graph of Sichuan Basin and main source rocks are marked in abbreviation [modified from Li et al. (2022); Xie et al. (2020)].
At the same time, during the multi−stage tectonic evolution, the tectonic characteristics vary in different blocks of the basin. According to their characteristics and the distribution of oil and gas, six tectonic units can be divided: the high−steep tectonic area in eastern Sichuan, the gentle tectonic area in central Sichuan, the low−steep tectonic area in southern and southwestern Sichuan, the western Sichuan sag tectonic area, and the low−flat tectonic area in northern Sichuan (Jiao et al., 2022). However, in the entire Sichuan Basin, the Ordovician to Carboniferous strata are not well−developed. An approximately east−swest−trending extensional fault−depression basin developed, with a cumulative sediment thickness of less than 200 m. In most areas, the Lower Cambrian and Upper Permian sediments are in direct contact. The Silurian is only distributed in the eastern Sichuan area and gradually pinches out in the CRSB (Figure 2B), with only remnants on the edge of the study area. The Dalong Formation (P3d) is distributed in the Kaijiang−Liangping trough in the northeastern Sichuan area and contributes little to the CRSB. The thickness of the Sinian Doushantuo Formation (Z1ds) is 10−30 m, and the thickest part is developed in the area of Quang An−Nanchong−Suining. The P2q−P2m source rocks are carbonate rocks with low TOC contents, belonging to secondary source rocks. The Gufeng member of the Maokou Formation has an extremely high TOC (0.5%–31.04%, average = 5.08%, Fu et al., 2021), but it is distributed in the northern part of the basin. Therefore, in the CRSB, the Є1q, P3l, and T2l3 are the three sets of source rocks that mainly contribute to the natural gas in the Triassic marine strata.
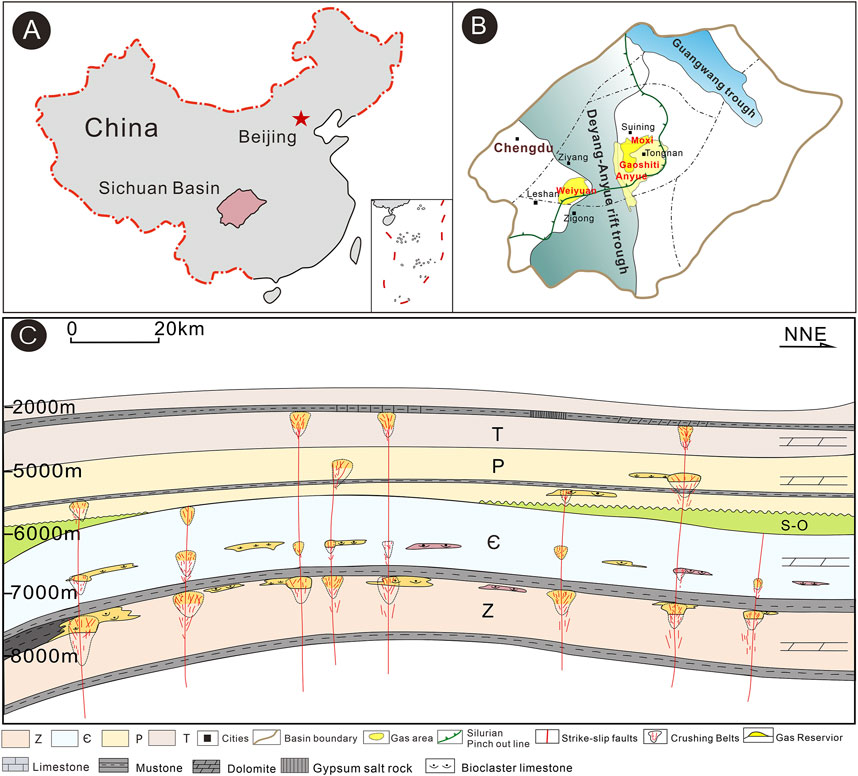
Figure 2. (A) Location of the Sichuan Basin in China. (B) Location of MX gas field in the Sichuan Basin study area [modified from Guo et al. (2024); Xie et al. (2021)]. (C) Diagram of the strike−slip fault−controlled natural gas accumulation system in the central Sichuan [modified from Jiao et al. (2022)].
The gentle tectonic area in CRSB ranges from Yanting in the north to Neijiang−Leshan in the south. The MX Structure, at the high−position of the eastern segment of the Leshan−Longnyusi Paleo−uplift, is the prime target for hydrocarbon accumulation. In the Late Sinian, the paleo−uplift began to take shape, while the Cambrian−Ordovician strata were not well− developed. By the late Caledonian at the end of the Silurian, after regional uplift and subsidence, it was finally formed. During the Indosinian−Himalayan movement, the rapid rise of the Longmen Mountains and the subsequent squeezing transformed the tectonic pattern and traps. Currently, the Weiyuan gas field (WY) is in the western part of the paleo−uplift’s top, and the Anyue (AY) and MX gas fields are in the east. In the CRSB, large−scale strike−slip fault developed in the Sinian−Permian strata, experienced two−stage activities (Ma et al., 2018; Jiao et al., 2022), have laid the groundwork for 3D reservoir exploration (Figure 2C).
3 Samples and experiments
3.1 Samples
A total of 20 natural gas samples were collected. 10 samples were from the T2l1 and five samples were from the T2j2 from the Triassic marine carbonate gas reservoirs of the MX gas filed in the CRSB. For comparison, five samples from the Є1l in the MX structure of Anyue gas filed were also collected. Prior to sampling, a double valve aluminum alloy cylinder (with a volume of 2L) capable of withstanding a gas pressure of 20 Mpa was utilized. The pressure gauge was removed at the wellhead, and the gas cylinder was connected to the wellhead via a hose, both gas valves were opened to flush the cylinder for 3–5 min. Subsequently, one of the valves was closed to fill the cylinder with gas at a pressure equal to that of the wellhead. During sampling, wells with a pressure ranging from 3 to 10 Mpa and that had been operating normally for an extended period were selected. This was to ensure the success of the light hydrocarbon enrichment experiment.
3.2 Analytical methods
3.2.1 Natural gas analysis
The compositions of natural gas alkane and non−alkane gases, CH4 and C2H6 carbon isotopes, CH4 hydrogen isotope, and LHs (C6−C7) molecular composition were measured using industry−standard techniques at the PetroChina Research Institute of Petroleum Exploration and Development (Beijing). Gas components were detected by an Agilent 7890B gas chromatograph (GC) with five valves, seven columns, and three detectors (one FID and two TCDs). The FID quantified alkane gas proportions; the first TCD measured N2, CO2, and H2S proportions, with helium as the carrier gas for both. The second TCD, using N2 as the carrier gas, measured only the He proportion. Carbon isotope compositions were analyzed online with a MAT 253 gas isotope mass spectrometer. Gaseous hydrocarbons, separated by a PQ capillary column, were transferred by the carrier gas (He) to a combustion furnace, oxidized to CO2 by CuO at 850°C, and then the converted products were carried to the mass spectrometer for isotope measurement. δ13C values were calibrated against the Vienna Peedee Belemnite (VPDB) standard, and δD values against the Vienna Standard Mean Ocean Water (VSMOW) standard. Before daily sample analysis, standard samples were measured to ensure instrument stability. The analysis errors for components and δ13C were less than 0.3% and 0.5‰ respectively, and that for δD was less than 5‰.
3.2.2 Light hydrocarbon analysis
The analysis of LHs components was conducted using an Agilent 7890A gas chromatograph (GC) outfitted with a PONA capillary column. At the injection port, the PONA column was coiled repeatedly to create an enrichment loop. Prior to sample injection, this loop was submerged in a liquid−nitrogen cold trap. Ten minutes subsequent to injection, the cold trap was withdrawn, and upon closing the column oven, the analysis was initiated. The column oven temperature was maintained at 30°C for 15 min, then gradually increased to 70°C at a rate of 1.5°C/min, and further elevated to 280°C at a rate of 2.5°C/min. The carbon isotope ratios of LHs (C6−C7) were determined via GC−C−IRMS, employing the identical temperature programming as that utilized for the determination of LHs components. The detection precisions for LHs components and δ13C were ±0.3% and ±0.5‰, respectively.
4 Results
4.1 Chemical composition of natural gas
The molecular compositions and carbon isotopes of 20 gas samples from the Triassic gas reservoirs (T2j2 and T2l1) in MX gas field and the Є1l gas samples in MX structure of AY gas field are presented in Table 1. The gas is extremely dry, with a dryness coefficient (C1/Cn) > 0.99. The gas is predominantly composed of alkane gases, with CH4 being in an absolutely dominant position, ranging from 96.83% to 99.36% with an average of 96.96%. The C2H6 is extremely low (0.2%–0.26%), and the C3H8 is lower than that of C2H6 (0.01%–0.03%). In certain samples, the C3H8 content fell beneath the instrument’s detection threshold, precluding the measurement of corresponding values. The content of non−alkane gases is low. The N2 content ranges from 0.72% to 2.43%, with an average of 1.14%. The CO2 content is unevenly distributed, ranging from 0.07% to 2.18%, with an average of 0.29%. The H2S content also varies considerably, ranging from 0% to 2.94%, with an average of 1.36%.
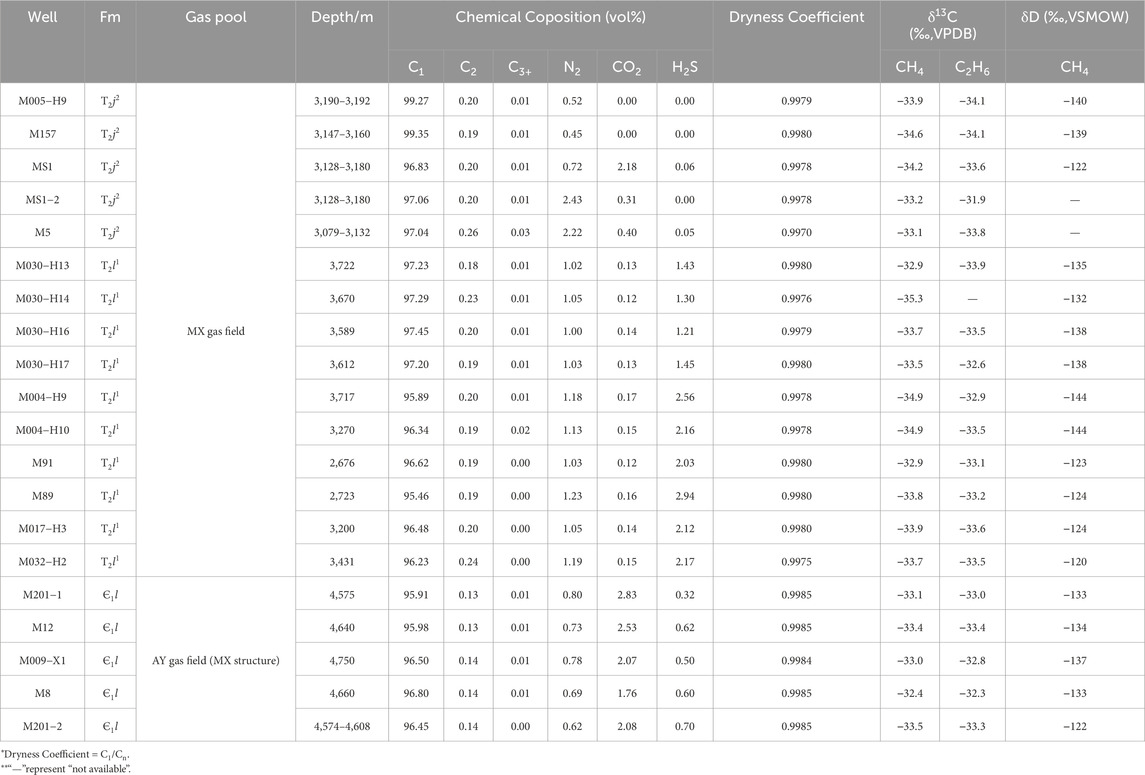
Table 1. Molecular and stable isotopic compositions of gas from Triassic and Cambrian reservoirs in the MX and AY gas fields.
4.2 Stable carbon and hydrogen isotopic composition
Both δ13C1 and δ13C2 values show narrow distribution ranges: δ13C1 ranges from −35.3‰ to −31.4‰ (average = −33.6‰), and δ13C2 from −34.0‰ to −28.6‰ (average = −32.8‰). Owing to the relatively heavy δ13C1 values, carbon isotope reversal (δ13C1 > δ13C2) occurs in M5, M030−H13 and M91 samples. δD1 values are generally heavy, varying narrowly from −144‰ to −120‰, with an average of −130‰.
4.3 Molecular composition of C6−C7 light hydrocarbons
Table 2 shows the molecular composition and distribution of LHs associated with gas in the MX gas field and MX structure of AY gas field of the CRSB. In the samples, LHs components are characterized by high average contents of cycloalkanes (37.8%) and iso−alkanes (39.5%), while normal alkanes are relatively low, with a maximum of 35% of total C6−C7 LHs and an average of 22.6%. For C7 LHs components, methylcyclohexane (MCH) has the highest average content (55.8%), followed by n−heptane (nC7, 31.9%) and dimethylcyclopentanes (∑DMCPs, 14.1%). The Mango coefficient K1 ratio [(2−MH + 2.3−DMP)/(3−MH + 2.4−DMP)] of T2j2 gas ranges from 1.02 to 1.17, whereas T2l1 shows a wider range, from 0.96 to 1.77. In the Є1l Fm, low iso−alkane contents precluded K1 calculation for most samples; the average K1 of samples M201–1 and M201−2 is 1.16.
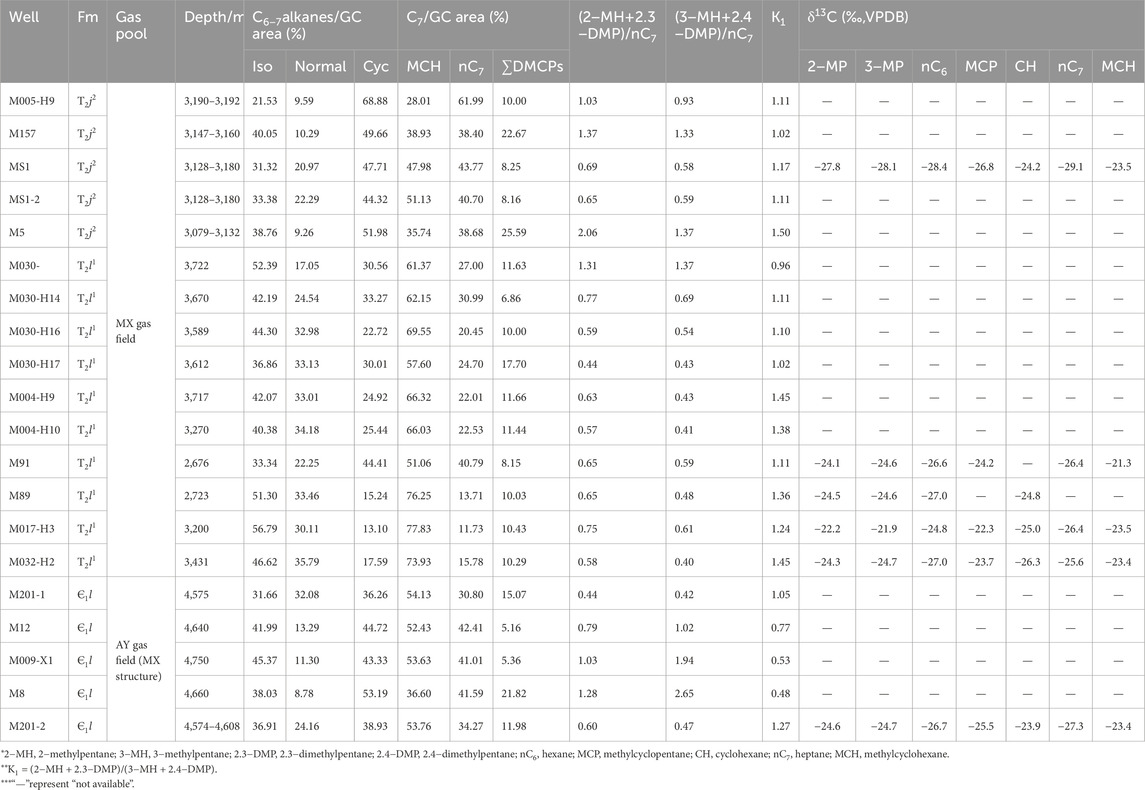
Table 2. Relative contents, main component parameters, and isotope ratios of C6–C7 LHs with natural gases from the MX and AY gas fields.
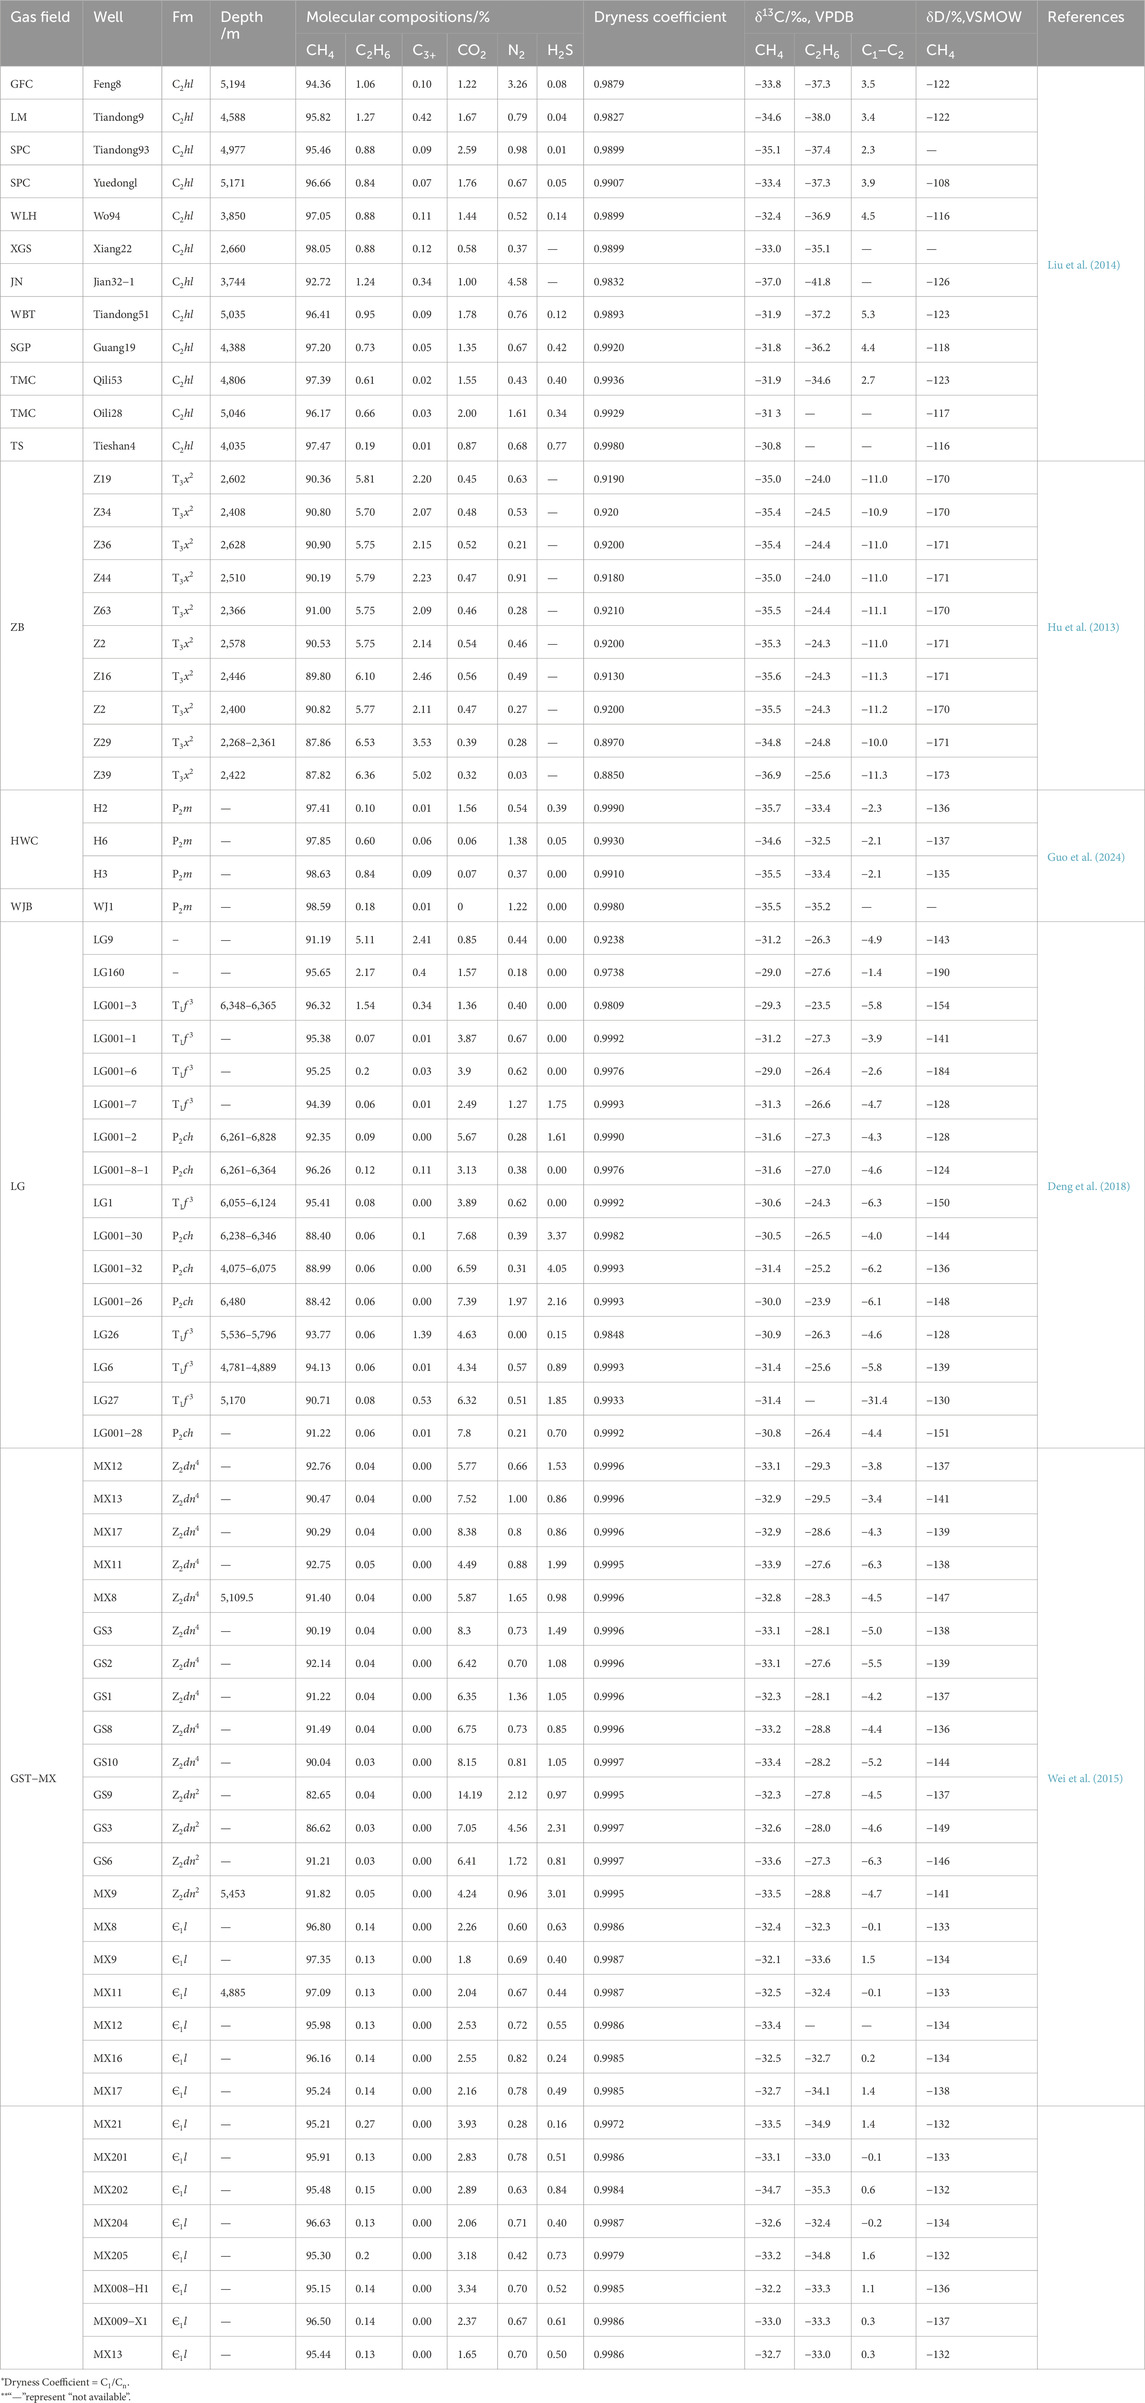
Table 3. Geochemical data for the components and stable carbon and hydrogen isotopes of natural gases for correlation in the Sichuan Basin.
4.4 Isotopic characteristics of C6−C7 light hydrocarbons
As the gases are over−mature gas and the concentrations of LHs are low, reliable individual carbon isotope data were obtained for only six samples. Meanwhile, over−mature natural gas also suffers from poor separation between adjacent LHs compounds, which affects the detection results of individual carbon isotope values of LHs. The carbon isotope values of seven LHs compounds, namely, 2−MP, 3−MP, nC6, MCP, CH, nC7, and MCH, were selected for comparison, as shown in Table 2. Among the seven LHs compounds, δ13CMCH is the heaviest, with δ13C values ranging from −23.5‰ to −21.3‰ and an average of −22.8‰. The carbon isotope values of normal alkanes, δ13CnC6 and δ13CnC7, are the lightest, with averages of −26.7‰ and −27.0‰ respectively. CH and MCP have the widest distributions of carbon isotope values, showing significant differences among different samples. The δ13CCH values range from −26.8‰ to −22.3‰, with an average of −24.4‰, and the δ13CMCP values range from −26.3‰ to −23.9‰, with an average of −24.9‰.
Due to the samples being over − mature gas with low LHs concentrations, reliable individual carbon isotope data were available for only six samples. Moreover, over − mature natural gas exhibits poor separation between adjacent LHs compounds, which impacts the carbon isotope detection of individual LHs compounds. As presented in Table 2, the carbon isotope values of seven LHs compounds (2−MP, 3−MP, nC6, MCP, CH, nC7, and MCH) were selected for comparison. Among them, 13CMCH is the heaviest, with values from −23.5‰ to −21.3‰ (average = −22.8‰). In contrast, the carbon isotope values of normal alkanes (δ13CnC6 and δ13CnC7) are the lightest, averaging −26.7‰ and −26.9‰ respectively. CH and MCP show the widest carbon − isotope value distributions, varying significantly across samples. The δ13CCH values range from −26.8‰ to −22.3‰ (average = −24.4‰), and δ13CMCP values from −26.3‰ to −24.0‰ (average = −24.9‰).
5 Discussion
5.1 Genetic identification of gas
On the δ13C1 vs C1/C2+C3) gas genetic diagram proposed by (Milkov et al., 2020) and the modified Bernard diagram (Figure 3A; Bernard et al., 1978), the gas samples mainly represent late−mature thermogenic gases. The δ13C2-1 vs δ13C1 plot (Figure 3B) also shows the characteristics of late−mature thermogenic gases (Milkov, 2021). Numerous case studies have indicated that the δ13C1 in natural gas is primarily influenced by maturity (Stahl and Carey, 1975; Schoell, 1980; Dai, 1993). In contrast, the δ13C values of heavier hydrocarbons such as C2H6 and C3H8 are less affected by maturity and mainly reflect the organic matter type of source rock. Based on the linear relationship between vitrinite reflectance (Ro) and the δ13C1 of natural gas, empirical formulas for its variation have been deduced. Chen et al. (2021) comprehensively evaluated these formulas and pointed out that previous formulas often showed deviations when determining the maturity of gas source rocks. By combining actual geological conditions and a large amount of measured gas data, they revised the relationship between the δ13C1 in oil−type gas and coal−derived gas and the vitrinite reflectance (Ro) of the source rock. The revised formulas are, for oil−type gas, δ13C1 = 25lgRo−42.5; for coal−derived gas, δ13C1 = 25lgRo−37.5. In this study, the above formulas were applied to estimate the maturity of gas source rocks in each production layer in the MX area of CRSB. The estimated maturities of gas from the Triassic and the Є1l in the MX area are as follows, the maturity of T2j2 gas ranges from 2.34% to 2.38% (average = 2.36%), that of T2l1 gas ranges from 1.94% to 2.43% (average = 2.21%), and that of the Є1l gas ranges from 2.31% to 2.54% (average = 2.38%). According to the classification criteria for the thermal evolution stages of organic matter in source rocks, the gas source rocks of the Triassic and Є1l in the MX area are mainly in the over−mature stage, with the gas maturities of T2j2 and Є1l being slightly higher than that of T2l1. Correspondingly, the same conclusion can be drawn from the δ13C1 vs δD1 diagram (Figure 3D).
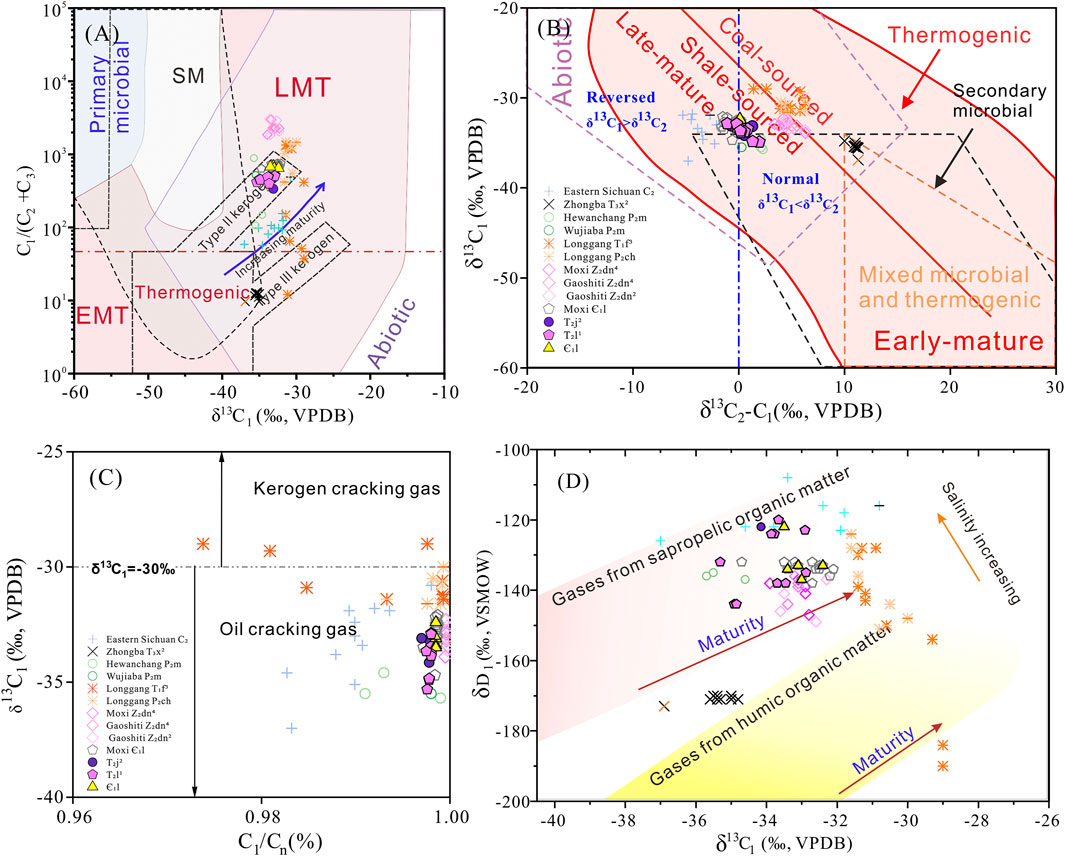
Figure 3. Relationship diagram between (A) δ13C1 vs. C1/(C2+C3). Abbreviations: SM−secondarymicrobial, EMT−early mature thermogenic gas, LMT−late mature thermogenic gas [adapted from Bernard et al. (1978); Milkov et al. (2020)] (B) Δδ13C2−δ13C1 vs δ13C1 [adapted from Milkov (2021)], (C) C1/Cn vs. δ13C1. [adapted from Clayton (1991)] and (D) δ13C1 vs δD1 [adapted from Wang et al. (2015)] of T2j2,T2l1 gas in the MX gas field and Є1l gas in the AY gas field, Sichuan Basin (Data source same as Table 3).
Based on the type of organic matter in source rocks, thermogenic gases can be classified into oil−type gas and coal−derived gas. The former is mainly generated from sapropelic organic matter, while the latter is primarily produced from humic organic matter (Dai et al., 1992). The data points of the samples fall within the range of shale−sourced rather than coal−sourced gases in the Milkov diagram (Figure 3B; Milkov, 2021) and follow the trend of gases generated from Type II kerogen in the modified Bernard diagram (Figure 3A; Bernard et al., 1978), exhibiting typical characteristics of oil−type gas. This shows significant differences from the coal−derived gas in the T2x in the Zhongba area and the natural gas in the Feixianguan Formation sourced from the P3l in the Longgang area of the Sichuan Basin. The hydrogen isotope composition of natural gas is influenced by the organic matter in the source rock, thermal maturity, and the conditions of the aqueous medium, and thus is commonly used to identify the origin of natural gas (Dai et al., 2012; Wang et al., 2015). Generally, the δD1 values of oil−type gas are higher than those of coal−derived gas with the same or similar δ13C1 values. The δD1 values of T2j2 and T2l1 gas are generally heavier than −140‰, ranging from −144‰ to −120‰ (average = −131‰). All samples show the characteristics of oil−type gas in the δ13C1 vs δD1 diagram (Figure 3D), and there is a positive correlation between δD1 and δ13C1, indicating that as gas maturity increases, δD1 is significantly affected and shows a gradually increasing trend. The salinity of water during source rock formation affects the hydrogen isotope composition of natural gas. Compared with fresh water, saltwater is rich in deuterium (D), which usually results in higher δD1 values in natural gas generated in such environments (Schoell, 1980; Wang et al., 2015; Ni et al., 2019). The samples can be roughly divided into two parts based on δD1 values, gas with δD1 > −132‰ mainly comes from T2j2, while gas with δD1 < −132‰ is from Є1l and T2l1. Considering that the source rocks in these areas are generally in the high to over − mature stage, the increase in water salinity during source rock deposition rather than maturity may be the reason for the higher δD1 values in gas. The wide distribution of data points for T2l1 gas may be due to the complexity of the gas source rocks or the existence of mixing effect.
Given that the C3H6 content in certain samples is below the instrument’s detection limit, registering as 0%, the ln (C2/C3) vs ln (C1/C2) plot is inapplicable for differentiating kerogen−cracking gas from oil−cracking gas in this study. On the C1/Cn vs δ13C1 diagram (Figure 3C), the δ13C1 values of all samples are less than −30‰, indicating that they belong to the category of oil−cracking gas. These samples can be compared with natural gas from other regions that has been confirmed as oil−cracking gas, such as the Z2dn gas in the GST−MX area and the Є1l gas in the MX area (Wei et al., 2015), the C2hl gas in eastern Sichuan (Liu et al., 2014), and the P2m gas in the HWC and WJB gas fields in northwestern Sichuan (Guo et al., 2024). They differ from the coal−derived gas in the P2ch−T1f3 Fms in the LG gas field that displays characteristics of kerogen−cracking gas. In addition, the relative contents of non−hydrocarbon gases CO2 and N2 can also be used to identify the formation pathways of natural gas (Liu et al., 2012), which is related to the high content of nitrogen−containing compounds in argillaceous source rocks. During the thermal evolution of argillaceous source rocks, denitrification occurs, resulting in a higher N2 content in kerogen−cracking gas than in oil−cracking gas. According to the CO2−N2 relationship diagram proposed by Li et al. (2022), the boundary of the N2 content between oil−cracking gas and kerogen−cracking gas in the Sichuan Basin is approximately 4%. Samples with an N2 content higher than 4% in natural gas can generally be considered as kerogen−cracking gas. Therefore, all the natural gas in the Triassic marine strata of the MX area is oil−cracking gas. However, according to the LHs discrimination diagrams (Figures 4A, B), most T1l1 samples have relatively low MCH/nC7 ratios, and the data points fall into the mixed − gas region of oil − cracking gas and kerogen−cracking gas. It is believed that the mixing of gas with a relatively high MCH content in the gas of the T1l1 causes deviations in the results.
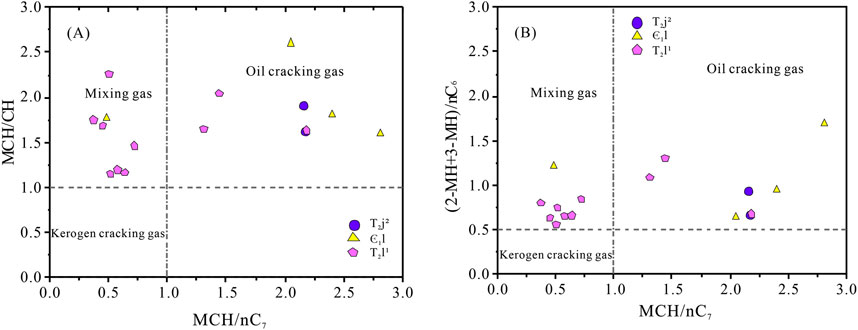
Figure 4. Cross−plot of MCH/nC7 versus MCH/CH (A) and MCH/nC7 versus (2−MH+3−MH)/nC6 (B) of T2j2, T2l1 gas in the MX gas field and Є1l gas in the AY gas field [modified from Hu et al. (2005)].
On the δ13C2-1 vs δ13C1 plot (Figure 3B), some gases from the Triassic and the Є1l Fm are located in the reversal region (δ13C1 > δ13C2). Considering the distribution of several potential source rocks (Figure 1) and the high maturity of the natural gas, there are several reasonable explanations for the observed phenomenon of δ13C1 > δ13C2. (1) Mixing of hydrocarbon gases generated by thermal cracking of oils from different source rocks. In the CRSB, there are three potential source rocks, the Є1q marine shale, the Upper Permian marine shale, mudstone, and carbonate rocks of P2l, and the T2l3 marine shale (Figure 1). These source rocks are mainly composed of sapropelic organic matter and may thus contribute to the accumulated oils that generate secondary−cracking gases. Although existing data suggest that the accumulated oils in the T2l1 gas reservoir are mainly sourced from the Upper Permian source rocks (Wang et al., 1998), the contribution of other source rocks (such as the Lower Triassic marine shale) cannot be excluded. (2) Mixing of secondary−cracking gases and primary−cracking gases. As mentioned earlier, all samples are secondary−cracking gases (Figure 3C), while this explanation is not applicable to the Triassic gas in CRSB. (3) Mixing of gases from thermal cracking of previously−accumulated oils at different maturity levels may occur within the reservoir. However, Triassic dry gas reservoirs did not evolve from paleo oil reservoirs within the stratigraphic system. Thus, the gases likely accumulated instantaneously. Nevertheless, it cannot be ruled out that the mixture of gases generated by thermal cracking of accumulated oils at different maturity levels in the Lower Cambrian migrated upward and retained their reversed characteristics.
5.2 Gas−source correlation
The distribution of various sets of source rocks has been discussed in the geological setting. The Є1q Fm, P2l Fm and T2l3Fm are three sets of source rocks that may contribute to the natural gas in the Triassic marine strata. The Є1q source rock is controlled by the Deyang−Anyue rift trough and has a widespread distribution (Figure 2B). It has strong hydrocarbon − generating potential and is one of the highest−quality source rocks in the Sichuan Basin. Its gas−generation intensity reaches 20 × 108–200 × 108 m3/km2 (Zhang et al., 2024). However, the gypsum layers developed in the overlying Cambrian Gaotai Formation (Є1g) and Є1l are distributed in the eastern and southern Sichuan Basin, and they do not play a capping role for the hydrocarbon−generation of the Є1q in the MX area of CRSB (Xu et al., 2016). In addition, the multi−stage strike−slip faults developed in the CRSB serve as “highways” for oil and gas migration. These faults have been active in multiple stages from the Sinian to the Cretaceous. The Indosinian period was the main stage of oil − generation from the Lower Cambrian shale, and traps along the migration pathways may have captured the oil and gas generated in historical periods (Shuai et al., 2022; Lu et al., 2024).
The P2l source rock has sedimentary centers in both central and northeastern Sichuan Basin. The maximum sedimentary thickness can reach 120–140 m. The superior source rock conditions have laid a material foundation for hydrocarbon generation in the central Sichuan region. However, according to the burial history of Well GS 17, the P2l source rock in the CRSB entered the high−maturity stage (geo−temperature>180°C) during the Cretaceous period (Figure 5; Yang et al., 2020). Subsequently, under the influence of the uplift of the Indosinian movement, the temperature dropped rapidly. Therefore, it did not experience a large scale dry gas generation stage in history. As can be seen from the hydrocarbon−expulsion intensity map of the P2l Fm at the end of the Triassic, the hydrocarbon−expulsion amount is less than 50 × 108 t/km2 south of Suining in the CRSB (Zhang et al., 2022).
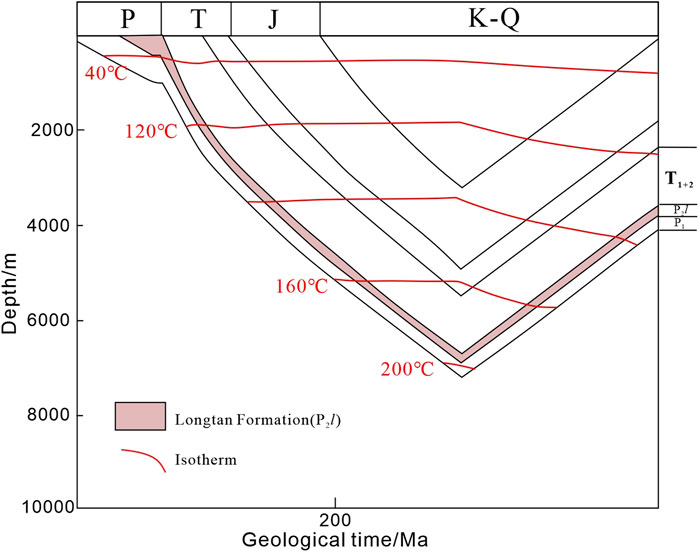
Figure 5. Burial and thermal histories, and hydrocarbon charging stages from Well GS17 in CRSB [Burial history and thermal evolution history are modified from Yang et al. (2020)].
As for the Triassic T2l3 marl, it is a set of lagoonal facies source rocks explored in recent years. The average TOC of the T2l3 cuttings in Well CT1 is 0.77%, the organic matter type is Type II, and the measured Ro is 1.59–1.63%, indicating a high mature stage (Yu, 2022; Wang et al., 2023). Currently, only the self−generated and self−stored reservoir of the T2l3 marl in Well CT1 has been discovered, and no contribution to conventional gas reservoirs has been found yet.
The T2j2 and T2l1 gases are oil−type gases and specifically oil−cracking gases. The δ13Ckerogen of P2l ranges from −24‰ to −23‰, and the organic matter type is II2−III (Huang et al., 2024). According to the carbon isotope fractionation between oil−cracking ethane and kerogen is larger than that between kerogen−cracking ethane and kerogen, the carbon isotope of oil−cracking ethane in oil−cracking gas is generally 3‰–5‰ lighter than that of kerogen (Dai et al., 2005). Consequently, the carbon isotope of ethane in P2l gas should range from −29‰ to −26‰, which is inconsistent with the ethane characteristics of the gas in the MX Gas Field. Moreover, the P2l gas in the CRSB has not entered the over mature stage, while the dryness coefficients of T2j2 and T2l1 gases are very high. Therefore, the P2l source rock is unlikely to be the main source rock in this area. Thus, Є1q is the most important source rock for the Triassic gas reservoirs in the CRSB.
By comparing the characteristics of δ13C1 and δ13C2 (Figure 3A, B), the Triassic gases are found to closely resemble the P2m gases from the WJB and HWC in western Sichuan, and the Є1l gas. Previous research indicates that these gases share a common origin from the Є1q source rock. Specifically, the P2m gases are oil−cracking gases generated during the early phase of the Є1q’s hydrocarbon generation process, while the Є1l gas represents shale gas released in the late stage of the Є1l maturation (Shuai et al., 2022; Guo et al., 2024). As illustrated in the δ13C2-1 vs. δ13C1 diagram (Figure 3B), in contrast to oil − cracking gases, the late − stage shale gas in the Є1l Fm exhibits distinct characteristics. It has heavier methane isotopes, reversed carbon isotope ratios between methane and ethane (δ13C1 > δ13C2), and a notably high dryness coefficient (>0.9995), as shown in Figure 3C.
LHs are a crucial component of oil and natural gas, generally referring to C5−C10 compounds with a boiling point less than 200°C. They contain abundant geochemical information and are often used for origin identification (Hu et al., 2007; Dai et al., 2016), organic matter type determination (Hill et al., 2007), and oil−gas source correlation. Sapropelic parent materials are rich in normal alkanes, while humic parent materials are abundant in isoparaffins, naphthenes, and aromatics (Leythaeuser et al., 1979; Snowdon and Powell, 1982). The triangular diagram of C6‒7 normal alkanes, isoparaffins, and naphthenes is commonly used to characterize the genetic types of natural gas. In the triangular diagram of C7 compounds, MCH is derived from the lignin, cellulose, and sugars of higher plants and has stable thermodynamic properties. DMCP comes from the cyclic lipid compounds in sterols and terpenoids of aquatic organisms, and its abundant presence is an important characteristic of oil−type gas. The parent sources of nC7 are complex, mainly including bacteria, algae, and the chain−like complexes of higher plants. However, it is quite sensitive to maturity and will undergo extensive cracking at high maturity levels (Dai et al., 1992; Odden et al., 1998; Whiticar, 1999; Mango, 2000; Hu et al., 2007). When natural gas reaches the over mature stage, such as the shale gas in the S1l in southern Sichuan, light hydrocarbons undergo intense thermal cracking. The normal alkanes that originally reflect the sapropelic parent material source are destroyed, and the contents of compounds with strong thermochemical stability, such as naphthenes and aromatics, increase significantly. This distorts the identification results of LHs, causing them to fall into the coal−derived gas region (Dai et al., 2016; Figures 6A, B).
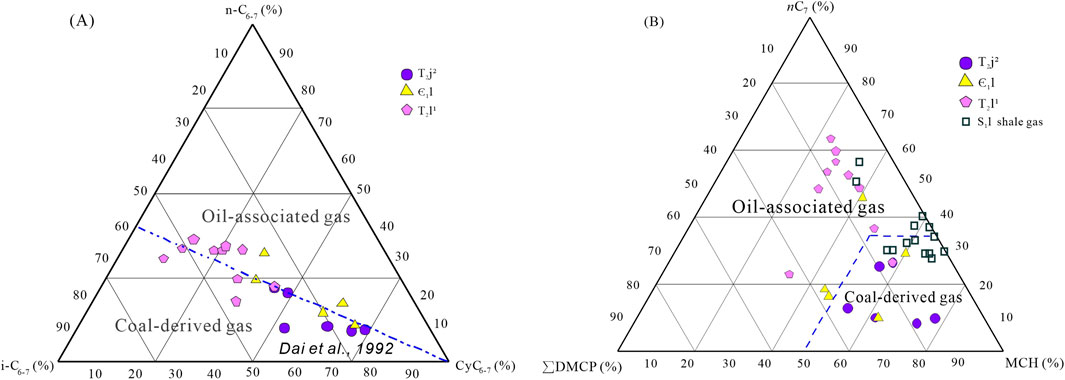
Figure 6. Ternary diagram of C6‒7 (A) and ternary diagram of C7 (B) LHs associated with natural gas from the T2j2, T2l1 in MX gas field and the Є1l in AY gas field MX gas field [modified after Dai et al. (1992)]. For comparison, we collect the LHs data of typical oil−type gases from Longmaxi shale gas from Dai et al. (2016). (n−C6‒7, normal C6‒7 alkanes; i−C6‒7, branched C6‒7 alkanes; CyC6‒7, C6‒7 cycloalkanes; n−C7, heptane; DMCPs, dimethylcyclopentanes; MCH, methylcyclohexane).
In the genetic identification chart of the LHs triangular diagram, the gases of T2j2 and Є1l show a high degree of kinship correlation and also have a MCH advantage (Figures 7A−D), falling into the coal−derived gas region. However, the relative contents of normal and isoparaffins in T2l1 gas are relatively high (Figure 7E−H), and the majority of samples fall into the identification region of oil−type gas. Whiticar and Snowdon (1999) proposed that the individual carbon isotopes of LHs from similar organic sources are highly correlated. In this study, the carbon isotope values of seven LHs compounds, namely, 2−MP, 3−MP, nC6, MCP, CH, nC7, and MCH, were compared (Table 2; Figure 8B) to observe whether there were differences in gas sources. Ignoring the isotope differences among different LHs compounds, the individual carbon isotope fingerprint diagram of LHs indicates that the T2l1 LHs should be from the same gas source, with their δ13CMCP>−24‰ and δ13CMCP>δ13CCH. In contrast, the T2j2 and Є1l gases exhibit the characteristics of δ13CCH >−24‰ and δ13CMCP <δ13CCH. Based on this, it can be judged that the gas sources of T2j2 and T2l1 are different, and both T2j2 and Є1l gases are derived from the shale gas of Є1q.
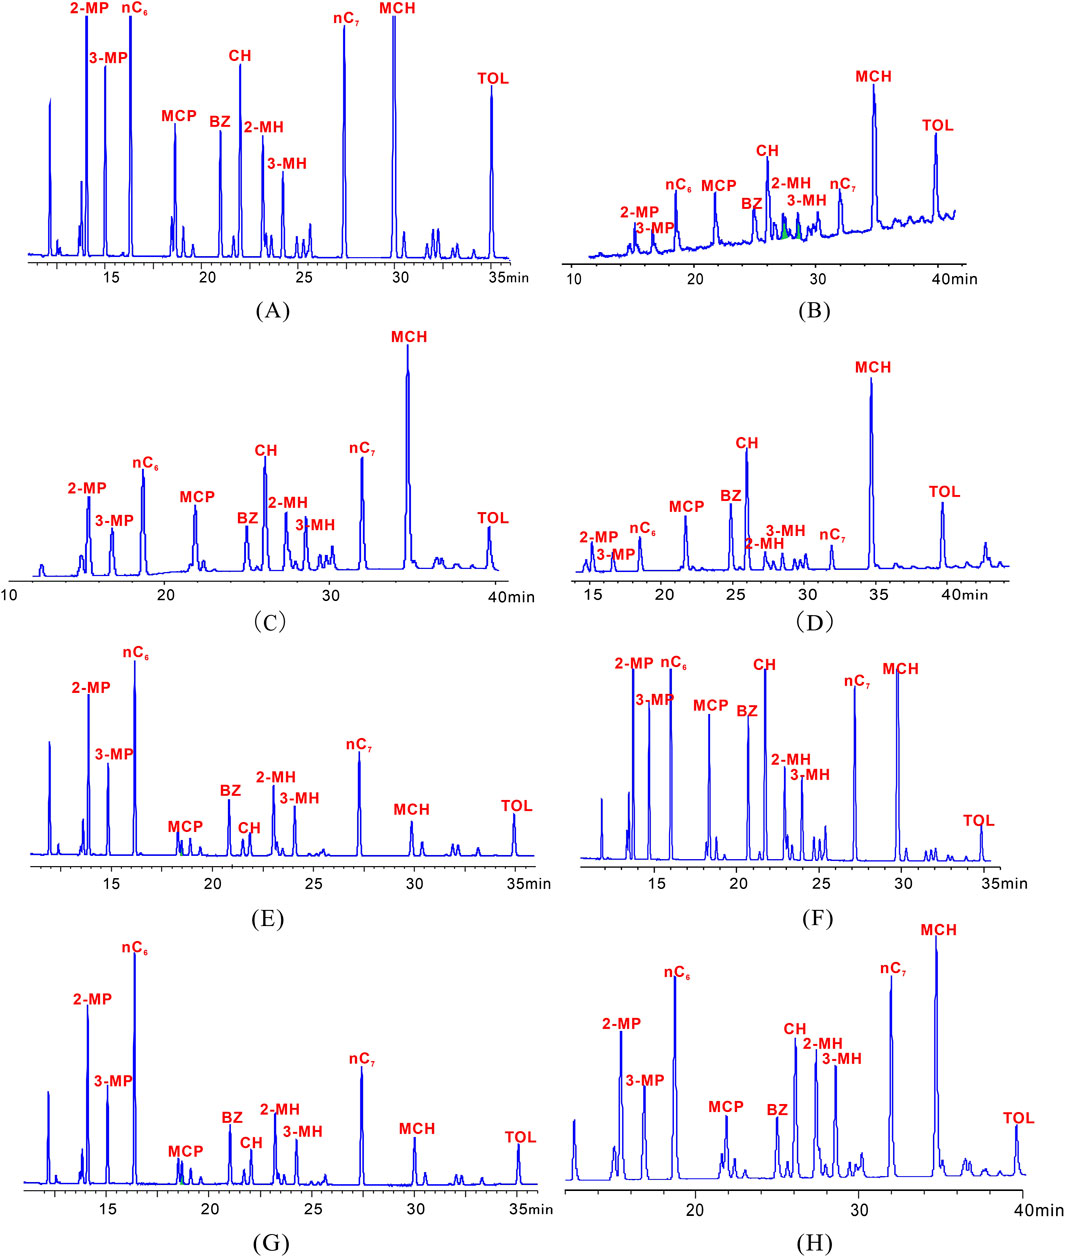
Figure 7. Gas chromatogram of LHs from natural gas from the T2j2, T2l1 in MX gas field and the Є1l in AY gas field. In the MX gas field (2−MP, 2−methylpentane; 3−MP, 3−methylpentane; nC6, hexane; MCP, methylcyclopentane; Bz, benzene; CH, cyclohexane; 2−MH, 2−methylhexane; 3−MH, 3−methylhexane; nC7, heptane; MCH, methylcyclohexane; Tol, toluene). (A) M201, 4,630 m, Є1l. (B) MX009−X1, 4,750 m, Є1l. (C) MS1, 3,128.9 −3,180 m, T2j2. (D) M005−H9, T2j2. (E) M017−H3, 3,200 m, T2l1. (F) M91, 2,676, T2l1. (G) M89, 2,723.2 m, T2l1. (H) M030−H14, 3,670 m, T2l1.
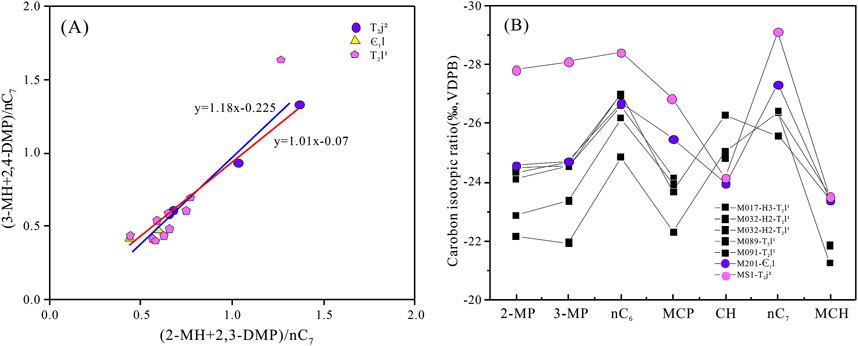
Figure 8. The relationship between (A) (2−MH + 2.3−DMP) vs. (3−MH + 2.4−DMP) and (B) the correlation of stable carbon isotopic ratios of seven LHs compounds.
The Mango coefficient K1, proposed by (Mango, 1997), demonstrates a consistent K value within the same category of oil and gas, yet varies across different types. This characteristic renders it a reliable criterion for gas−source correlation. When examining the diagrams of (2−MH + 2.3−DMP)/nC7 versus (3−MH + 2.4−DMP)/nC7 (Figures 4A, B), distinct correlations emerge. For the T2j2 and Є1l gas samples, the correlation equation is y = 1.01x-0.07, with a high correlation coefficient of R2 = 0.9865, and the average K1 value of the natural gas is 1.11. In contrast, for the T2l1 gas, the correlation relationship is described by y = 1.18x-0.225, with a correlation coefficient of R2 = 0.9384, and the average K1 value of the natural gas is 1.28. These differences in correlation equations and K1 values can potentially provide insights into the unique characteristics and origins of each gas sample (Figure 8A).
Based on the above evidence of LHs, it is considered that the sources of T2j2 and T2l1 natural gases are not completely the same. Although both gases are derived from the Є1q, the gas in T2l1 has the admixture of other oil−type gases, and the maturity of this mixed gas is lower than that of the shale gas from the Є1q Fm. However, considering the characteristics of CH4 and C2H6 in natural gas, T2l1 gas is significantly different from the gas from the P2l Fm (LG) and is more similar to the oil−cracking gas and shale gas from the Є1q. It is believed to be formed by the mixing of oil−cracking gas with lower maturity and shale gas. This also well explains the reversal phenomenon observed in the gas from the T2l1.
6 Conclusion
1. The natural gas components in the Triassic gas reservoirs of the MX gas field in central Sichuan are mainly alkane gases. The gas is extremly dry (dryness coefficients ranges from 0.9970 to 0.9985) with a low content of non−alkane gases, mainly being CO2 and N2. All the gas is of oil−type gas and belongs to crude oil−cracking gas.
2. The Є1q Fm is the principal source rock, generating different types of natural gas. It includes both oil−cracking gas (reservoir gas) and shale gas (unaffected by TSR). These two types of gas exhibit diverse geochemical characteristics. The oil−cracking gas is characterized by relatively light δ13C1 (<−35‰), a relatively low dryness coefficient (<0.9995), and a normal sequence of carbon isotopes (δ13C1<δ13C2). The shale gas has heavy δ13C1 (>−35‰), a high dryness coefficient (>0.9995), and shows carbon isotopes reversal (δ13C1>δ13C2).
3. The shale gas, with a higher thermal evolution degree, has low abundances of normal and iso−alkanes and a higher proportion of cycloalkanes. Its has the feature of individual carbon isotopes with δ13CCH>−24‰ and δ13CMCP <δ13CCH, while the oil−cracking gas shows δ13CMCP>−24‰ and δ13CMCP>δ13CCH.
4. The T2j2 gas comes from the shale gas of the Є1q Fm. The T2l1 gas is a mixture of oil−cracking gas and shale gas from the Є1q Fm, and this mixture is the main cause of the carbon isotope reversal in the T2l1 gas.
Data availability statement
The original contributions presented in the study are included in the article/supplementary material, further inquiries can be directed to the corresponding authors.
Author contributions
CG: Conceptualization, Formal Analysis, Funding acquisition, Investigation, Methodology, Resources, Visualization, Writing–original draft, Writing–review and editing. GH: Data curation, Funding acquisition, Investigation, Methodology, Project administration, Resources, Writing–review and editing. JL: Methodology, Writing–review and editing. XT: Data curation, Investigation, Resources, Supervision, Writing–review and editing. LT: Data curation, Methodology, Software, Supervision, Visualization, Writing–review and editing. JG: Formal Analysis, Methodology, Writing–review and editing. HC: Data curation, Resources, Writing–review and editing. ZL: Methodology, Writing–review and editing. XL: Funding acquisition, Supervision, Writing–review and editing.
Funding
The author(s) declare that financial support was received for the research and/or publication of this article. The author(s) disclosed receipt of the following financial support for the research, authorship, and/or publicantion of this article: This work was supported by the National Natural Science Foundation of China (U22B6002), PetroChina Science and Technology Projects (2023ZZ0203, 2021DJ0601, 2021DJ0602) and the Fundamental Research Funds for the Central Universities (Ph.D. Top Innovative Talents Fund of CUMTB NO. BBJ2024044). The authors declare that this study received funding from PetroChina. The funder was not involved in the study design, collection, analysis, interpretation of data, the writing of this article, or the decision to submit it for publication.
Acknowledgments
The authors extend their gratitude to the Research Institute of Exploration and Development.
Conflict of interest
Authors CG, GH, JL, LT, JG, HC, and ZL were employed by PetroChina Research Institute of Petroleum Exploration and Development. Author XT was employed by PetroChina Southwest Oil & Gas field Company.
The remaining author declares that the research was conducted in the absence of any commercial or financial relationships that could be construed as a potential conflict of interest.
Generative AI statement
The author(s) declare that no Generative AI was used in the creation of this manuscript.
Publisher’s note
All claims expressed in this article are solely those of the authors and do not necessarily represent those of their affiliated organizations, or those of the publisher, the editors and the reviewers. Any product that may be evaluated in this article, or claim that may be made by its manufacturer, is not guaranteed or endorsed by the publisher.
References
Bernard, B. B., Brooks, J. M., and Sackett, W. M. (1978). Light hydrocarbons in recent texas continental shelf and slope sediments. J. Geophys. Res. Oceans 83, 4053–4061. doi:10.1029/jc083ic08p04053
Chen, J., Wang, X., Chen, J., Ni, Y., Xiang, B., Liao, F., et al. (2021). New equation to decipher the relationship between carbon isotopic composition of methane and maturity of gas source rocks. Sci. China Earth Sci. 64, 470–493. doi:10.1007/s11430-020-9692-1
Clayton, C. (1991). Carbon isotope fractionation during natural gas generation from kerogen. Mar. Petroleum Geol. 8, 232–240. doi:10.1016/0264-8172(91)90010-x
Dai, J. (1993). Carbon and oxygen isotopic characteristics and identification of natural gas. Nat. Gas. Geosci. 4, 1–40.
Dai, J., Ni, Y., and Zou, C. (2012). Stable carbon and hydrogen isotopes of natural gases sourced from the Xujiahe Formation in the Sichuan Basin, China. Org. Geochem. 43, 103–111. doi:10.1016/j.orggeochem.2011.10.006
Dai, J., Pei, X., and Qi, H. (1992). Natural Gas Geology of China. Beijing, China: Petroleum Industry Press, 1–280 (in Chinese).
Dai, J., Qin, S., Tao, S., Zhu, G., and Mi, J. (2005). Developing trends of natural gas industry and the significant progress on natural gas geological theories in China. Nat. Gas. Geosci. 16, 127–142.
Dai, J., Zou, C., Dong, D., Ni, Y., Wu, W., Gong, D., et al. (2016). Geochemical characteristics of marine and terrestrial shale gas in China. Mar. Petroleum Geol. 76, 444–463. doi:10.1016/j.marpetgeo.2016.04.027
Deng, Y., Hu, G., and Zhao, C. (2018). Geochemical characteristics and origin of natural gas in Changxing−Feixianguan formations from Longgang gasfield in the Sichuan Basin,China. Nat. Gas. Geosci. 29, 892–907. doi:10.11764/j.issn.1672-1926.2018.03.016
Fu, X., Chen, Y., Luo, B., Wenzheng, Li., Zhang, J., Wang, X., et al. (2021). Characteristics and petroleum geological significance of the high− quality source rocks in the Gufeng Member of the Middle Permian Maokou Formation in the northern Sichuan basin. Acta Geol. Sin. 95, 1903–1920. doi:10.19762/j.cnki.dizhixuebao.2021128
Guo, C., Hu, G., Tian, X., Tian, L., Guo, J., and Li, X. (2024). The geochemical differences and origin of multilayered natural gases in marine strata, the northwestern Sichuan Basin, China. Energy Explor. and Exploitation 42, 401–428. doi:10.1177/01445987231185798
Hill, R. J., Jarvie, D. M., Zumberge, J., Henry, M., and Pollastro, R. M. (2007). Oil and gas geochemistry and petroleum systems of the Fort Worth Basin. AAPG Bull. 91, 445–473. doi:10.1306/11030606014
Hu, G., Li, J., Li, J., Li, Z., and Luo, X. (2007). Discussion on the light hydrocarbons index in the identification of natural gas. Sci. China D. 37, 111–117. doi:10.1360/zd2007-37-zkII-111
Hu, G., Li, J., Shan, X., and Han, Z. (2010). The origin of natural gas and the hydrocarbon charging history of the Yulin gas field in the Ordos Basin, China. Int. J. Coal Geol. 81, 381–391. doi:10.1016/j.coal.2009.07.016
Hu, G., Xiao, Z., Luo, X., Li, Z., Li, J., Sun, Q., et al. (2005). Light hydrocarbon composition difference between two kinds of cracked gases and its application. Nat. Gas. Ind. 25, 23–25.
Hu, G., Yu, C., Ni, Y., Huang, S., and Tian, X. (2013). Comparative study of stable carbon and hydrogen isotopes of alkane gases sourced from the Longtan and Xujiahe coal−bearing measures in the Sichuan Basin, China. Int. J. Coal Geol. 116–117, 293–301. doi:10.1016/j.coal.2013.07.006
Huang, S., Zhao, Z., Ai, Y., Jiang, H., Tian, X., Jiang, Q., et al. (2024). Differences in gas sources of the changxing–feixianguan formations around the Kaijiang−Liangping trough and favorable exploration directions for coal−formed gas generated by the upper permian Longtan Formation, Sichuan Basin, China. J. Nat. Gas Geoscience 9, 321–331. doi:10.1016/j.jnggs.2024.09.001
Jiao, F., Yang, Y., Ran, Q., Wu, G., and Liang, H. (2022). Distribution and gas exploration of the strike–slip faults in the central Sichuan Basin. Nat. Gas. Ind. B 9, 63–72. doi:10.1016/j.ngib.2021.08.018
Jin, H., Dai, H., and Wen, H. (2019). Summary of reservoir−forming characteristics of Moxi Leikoupo formation gas reservoir in central Sichuan. Chem. Eng. Des. Commun. 45, 240–241.
Leythaeuser, D., Schaefer, R. G., Cornford, C. t., and Weiner, B. (1979). Generation and migration of light hydrocarbons (C2−C7) in sedimentary basins. Org. Geochem. 1, 191–204. doi:10.1016/0146-6380(79)90022-6
Li, Q., Li, B., Mei, W., and Liu, Y. (2022). Genesis and sources of natural gas in fold−and−thrust belt: the Middle Permian in the NW Sichuan Basin. Mar. Petroleum Geol. 140, 105638. doi:10.1016/j.marpetgeo.2022.105638
Li, Y., Liang, Y., Lei, B., Guo, G., and Luo, Y. (2006). Natural gas genesis for the section II of west jialingjiang formation in middle sichuan−south sichuan transitional belt. J. Nat. Gas Geoscience 17, 820–823.
Liu, Q., Worden, R. H., Jin, Z., Liu, W., Li, J., Gao, B., et al. (2014). Thermochemical sulphate reduction (TSR) versus maturation and their effects on hydrogen stable isotopes of very dry alkane gases. Geochimica Cosmochimica Acta 137, 208–220. doi:10.1016/j.gca.2014.03.013
Liu, Q., Zhijun, J., Jianfa, C., Krooss, B. M., and Qin, S. (2012). Origin of nitrogen molecules in natural gas and implications for the high risk of N2 exploration in Tarim Basin, NW China. J. Petroleum Sci. Eng. 81, 112–121. doi:10.1016/j.petrol.2011.12.013
Lu, X., Gui, L., Wang, Z., Liu, S., Liu, Q., Fan, J., et al. (2024). Activity time of strike−slip faults and their controlling effects on hydrocarbon accumulation in central Sichuan Basin: evidence from U−Pb dating and fluid inclusions of cements in fault zone. Acta Pet. Sin. 45, 642. doi:10.7623/syxb202404003
Ma, D., Wang, Z., Duan, S., Gao, J., Jiang, Q., Jiang, H., et al. (2018). Strike−slip faults and their significance for hydrocarbon accumulation in Gaoshiti–Moxi area, Sichuan Basin, SW China. Petroleum Explor. Dev. 45, 851–861. doi:10.1016/s1876-3804(18)30088-0
Mango, F. D. (1997). The light hydrocarbons in petroleum: a critical review. Org. Geochem. 26, 417–440. doi:10.1016/s0146-6380(97)00031-4
Mango, F. D. (2000). The origin of light hydrocarbons. Geochimica Cosmochimica Acta 64, 1265–1277. doi:10.1016/s0016-7037(99)00389-0
Milkov, A. V. (2021). New approaches to distinguish shale−sourced and coal−sourced gases in petroleum systems. Org. Geochem. 158, 104271. doi:10.1016/j.orggeochem.2021.104271
Milkov, A. V., Faiz, M., and Etiope, G. (2020). Geochemistry of shale gases from around the world: composition, origins, isotope reversals and rollovers, and implications for the exploration of shale plays. Org. Geochem. 143, 103997. doi:10.1016/j.orggeochem.2020.103997
Ni, Y., Liao, F., Gao, J., Chen, J., Yao, L., and Zhang, D. (2019). Hydrogen isotopes of hydrocarbon gases from different organic facies of the Zhongba gas field, Sichuan Basin, China. J. Petroleum Sci. Eng. 179, 776–786. doi:10.1016/j.petrol.2019.04.102
Odden, W., Patience, R., and Van Graas, G. (1998). Application of light hydrocarbons (C4–C13) to oil/source rock correlations:: a study of the light hydrocarbon compositions of source rocks and test fluids from offshore Mid−Norway. Org. Geochem. 28, 823–847. doi:10.1016/s0146-6380(98)00039-4
Schoell, M. (1980). The hydrogen and carbon isotopic composition of methane from natural gases of various origins. Geochimica cosmochimica ACTA 44, 649–661. doi:10.1016/0016-7037(80)90155-6
Shuai, Y., Li, J., Tian, X., Chen, Z., Zhang, B., and Wei, C. (2022). Accumulation mechanisms of Sinian to Triassic gas reservoirs in the central and western Sichuan basin and their significance for oil and gas prospecting. Acta Geol. Sin. 97, 1526–1543. doi:10.19762/j.cnki.dizhixuebao.2023227
Snowdon, L. R., and Powell, T. G. (1982). Immature oil and condensate−−modification of hydrocarbon generation model for terrestrial organic matter. AAPG Bull. 66, 775–788. doi:10.1306/03b5a313-16d1-11d7-8645000102c1865d
Stahl, W. J., and Carey, B. D. (1975). Source−rock identification by isotope analyses of natural gases from fields in the Val Verde and Delaware basins, west Texas. Chem. Geol. 16, 257–267. doi:10.1016/0009-2541(75)90065-0
Thompson, K. F. (1983). Classification and thermal history of petroleum based on light hydrocarbons. Geochimica Cosmochimica Acta 47, 303–316. doi:10.1016/0016-7037(83)90143-6
Wang, S., Dai, H., Wang, T., and Lin, F. (1998). Gas source and migration of high−mature natural gas in Moxi Gas Field. Pet. Explor. 3, 5–8.
Wang, X., Liu, W., Shi, B., Zhang, Z., Xu, Y., and Zheng, J. (2015). Hydrogen isotope characteristics of thermogenic methane in Chinese sedimentary basins. Org. Geochem. 83 (84), 178–189. doi:10.1016/j.orggeochem.2015.03.010
Wang, Z., Xin, Y., Xie, W., Wen, L., Zhang, H., Xie, Z., et al. (2023). Petroleum geology of marl in triassic Leikoupo Formation and discovery significance of well Chongtan1 in central Sichuan Basin, SW China. Petroleum Explor. Dev. 50, 1092–1104. doi:10.1016/s1876-3804(23)60451-3
Wei, G., Xie, Z., Song, J., Yang, W., Wang, Z., Li, J., et al. (2015). Features and origin of natural gas in the Sinian–Cambrian of central Sichuan paleo−uplift, Sichuan Basin, SW China. Petroleum Explor. Dev. 42, 768–777. doi:10.1016/s1876-3804(15)30073-2
Whiticar, M. J. (1999). Carbon and hydrogen isotope systematics of bacterial formation and oxidation of methane. Chem. Geol. 161, 291–314. doi:10.1016/s0009-2541(99)00092-3
Whiticar, M. J., and Snowdon, L. R. (1999). Geochemical characterization of selected western Canada oils by C5±C8 compound specic isotope correlation. Org. Geochem. 30, 1127–1161. doi:10.1016/s0146-6380(99)00093-5
Xie, Z., Li, J., Yang, C., Tian, X., Zhang, L., Li, J., et al. (2021). Geochemical characteristics of Sinian−Cambrian natural gas in central Sichuan paleo−uplift and exploration potential of Taihe gas area. Nat. Gas. Ind. 41, 1–14. doi:10.3787/j.issn.1000-0976.2021.07.001
Xie, Z., Yang, C., and Dong, C. (2020). Geochemical characteristics and genesis of middle devonian and middle permian natural gas in Sichuan Basin. China 31, 447–461. doi:10.11764/j.issn.1672-1926.2020.01.005
Xu, A., Hu, S., Wang, Z., Bo, D., Li, M., Lu, W., et al. (2016). Sedimentary mode and reservoir distribution of the Cambrian carbonate and evaporate paragenesis system in the Sichuan Basin. Nat. Gas. Ind. B 3, 418–427. doi:10.3787/j.issn.1000-0976.2016.06.002
Yang, C., Wen, L., Wang, T., Luo, B., Li, M., Tian, X., et al. (2020). Timing of hydrocarbon accumulation for paleo-oil reservoirs in Anyue gas field in Chuanzhong Uplift. Oil and Gas Geol. 41, 492–502. doi:10.11743/ogg20200306
Yu, X. (2022). Accumulation mechanism and model of natural gas in the Leikoupo Formation, western depression, Sichuan Basin. PhD thesis. China University of Geosciences: Wuhan, China. doi:10.27492/d.cnki.gzdzu.2022.000014
Zhang, T., Huang, S., Li, X., Jiang, H., Zeng, F., and Ma, Y. (2024). Sedimentary geochemical characteristics and organic matter enrichment of the lower cambrian Qiongzhusi Formation in the Sichuan Basin. Nat. Gas. Geosci. 35, 688–703. doi:10.11764/j.issn.1672-1926.2023.09.016
Keywords: Moxi gas field, light hydrocarbons, shale gas, genetic types, gas source rock
Citation: Guo C, Hu G, Li J, Tian X, Tian L, Guo J, Cui H, Liu Z and Li X (2025) Light hydrocarbons composition and carbon isotopes unravel the origin of natural gas in Triassic marine strata of Moxi gas field, central Sichuan Basin. Front. Earth Sci. 13:1577658. doi: 10.3389/feart.2025.1577658
Received: 16 February 2025; Accepted: 14 March 2025;
Published: 01 April 2025.
Edited by:
Tao Hu, China University of Petroleum, Beijing, ChinaReviewed by:
Yazhou Liu, China University of Petroleum, Beijing, ChinaTianyu Zheng, University of Science and Technology, Beijing, China
Copyright © 2025 Guo, Hu, Li, Tian, Tian, Guo, Cui, Liu and Li. This is an open-access article distributed under the terms of the Creative Commons Attribution License (CC BY). The use, distribution or reproduction in other forums is permitted, provided the original author(s) and the copyright owner(s) are credited and that the original publication in this journal is cited, in accordance with accepted academic practice. No use, distribution or reproduction is permitted which does not comply with these terms.
*Correspondence: Guoyi Hu, aHVndW95aTY5QHBldHJvY2hpbmEuY29tLmNu; Xianqing Li, TGl4cUBjdW10Yi5lZHUuY24=