 Pengliang Dang1
 Zeliang Li
- 1Sinohydro Bureau 14 Co., Ltd., Kunming, China
- 2College of Civil and Transportation Engineering, Shenzhen University, Shenzhen, China
To address the safety challenges of deep foundation pit construction under complex conditions, this study proposes a dynamic assessment framework based on grey clustering theory and a moment estimation composite weighting method. A three-level indicator system was constructed, integrating subjective and objective weights through order relationship and entropy weight methods. Grey clustering was employed to classify real-time monitoring data and assess safety levels dynamically. Application to a large-scale water diversion shaft project in Shenzhen verified the model’s effectiveness, with assessment results closely matching observed risks during excavation. The framework improves accuracy and responsiveness in uncertain monitoring environments and supports intelligent risk management.
1 Introduction
When there is a need to build underground structures such as shaft foundations, basements, or tunnels, a foundation pit is usually excavated. As urbanization continues to advance and calls for constructing more underground infrastructures, the scale and depth of deep foundation pit engineering are continuously expanding, and their safety issues are receiving increasing attention, especially in densely populated urban areas and karst-prone regions. The pit excavation triggers significant unloading effects and usually negatively disturbs the greenfield ground, which imposes high risks to the surrounding environment and may lead to the disastrous collapse of pit bracing structures and damage to adjacent buildings (Chen et al., 2023). In recent years, multiple foundation pit accidents have occurred, such as the collapse of a metro station project in Hangzhou in 2008 (Gong and Zhang, 2012), the failure of foundation pit support in Nanchang in 2015 (Feng and Lu, 2016), and the pit collapse accident in Nanning in 2019 (Chin et al., 2019), many of which were exacerbated by karst-induced instability (Lv et al., 2020). Causing substantial property losses and casualties. It should be pointed out that these incidents are attributed to unqualified field monitoring or untimely responses to alert monitoring data. Studies emphasize that accurate field monitoring, effective data analysis, and timely risk management are crucial in preventing foundation pit accidents. For example, numerical analyses have highlighted the importance of understanding the seismic responses of underground structures in complex soil conditions such as liquefiable soils and marine soft soils (Bao et al., 2025), and karst regions (Li et al., 2023). Therefore, performing accurate field monitoring and further effective monitoring data analysis and timely risk management are effective ways to prevent foundation pit accidents. With the advancement of technology, modern deep foundation pit engineering has introduced advanced monitoring techniques and computational models to ensure safety during construction and structural stability. For instance, seismic responses of underground structures in liquefiable soils necessitate precise monitoring and design optimizations to enhance safety during seismic events (Shen et al., 2025; Bao et al., 2024). Similarly, Xu et al. explored the monitoring and assessment methods for ultra-deep diaphragm walls during excavation, providing critical insights into structural stability under high-stress conditions (Xu et al., 2024). In karst regions, unique challenges arise due to hidden cavities, water-filled voids, and unpredictable soil mechanics, which amplify risks of sudden collapses and water inrush during excavation (Xu and Wang, 2022). Recent advancements in machine learning have shown promise in detecting hidden defects in complex geological environments. For example, Bao et al. developed an improved YOLOv8 model with attention mechanisms to detect voids in rebar-affected areas using ground-penetrating radar (GPR) data, demonstrating enhanced accuracy in noisy and cluttered datasets (Bao et al., 2025).
With advancements in monitoring technologies and equipment, effectively utilizing data for risk assessment and prediction has become essential for ensuring safety during deep foundation pit construction. To address this need, several scholars have proposed various methods to predict and assess safety risks throughout the construction process. For instance, Wei et al. introduced a fuzzy analytic hierarchy process (FAHP) combined with evidence reasoning algorithms to evaluate the overall risk level of deep foundation pits, enabling reasonable risk assessments even with insufficient monitoring data (Wei et al., 2020). Similarly, Zhou et al. developed risk prediction models based on support vector machines (SVM) (Zhou et al., 2017) and random forest algorithms (Zhou et al., 2019), both of which have demonstrated reliable validation. Moreover, Wu et al. presented a rapid convergence and high-reliability multi-source data fusion method for assessing subway foundation pit collapse risk, utilizing cloud models (CM) and improved Dempster-Shafer evidence theory to integrate and quickly converge multi-source data under various factors (Wu et al., 2024). Furthermore, Sun applied digital twin technology for real-time risk prediction and control during deep foundation excavation, improving the precision and timeliness of risk management; however, the complexity of the technology and high equipment costs currently hinder large-scale implementation (Sun et al., 2023). Shen established the cloud model theory by using the parameters such as expectation, entropy and super-entropy to represent uncertainty, which provided a new perspective for multi-index comprehensive evaluation (Shen et al., 2025).
With the emergence of an increasing number of safety assessment methods for deep foundation pit construction, the selection of assessment indicators has become more diverse. As a structured framework for assessment methods, assessment indicators directly impact the accuracy and reliability of assessment results. Previous studies have made significant strides in developing safety assessment frameworks for deep foundation pits. However, these methods face notable limitations. FAHP introduces subjectivity due to reliance on expert judgment, whereas SVM struggles with incomplete or uncertain data. Additionally, existing approaches often focus narrowly on structural deformation indicators while neglecting critical factors such as structural internal forces and environmental impacts. This oversight can lead to incomplete risk assessments, particularly in complex geological conditions where multi-factor interactions dominate.
To address the aforementioned issues and provide solutions, this study innovatively proposes a dynamic safety assessment method for deep foundation pit construction based on gray clustering theory and moment estimation composite weights. The innovations of this assessment method include: (1) the introduction of gray clustering theory effectively addresses the uncertainty and incompleteness of monitoring data in practical engineering, enhancing computational efficiency and ensuring the accuracy and timeliness of assessment results; (2) the incorporates monitoring projects from current standards as assessment indicators, eliminating the need for additional resource investment and ensuring the economic viability and applicability of the assessment approach; (3) a multi-layer composite weights approach based on moment estimation is proposed for assigning weights to each assessment indicator, ensuring objectivity and scientific rigor in the distribution of weights.
The rest of this paper is divided into five main sections: Section 2 will elaborate on the theoretical foundations of this research, including the principles of gray clustering theory and moment estimation methods, as well as their application context in safety assessments; Section 3 details the construction process of the assessment model, covering the selection of assessment indicators, the methodology for weight allocation, and the mathematical representation of the model; Section 4 presents the application process and practical effects of the assessment model through specific engineering cases, validating its effectiveness and applicability; Section 5 summarizes the main contributions and practical value of the assessment method, while also discussing the limitations of the study and potential future research directions.
2 Methodology
As a multi-attribute decision-making (MADM) problem (Li et al., 2015), the dynamic safety assessment of deep foundation pit construction needs to consider the interaction between multiple factors, and finally obtain a safety index comprehensively. The assessment of safety indicators requires scientific weight coefficients allocation and reasonable assessment methods to obtain accurately fit actual results.
A scientific and reasonable weight determination method should consider subjective and objective factors. Common subjective weight determination methods include expert evaluation method, analytic hierarchy process (AHP) and order relationship analysis method. The expert evaluation method directly assigns weights to each evaluation indicator through the experience and knowledge of professionals; the AHP quantifies the relative importance of different factors by constructing a hierarchical model, and determines the weights through a series of comparative judgments; and the order relationship analysis method determines the weights for each indicator by judging the relationship between sequences, which is suitable for situations where clear data is lacking. The calculation of objective weights is usually based on some theoretical methods based on data, among which the entropy weight method is the most universal method. The entropy weight method is based on the objectivity of data and determines the objective weights of each indicator by analyzing the uncertainty of the data. This process is completely based on the inherent characteristics of the data, reducing the possibility of human intervention and errors.
Given the diversity of assessment indicators of deep foundation pit construction and the implicit relationships among them, it is more practical to calculate composite weights by integrating both subjective and objective aspects.
2.1 Weight coefficients
2.1.1 Order relationship analysis method
The Order Relationship Analysis Method (ORAM) is a subjective weight assignment method proposed based on the AHP. This method first qualitatively sorts the indicators and then quantitatively assigns values with comparing adjacent indicators (Ye et al., 2023). After arranging the importance of the assessment indicators in order, the relative importance of other assessment indicators is also uniquely determined, and so are the weights. Compared to the AHP method, when there are many assessment indicators, ORAM does not require a one-time check, solving the problem of inconsistent judgment matrices and greatly improving the computational efficiency of the model. The detailed process of this method include.
Step 1: Determine the order relationship
Establish the set of indicators based on the dynamic safety assessment index system, perform a Delphi method ranking (usually by experts in this area), and ultimately establish a unique order based on importance from the highest to the lowest, as in Equation 1:
Step 2: Calculate the relative importance coefficient
Set Equation 2 as
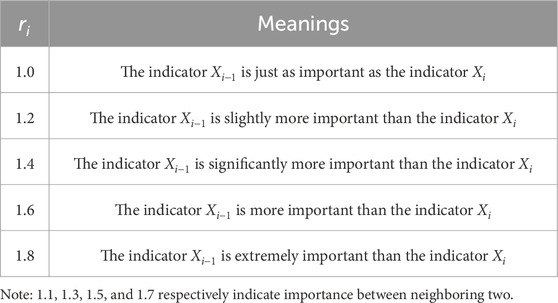
Table 1. Relative importance of indicators.
In the formula,
Step 3: Weight coefficient calculation
Within the context of sequential relational indicators, designate the weight of the
In the formula,
2.1.2 Entropy weight method
The entropy weight method (EWM) is an important objective weighting method that develops from the concept of entropy, a term mostly used to describe a state of disorder, randomness, or uncertainty. The term is first recognized and used in classical thermodynamics (Akih-Kumgeh, 2016). Generally, the lower the information entropy
Step 1: Data standardization.
Formulate the data of each indicator into an
Here,
Step 2: Proportion of the indicator.
The purpose of proportion is to measure the importance of each assessment objects in that indicator. For standardized data, Equation 5 is used to calculate the proportion of each assessment objects under each index.
Here, m is the number of assessment objects, pil represents the proportion of the
Step 3: Calculate the information entropy.
The information entropy for each indicator is calculated utilizing Equation 6.
Here,
Step 5: Calculate objective weights.
Information entropy is introduced into Equation 7 to obtain the objective weight of the index.
2.1.3 Entropy weight method
To balance subjective judgment with objective data in the MADM process, this study employs the moment estimation composite weights method (MECWM) for composite weights, aiming to minimize the influence of subjectivity on the assessment of indicator importance. MECWM is a widely used parameter estimation technique in statistics. This method quantifies the importance of indicators by calculating sample moments and matching them with theoretical population moments (Wooldridge, 2001). This method was first proposed by British statistician Karl Pearson in the late 19th century, estimating the parameters of a probability distribution by matching sample moments with population moments (Pearson, 1936).
In the process of composite weights, MECWM allows us to combine the analysis results of objective data with the subjective judgment of decision-makers. By adjusting parameter estimates to reflect the importance of different indicators, this approach not only enhances the transparency of the decision-making process but also strengthens the reliability of the decision outcomes.
Therefore, this paper will apply MECWM to optimize the combination of weights for the indicators, based on the optimal subjective and objective weight values determined by the ORAM and the EWM, respectively. Employing Equation 8, the composite weights coefficient
2.2 Grey clustering theory
The dynamic safety assessment of deep foundation pit construction is a MADM problem. In such scenarios, decision-makers often aim to develop the most reasonable assessment plan in an objective and impartial manner. In deep foundation pit construction, monitoring data often exhibits characteristics such as incompleteness, uncertainty, and variability due to complex geological conditions and construction activities. These uncertainties pose significant challenges in accurately assessing safety risks. Gray clustering theory, based on the whitening weight function of gray numbers, effectively addresses these challenges by integrating the analysis of various indicators to categorize observed objects into predefined classes. It demonstrates good adaptability in addressing multi-attribute decision-making challenges (Li et al., 2015), especially when dealing with uncertain and incomplete data that are common in foundation pit monitoring processes. As an unsupervised learning method, the core idea of gray clustering theory is to effectively manage the grayness of both known and unknown information within a system, thereby revealing the behavioral patterns and intrinsic connections of the system. This method is particularly suitable for situations involving incomplete or highly uncertain information (Li et al., 2015; Liu and Yang, 2017).
Grey clustering theory, rooted in grey system theory, is a powerful tool for addressing uncertainty and incompleteness in data. It operates on the concept of grey numbers’ that values with partially known and partially unknown information and employs whitening weight functions to transform ambiguous data into interpretable metrics. The core principle involves dividing data into predefined grey classes’ using triangular or trapezoidal membership functions, which inherently accommodate data vagueness. This approach surpasses traditional methods by allowing partial membership in multiple classes, reflecting real-world ambiguities in monitoring data. For example, a displacement value near a safety threshold can be assigned fractional membership to both ‘Alert’ and ‘Warning’ classes, capturing transitional states not accounted for in binary systems. This contrasts sharply with binary classification methods, which force data into discrete categories, potentially masking critical transitional risks.
While grey clustering excels in dynamic, uncertain environments, it also outperforms other advanced clustering techniques in critical aspects. k-means clustering, for instance, relies on Euclidean distance and assumes spherical cluster shapes, making it ineffective for non-linear relationships often observed in foundation pit data. Fuzzy C-means introduces probabilistic memberships but requires predefined cluster numbers and Gaussian assumptions, which are rarely valid in complex geological settings. Hierarchical clustering lacks scalability for large datasets and is prone to error propagation from early merge decisions, limiting its use in real-time monitoring. In contrast, grey clustering dynamically adapts to data patterns without rigid distribution assumptions, making it uniquely suited for incomplete or evolving datasets typical of deep foundation pit construction.
As a specific application of gray clustering theory, gray clustering analysis primarily includes two types: gray relational clustering and gray whitening weight function clustering (Liu et al., 2017). Gray relational clustering is based on the gray relational matrix, which classifies the observed indicators or objects into predefined categories by calculating the gray relational degree among the assessment objects. In contrast, gray whitening weight function clustering is used to determine whether the observed objects belong to a specific category. This involves establishing a whitening weight function to convert gray data into meaningful whitening values, allowing for appropriate differentiation and processing (Chen et al., 2019). Both the two clustering analysis types offer unique advantages in addressing multi-attribute decision-making problems, particularly in situations with incomplete or highly uncertain information. For the analysis of monitoring data in deep foundation pit construction, the gray whitening weight function clustering method can effectively identify the risks and trends of various factors, particularly in key monitoring indicators such as settlement, displacement, and stress. In contrast, gray correlation clustering focuses more on recognizing the similarities between different data points. Therefore, this study employs the gray whitening weight function clustering method for gray clustering analysis.
Notably, the gray whitening weight function is a piecewise function. Depending on the nature of the observed indicators, different ranges of indicator values correspond to different expressions of the weight function. Let
Here,
Next, the whitening weight function is constructed as illustrated in Figure 1. Let
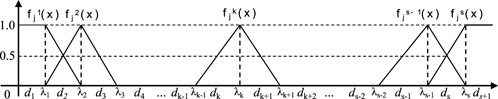
Figure 1. Whitening functions of S assessment gray classes.
The triangular whitening weight function for the first gray class is expressed as following Equation 13, the triangular whitening weight function for the s Gy class is expressed as following Equation 14:
If the weight
If
This means that the sum of the gray fixed weight clustering coefficients for all subclasses of the
3 Dynamic safety assessment methods for deep foundation pits
3.1 Dynamic safety assessment index system
The selection of proper assessment indicators is a critical aspect determining the effectiveness of the dynamic assessment method of deep foundation pit construction. In this study, the proposed assessment index system is based on the relevant standards (MOHURD, 2019), in order to closely align with actual engineering practices. The selection of assessment indicators must, on one hand consider the complexity of the foundation pit’s environment, such as geological conditions, groundwater levels, and the status of surrounding buildings and infrastructure, and on the other hand, carefully weigh the difficulty of data acquisition to ensure the feasibility of equipment deployment and the continuity of data collection. Moreover, the chosen indicators should have a strong ability to reflect the safety status of the foundation pit, capturing changes with adequate sensitivity and accuracy, particularly key indicators like vertical retaining structure deformation and stress or strain responses of the horizontal support structures, which are critical early warning signals of foundation pit instability. Additionally, environmental safety indicators, such as the ground settlement and tilting of nearby structures, should not be overlooked, as they provide insights into the construction’s impact on the surrounding environment, allowing decision-makers to intervene in a timely manner (Tan et al., 2023; Zhao et al., 2022). In conclusion, by selecting and designing a rational assessment index system has to incorporate both the bracing structures of pits and also the surrounding influential environment, while balancing the ease of on-site data acquisition (Ye et al., 2021; Qiao et al., 2024).
Based on the classification of deep foundation pit monitoring items, a dynamic safety assessment index system is established to include three primary level indicators and seventeen secondary level process indicators. The three primary level indicators are: structural deformation indicators (
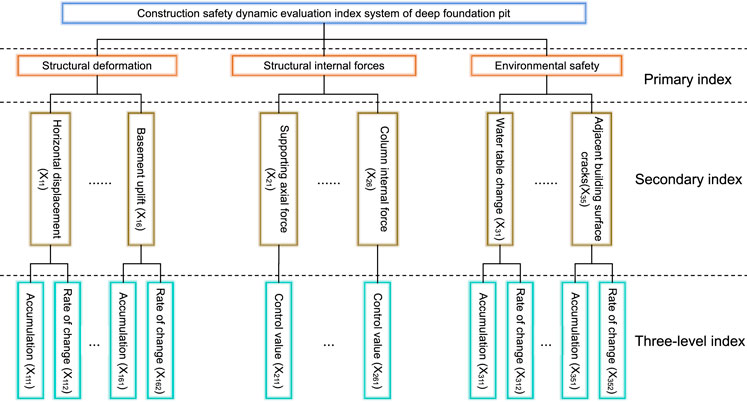
Figure 2. The diagram of the dynamic safety assessment index system for deep foundation pit construction.
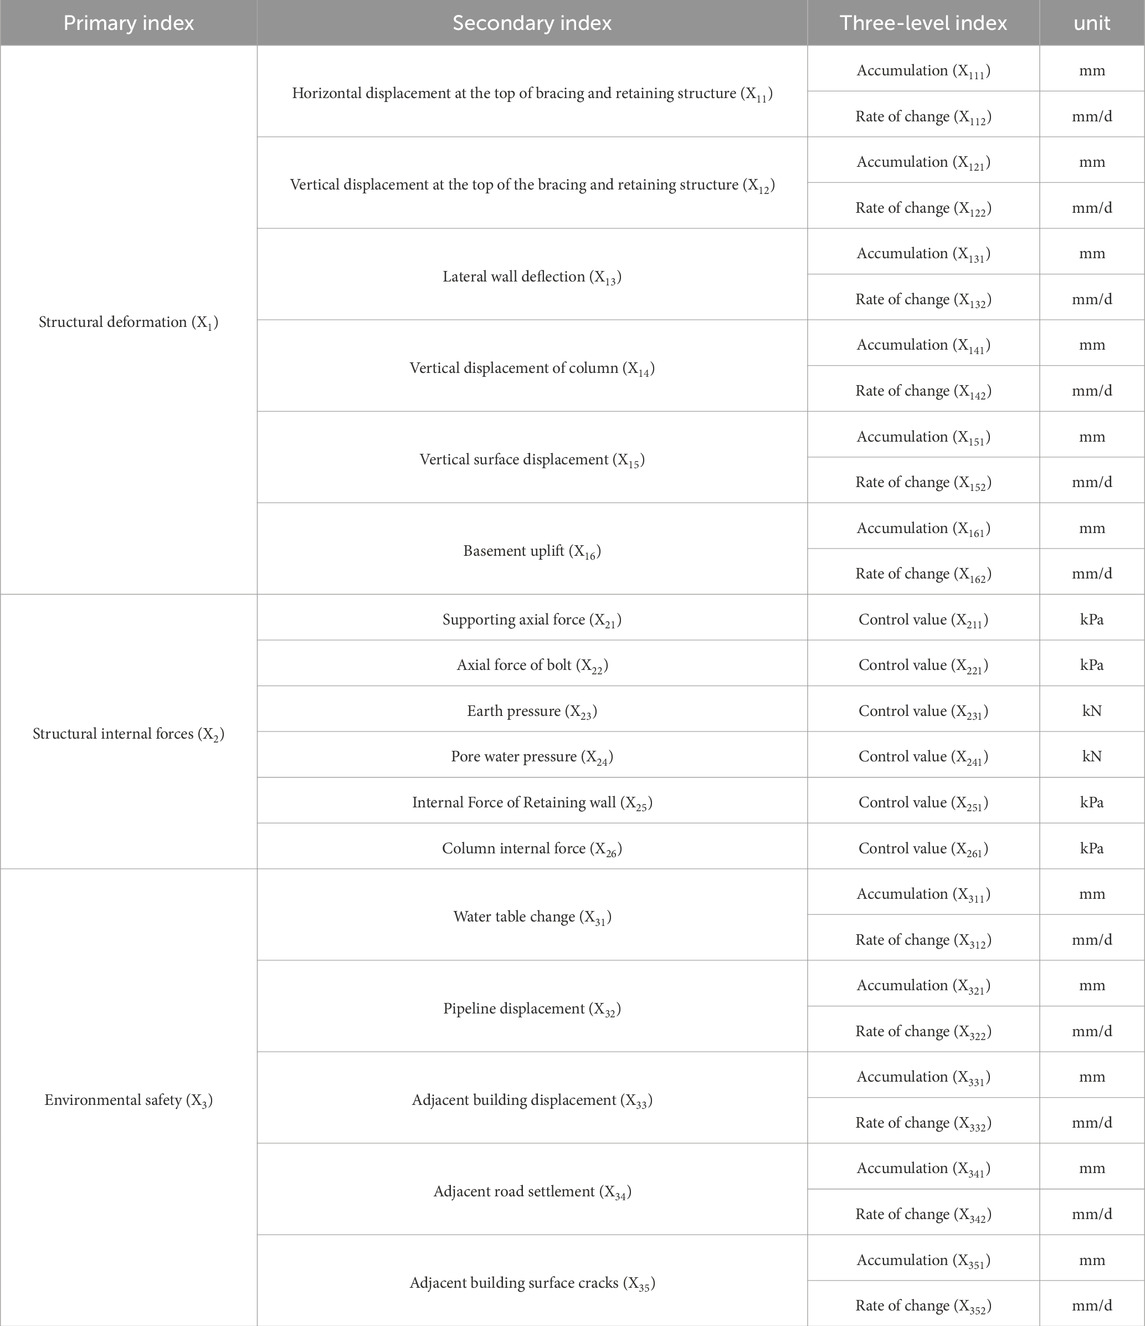
Table 2. Construction safety dynamic assessment index system of deep foundation pit.
3.2 Classification of safety levels
The determination of threshold ranges for the dynamic assessment of deep foundation pit construction safety is based on an analysis of monitoring data from actual projects, combined with references to domestic and international research findings and industry standards (MOHURD, 2019; MOHURD, 2012). The threshold setting also takes into account the specific characteristics of foundation pit projects, including geological conditions, pit excavation depth, retaining structure types, and the complexity of the surrounding environment.
In establishing the threshold ranges for each level, initial reference values were derived from empirical monitoring data on foundation pit deformation, mechanical response of bracing structures, and environmental disturbance monitoring. Significant correlations between foundation pit deformation and instability informed the setting of critical limits for horizontal displacement and vertical settlement of retaining structures such as the diaphragm walls and the sheet pile walls. The mechanical response of support structures during construction also served as a basis for adjusting the alert and warning thresholds for stress-strain indicators of support systems. Additionally, precision of monitoring equipment, dynamic changes during construction, and the influence of the surrounding environment on monitoring data were considered in the threshold determination. For indicators of environment impacts, such as settlement and tilting of adjacent buildings, data from project cases were analyzed to help define appropriate alert and warning thresholds.
Based on this multi-dimensional analysis, the safety assessment index system
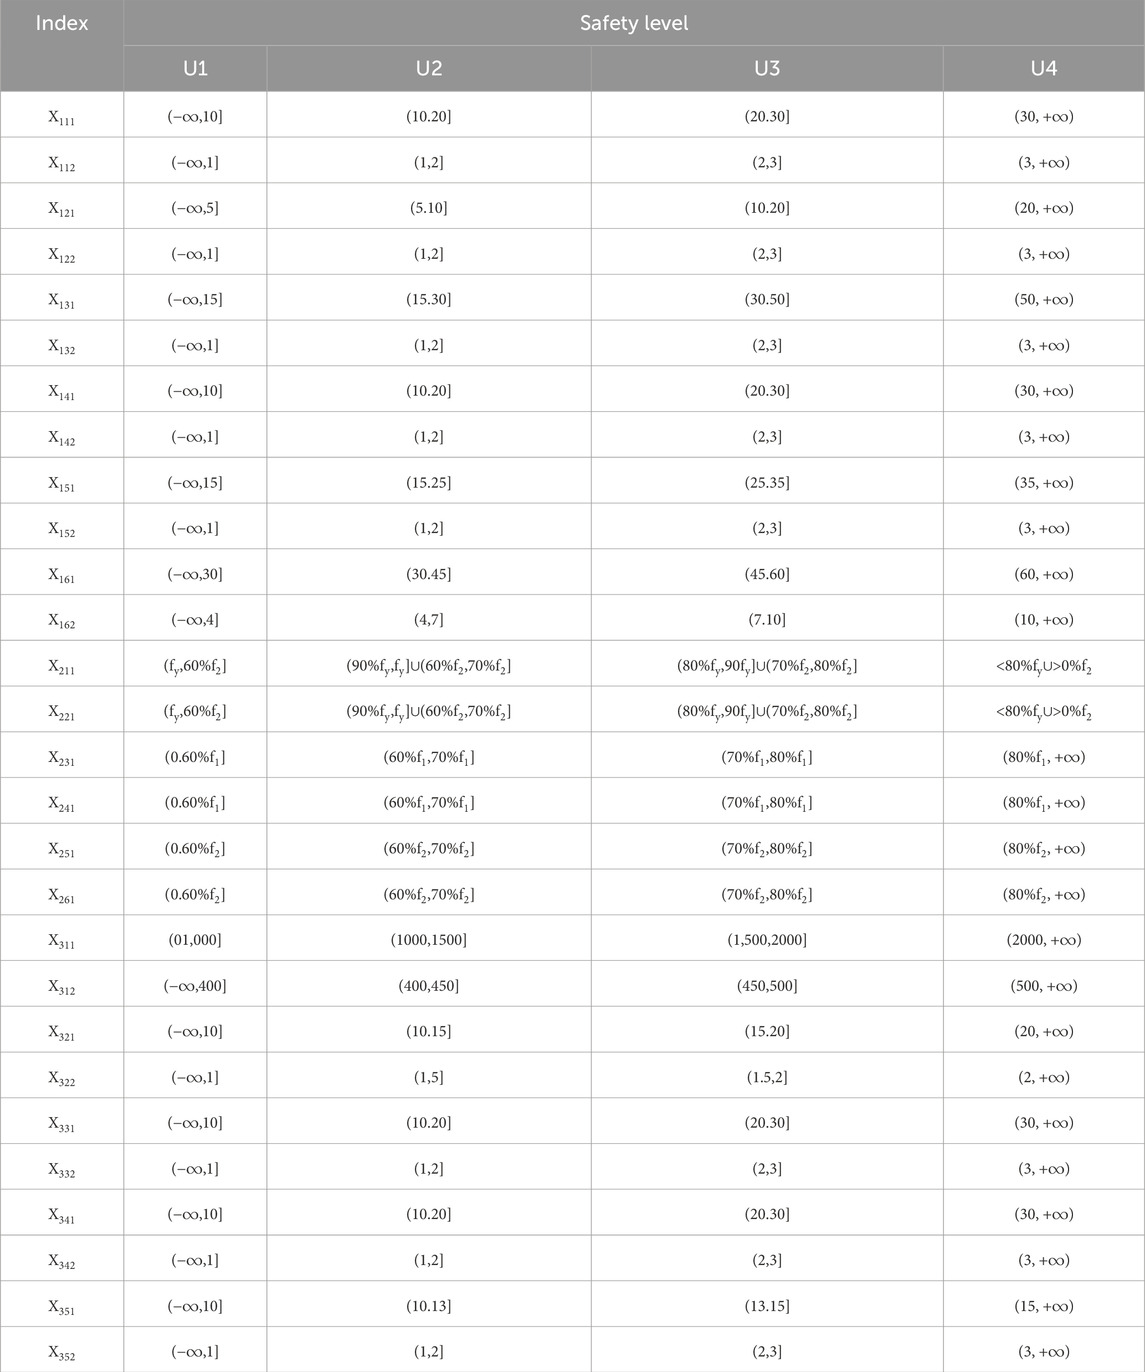
Table 3. Construction safety dynamic assessment index system of deep foundation pit.
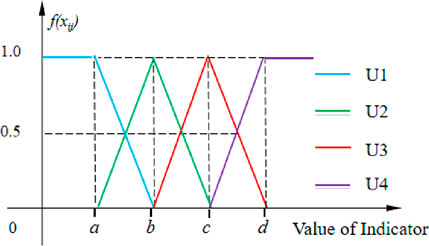
Figure 3. Image of whitening weight function of three-level indicators.
As shown in the figure, the whitening weight function graph of grey clustering theory visually represents how indicator values are mapped to assessment levels, with the horizontal axis denoting indicator values and the vertical axis
3.3 Establishing the dynamic safety assessment model
Based on the determination of the assessment index system and the weight coefficient calculation method, this paper integrates grey clustering theory to establish a dynamic safety assessment model for deep foundation pit construction as shown in Figure 4. The model combines quantitative and qualitative analyses and relies on real-time monitoring data to dynamically assess the safety status of deep foundation pit construction through grey clustering analysis. It aims to effectively integrate data from multiple sources and expert knowledge, providing a comprehensive dynamic assessment of foundation pit safety through scientific weight allocation and clustering analysis.
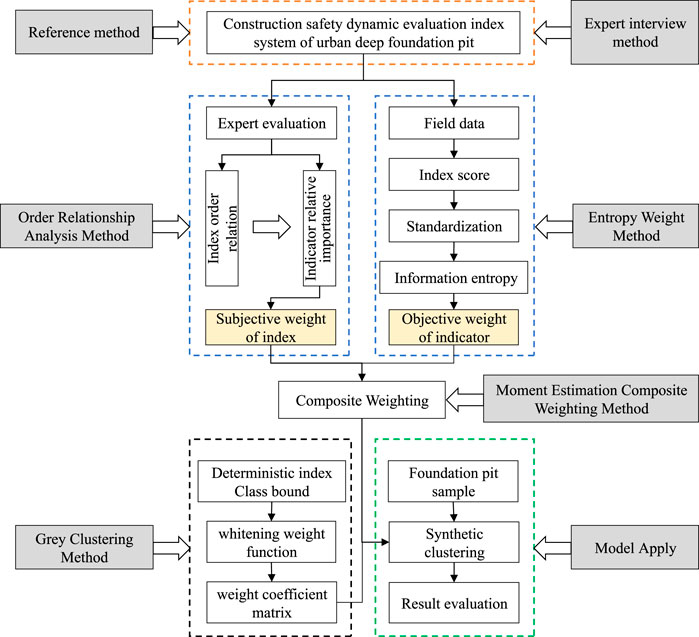
Figure 4. Construction dynamic safety assessment model of deep foundation pit.
The innovative aspect of this model lies in its integration of both quantitative and qualitative analyses, subjective and objective weight allocation, and the application of grey clustering theory to address the complex and variable environment of foundation pit construction and the uncertainty of monitoring data. By leveraging this model, accurate, real-time dynamic assessments of deep foundation pit construction safety can be achieved, providing robust support for risk management and decision-making in the construction process.
Compared to existing methods, our framework offers distinct advantages. Unlike FAHP, which relies on subjective expert judgment, our composite weighting method dynamically balances subjective and objective inputs, enhancing objectivity. In contrast to SVM, which requires large, clean datasets, grey clustering handles incomplete or uncertain data inherent in foundation pit monitoring. Furthermore, our comprehensive three-level index system integrates deformation, internal forces, and environmental factors, addressing the narrow indicator focus of prior studies. These advancements position our framework as a robust tool for real-time, data-driven safety assessment in deep foundation pit construction.
To prevent the distortion that a single indicator might cause in the dynamic safety assessment results of the foundation pit, it is necessary to combine the assessment with the prominent primary factor method. Specifically, if any single dynamic monitoring data of the foundation pit exceeds the extreme value of the dangerous situation, the weight of that assessment factor is stipulated to be 1, and the weights of other factors are set to 0. The risk value is then calculated to determine the current danger level of the pit. If none of the deep foundation pit assessment indicators exceed the extreme values of the dangerous situation, proceed to the dynamic safety assessment calculation process. This involves using the assessment index system and the composite weighting values to conduct a dynamic safety assessment calculation for the deep foundation pit construction.
4 Case study
4.1 Project overview
The Luotian-Tiegang Reservoir water diversion tunnel is an important large-scale water conservancy project in Shenzhen (Figure 5), with a designed capacity of 2.6 million cubic meters per day. The main task of the project is to reasonably distribute and use the water from the West River in Shenzhen, optimize the allocation of new foreign water, ensure water supply to the western area of Shenzhen, and meet the long-term urban living and production water needs of Bao’an District and part of Nanshan District. The whole line of the project is located in Bao’an District and Guangming District in the west of Shenzhen, with a total length of 21.68 km and a cross-section diameter of 5.2 m. The main line includes three working diversion shafts, each with an outer diameter exceeding 30 m and a depth of over 60 m.
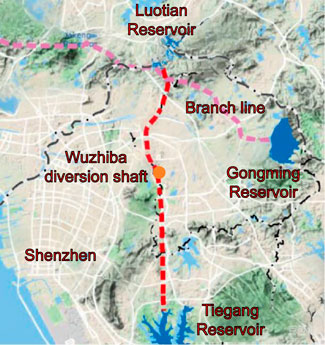
Figure 5. Project routing diagram.
A dynamic assessment will be conducted on the Wuzhiba diversion shaft, which features the most complex geological conditions. The Wuzhiba diversion shaft is classified as a first-class ultra-deep circular foundation pit, with a final excavation depth of 72.5 m and an internal diameter of 42.4 m (Figure 6).

Figure 6. Bird-view of the excavated deep shaftLife Science Identifiers.
4.1.1 Geological conditions
The site is located in the western part of Shenzhen, consisting primarily of plain fill, gravelly clay, and granite. The soil profile consists of several distinct layers. Gravel clay at the surface extends to a depth of 12 m, characterized by low density and cohesion which could influence surface stability and water infiltration rates. Heavily weathered granite starts from 12 m down to 33 m, where the rock has degraded substantially, impacting its structural integrity and load-bearing capacity. Between 35.5 and 69.5 m, the fractured rock mass zone contains fragmented rock that could pose challenges for excavation construction. Aeolian granite below 69.5 m is less weathered, offering better stability. Based on the results of exploration and testing, combined with the experience of related local projects, the different mechanical and physical parameters of each soil layer are depicted in Table 4. The geological conditions within the pit area are average, with issues such as low strength, significant variations in weathering, and multiple layers of fractured rock.
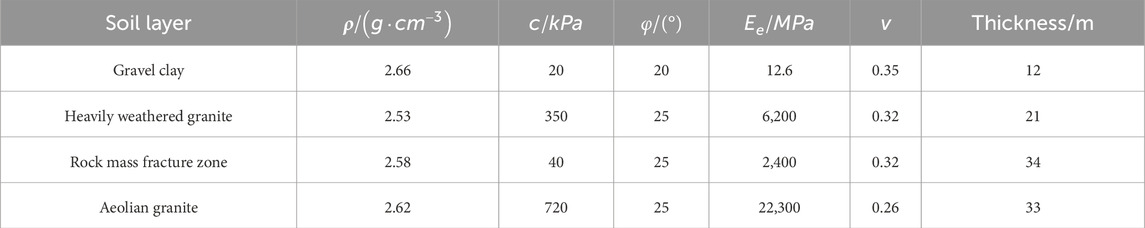
Table 4. Physical and mechanical parameters of soil layer.
4.1.2 Foundation pit excavation and support
In this shaft construction, a 1.2-m-thick diaphragm wall is utilized for retaining structure, but along circumferential direction the wall depths changes with detailed geological conditions, as shown in the layout diagram of the diaphragm wall in Figure 7. The entire diaphragm wall is divided into 30 sections along the circumference. High-pressure jet grouting piles are constructed at the joints of each segment for seepage prevention and reinforcement, with each pile extending 15 m in depth. The shaft will be excavated layer-wises from top to down, and the reinforced concrete shaft walls will be constructed for each newly excavated layer using the bottom-up method. The thickness of the upper part of the lining wall is 1.2 m, which increases to 3 m after reaching the fractured rock layer at a depth of 37.5 m. To ensure the stability and safety of the deep excavation, rock bolts are installed within the fractured rock zones. These bolts, made of HRB400 steel rebar with a diameter of 28mm, are installed at a 15-degree angle to penetrate 6 m depth into the rock, with 2 m spacing in vertical direction. The dimensions of the shaft pit are detailed in Figure 8.
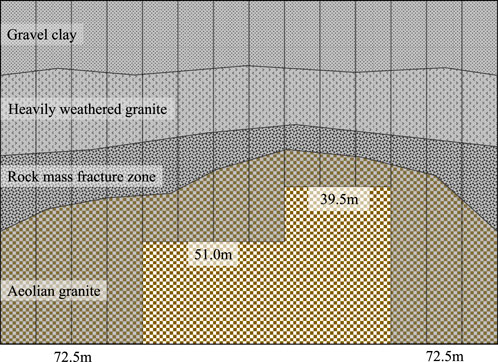
Figure 7. Stratum conditions and diaphragm wall layout.
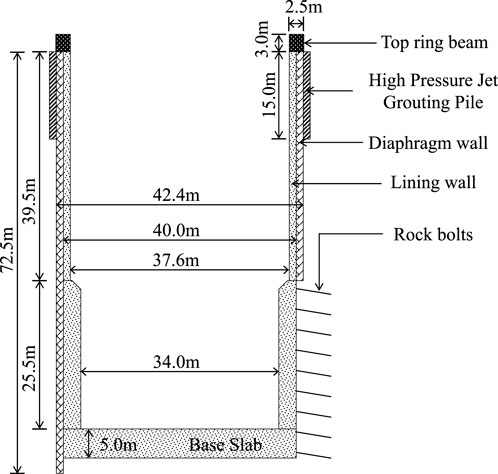
Figure 8. Profile of the shaft foundation pit.
After constructing the diaphragm wall and high-pressure jet grouting piles, excavation of the shaft foundation pit began on 1 May 2023, and the base slab was completed on 24 September 2023, with a total duration of about 147 days. The pit excavation of 75 m deep was divided into 21 layers, with each layer around 3.0 m. Following the excavation of each pit layer, the reinforcement concrete lining was constructed. And the next pit layer excavation was proceeded once the concrete strength (of the previous layer) had reached 80% of the design value, continuing this cycle until reaching the base slab. Specific pit excavation and lining construction parameters are detailed in Table 5.
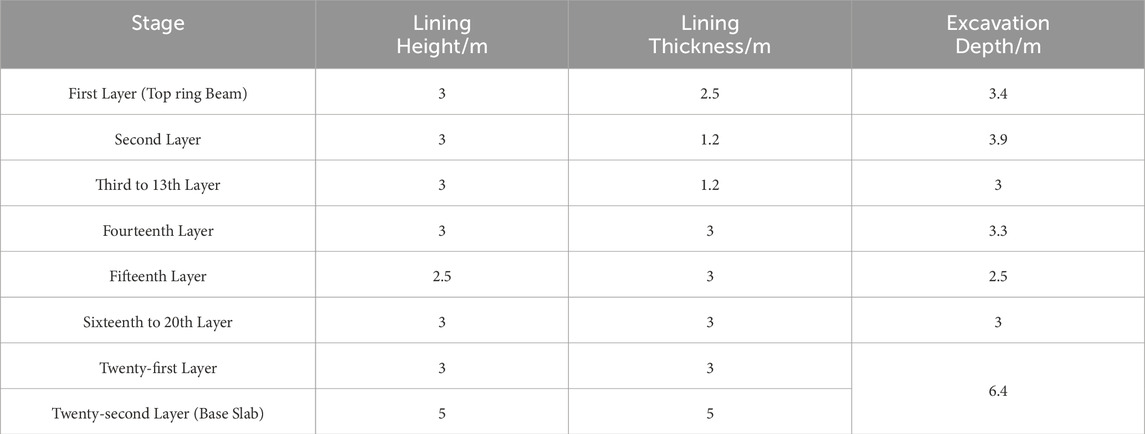
Table 5. Construction parameters at different stages of deep foundation pit.
4.1.3 Monitoring plan and data acquisition
To ensure the safety of the deep shaft foundation pit construction, deformation monitoring is conducted simultaneously. Monitoring lines (L1-L3) are laid out at three different depths of the diaphragm wall, as shown in Figures 9, 10. The full monitoring plan is demonstrated in Figure 11 with details described as below.
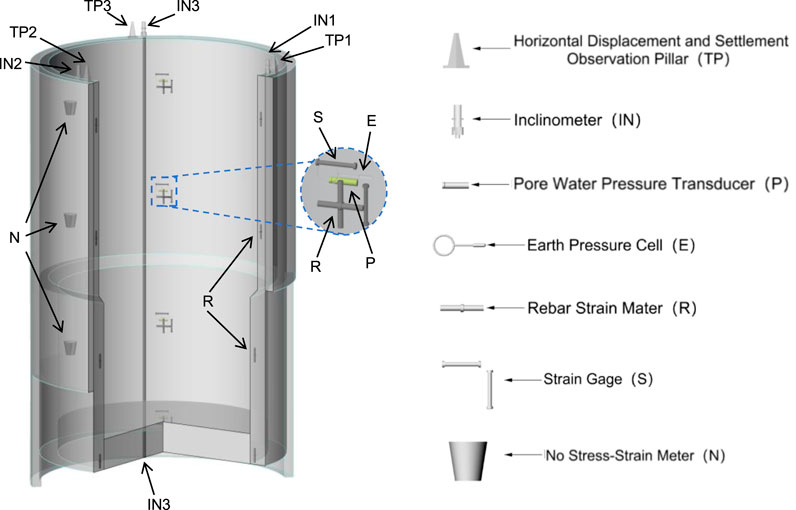
Figure 9. Axonometric view of monitoring facilities.
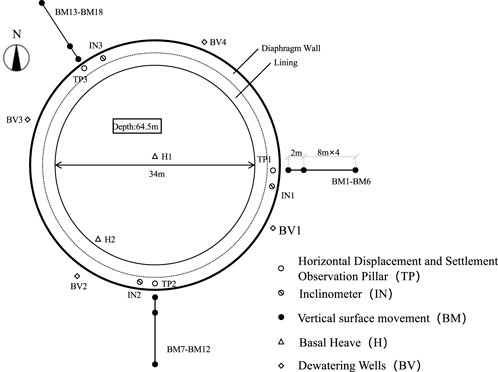
Figure 10. Plan view of monitoring facilities.
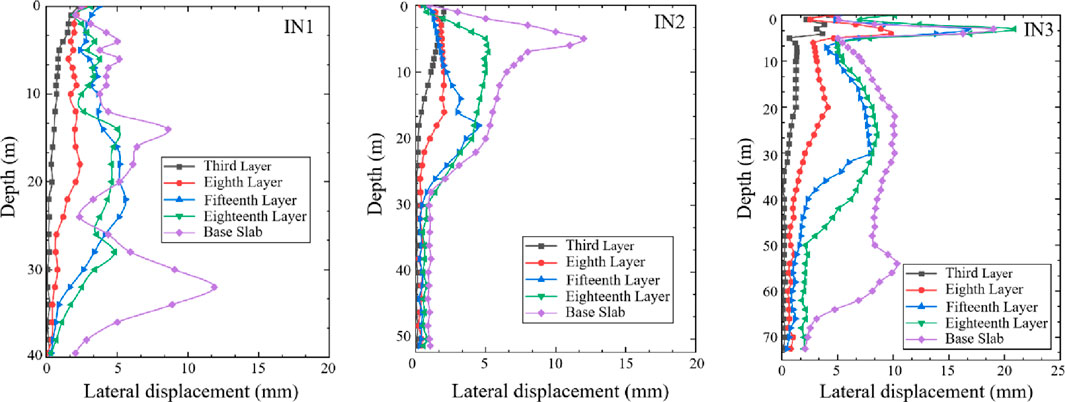
Figure 11. Lateral wall deflection at different excavation stages.
4.1.3.1 Bracing structural deformation indicators
Three observation piers (TP1∼TP3) are set at the top of diaphragm wall to measure the horizontal displacement
4.1.3.2 Structural internal forces indicators
Five monitoring sections are set up on the horizontal plane of the foundation pit, with each section having four embedment depths and the base slab. Strain gauges, stress meters, and stress-free meters are installed on the reinforcement bars inside and outside the diaphragm wall, and at the base slab to monitor the supporting axial force
4.1.3.3 Environmental safety indicators
Groundwater monitoring holes (BV1∼BV4) are arranged outside the foundation pit at every 90° to monitor the changes in groundwater level
The lateral wall displacements from different excavation stages were collected and demonstrated in Figure 11. In Figure 11A, the shortest segment of the diaphragm wall (IN1) exhibits a gradual increase in lateral wall displacement during various excavation stages. This increase predominantly occurs as the wall traverses vertically through gravel clay and heavily weathered granite layers, which, despite their differing mechanical properties, both possess some degree of flexibility and compressibility, effectively dispersing lateral pressure. However, during the baseplate phase, as the wall transitions from heavily weathered granite to aeolian granite, there is a sudden significant increase in displacement. This surge is due to the high elastic modulus and stiffness of aeolian granite, which causes a drastic change in the properties of the soil layers, concentrating stress in this region, coupled with the maximum vertical pressure induced by increased excavation depth, collectively exacerbating the lateral displacement of the wall at this stage.
In Figure 11B, the medium-length diaphragm wall (IN2) shows a lateral wall deflection curve that transitions gradually from being relatively flat to significantly increasing from the early excavation stage to the baseplate phase. Initially, the displacement is minimal, indicating that the wall is well-supported by the upper soil layers. However, as the excavation depth increases, particularly at the onset of the baseplate phase, there is a noticeable surge in the curve, likely due to construction disturbances such as soil excavation and heavy equipment operation, which dynamically impact the wall in the absence of sufficient lower soil support. This change illustrates that the lateral pressure on the wall increases with excavation depth, directly affecting the stability of the wall due to construction activities.
In Figure 11C, the lateral wall deflection of the longest segment of the diaphragm wall demonstrates a trend of gradual increase with excavation depth, with the most significant displacement occurring during the baseplate phase. Notably, significant displacement anomalies at a depth of 2–5 m are especially prominent, primarily due to the installation of a construction pathway on the lining wall in this region of the diaphragm wall. The establishment and use of the construction pathway led to significant construction disturbances, generating intense vibrations and dynamic loads directly near the retaining structure.
This comprehensive analysis reveals that as excavation depth increases, the displacement of the diaphragm walls gradually increases, especially in areas where soil conditions change or construction activities are concentrated.
4.2 Safety assessment results
4.2.1 Weights of indicators
Ten experts evaluated the primary indices of the deep foundation pit construction safety dynamic assessment system using the Delphi method. The indices were ranked in descending order of importance as structural deformation indicators, structural internal forces indicators, and environmental safety indicators. The relative importance levels between adjacent indicators were set as
Onsite monitoring provided data for the assessment system, which was standardized and used to calculate information entropy and objective weights. Finally, combined weights were determined by integrating subjective and objective weights, and the comprehensive weights of tertiary indicators were calculated. The results are summarized in Table 6.

Table 6. Comprehensive weight calculation results of indicators at all levels primary index.
4.2.2 Dynamic safety assessment
Grey clustering analysis is employed to evaluate the current safety level of the foundation pit construction using real-time monitoring data. An assessment matrix is established based on the on-site monitoring data. By substituting the data of the third-level indicators of the foundation pit into the whitening power functions, the weight coefficient matrix is obtained. Ultimately, the level to which the indicator belongs is determined based on the principle of maximum membership degree, as shown in Appendix. By determining the level through the membership degree, we can clearly observe the varying safety conditions of each monitoring indicator.
Three groups of representative monitoring data were selected respectively, analyzed through the dynamic evaluation of deep foundation pit construction safety, and finally selected the safety data collected during the excavation of the eighth layer, the 15th layer and the Twenty-second Layer. These layers correspond to distinct geological formations and have unique characteristics and risks associated with their excavation. The eighth layer is within the heavily weathered granite, the 15th layer is within the rock mass fracture zone, and the base layer reaches down to the aeolian granite.
The excavation of the eighth layer occurs early in the project timeline, a period when the overall pit stability is comparatively high. This layer consists of heavily weathered granite, which is relatively unstable and prone to crumbling. The weathered nature of the granite increases the risk of sudden soil shifts and collapses. The safety level of foundation pit excavated on the eighth layer is obtained by summarizing the data, as shown in Figure 12. During the excavation of this layer, monitoring focused on structural deformation indicators due to the unstable nature of the soil. The safety indices during this phase showed elevated levels of deformation, indicating stress within the excavation walls.
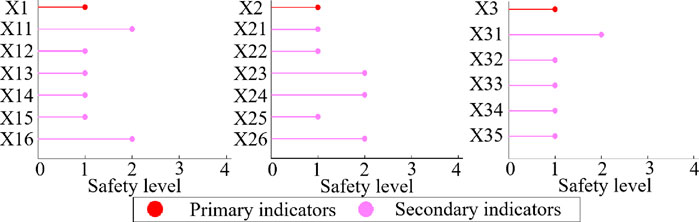
Figure 12. Safety dynamic assessment of the eighth layer excavation.
The eighth layer’s elevated deformation risks are directly linked to the geological properties of heavily weathered granite. This layer’s low stiffness and high compressibility, combined with the transition from initial diaphragm wall support to permanent concrete lining, created stress concentrations. Monitoring data showed cumulative horizontal displacement of 18 mm and lateral wall deflection of 22 mm. These trends align with the layer’s interspersed weathered rock fragments and clay matrix, which reduced load-bearing capacity and amplified deformation under excavation unloading.
The high membership degree value of the top horizontal displacement of the retaining structure (X11) in the safety level U1 indicates that the stability of this indicator is currently good. The membership degree of the deep horizontal displacement (X13) shows that it is mostly in a safe state but with a certain warning trend, suggesting that we need to pay close attention and adjust the support structure in a timely manner. The membership degree analysis of the internal force of the retaining wall (X25) shows that it remains within the safe range in the vast majority of cases, but the membership degree of the warning level should not be ignored, implying that additional monitoring and preventive measures may be needed during the construction process. The high membership degree value of the neighboring building displacement (X33) in U1 provides us with confidence, indicating that the impact of foundation pit construction on the surrounding environment has been effectively controlled.
The 15th layer’s fractured rock zone posed significant challenges due to uneven stress distribution and groundwater infiltration. Monitoring data showed a sudden increase in lateral wall deflection, coinciding with the transition to 3 m-thick lining walls. This structural modification altered load transfer mechanisms, reflected in internal force indicators: supporting axial force increased by 25% compared to the previous layer, while earth pressure reached 72% of design capacity. The fractured zone’s fragmented rock matrix amplified stress concentrations.
The 15th Layer Excavation represents a pivotal stage in the construction process, not only because it lies within a fracture zone but also due to changes in the lining wall thickness and construction methodologies. The rock mass fracture zone is characterized by fragmented rock layers with potential voids and uneven stress distribution. This can lead to unpredictable movements and a higher risk of localized failures. The safety level of foundation pit excavated on the 15th layer is obtained by summarizing the data, as shown in Figure 13.
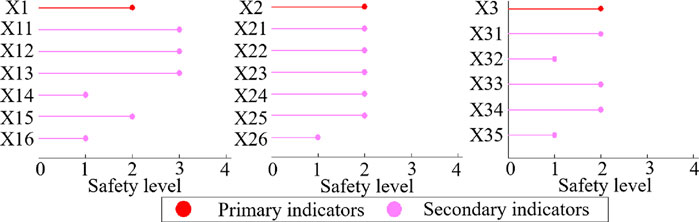
Figure 13. Safety dynamic assessment of the 15th layer excavation.
The 20-s layer is also the excavation of the base slab signifies the conclusion of the pit’s excavation stages. This final layer provides a comprehensive view of the impacts of construction disturbances on the pit’s stability throughout the project. By this stage, the data collected offers a complete picture of how well the excavation and support strategies have performed against initial projections and across varying geological conditions. Monitoring at this depth is crucial for ensuring that the base of the pit remains stable and that any signs of undue stress or deformation can be promptly addressed. Finally, the safety level when the excavation of the foundation pit is completed is shown in Figure 14.
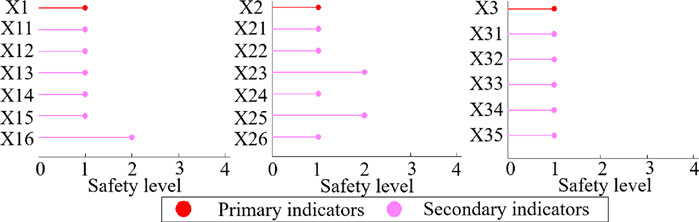
Figure 14. Safety dynamic assessment of the base slab excavation.
4.3 Limitations of this study
In-depth exploration of the effectiveness and application value of the proposed dynamic assessment method for deep foundation pit construction safety, based on gray clustering and moment estimation, leads us to discuss some limitations encountered during the research process. These limitations may include data availability, potential biases in subjective assessments, and the need for further validation in diverse scenarios. Addressing these challenges will be essential for enhancing the robustness and applicability of the proposed methodology.
(1) The safety risk levels established by this research model are based on current regulations used for evaluating deep foundation pit construction safety risks. These regulations often incorporate significant safety margins to ensure absolute project safety, indicating that the assessment method still has room for refinement and enhancement. Further calibration of the model could provide more precise risk assessments tailored to specific project conditions.
(2) In this study, the construction of the whitening weight function in the application of gray clustering analysis primarily relies on data generated from numerical simulations rather than directly sourced from actual engineering monitoring databases. While numerical simulations provide a relatively controlled and systematic environment for testing and validating the assessment method, they may not fully capture the complexities and uncertainties inherent in real-world construction processes. This limitation suggests the need for further integration of field data to enhance the model’s applicability and accuracy.
(3) A notable limitation of this study is the absence of dynamic threshold optimization for monitoring indicators, which could be addressed by integrating data-driven frameworks such as the multi-objective expected value optimization (MEVO) method (Wang et al., 2024). This approach standardizes monitoring data and refines early-warning thresholds through grey relational analysis and Monte Carlo simulations, reducing false alarms and improving risk classification accuracy. For instance, the vertical displacement rate of the retaining structure (X112) could benefit from threshold optimization to better reflect its safety boundaries. Future research should explore this integration to enhance the adaptability of the assessment model under complex geological conditions.
5 Conclusion
This study develops a dynamic safety assessment model for deep foundation pit construction, utilizing a combination of gray clustering and moment estimation weighting. Validation through engineering case studies indicates the model’s strong applicability and accuracy. Key findings include.
(1) A comprehensive three-level safety assessment index system comprising 21 indicators is established, incorporating both subjective and objective weight calculations. The gray clustering algorithm categorizes these indicators into structural, mechanical, and environmental safety aspects;
(2) The model’s reliability is corroborated by comparisons between numerical simulations and on-site monitoring data from a water diversion well project in Shenzhen, demonstrating consistent trends;
(3) The resilience assessment reveals that the foundation pit is currently at level U1, indicating a safe condition that aligns with actual project observations.
This model provides a scientific basis for optimizing construction strategies and formulating effective risk control measures, highlighting its significant contribution to engineering practices.
The study has confirmed the dynamic assessment method’s efficacy for deep foundation pit construction safety and pinpointed areas for future enhancement. Future work should refine safety risk assessment criteria to account for diverse geological and construction factors, promoting more efficient resource use. Additionally, it is essential to gather more real-world engineering data to enhance the accuracy and applicability of the assessment models.
Data availability statement
The original contributions presented in the study are included in the article/supplementary material, further inquiries can be directed to the corresponding authors.
Author contributions
PD: Conceptualization, Methodology, Writing – original draft, Writing – review and editing. ZL: Conceptualization, Investigation, Methodology, Resources, Writing – original draft, Writing – review and editing. DZ: Data curation, Writing – original draft. HL: Data curation, Validation, Writing – original draft. ZC: Investigation, Software, Validation, Writing – original draft. LC: Formal Analysis, Project administration, Writing – original draft. YL: Investigation, Project administration, Writing – original draft.
Funding
The author(s) declare that no financial support was received for the research and/or publication of this article.
Conflict of interest
Authors PD, DZ, HL, LC, and YL were employed by Sinohydro Bureau 14 Co., Ltd.
The remaining authors declare that the research was conducted in the absence of any commercial or financial relationships that could be construed as a potential conflict of interest.
Generative AI statement
The author(s) declare that no Generative AI was used in the creation of this manuscript.
Publisher’s note
All claims expressed in this article are solely those of the authors and do not necessarily represent those of their affiliated organizations, or those of the publisher, the editors and the reviewers. Any product that may be evaluated in this article, or claim that may be made by its manufacturer, is not guaranteed or endorsed by the publisher.
References
Ahn, B. S. (2011). Compatible weighting method with rank order centroid: maximum entropy ordered weighted averaging approach. Eur. J. operational Res. 212 (3), 552–559. doi:10.1016/j.ejor.2011.02.017
Akih-Kumgeh, B. (2016). Toward improved understanding of the physical meaning of entropy in classical thermodynamics. Entropy 18 (7), 270. doi:10.3390/e18070270
Bao, X., Huang, J., Shen, J., Wu, X., Wang, T., Chen, X., et al. (2025). A novel method of void detection in rebar-affected areas based on transfer learning and improved YOLOv8. Tunn. Undergr. Space Technol. 158, 106440. doi:10.1016/j.tust.2025.106440
Bao, X., Li, J., Shen, J., Chen, X., Zhang, C., and Cui, H. (2025). Comprehensive multivariate joint distribution model for marine soft soil based on the vine copula. Comput. Geotechnics 177, 106814. doi:10.1016/j.compgeo.2024.106814
Bao, X., Yuan, H., Shen, J., Liu, C., Chen, X., and Cui, H. (2024). Numerical analysis of seismic response of a circular tunnel-rectangular underpass system in liquefiable soil. Comput. geotechnics 174, 106642. doi:10.1016/j.compgeo.2024.106642
Chen, K., Chen, P., Yang, L., and Jin, L. (2019). Grey clustering evaluation based on AHP and interval grey number. Int. J. Intelligent Comput. Cybern. 12 (1), 127–137. doi:10.1108/ijicc-04-2018-0045
Chen, X., Shen, J., Bao, X., Wu, X., Tang, W., and Cui, H. (2023). A review of seismic resilience of shield tunnels. Tunn. Undergr. Space Technol. 136, 105075. doi:10.1016/j.tust.2023.105075
Chin, Y., Shen, S., Zhou, A., and Chen, J. (2019). Foundation pit collapse on 8 june 2019 in nanning, China: a brief report. Safety 5, 68. doi:10.3390/safety5040068
Feng, S. J., and Lu, S. F. (2016). Failure of a retaining structure in a metro station excavation in Nanchang City, China. J. Perform. Constr. Facil. 30 (4), 04015097. doi:10.1061/(asce)cf.1943-5509.0000855
Gong, X. N., and Zhang, X. C. (2012). Excavation collapse of Hangzhou subway station in soft clay and numerical investigation based on orthogonal experiment method. J. Zhejiang Univ. Sci. A 13 (10), 760–767. doi:10.1631/jzus.a1200120
Li, B., Lin, Z., Chen, Y., Xu, C., Li, P., and Ding, H. (2023). Numerical analysis for supporting and deformation of complex foundation pit groups in unstable areas of karst strata. Front. Earth Sci. 11, 1283184. doi:10.3389/feart.2023.1283184
Li, C., Chen, K., and Xiang, X. (2015). An integrated framework for effective safety management evaluation: application of an improved grey clustering measurement. Expert Syst. Appl. 42 (13), 5541–5553. doi:10.1016/j.eswa.2015.02.053
Li, D., Liao, F., Wang, L., Lin, J., and Wang, J. (2024). Multi-stage and multi-parameter influence analysis of deep foundation pit excavation on surrounding environment. Buildings 14 (1), 297. doi:10.3390/buildings14010297
Li, X., Hipel, K. W., and Dang, Y. (2015). An improved grey relational analysis approach for panel data clustering. Expert Syst. Appl. 42 (23), 9105–9116. doi:10.1016/j.eswa.2015.07.066
Liu, S., and Yang, Y. (2017). Explanation of terms of grey clustering evaluation models. Grey Syst. Theory Appl. 7 (1), 129–135. doi:10.1108/gs-11-2016-0046
Liu, W., Zhang, J., Jin, M., Liu, S., Chang, X., Xie, N., et al. (2017). Key indices of the remanufacturing industry in China using a combined method of grey incidence analysis and grey clustering. J. Clean. Prod. 168, 1348–1357. doi:10.1016/j.jclepro.2017.09.078
Lv, Y., Jiang, Y., Hu, W., Cao, M., and Mao, Y. (2020). A review of the effects of tunnel excavation on the hydrology, ecology, and environment in karst areas: current status, challenges, and perspectives. J. Hydrology 586, 124891. doi:10.1016/j.jhydrol.2020.124891
Ministry of Housing and Urban-Rural Development of the People’s Republic of China (2019). Technical code for construction safety of deep building foundation excavations; jgj311-2013. Beijing, China: China Architecture and Building Press, 4.
Ministry of Housing and Urban-Rural Development of the People’s Republic of China (2019). Technical specification for retaining and protection of building foundation excavations; jgj120-2012. Beijing, China: China Architecture and Building Press, 6.
Ministry of Housing and Urban-Rural Development of the People’s Republic of China (2019). Technical Standard for Monitoring of building excavation engineering; GB 50497-2019. Beijing, China: China Plans Publishing House, 34–36.
Pearson, K. (1936). Method of moments and method of maximum likelihood. Biometrika 28 (1/2), 34–47. doi:10.1093/biomet/28.1-2.34
Qiao, Y., Xie, F., Bai, Z., Lu, J., and Ding, W. (2024). Deformation characteristics of ultra-deep circular shaft in soft soil: a case study. Undergr. Space 16, 239–260. doi:10.1016/j.undsp.2023.09.006
Shen, J., Bao, X., Chen, X., Wu, X., Qiu, T., and Cui, H. (2025). Seismic resilience assessment method for tunnels based on cloud model considering multiple damage evaluation indices. Tunn. Undergr. Space Technol. 157, 106360. doi:10.1016/j.tust.2024.106360
Shen, J., Bao, X., Li, J., Chen, X., and Cui, H. (2025). Study on the mechanism of EPWP dissipation at the joints of shield tunnel in liquefiable strata during seismic events. Soil Dyn. Earthq. Eng. 188, 109089. doi:10.1016/j.soildyn.2024.109089
Sun, Z., Li, H., Bao, Y., Meng, X., and Zhang, D. (2023). Intelligent risk prognosis and control of foundation pit excavation based on digital twin. Buildings 13 (1), 247. doi:10.3390/buildings13010247
Tan, Y., Lu, Y., and Wang, D. (2023). Interactive behaviors of four closely spaced mega excavations in soft clays: case study on an excavation group in Shanghai, China. Tunn. Undergr. Space Technol. 138, 105186. doi:10.1016/j.tust.2023.105186
Wang, X., Pan, Y., Li, M., and Chen, J. (2024). A novel data-driven optimization framework for unsupervised and multivariate early-warning threshold modification in risk assessment of deep excavations. Expert Syst. Appl. 238, 121872. doi:10.1016/j.eswa.2023.121872
Wei, D., Xu, D., and Zhang, Y. (2020). A fuzzy evidential reasoning-based approach for risk assessment of deep foundation pit. Tunn. Undergr. Space Technol. 97, 103232. doi:10.1016/j.tust.2019.103232
Wooldridge, J. M. (2001). Applications of generalized method of moments estimation. J. Econ. Perspect. 15 (4), 87–100. doi:10.1257/jep.15.4.87
Wu, B., Zeng, J., Zhu, R., Yang, F., Liu, C., and Xie, Y. (2024). A collapse risk assessment method for subway foundation pit based on cloud model and improved Dempster–Shafer evidence theory. Sci. Rep. 14 (1), 2653. doi:10.1038/s41598-024-52643-x
Wu, R. M., Zhang, Z., Yan, W., Fan, J., Gou, J., Liu, B., et al. (2022). A comparative analysis of the principal component analysis and entropy weight methods to establish the indexing measurement. PloS one 17 (1), e0262261. doi:10.1371/journal.pone.0262261
Xu, J., and Wang, Y. (2022). Stability analysis and support design methods for rock foundation pit with combination of structural plane and karst cave. Adv. Civ. Eng. 2022 (1), 5662079. doi:10.1155/2022/5662079
Xu, Q., Xie, J., Zhu, H., and Lu, L. (2024). Supporting behavior evolution of ultra-deep circular diaphragm walls during excavation: monitoring and assessment methods comparison. Tunn. Undergr. Space Technol. 143, 105495. doi:10.1016/j.tust.2023.105495
Ye, F., Sun, J., Wang, Y., Nedjah, N., and Bu, W. (2023). A novel method for the performance evaluation of institutionalized collaborative innovation using an improved G1-CRITIC comprehensive evaluation model. J. Innovation and Knowl. 8 (1), 100289. doi:10.1016/j.jik.2022.100289
Ye, S., Zhao, Z., and Wang, D. (2021). Deformation analysis and safety assessment of existing metro tunnels affected by excavation of a foundation pit. Undergr. Space 6 (4), 421–431. doi:10.1016/j.undsp.2020.06.002
Zhao, J., Tan, Z., Yu, R., Li, Z., Zhang, X., and Zhu, P. (2022). Deformation responses of the foundation pit construction of the urban metro station: a case study in Xiamen. Tunn. Undergr. Space Technol. 128, 104662. doi:10.1016/j.tust.2022.104662
Zhou, Y., Li, S., Zhou, C., and Luo, H. (2019). Intelligent approach based on random forest for safety risk prediction of deep foundation pit in subway stations. J. Comput. Civ. Eng. 33 (1), 05018004. doi:10.1061/(asce)cp.1943-5487.0000796
Keywords: deep foundation pit, monitoring data, dynamic safety assessment, grey clustering theory, composite weights
Citation: Dang P, Li Z, Zou D, Li H, Cheng Z, Chang L and Lu Y (2025) Monitoring data-driven dynamic safety assessment framework for deep foundation pit construction based on grey clustering and moment method. Front. Earth Sci. 13:1583402. doi: 10.3389/feart.2025.1583402
Received: 25 February 2025; Accepted: 10 April 2025;
Published: 30 April 2025.
Edited by:
Tongming Qu, Hong Kong University of Science and Technology, Hong Kong SAR, ChinaCopyright © 2025 Dang, Li, Zou, Li, Cheng, Chang and Lu. This is an open-access article distributed under the terms of the Creative Commons Attribution License (CC BY). The use, distribution or reproduction in other forums is permitted, provided the original author(s) and the copyright owner(s) are credited and that the original publication in this journal is cited, in accordance with accepted academic practice. No use, distribution or reproduction is permitted which does not comply with these terms.
*Correspondence: Zeliang Li, NTI1MDY1MzU1QHFxLmNvbQ==