Abstract
Introduction:
With the development of complex tight sandstone oil and gas reservoirs, accurately and cost-effectively characterizing these reservoirs have become a critical yet challenging task. To address the limitations of conventional machine learning algorithms, which have low accuracy due to data inhomogeneity and weak fluid logging responses, this study introduces a novel method for fluid logging evaluation in dual-medium tight sandstone gas reservoirs.
Methods:
The method integrates core, thin section, and scanning electron microscope observations, taking into account the effect of fractures.
Results:
Reservoirs are divided into three types: fractured reservoirs (FR), porous reservoirs (PR), and microfracture-pore composite reservoirs (MPCR), highlighting the distinct fluid logging responses of each type. Reservoir classification based on geological genetic mechanism significantly reduces data noise and prediction ambiguity, thereby improving the efficiency of model training.
Discussion:
The final model is constructed by an ensemble method that integrates multiple sub-models, including fuzzy C-means clustering (FCM), gradient boosting decision tree (GBDT), backpropagation neural network (BPNN), random forests (RF), and light gradient boosting machines (LightGBM). Applied to the West Sichuan Depression in the Sichuan Basin, the model validation accuracy reached 91.96%. In summary, this novel and reliable method for log fluid prediction, significantly improved its accuracy and robustness compared with single models and traditional methods, providing a comprehensive perspective across geological and geophysical disciplines for fluid logging evaluation in dual-medium tight sandstone gas reservoirs.
1 Introduction
In the past 2 decades, tight sandstone gas reservoirs have been extensively studied and commercially developed worldwide (Desbois et al., 2011; Zou et al., 2012; Kadkhodaie et al., 2021; Ortiz-Orduz et al., 2021; Wang W. et al., 2023), including major sedimentary basins in North America, such as the Alberta Basin in Canada (Friesen et al., 2017), the Williston, San Juan, and Appalachian Basins (Law, 2002; Hart, 2006; Ma et al., 2016), and key Chinese basins, such as the Sichuan, Ordos, Songliao, Tarim, and Bohai Bay Basins (Yue et al., 2018; Zhu et al., 2019; Liu et al., 2024). Fluid identification has emerged as a critical yet challenging aspect in current studies of tight sandstone gas reservoir heterogeneity (Hua et al., 2024; Zhang et al., 2024). A variety of methods have been developed for fluid characterization, including core analysis, well logging interpretation, and seismic data evaluation techniques (Hu et al., 2023; Huang et al., 2024). Well logging methods offer an efficient and cost-effective way to identify fluid types in tight sandstone gas reservoirs without the need for extensive coring or well testing (Shedid and Mohamed, 2017; Li et al., 2022). However, the combination of ultra-low porosity, permeability, inhomogeneous fracture distribution, and complex storage space makes it difficult to predict fluids in tight sandstone gas reservoirs using logging data (Lai et al., 2018; Pan et al., 2024). This is especially true in tight reservoirs with complex gas-water combination patterns, where the difficulty of logging identification of gas and water is even more difficult (Kim et al., 2023; Li Q. et al., 2024a; Li et al., 2025).
Various well logging identification methods have been developed to effectively characterize tight sandstone gas reservoirs, including conventional methods such as petrophysics templates and cross-plot analysis derived from core or log responses, and non-cable logging techniques such as array acoustic wave and nuclear magnetic resonance (NMR) logging (Tang et al., 2017; Chen et al., 2020; Lai et al., 2024). However, each method faces different challenges: conventional methods are often prone to human bias, time-consuming, and limited by data with low signal-to-noise ratios and strong nonlinearity (Deng et al., 2017; He et al., 2020), while non-cable logging techniques can mitigate some of these drawbacks yet still encounter major hurdles, including relatively high costs, complex data processing, intricate petrophysical model construction, and low computational accuracy (Saboorian-Jooybari et al., 2016; Fan et al., 2019; Wu et al., 2024), ultimately hampering their broader application in oilfields. A tight sandstone dual-medium reservoir, also known as a fracture-pore type reservoir, is characterized by a complex network of pores and fractures that serve as the primary storage and flow channels for fluids, respectively (Zhang et al., 2014). Identifying gas and water in dual-medium tight sandstone gas reservoirs using logging techniques is even more challenging because of the interaction between pores and fractures (Li Q. et al., 2024b), yet this step is critical for the economic and effective development of tight sandstone gas.
Intelligent methods, such as discriminant analysis (Cui et al., 2017), artificial neural networks (Tian et al., 2024), and support vector machines (SVM) (Ao et al., 2019), have been successfully applied to assist interpreters, thereby reducing interpretation costs and improving analysis efficiency. Although these methods often yield promising results, they remain constrained by challenges such as limited training samples, hyperparameter selection, and poor generalization performance of individual machine learning models (Al-Mudhafar, 2017; Sun et al., 2020; Wood, 2020). Driven by advances in model fusion technology, ensemble learning has emerged as a powerful method that integrates multiple models and significantly improves overall prediction performance (Wolpert, 1992; Abba et al., 2022; Xiong et al., 2024). This method has been extensively utilized in fluid prediction in tight sandstone gas reservoirs, where its capability to integrate advantages of multiple model has been proven to be highly effective in addressing complex fluid prediction challenges (Abuzeid et al., 2025; Wang et al., 2024a, Wang et al., 2024b). However, there are significant differences in fluid features between different reservoir types, and improving the prediction accuracy of ensemble learning models for dual-medium complex reservoirs remains a significant challenge. Reservoir classification enables the model to focus on the gas and water features of a specific reservoir type, thereby reducing the information interference caused by the mixing data from multiple reservoir types and significantly improving prediction accuracy (Szabó et al., 2023; Michael, 2024).
This research introduces a novel method for gas and water identification in dual-medium tight sandstone gas reservoirs, taking the tight sandstone of the Second Member of the Xujiahe Formation in the Western Sichuan Depression, Sichuan Basin as an example. The method reconstructs multiple gas-sensitive parameters using conventional and specialized logging data, thereby effectively improving the logging response of fluids. Additionally, a stacking ensemble machine learning approach is used to improve prediction efficiency and effectiveness, and reservoir classification based on geological genetic mechanisms plays a critical role in reducing data noise and minimizing prediction ambiguity, thereby reducing the difficulty of model learning. This innovative approach offers an efficient and reliable method for improving fluid prediction through well-log analysis in dual-medium tight sandstone gas reservoirs. Moreover, it integrates geological and geophysical perspectives to provide a comprehensive framework for fluid evaluation in complex reservoir environments.
2 Geological setting
The Sichuan Basin, situated in the northwest of the Yangtze Craton, is one of the most significant gas-producing regions in China (Figure 1A) (Yue et al., 2018). The Western Sichuan Depression (WSD) is located in the northwestern part of the Sichuan Basin and consists of six structural units: the Chengdu sag, the Zitong sag, the Longmenshan front thrust belt, the Zhixinchang structural belt, the Zhongjiang-Huilong structural belt, and the Xinchang structural belt (Figure 1B) (Wang et al., 2020). The Xinchang structural belt, the focus of this study, lies in the central-north of the WSD. This anticline has a nearly east-west major axis and is characterized by numerous faults (Figure 1C). These faults are primarily reverse faults caused by regional compressional stress and are classified according to age and size. Early east-west faults formed the anticline of the Xinchang structural belt, while later south-north faults divided it into tectonic units. These faults play a critical role in fracture development and high gas yield in the study area.
FIGURE 1

Tectonic location and features of the study area in the Sichuan Basin. (A) Overview map showing the regional location of the Sichuan basin in China. (B) Tectonic divisions of the Western Sichuan Basin, with the study area (blue square) highlighting the focus region for this research (Wu et al., 2021; Yue et al., 2018). (C) Well site distribution and hierarchical evaluation of T3x2 faults in the Xinchang structural belt (Liu et al., 2023).
The Xujiahe Formation in the Xinchang Tectonic Belt is divided into 10 sand groups (Tx21-Tx210), each corresponding to 1–2 short-term cycles (Figure 2). Among them, the T3x2 Group is the target interval for this study. The sedimentary system of the T3x2 Group consists of underwater distributary channels and mouth bars within a braided river delta front, with a formation thickness of 400–700 m (Liu et al., 2020). Hydrodynamic energy reached its peak during the mid-depositional stage of the T3x2 Group, and medium to coarse-grained sandstones were predominantly found in the middle and upper parts of the interval. The channels formed in different periods overlapped with each other, resulting in vertically stacked and laterally interbedded sand bodies (Gou et al., 2024; Li et al., 2024). The intense structural and diagenetic processes have complicated the distribution of tight sandstone gas reservoirs, which are characterized by extremely low porosity (average matrix porosity 3.4%) and ultra-low permeability (average matrix permeability 0.07 × 10⁻³ μm2).
FIGURE 2

Comprehensive stratigraphic column of the second member of the Xujiahe formation in the Xinchang area, illustrating the stratigraphic section, lithology, sedimentary facies of its 10 gas-bearing sand groups (Tx21–Tx210), percentage of medium-coarse grained sandstone, and hydrodynamic energy (modified from Liu et al., 2020).
3 Datasets, methods, and workflow
3.1 Dataset and methods
A total of 724 m of cores from 24 exploration wells (Figure 1C) in the study area were systematically logged and photographed. Due to the complex geological structure and extensive fractures in the study area, sampling was focused on lithofacies with distinct physical properties to capture the variations in different reservoir types. Helium porosity and air permeability were measured on representative core plugs, while mercury intrusion was used to characterize pore structures. Thin sections were impregnated with blue epoxy to identify open pores and fractures and stained with Alizarin Red S and potassium ferricyanide to identify carbonate minerals. Microscopic examination of these thin sections utilized standard petrographic techniques, including plane-polarized light (PPL), where light passes through a single polarizer allowing observation of mineral relief, shape, cleavage, and pleochroism. Point counting on thin sections was performed to analyze mineral texture, composition, and content. Scanning electron microscopy (SEM) was used to investigate mineralogy, pore types and mineral dissolution (e.g., feldspars and rock fragments). The conventional logging dataset includes natural gamma-ray (GR), acoustic (AC), deep lateral resistivity (RD), shallow lateral resistivity (RS), compensated neutron porosity (CNL), maximum horizontal stress (σH), and minimum horizontal stress (σh). However, the extensive fractures have caused distortions in certain conventional logging parameters, such as hole diameter (CAL) and density (DEN), and therefore they were excluded from this study. It should be noted that all wells were equipped with conventional logging data. Beyond that, imaging logging data, specifically the formation micro scanner image (FMI), were utilized for wells X3 and XS204H. In addition, single-well production test data from all production wells, including gas and water production rates, open-flow capacity, and final test conclusions regarding fluid type, were also integrated into the comprehensive analysis.
Fluid typing of every layer is the main target of log interpretation in tight sandstone gas reservoirs in study area. The types of fluid in the layers are usually defined and classified using the layer production data. For gas reservoirs, the types of layers are the gas layer, poor-gas layer, gas-water layer, water layer, and dry layer, which are defined in Table 1.
TABLE 1
| Fluid types | Production description |
|---|---|
| Gas | Gas is dominated, and no water or and the water cut is low than 10% |
| Poor-gas | Gas is present but in low quantities, with the gas production rate being significantly low, and the water cut low than 10% |
| Gas-water | Both gas and water are produced, and the water cut is from 10% to 90% |
| Water | A little gas is produced and water is dominated, and the water cut is higher than 90%, or no gas product and only water is produced |
| Dry | A little fluid is produced, or no fluid is produced |
Fluid types of the tight sandstone gas reservoirs in the Western Sichuan Basin (Tan et al., 2020).
3.2 Conventional machine learning algorithms
This study utilizes several well-established machine learning algorithms for the construction of integrated frameworks, including fuzzy C-means clustering (FCM), gradient boosting decision tree (GBDT), back propagation neural networks (BPNN), random forests (RF), and light gradient boosting machines (LightGBM). FCM performs soft clustering by assigning membership degrees for each data point to multiple clusters, minimizing an objective function based on weighted distances (Wu et al., 2023). BPNN are feedforward artificial neural networks trained using the backpropagation algorithm, which iteratively adjusts network weights by propagating error gradients backward from the output layer (Wang et al., 2023a; Wang et al., 2023b). RF constructs a multitude of decision trees on bootstrapped data subsets and random feature selections, aggregating their predictions for improved robustness and accuracy (Zhao et al., 2024). GBDT builds trees sequentially, where each new tree attempts to correct the residual errors made by the previous ensemble, optimizing a loss function using gradient descent (Liu and Liu, 2021). LightGBM is a highly efficient implementation of GBDT that employs techniques like gradient-based one-side sampling (GOSS) and exclusive feature bundling (EFB) to accelerate training speed and reduce memory consumption, particularly on large datasets (Yang et al., 2025).
3.3 Integrated workflow
To address the challenges faced by conventional machine learning algorithms, including low accuracy resulting from high data heterogeneity and weak fluid logging responses, our proposed fluid logging evaluation method for dual-medium tight sandstone gas reservoirs integrates the following four key steps: (A) reconstruction and optimization of fluid prediction parameters from the original dataset, (B) reservoir classification based on geological genetic mechanisms, (C) development and implementation of an integrated stacking-based ensemble model, and (D) generation of logging interpretation results (Figure 3).
FIGURE 3

Integrated workflow diagram illustrating the comprehensive methodology for fluid logging identification in dual-medium reservoirs. Four key steps: (A) reconstruction and optimization of fluid prediction parameters from the original dataset, (B) reservoir classification based on geological genetic mechanisms, (C) development and implementation of a stacking-based ensemble model, and (D) generation of logging interpretation results.
The original dataset underwent depth shift correction, data cleaning, and z-score normalization (Zheng et al., 2021), as well as additional preprocessing steps to ensure accurate core-log calibration (Figure 3A). The production data from actual wells were carefully selected, excluding samples that were tested uniformly throughout the entire wells or across multiple formations. These preprocessing steps effectively reduced errors and improved the reliability of the log samples. Effective feature selection is critical to improve prediction accuracy, and hybrid feature selection methods represent a state-of-the-art approach (Ebrahimi Warkiani and Moattar, 2025). This process includes: (i) reconstructing gas- and water-sensitive parameters using mathematical techniques to enrich feature dimensions, (ii) filtering redundant features through Pearson’s correlation coefficient analysis, and (iii) pre-training with BPNN, AdaBoost, and RF to evaluate feature importance, calculate average importance scores, rank features, and retain those above the threshold to form the final feature set.
Based on core observations and FMI image log data, the macroscopic lithological and petrophysical structural differences of the reservoirs were identified. On this basis, core test data, including impregnated thin sections and SEM images, were used to examine the microscopic pore structure differences. By integrating macroscopic and microscopic differences, a classification standard for tight sandstone reservoir types was established (Figure 3B).
Stacking improves prediction accuracy by integrating multiple models, where diverse base learners first capture various aspects of the data (Xiong et al., 2024), and a meta-learner subsequently synthesizes their outputs. The success of stacking depends on ensuring diverse base learners and employing an appropriate ensemble strategy. In this study, the preferred base learners include fuzzy C-means clustering (FCM), gradient boosting decision tree (GBDT), backpropagation neural network (BPNN), random forest (RF), and light gradient boosting machine (LightGBM) (Figure 3C). Each sub-model was selected for its unique strengths and complementary characteristics: FCM for handling fuzzy relationships and providing insight into complex system dynamics; GBDT for effectively boosting weak learners into strong performers with complex, non-linear data relationships; BPNN for its robust pattern recognition capabilities; and RF and LightGBM for their efficiency and reliability when processing large datasets with multiple features. These models collectively reveal data patterns, handle nonlinearities, and approximate complex functions, reducing errors and reinforcing generalization capabilities. Weight allocation for each sub-model is determined through cross-validation, with higher validation accuracy corresponding to greater weight in the final ensemble. Selecting an appropriate meta-learner is essential for optimal performance, as some learners with high error rates can introduce unwanted noise to the model. In practice, Lasso regression is often used because it mitigates overfitting via regularization and exploits sparse feature relationships, resulting in superior prediction accuracy and enhanced generalization. When the analysis of accuracy estimates in K-fold cross validation and non-trained well data meet the predefined threshold, the prediction results are generated and output (Fig. 3D).
4 Results
4.1 Features of reservoir space
The impregnated thin-section and SEM images show that the reservoir space in the target formation exist in the form of primary pores, secondary pores, and fractures. The primary pores are a small amount of residual intergranular pores, primarily located between quartz grains coated with chlorite (Figures 4A, B, G). Some primary intercrystallite micropores are mainly developed in the matrix (Figure 4H). The secondary pore spaces are characterized by intraparticle dissolution pores and interparticle dissolution pores. Intraparticle dissolution pores are mainly formed by the dissolution of feldspar and other clastic components (Figures 4B, C, D, I, J). The extent and distribution of intraparticle pores depend on detrital composition, resulting in uneven pore development. Interparticle dissolution pores are formed during the mid to late stages of diagenesis due to the dissolution of the heterogeneous matrix or cement, typically occurring along the boundaries or edges of mineral grains and exhibiting irregular shapes (Figures 4C, H, I, K). The pore radius of interparticle pores is often larger than that of intraparticle pores. Microfractures are broadly developed, including intragranular fractures and shear fractures. Intragranular fractures occur within crystalline grains and have poor connectivity (Figures 4B, C, I). Shear fractures are often narrow, but can penetrate clastic grains, link throats and pores, and form a network structure that significantly increase the permeability (Figures 4C, E). Under strong stress and dissolution, these fractures may widen, with the largest recorded aperture reaching 0.30 mm (Figure 4F). These microfractures thus provide effective reservoir space and fluid migration pathways.
FIGURE 4

Reservoir space features of the T3x2 Group of the Xinchang area. (A) Chlorite film residual intergranular pores and feldspar intragranular solution pores (PPL image; Well XC12, 4839.48 m; Ф = 6.25%, K = 0.11 mD). (B) Feldspar intragranular dissolution pores grains coated by chlorite films, residual primary intergranular porosity, and intracrystalline fractures within quartz. (PPL image; Well CG561, 4992.67 m; Ф = 10.61%, K = 0.75 mD). (C) Intergranular and intragranular dissolution pores, crystal periphery fractures and quartz intracrystalline fractures (PPL image; Well XS204H, 4608.73 m; Ф = 4.53%, K = 0.33 mD). (D) Intercrystallite dissolution pores are mostly filled with calcite, with only a few intragranular dissolution pores, and widely developed microfractures (PPL image; Well GM2, 5035.98 m; Ф = 2.03%, K = 0.09 mD). (E) Numerous microfractures and intergranular dissolution pores (PPL image; Well XC12, 4820.34 m; Ф = 7.06%, K = 33.37 mD). (F) Wide microfracture, lower part filled by organic matter (PPL image; Well CG561, 5065.54 m). (G) Residual primary intergranular pores (SEM image; Well XC7, 5190.15 m; Ф = 11.67%, K = 0.64 mD). (H) Intergranular dissolution pores and illite intercrystallite micropores (SEM image; Well X3, 4731.06 m; Ф = 2.47%, K = 0.02 mD). (I) Intergranular and intragranular dissolution pores of feldspar (SEM image; Well X10, 4940.01 m; Ф = 5.47%, K = 0.05 mD). (J) Dolomite intragranular dissolution pores and cleavage fractures (SEM image; Well X101, 5041.51 m; Ф = 2.53%, K = 0.02 mD). (K) Intergranular and intragranular dissolution pores, with illite filling the upper right portion (SEM image; Well X101, 5101.02 m; Ф = 3.53%, K = 0.11 mD). (L) Shear fractures (SEM image; Well X5, 5025 m; Ф = 2.68%, K = 3.36 mD). Q = quartz; F = feldspar; L = lithic fragments; Ca = carbonate cement; Ill = illite; Ch = chlorite; Mic = mica; PPL = plane-polarized light; SEM = scanning electron microscope; Ф = helium porosity; K = nitrogen permeability. Red arrows indicate primary intergranular pores; white arrows indicate intergranular dissolution pores; blue arrows indicate intragranular dissolution pores; green arrow indicates intercrystallite micropores; and yellow arrows indicate fractures.
4.2 Classification of reservoir space types
The reservoirs in the study area are divided into fractured reservoirs (FR), porous reservoirs (PR), and microfracture-pore composite reservoirs (MPCR) (Li et al., 2024) (Figure 5). The storage space and seepage pathways in FR are primarily controlled by fractures, including shear and dissolution fractures (Figure 6A). Although the porosity of these reservoirs is low, typically under 3%, the fracture–matrix connectivity ensures relatively high permeability, generally above 0.03 mD and often exceeding 1 mD. Consequently, FR is a relatively high-quality reservoir type in the study area. FR reservoirs predominantly occur in tectonically active regions, such as fault zones or fold deformation areas (Liu et al., 2023). Core samples show reveal distinct fractures (Figure 6G), and imaging logs show that high-angle and low-angle fractures intersect, forming a fracture network (Figure 6D).
FIGURE 5
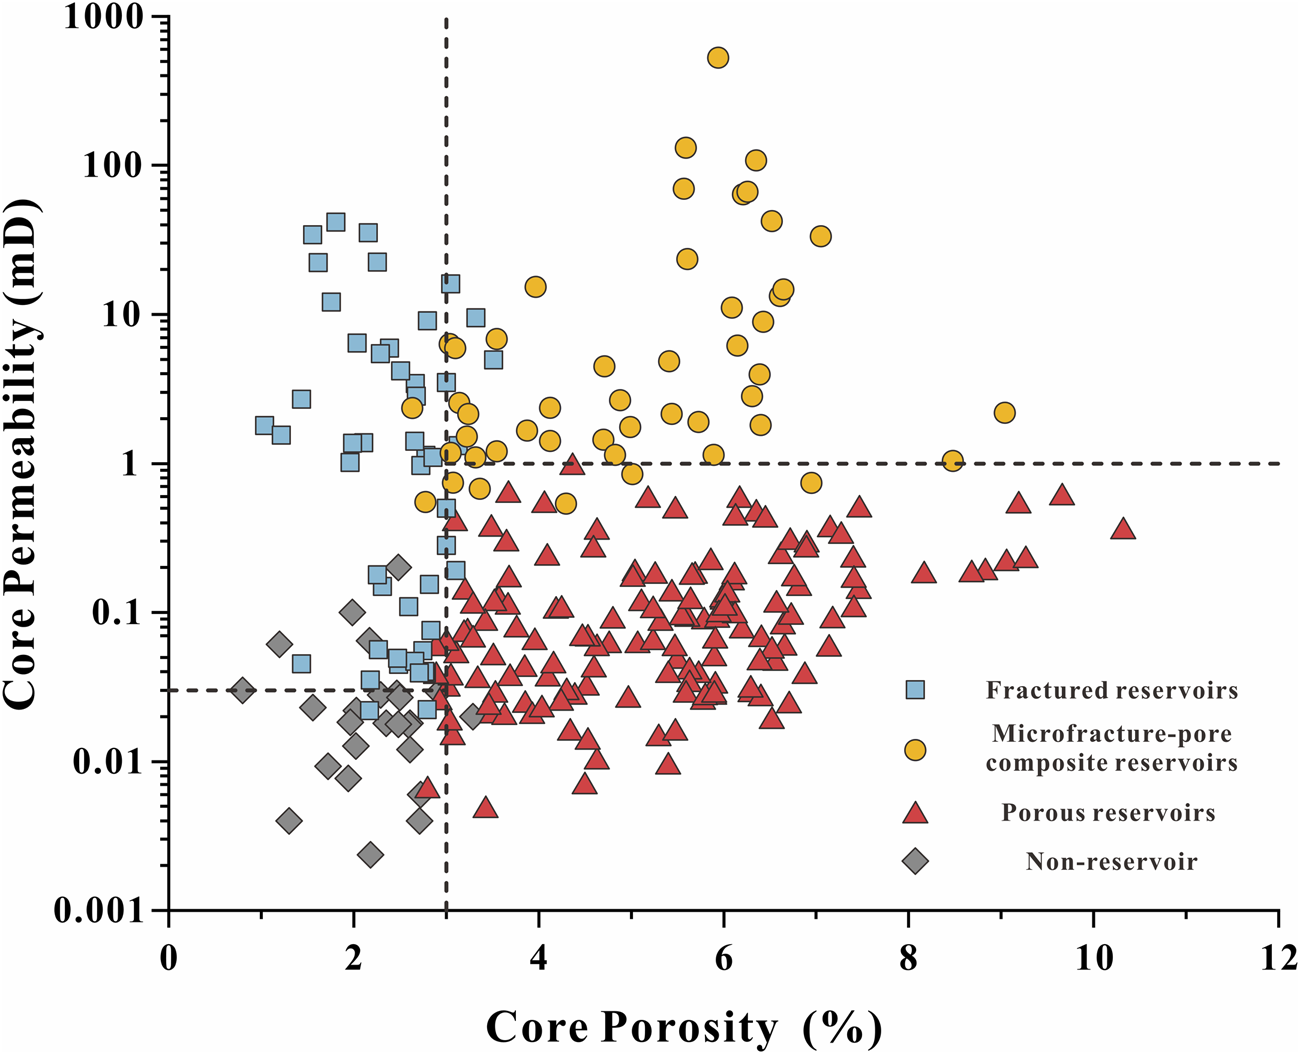
Scatter plots showing the relationship between porosity and permeability for different reservoir types. The black dashed lines indicate the classification thresholds for porosity and permeability for different reservoir types. All data points were identified using thin sections impregnated with blue epoxy resin and SEM images.
FIGURE 6

Classification criteria and features of different reservoir type of in the T3x2 Group of the Xinchang area. (A) The fracture is distributed along the diagonal line, and the pores are mainly developed as intragranular soluble pores and intercrystallite micropores (PPL image; Well X856, 4722.45 m; Ф = 2.85%, K = 5.94 mD). (B) Microfractures connect the numerous intergranular and intragranular dissolution pores, and the microfractures themselves can dissolve and expand (PPL image; Well CG561, 4929.25 m; Ф = 6.72%, K = 23.54 mD). (C) Intergranular and intragranular pores are dominant, and the seepage channel is mainly a lamellar throat. (PPL image; Well XC12, 4826.52 m; Ф = 6.02%, K = 0.11 mD). (D) Web-like fractures (FMI image; Well X3). (E) Laminated fractures (FMI image; Well XS204H). (F) No fracture development (FMI image; Well X3). (G) High-angle fractures (80.17°; Well L150, 4932.37–4732.94 m). (H) Flat joints resembling a mille-feuille fractures (almost 0°; Well XC12, 4821.05–4821.28 m). (I) Massive medium-coarse sandstone (Well XS204H, 4601.68–4601.92 m). PPL = plane-polarized light. The dark blue curve represents the FMI image interpreting the fracture. Yellow arrows indicate fractures.
The MPCR reservoirs have well-developed pores and fractures, and the storage space mainly composed of pores and flow channels formed by fractures and throats. Microfractures effectively connect the widely developed intergranular dissolution pore and primary intergranular pores, aligning closely with throats (Figure 6B), which makes MPCR the highest-quality reservoir type in tight sandstone gas reservoirs. This reservoir type has excellent physical properties, with a porosity over 3% and a permeability above 1 mD. MPCR reservoirs are predominantly found in tectonically active regions, such as fault zones or areas of fold deformation. In contrast to fractured reservoirs (FR), MPCR reservoirs are mostly located in non-core areas. Unlike fractured reservoirs (FR), core samples in MPCR often display low-angle fractures, forming a distinctive layer-cake structure (Figures 6E, H).
The PR reservoirs are mainly composed of pores, while fractures are largely absent. The primary storage space is pores between clastic particles, and the flow channels formed by throats that connect these pores. Porosity generally exceeds 3%, and permeability is largely controlled by the development of throats, which display a positive correlation with porosity (Figure 5). The reservoir pores are predominantly intergranular dissolution pore, intragranular dissolution pore, and intercrystallite micropore (Figure 6C).
4.3 Reconstruction of fluid prediction parameters
For tight sandstone gas reservoirs, the contribution of pore fluids to logging responses is minimal, making it challenging to directly identify fluids using conventional cable logging (Tan et al., 2020). Effective fluid identification in such reservoirs relies on suppressing interference signals and emphasizing the contribution of gas-bearing fluids by developing sensitive parameters for gas-bearing identification. Among them, the amplitude difference in dual laterolog resistivity curves serves as an effective indicator of formation permeability and fluid properties. Gas layers generally exhibit higher permeability than dry or poor-gas layers, characterized by a positive amplitude difference where the deep lateral resistivity, RD, exceeds the shallow lateral resistivity, RS, while dry layers have almost no amplitude difference, with RD/RS approaching 1. The resistivity invasion correction difference ratio method provides a reliable method for determining reservoir fluid properties, and can distinguish between gas layers, poor-gas layers, and dry layers (Rasmus and Services, 1982). Based on this principle, gas-bearing sensitive parameters K1 (Equation 1) and K2 (Equation 2) are constructed to improve the accuracy of fluid prediction.where is the deep lateral formation resistivity (Ωm), is the shallow lateral formation resistivity (Ωm), is the stress difference in the formation (MPa), is the maximum horizontal principal stress in the formation (MPa), and is the minimum horizontal principal stress in the formation (MPa).
The gas-bearing sensitive parameters K1 and K2 are significantly affected by fractures and dynamic drilling fluid invasion, resulting in unclear responses of water layers and gas–water layers. To address this limitation, this study innovatively integrates electrical and rock mechanical parameters to develop a new gas-bearing sensitive parameter K3 (Equation 3). Pore fluids reduce the elastic limit and strength of rocks, and the increased toughness reduces stress differences—a phenomenon more pronounced with gas intrusion, which exhibits a general downward trend as gas saturation increases (Phillips, 1972; Pandey and Ojha, 2024). Since the resistivity of water layers is significantly lower than that of gas layers, the ratio method is adopted to amplify gas-bearing logging responses. This newly created parameter effectively mitigates the influence of fractures and provides clear discrimination among gas layers, gas–water layers, and water layers.
4.4 Optimization of fluid prediction parameters
Data preprocessing plays a crucial role in improving the efficiency of algorithm training. To enrich the dimensions of fluid prediction parameters, gas-bearing sensitive parameters were reconstructed. The Pearson correlation coefficients were then employed to analyze the relationships among all fluid prediction parameters. By calculating these coefficients, highly correlated redundant parameters (with correlation coefficients close to 1 or -1) were identified. A heatmap was used in this study to visually represent the correlations between the parameters (Figure 7). Notably, K3 exhibited strong correlations with RD and Rs, as well as σH and σh. Since the gas-bearing sensitive parameter K3 is constructed based on electrical and rock mechanical parameters, the redundant parameters (RD, Rs, σH and σh) were excluded from subsequent analyses.
FIGURE 7

Correlation heatmap of fluid prediction logging parameters, with highly correlated parameters indicated in Blue or Red.
Random Forest (RF) evaluates feature importance by calculating the mean decrease in Gini (MDG) index of input features (Wang Q. et al., 2023), while AdaBoost determines feature importance based on the weights of weak classifiers in the trained strong classifier (Cui et al., 2023); Backpropagation neural network (BPNN) assess feature importance by calculating the mean impact value (MIV), which measures the effect of proportional changes in input sample values on the output (Bai et al., 2021). Using these principles, BPNN, AdaBoost, and RF were employed for pre-training to evaluate feature importance, and by averaging the importance scores obtained from these models, a comprehensive ranking of feature importance was established. The results show that K3 and AC features consistently exhibit high importance across all models, highlighting their strong predictive capabilities within the dataset and demonstrating the superiority of the innovatively reconstructed parameters in this study. Features K1 and K2 are of secondary importance; although their weights vary among models, they are still generally regarded as significant features. In contrast, CNL and GR features show low importance in all models, with GR consistently ranked as the least important feature (Figure 8).
FIGURE 8

Feature importance for fluid prediction parameters and performance comparison of combined training models in logging datasets.
To ensure the generalization and accuracy of prediction results, various combinations of logging features were used for ensemble learning training in descending order of their importance contributions. The combination with the highest accuracy in pre-trained models was selected as the optimal logging feature combination. The final optimal combination consists of K3, AC, K1 and K2, while accuracy decreases after adding CNL and GR features (Figure 8). Consequently, K3, AC, K1 and K2, along with their corresponding fluid type labels, were selected to construct the training set.
4.5 Variations in fluid logging responses in different reservoir types
Dual-medium reservoirs are characterized by complex fracture and pore structures. The degree of development of fracture and pore leads to changes in rock physical properties and fluid features, resulting in different logging response features for different reservoir types. Moreover, even in the same reservoir type, significant differences in logging responses are observed among gas layers, water layers, and dry layers due to the pronounced differences in the physical properties of gas, water, and the rock framework. Despite these differences, the logging responses of individual fluid parameters in different reservoir types generally follow similar trends (Figure 9). Statistical analysis of sensitive parameters selected for different fluid types reveals that the K3 logging value is typically highest in dry layers, while the AC and K1 logging values are the lowest. As water content increases, transitioning from gas layers to gas-water layers and finally to water layers, K3 logging values exhibit a decreasing trend, whereas AC logging values show a corresponding increase.
FIGURE 9
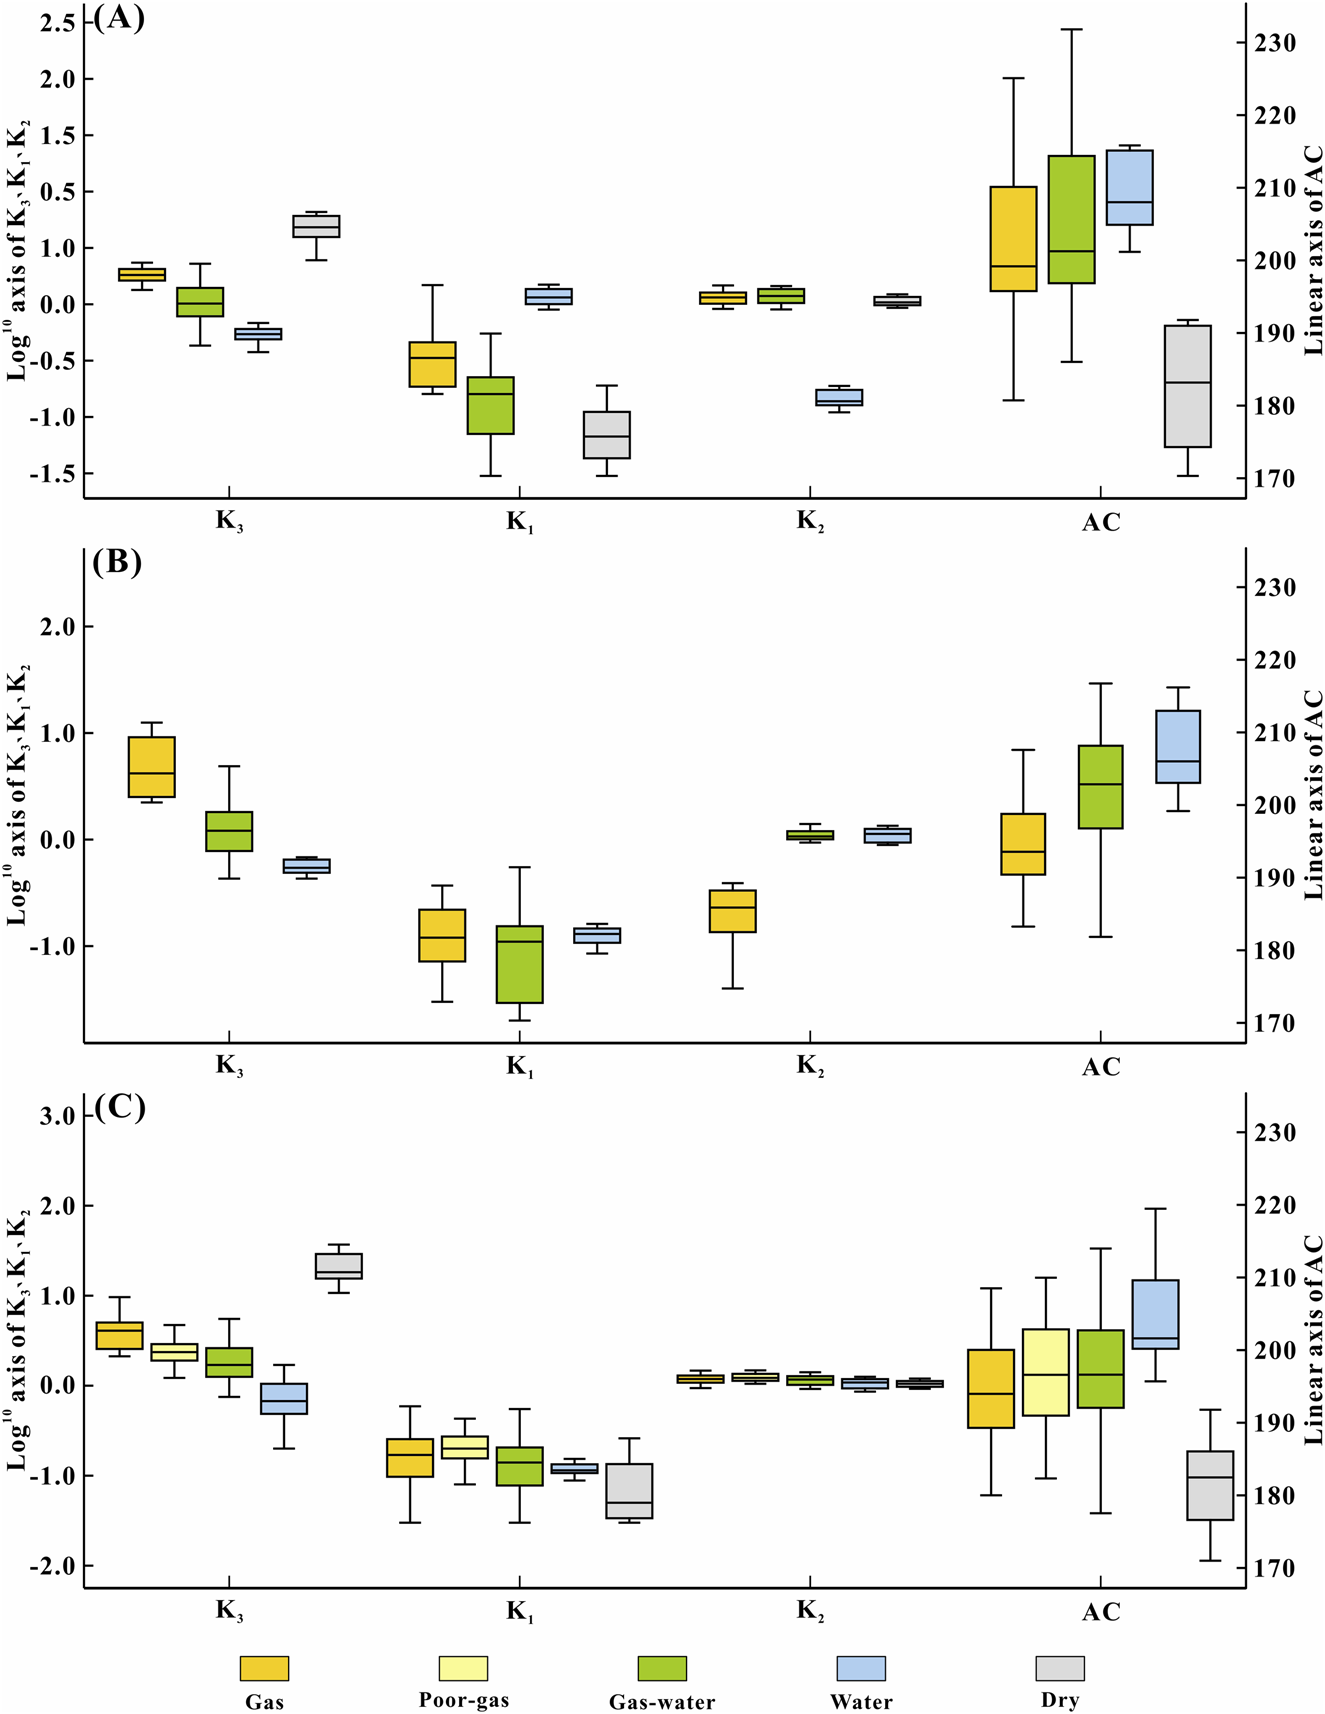
Variability in logging responses for fluid types across different reservoir types in T3x2 tight sandstones. Subplots represent reservoir types: (A) Fractured reservoirs, (B) Microfracture-pore composite reservoirs, and (C) Porous reservoirs. Each subplot with the range (bar), 25th and 75th percentiles (box), and median (midline) illustrates response differences of K1, K2, K3, and AC for different fluid types, including gas, poor-gas, gas-water, water, and dry layers. Additionally, K1, K2, and K3 are dimensionless, while the unit of AC is Us/m.
From the perspective of economic efficiency and resource development, gas layers and poor-gas layers are the primary targets of exploitation. Therefore, this research compared the logging responses of different reservoir types in gas layers and poor-gas layers through typical single wells. The AC and K3 values of gas layers in FR are relatively high. Due to the influence of fractures, the K1 and K2 values are overall high (Figure 10A). By contrast, although the MPCR is affected by micro-fractures, it exhibits favorable gas-bearing features, with a relatively high overall K3 value. As the main development is micro-fractures, the amplitude difference between RD and RS is smaller than gas layers of FR, resulting in moderate K1 and K2 values (Figure 10B). PR show intermediate logging responses, with moderate AC, and K3 values. Local abnormal increases in acoustic waves occur, presenting the phenomenon of cycle skipping (Figures 10C, D). The amplitude difference between RD and RS is the smallest, and K1 and K2 values are the lowest. It is worth noting that the porous reservoirs exhibit strong heterogeneity, and their logging responses vary widely, primarily affected by gas-bearing capacity. Higher gas-bearing capacity corresponds to higher K2 and larger AC values.
FIGURE 10

Comprehensive logging histogram of gas and poor-gas reservoirs in T3x2 tight sandstones across different reservoir types, illustrating logging response differences, lithology, depth, porosity (Por) and permeability (Perm) measured by core plugs, gas and water production rates, open-flow capacity, and final test conclusions regarding fluid type to the analyzed intervals.
5 Discussion
5.1 Accuracy and reliability of fluid type prediction
Since the rock physical structures of different reservoirs are affected by different geological genetic mechanisms, the logging responses of different types of reservoir fluids are significantly different. The new method we proposed in this study (Section 3.2) for fluid logging evaluation in dual-medium tight sandstone gas reservoirs significantly improves the accuracy and reliability of fluid prediction.
To evaluate the effectiveness of fluid prediction models, the sub-models and the new method were trained using the same dataset. Since the validation set results better reflect model performance, the confusion matrices for both the sub-models and the new method were generated for comparison (Figure 11). In terms of overall classification accuracy, the BPNN model achieved 77.85%, the RF model 78.38%, the LightGBM model 75.37%, the FCM model 76.69%, and the GBDT model 73.21%. The new method achieved a significantly higher accuracy of 91.96%, indicating that each conventional algorithm (sub-model) has difficulty in accurately identifying fluid types in complex reservoirs. In contrast, the proposed new method developed in this study outperforms all individual sub-models, demonstrating a substantial improvement in overall prediction accuracy.
FIGURE 11

Comparison of classification results between conventional algorithms (sub-models) and the stacking-based ensemble model on the validation set. (A) BP neural network (BPNN); (B) Random forest (RF); (C) Gradient boosting decision tree (GBDT); (D) Fuzzy C-means clustering (FCM); (E) Light gradient boosting machine (LightGBM); (F) The proposed new method.
Detailed analysis of the confusion matrices further shows that the sub-models are less effective in distinguishing between gas-water layers, water layers, and poor-gas layers. For instance, the random forest (RF) model, which has the highest prediction accuracy among the sub-models, misclassifies 43.75% of gas-water layers and 44.44% of water layers as poorer-gas layers, resulting in poor performance. In contrast, the new method achieves over 85% accuracy in predicting gas-water layers, poor-gas layers, and water layers, with a prediction accuracy of 93.85% for water layers. This represents a significant improvement in fluid type prediction, particularly in distinguishing between categories with similar logging response features, such as gas layers and poor-gas layers, gas-water layers and water layers.
5.2 Validation of the new model using a blind well
To further evaluate the generalization ability and reliability of the model, the constructed sub-model and the new model were applied to predict fluid types in the X856 blind well, which refers to unknown well data in the study area excluded from the model testing process. Several well sections with production test results were selected to compare their predicted outcomes (Figure 12). Notably, three significant differences were observed between the fluid type predictions (marked by red rectangles in Figure 12). In the first segment (4821.3 m–4826.5 m), where fractures are more developed, the sub-models predominantly predict gas-water and water layers, while the integrated model identifies gas and poor-gas layers. In the second (4827.5 m–4844.5 m) and the third (4832 m–4862.4 m) segments, where fractures are largely undeveloped, the predictions from both the sub-model and the integrated model are relatively consistent, with only the FCM and LightGBM models identifying gas-water layers. The actual production test results (4812.4 m–4862.4 m) showed only a natural gas production of 1.019 million m3/day, with almost no water production. This indicates that the predictions made by the stacking-based ensemble model are more reliable and consistent with the production data.
FIGURE 12

Comparison of logging fluid prediction results between proposed new method and sub-models for Well X856.
5.3 Importance of reservoir classification based on geological genetic mechanisms in the integrated model
We performed ablation experiments using the same datasets to validate the effectiveness of each component in the integrated workflow to enhance performance refinement. The dataset used in this experiment includes the original dataset containing all logged and labeled data, which has undergone conventional preprocessing and z-score normalization, as well as reconstruction and optimization of the fluid prediction log parameters, which have been described in detail in Section 4. Under these conditions, four variable control groups were established as follows: (a) no reservoir classification based on geological genetic mechanisms, only the selected sub-models were used; (b) no reservoir classification based on geological genetic mechanisms, only the stacking-based ensemble model was used; (c) with conduct reservoir classification based on geological genetic mechanisms, and then the selected sub-models were used; (d) with reservoir classification based on geological genetic mechanisms, and then the stacking-based ensemble model was used.
The results demonstrate the enhanced model performance when data is classified based on geological genetic mechanisms or when a stacking-based integrated model is adopted. This highlights the effectiveness of the proposed integrated workflow and its significance in improving model performance. In addition, classifying reservoirs based on geological genetic mechanisms significantly improves the performance of the sub-models and the integrated model. This shows that such classification plays a crucial role in reducing data noise and the multiplicity of predictions, thereby alleviating the difficulty of model learning and effectively improving training efficiency and prediction accuracy (Table 2).
TABLE 2
| Fluid type | Accuracy of group a (%) | Accuracy of group b (%) | Accuracy of group c (%) | Accuracy of group d (%) |
|---|---|---|---|---|
| Gas | 84.16 | 88.63 | 89.37 | 91.06 |
| Poor-gas | 77.15 | 81.52 | 86.55 | 89.94 |
| Gas-water | 30.00 | 55.41 | 64.51 | 85.47 |
| Water | 24.44 | 43.55 | 77.84 | 93.85 |
| Dry | 100.00 | 100.00 | 100.00 | 100.00 |
Ablation experiments of four variable control groups. The prediction accuracies for all sub-models are averaged for comparison.
5.4 Mechanisms of gas content differences in different reservoir types
Different types of reservoirs exhibit obvious differences in gas content, mainly affected by reservoir quality and the geological structural setting. Reservoir densification and natural gas migration in the Xinchang area of the West Sichuan Depression occurred simultaneously (Yue et al., 2018). Rapid densification leads to variability in pore structures of different reservoirs (Figure 13A). This phenomenon is evident in the high-pressure mercury intrusion curves of representative samples from four reservoir types, where the maximum mercury saturation gradually decreases with increasing pore structure variability, while the displacement pressure rises markedly as pore structure variability intensifies (Figure 13B). In reservoirs with low densification and favorable pore structures, natural gas charging remains strong, forming gas or gas–water layers depending on the extent of formation water displacement. As densification progresses, formation water in the reservoir pore space turns into bound water. At this stage, natural gas charging capacity weakens, hindering the displacement of bound water and leading to the formation of gas or poor-gas layers, depending on the gas content. In addition, as reservoir densification intensifies, natural gas charging ceases when pore space is severely reduced. Under these conditions, bound water dominates the internal pore space, resulting in overall dry-layer features (Figure 13E).
FIGURE 13

Effect of reservoir quality on gas and water distribution. (A) Representative PPL images of impregnated thin sections from reservoirs with varying qualities. PPL = plane-polarized light. (B) Corresponding the mercury intrusion curves for varying quality reservoirs. (C) Cumulative histograms of logging interpretation differences across gas and water layers from different types of reservoirs. (D) Box plots with the range (bar), 25th and 75th percentiles (box), and median (midline) illustrates water saturation differences measured in cores from various reservoir types. (E) Gas and water distribution patterns controlled by reservoir quality changes (modified from Wang et al., 2025). (F) Gas and water distribution patterns controlled by reservoir quality changes with the impact of faults and fractures (modified from Wang et al., 2025).
The impact of late-stage tectonic evolution on different types of reservoirs are significantly different (Figure 13F). The FR typically occur in complex tectonic settings (e.g., fracture-fold systems, large fault blocks, and fold-thrust belts) with concentrated geological stresses, and the natural fractures act as highly efficient fluid conduits. Such reservoirs are prone to intense gas charging, which is favorable for the formation of gas layer. However, due to poor development of pore structures and generally low porosity, bound water accumulates more readily, leading to the formation of gas–water layers via fracture connectivity or even water layers if large fracture openings are present (Figures 13E, F).
The MPCR has the advantages of both fractures and pores, with high porosity, permeability, and excellent pore–throat connectivity that supports efficient gas storage and flow. These characteristics make MPCR less likely to form dry layers and more favorable to the development of gas, gas–water, or water layers (Figure 13C). The interaction between microfractures and pores enhances fluid mobility, thereby maintaining high gas saturation in the reservoir (Figure 13D).
The gas-bearing capacity of PR primarily depends on pore structures and gas charging intensity. Reservoirs with favorable pore structures and strong gas charging intensity are more conducive to the formation high-productivity gas layers, while insufficient charging or poor pore structures may lead to dry or low-quality gas layers. Late-stage tectonic evolution has a significant impact on the fluid properties and gas-bearing potential of all reservoir types, showing variations in gas content and gas-charging dynamics under tectonic activity (Figures 13C, D, F), with the MPCR reservoirs exhibit superior physical properties and higher gas content, making them the most promising candidates for further exploitation.
5.5 Implications for petroleum exploration and development in complex oil and gas fields
Large basins worldwide exhibit complex and heterogeneous geological conditions (Peace et al., 2022; Perkins et al., 2023; Kiswaka et al., 2025). With long-term exploitation of conventional oil and gas fields, the amount of remaining conventional resources has gradually decreased, while unconventional oil and gas reservoirs in complex field blocks are becoming increasingly important and have great development potential (Zhao et al., 2025). Advances in exploration and development technologies have also driven the shift of oil and gas exploration towards complex oil and gas field blocks and unconventional reservoirs, which is a key trend in future oil and gas exploration (Wen et al., 2024). Integrating geological genetic mechanisms with advanced artificial intelligence tools offers an effective strategy to overcome the challenges of exploration and development in complex oil and gas field blocks (Kang et al., 2025). Elucidating these geological genetic mechanisms helps develop sophisticated models that emphasize the geological significance of geophysical well-logging data, facilitate the visual interpretation of the models, and increase their transparency and credibility (Wang Z. et al., 2024). The innovative approach proposed in this study integrates geological and geophysical methods for fluid logging evaluation in dual-medium tight sandstone gas reservoirs, and then combines the knowledge from geological genetic mechanisms with artificial intelligence algorithms. This approach can more effectively and accurately address the challenges posed by reservoirs with complex pore structures, and provides a novel solution framework for the exploration and development of complex oil and gas reservoirs under different geological conditions.
6 Conclusion
This study proposes an integrated machine learning framework to predict fluid types in dual-medium tight sandstone gas reservoirs using logging technology, with the goal of achieving cost-effective and efficient predictions. The study provides a detailed overview of the processes of data preparation, preprocessing, reservoir classification, and integrated model construction. The main findings are as follows:
(1) The reservoirs in the study area are classified into three types: fractured reservoirs (FR), porous reservoirs (PR), and microfracture-pore composite reservoirs (MPCR). Significant differences in fluid logging responses are observed among these three types of reservoirs. The classification based on prior knowledge ensures the relative stability of the data structure and effectively reduces the impact of noise.
(2) A new integrated model based on the classification and artificial intelligence tools was proposed. It integrates multi-source geological data, establishes a reservoir classification based on geogenic mechanisms, applies genetic mechanism constraints to data processing, and proposes an integrated framework grounded in genetic mechanisms. The novel model applied and validated in tight sandstone dual-medium reservoirs in the western Sichuan Basin with an accuracy of 91.96%, significantly improving the accuracy and robustness of fluid prediction compared to single models and traditional methods.
(3) The reconstruction and optimization of fluid prediction logging parameters significantly improved prediction accuracy. In this study, electrical and rock mechanical parameters are innovatively combined to create a new gas-bearing sensitive parameter, K3. This new parameter effectively minimizes the impact of fractures and clearly distinguishes gas layers, gas-water layers, and water layers.
(4) The gas content of different reservoir types varies significantly mainly affected by reservoir quality and tectonic environment. The interaction between microfractures and pores in MPCR reservoirs promotes high fluid flow, thereby maintaining high gas saturation. Overall, these MPCR reservoirs represent the highest quality reservoir type in the study area and have substantial development potential.
Statements
Data availability statement
The original contributions presented in the study are included in the article/supplementary material, further inquiries can be directed to the corresponding authors.
Author contributions
WW: Funding acquisition, Investigation, Methodology, Writing – original draft. LQ: Conceptualization, Investigation, Methodology, Visualization, Writing – original draft. DY: Conceptualization, Funding acquisition, Project administration, Supervision, Writing – review & editing. WL: Conceptualization, Project administration, Writing – review & editing. JL: Formal Analysis, Resources, Writing – review & editing. WJ: Resources, Supervision, Validation, Writing – review & editing. JF: Data curation, Project administration, Writing – original draft. JZ: Formal Analysis, Software, Writing – original draft. DC: Project administration, Writing – review & editing. QW: Methodology, Supervision, Writing – review & editing. SL: Validation, Writing – original draft.
Funding
The author(s) declare that financial support was received for the research and/or publication of this article. This study was financially supported by National Natural Science Foundation of China (Nos. 42272186, 42302128, 42472179), National Major Science and Technology Projects of China (No. 2024ZD1406601), Science Foundation of China University of Petroleum (Beijing) (Nos. 2462023YJRC039, 2462023BJRC024), and Young Elite Scientist Sponsorship Program by BAST of China (No. BYESS2023460).
Acknowledgments
We would like to thank the editors and anonymous reviewers, as well as the Sinopec Petroleum Exploration and Production Research Institute of Beijing, for providing samples, technical support, and assistance with this study, and for their agreement to publish the results.
Conflict of interest
Authors JL and WJ were employed by China Petroleum & Chemical Corporation.
The remaining authors declare that the research was conducted in the absence of any commercial or financial relationships that could be construed as a potential conflict of interest.
Generative AI statement
The author(s) declare that no Generative AI was used in the creation of this manuscript.
Publisher’s note
All claims expressed in this article are solely those of the authors and do not necessarily represent those of their affiliated organizations, or those of the publisher, the editors and the reviewers. Any product that may be evaluated in this article, or claim that may be made by its manufacturer, is not guaranteed or endorsed by the publisher.
References
1
Abba S. I. Benaafi M. Usman A. G. Aljundi I. H. (2022). Inverse groundwater salinization modeling in a sandstone’s aquifer using stand-alone models with an improved non-linear ensemble machine learning technique. J. King Saud Univ. - Comput. Inf. Sci.34, 8162–8175. 10.1016/J.JKSUCI.2022.08.002
2
Abuzeid A. M. Baghdady A. R. Kassem A. A. (2025). Automated lithofacies classification: a comprehensive machine learning approach in Shushan Basin reservoirs, Western Desert, Egypt. J. Afr. Earth Sci.223, 105487. 10.1016/J.JAFREARSCI.2024.105487
3
Al-Mudhafar W. J. (2017). Integrating well log interpretations for lithofacies classification and permeability modeling through advanced machine learning algorithms. J. Pet. Explor Prod. Technol.7, 1023–1033. 10.1007/S13202-017-0360-0
4
Ao Y. Li H. Zhu L. Ali S. Yang Z. (2019). Logging lithology discrimination in the prototype similarity space with random forest. IEEE Geoscience Remote Sens. Lett.16, 687–691. 10.1109/LGRS.2018.2882123
5
Bai Y. Tan M. Xiao C. Han C. Wu H. Luo W. et al (2021). Dynamic classification committee machine-based fluid typing method from wireline logs for tight sandstone gas reservoir. Chin. J. Geophys.64, 1745–1758. 10.6038/CJG2021O0311
6
Chen M. Dai J. Liu X. Kuang Y. Wang Z. Gou S. et al (2020). Effect of displacement rates on fluid distributions and dynamics during water flooding in tight oil sandstone cores from nuclear magnetic resonance (NMR). J. Pet. Sci. Eng.184, 106588. 10.1016/J.PETROL.2019.106588
7
Cui Y. Wang G. Jones S. J. Zhou Z. Ran Y. Lai J. et al (2017). Prediction of diagenetic facies using well logs – a case study from the upper Triassic Yanchang Formation, Ordos Basin, China. Mar. Pet. Geol.81, 50–65. 10.1016/J.MARPETGEO.2017.01.001
8
Cui Y. Zhang K. Lv Z. Li H. Song S. Zhang C. et al (2023). Exploring the effect of various factors for ash content estimation via ensemble learning: color-texture features, particle size, and magnification. Min. Eng.201, 108212. 10.1016/J.MINENG.2023.108212
9
Deng C. Pan H. Fang S. Konaté A. A. Qin R. (2017). Support vector machine as an alternative method for lithology classification of crystalline rocks. J. Geophys. Eng.14, 341–349. 10.1088/1742-2140/AA5B5B
10
Desbois G. Urai J. L. Kukla P. A. Konstanty J. Baerle C. (2011). High-resolution 3D fabric and porosity model in a tight gas sandstone reservoir:A new approach to investigate microstructures from mm-to nm-scale combining argon beam cross-sectioning and SEM imaging. J. Pet. Sci. Eng.78, 243–257. 10.1016/j.petrol.2011.06.004
11
Ebrahimi Warkiani M. Moattar M. H. (2025). A comprehensive survey on recent feature selection methods for mixed data: challenges, solutions and future directions. Neurocomputing623, 129372. 10.1016/J.NEUCOM.2025.129372
12
Fan X. Wang G. Li Y. Dai Q. Linghu S. Duan C. et al (2019). Pore structure evaluation of tight reservoirs in the mixed siliciclastic-carbonate sediments using fractal analysis of NMR experiments and logs. Mar. Pet. Geol.109, 484–493. 10.1016/J.MARPETGEO.2019.06.038
13
Friesen O. J. Dashtgard S. E. Miller J. Schmitt L. Baldwin C. (2017). Permeability heterogeneity in bioturbated sediments and implications for waterflooding of tight-oil reservoirs, Cardium Formation, Pembina Field, Alberta, Canada. Mar. Pet. Geol.82, 371–387. 10.1016/J.MARPETGEO.2017.01.019
14
Gou M. Lu G. Deng B. Wang C. Li Z. Yu Y. et al (2024). Tectonic–paleogeographic evolution of the Late Triassic in the Sichuan basin, SW China: constraints from sedimentary facies and provenance analysis of the Xujiahe Formation. Mar. Pet. Geol.160, 106649. 10.1016/J.MARPETGEO.2023.106649
15
Hart B. S. (2006). Seismic expression of fracture-swarm sweet spots, Upper Cretaceous tight-gas reservoirs, San Juan Basin. Am. Assoc. Pet. Geol. Bull.90, 1519–1534. 10.1306/05020605171
16
He M. Gu H. Wan H. (2020). Log interpretation for lithology and fluid identification using deep neural network combined with MAHAKIL in a tight sandstone reservoir. J. Pet. Sci. Eng.194, 107498. 10.1016/J.PETROL.2020.107498
17
Hu S. Wang X. Wang J. Wang L. (2023). Quantitative evaluation of fracture porosity from dual laterlog based on deep learning method. Energy Geosci.4, 100064. 10.1016/J.ENGEOS.2021.08.006
18
Hua Y. Gao G. He D. Wang G. Liu W. (2024). Reservoir fluid identification based on multi-head attention with UMAP. Geoenergy Sci. Eng.238, 212888. 10.1016/J.GEOEN.2024.212888
19
Huang W. Guo Y. Qin J. Ba Z. Zhang Z. Bai L. et al (2024). Fluid identification and tight oil layer classification for the southwestern Mahu Sag, Junggar Basin using NMR logging-based spectrum decomposition. Energy Geosci.5, 100253. 10.1016/J.ENGEOS.2023.100253
20
Kadkhodaie R. Kadkhodaie A. Rezaee R. (2021). Study of pore system properties of tight gas sandstones based on analysis of the seismically derived velocity deviation log: a case study from the Perth Basin of western Australia. J. Pet. Sci. Eng.196, 108077. 10.1016/J.PETROL.2020.108077
21
Kang M.-L. Zhou J. Zhang J. Xiao L.-Z. Liao G.-Z. Shao R.-B. et al (2025). An integrated method of data-driven and mechanism models for formation evaluation with logs. Pet. Sci.22, 1110–1124. 10.1016/J.PETSCI.2025.01.004
22
Kim S. Hong Y. Lim J. Kim K. (2023). Improved prediction of shale gas productivity in the Marcellus shale using geostatistically generated well-log data and ensemble machine learning. Comput. Geosci.181, 105452. 10.1016/J.CAGEO.2023.105452
23
Kiswaka E. B. Harishidayat D. Mkinga O. J. Mbede E. Mshiu E. E. Mtelela C. (2025). Seismic stratigraphy and petroleum prospectivity in the Northern Rovuma Basin, offshore T anzania. Mar. Pet. Geol.171, 107173. 10.1016/J.MARPETGEO.2024.107173
24
Lai J. Su Y. Xiao L. Zhao F. Bai T. Li Y. et al (2024). Application of geophysical well logs in solving geologic issues: past, present and future prospect. Geosci. Front.15, 101779. 10.1016/J.GSF.2024.101779
25
Lai J. Wang G. Wang Z. Chen J. Pang X. Wang S. et al (2018). A review on pore structure characterization in tight sandstones. Earth Sci. Rev.177, 436–457. 10.1016/j.earscirev.2017.12.003
26
Law B. E. (2002). Basin-centered gas systems. Am. Assoc. Pet. Geol. Bull.86, 1891–1919. 10.1306/61eeddb4-173e-11d7-8645000102c1865d
27
Li P. Hu Z. Liu Z. Xu S. Liu Z. Wang A. et al (2024). Types of the deep tight sandstone reservoirs and their different controlling in the second member of Xujiahe Formation in Xinchang area,western Sichuan Basin. Nat. Gas. Geosci.35, 1136–1149. 10.11764/J.ISSN.1672-1926.2023.12.011
28
Li Q. Yang X. Wang H. (2024a). Fluid identification in fractured media with genetic algorithm. J. Appl. Geophy227, 105409. 10.1016/J.JAPPGEO.2024.105409
29
Li Q. Yang X. Wang H. (2024b). Fluid identification in fractured media with genetic algorithm. J. Appl. Geophy227, 105409. 10.1016/J.JAPPGEO.2024.105409
30
Li X. Tang X. Huang Z. Wu L. Guo M. Lu Y. et al (2025). Water vapor absorption peaks in infrared spectroscopic gas logging and correlation with water layers. Gas. Sci. Eng.138, 205608. 10.1016/J.JGSCE.2025.205608
31
Li Z. Li P. Liu Z. Cui Y. (2022). Single-well lithofacies identification based on logging response and convolutional neural network. J. Appl. Geophy207, 104865. 10.1016/J.JAPPGEO.2022.104865
32
Liu J. Liu J. (2021). An intelligent approach for reservoir quality evaluation in tight sandstone reservoir using gradient boosting decision tree algorithm - a case study of the Yanchang Formation, mid-eastern Ordos Basin, China. Mar. Pet. Geol.126, 104939. 10.1016/J.MARPETGEO.2021.104939
33
Liu J. Liu Z. Liu Z. Liu Y. Shen B. Xiao K. et al (2023). Geological characteristics and models of fault-fold-fracture body in deep tight sandstone of the second member of Upper Triassic Xujiahe Formation in Xinchang structural belt of Sichuan Basin, SW China. Petroleum Explor. Dev.50, 603–614. 10.1016/S1876-3804(23)60413-6
34
Liu J. Liu Z. Xiao K. Huang Y. Jin W. (2020). Characterization of favorable lithofacies in tight sandstone reservoirs and its significance for gas exploration and exploitation: a case study of the 2nd Member of Triassic Xujiahe Formation in the Xinchang area, Sichuan Basin. Petroleum Explor. Dev.47, 1194–1205. 10.1016/S1876-3804(20)60129-5
35
Liu R. Yue D. Li W. Li Z. Wang W. Li S. et al (2024). Characterization of tight sandstone and sedimentary facies using well logs and seismic inversion in lacustrine gravity-flow deposits. J. Asian Earth Sci.259, 105897. 10.1016/J.JSEAES.2023.105897
36
Ma Y. Z. Moore W. R. Gomez E. Clark W. J. Zhang Y. (2016). “Tight gas sandstone reservoirs, Part 1: overview and lithofacies,” in Unconventional oil and gas resources handbook: evaluation and development, 405–427. 10.1016/B978-0-12-802238-2.00014-6
37
Michael M. I. (2024). Enhancing reservoir characterization using seismic inversion and geostatistical modeling by integrating seismic attributes with well-log data for improved lithofacies and reservoir property estimation. 10.5281/ZENODO.14356352
38
Ortiz-Orduz A. Ríos-Reyes C. A. Vargas-Escudero M. A. García-González M. (2021). Impact of diagenesis on the reservoir rock quality of the Cachiri Group tight sandstones in Cesar sub basin (Colombia): a case of study from ANH-CR-MONTECARLO 1X well. J. Nat. Gas. Sci. Eng.95, 104138. 10.1016/J.JNGSE.2021.104138
39
Pan H. Wei C. Yan X. Li X. Yang Z. Gui Z. et al (2024). 3D rock physics template-based probabilistic estimation of tight sandstone reservoir properties. Pet. Sci.21, 3090–3101. 10.1016/J.PETSCI.2024.04.010
40
Pandey L. Ojha M. (2024). Characterising the effect of gas hydrate in pore pressure and stress using NGHP-02 downhole logs in Krishna Godavari offshore Basin, India. Mar. Pet. Geol.160, 106654. 10.1016/j.marpetgeo.2023.106654
41
Peace A. L. Bingham-Koslowski N. McCartney T. Welford J. K. (2022). The Orphan Basin: a review of basin evolution, structure, stratigraphy and petroleum systems. Earth Sci. Rev.232, 104148. 10.1016/J.EARSCIREV.2022.104148
42
Perkins J. R. Fraser A. J. Muxworthy A. R. Neumaier M. Schenk O. (2023). Basin and petroleum systems modelling to characterise multi-source hydrocarbon generation: a case study on the inner Moray Firth, UK North Sea. Mar. Pet. Geol.151, 106180. 10.1016/J.MARPETGEO.2023.106180
43
Phillips W. J. (1972). Hydraulic fracturing and mineralization. J. Geol. Soc. Lond.128, 337–359. 10.1144/gsjgs.128.4.0337
44
Rasmus J. C. Services S. W. (1982). Detennining the type of fluid contained in the fractures of the twin creek limestone by using the dual LaterologTMTool.
45
Saboorian-Jooybari H. Dejam M. Chen Z. Pourafshary P. (2016). Comprehensive evaluation of fracture parameters by dual laterolog data. J. Appl. Geophy131, 214–221. 10.1016/J.JAPPGEO.2016.06.005
46
Shedid A. S. Mohamed A. S. (2017). Analysis and field applications of water saturation models in shaly reservoirs. J. Petroleum Gas Eng.8, 111–122. 10.5897/JPGE2017.0270
47
Sun Z. Jiang B. Li X. Li J. Xiao K. (2020). A data-driven approach for lithology identification based on parameter-optimized ensemble learning. Energies13, 3903. 10.3390/EN13153903
48
Szabó N. P. Kilik R. Dobróka M. (2023). Robust reservoir identification by multi-well cluster analysis of wireline logging data. Heliyon9, e15957. 10.1016/J.HELIYON.2023.E15957
49
Tan M. Bai Y. Zhang H. Li G. Wei X. Wang A. (2020). Fluid typing in tight sandstone from wireline logs using classification committee machine. Fuel271, 117601. 10.1016/j.fuel.2020.117601
50
Tang J. Zhang C. Xin Y. (2017). A fracture evaluation by acoustic logging technology in oil-based mud: a case from tight sandstone reservoirs in Keshen area of Kuqa Depression, Tarim Basin, NW China. Petroleum Explor. Dev.44, 418–427. 10.1016/S1876-3804(17)30048-4
51
Tian Y. Wang G. Li H. Huang Y. Zhao F. Guo Y. et al (2024). A novel deep learning method based on 2-D CNNs and GRUs for permeability prediction of tight sandstone. Geoenergy Sci. Eng.238, 212851. 10.1016/J.GEOEN.2024.212851
52
Wang J. Cao J. Liu Z. (2024a). Unsupervised machine learning-based multi-attributes fusion dim spot subtle sandstone reservoirs identification utilizing isolation forest. Geoenergy Sci. Eng.234, 212626. 10.1016/J.GEOEN.2023.212626
53
Wang Q. Chen D. Gao X. Wang F. Li J. Liao W. et al (2020). Microscopic pore structures of tight sandstone reservoirs and their diagenetic controls: a case study of the Upper Triassic Xujiahe Formation of the Western Sichuan Depression, China. Mar. Pet. Geol.113, 104119. 10.1016/J.MARPETGEO.2019.104119
54
Wang Q. Chen D. Li M. Wang F. Wang Y. Du W. et al (2023a). Application of machine learning for evaluating and predicting fault seals: a case study in the Huimin depression, Bohai Bay Basin, Eastern China. Geoenergy Sci. Eng.228, 212064. 10.1016/J.GEOEN.2023.212064
55
Wang Q. Chen D. Li S. Chen Y. Yue D. Wang F. et al (2025). Mechanism of the gas-water distribution of the tight sandstone gas reservoirs in the 2nd member of the Xuiiahe Formation in the Xinchang area, Western Sichuan Depression. Nat. Gas. Geosci.Available online at: https://link.cnki.net/urlid/62.1177.TE.20250115.1435.002.
56
Wang W. Yue D. Eriksson K. A. Li S. Zhang Y. Zhang J. et al (2023b). Spatial variations in diagenetic facies in tight sandstones from sublacustrine-fan deposits: upper Triassic Yanchang formation, Ordos Basin, China. Mar. Pet. Geol.156, 106446. 10.1016/J.MARPETGEO.2023.106446
57
Wang Z. Cai Y. Liu D. Lu J. Qiu F. Hu J. et al (2024b). A review of machine learning applications to geophysical logging inversion of unconventional gas reservoir parameters. Earth Sci. Rev.258, 104969. 10.1016/J.EARSCIREV.2024.104969
58
Wen Z. Wang J. Wang Z. He Z. Song C. Chen R. et al (2024). Analysis of the current status of global oil, gas, and associated resources exploration in 2023. Petroleum Explor. Dev.51, 1465–1479. 10.1016/S1876-3804(25)60553-2
59
Wolpert D. H. (1992). Stacked generalization. Neural Netw.5, 241–259. 10.1016/S0893-6080(05)80023-1
60
Wood D. A. (2020). Predicting porosity, permeability and water saturation applying an optimized nearest-neighbour, machine-learning and data-mining network of well-log data. J. Pet. Sci. Eng.184, 106587. 10.1016/J.PETROL.2019.106587
61
Wu B. Xie R. Xiao L. Guo J. Jin G. Fu J. (2023). Integrated classification method of tight sandstone reservoir based on principal component analysis–simulated annealing genetic algorithm–fuzzy cluster means. Pet. Sci.20, 2747–2758. 10.1016/J.PETSCI.2023.04.014
62
Wu X. Chen Y. Wang Y. Zeng H. Jiang X. Hu Y. (2021). Geochemical characteristics of natural gas in tight sandstone of the Chengdu large gas field, Western Sichuan Depression, Sichuan Basin, China. J. Nat. Gas Geoscience6, 279–287. 10.1016/J.JNGGS.2021.09.003
63
Wu X. Su Y. Zhang C. Xin Y. Chen X. Li N. et al (2024). A novel evaluation method of dolomite reservoir using electrical image logs: the Cambrian dolomites in Tarim Basin, China. Geoenergy Sci. Eng.233, 212509. 10.1016/J.GEOEN.2023.212509
64
Xiong W. Xiao L. Han D. Yue W. (2024). A prediction model for water absorption in sublayers based on stacking ensemble learning method. Geoenergy Sci. Eng.239, 212896. 10.1016/J.GEOEN.2024.212896
65
Yang T. Tang H. Dai J. Wang H. Wen X. Wang M. et al (2025). Quantitative classification and prediction of pore structure in low porosity and low permeability sandstone: a machine learning approach. Geoenergy Sci. Eng.247, 213708. 10.1016/J.GEOEN.2025.213708
66
Yue D. Wu S. Xu Z. Xiong L. Chen D. Ji Y. et al (2018). Reservoir quality, natural fractures, and gas productivity of upper Triassic Xujiahe tight gas sandstones in western Sichuan Basin, China. Mar. Pet. Geol.89, 370–386. 10.1016/J.MARPETGEO.2017.10.007
67
Zhang H. Hu Y. Li X. Du K. Zeng T. Li C. (2024). Application of support vector machines and genetic algorithms to fluid identification in Offshore Granitic subduction hill reservoirs. Geoenergy Sci. Eng.240, 213013. 10.1016/J.GEOEN.2024.213013
68
Zhang H. Zhang R. Yang H. Shou J. Wang J. LIu C. et al (2014). Characterization and evaluation of ultra-deep fracture-pore tight sandstone reservoirs: a case study of Cretaceous Bashijiqike Formation in Kelasu tectonic zone in Kuqa foreland basin, Tarim, NW China. Petroleum Explor. Dev.41, 175–184. 10.1016/S1876-3804(14)60020-3
69
Zhao J. Wang L. Wei B. Kadet V. (2025). CO2 utilization and geological storage in unconventional reservoirs after fracturing. Engineering. 10.1016/J.ENG.2025.01.005
70
Zhao W. Zhang Z. Liao J. Zhang J. Zhang W. (2024). Prediction method for the porosity of tight sandstone constrained by lithofacies and logging resolution. Mar. Pet. Geol.170, 107114. 10.1016/J.MARPETGEO.2024.107114
71
Zheng W. Tian F. Di Q. Xin W. Cheng F. Shan X. (2021). Electrofacies classification of deeply buried carbonate strata using machine learning methods: a case study on ordovician paleokarst reservoirs in Tarim Basin. Mar. Pet. Geol.123, 104720. 10.1016/J.MARPETGEO.2020.104720
72
Zhu R. Zou C. Mao Z. Yang H. Hui X. Wu S. et al (2019). Characteristics and distribution of continental tight oil in China. J. Asian Earth Sci.178, 37–51. 10.1016/J.JSEAES.2018.07.020
73
Zou C. Zhu R. Liu K. Su L. Bai B. Zhang X. et al (2012). Tight gas sandstone reservoirs in China: characteristics and recognition criteria. J. Pet. Sci. Eng.88–89, 82–91. 10.1016/J.PETROL.2012.02.001
Summary
Keywords
fluid identification, tight sandstone gas, ensemble learning, logging interpretation, Sichuan Basin
Citation
Wang W, Qu L, Yue D, Li W, Liu J, Jin W, Fu J, Zhang J, Chen D, Wang Q and Li S (2025) Integrated artificial intelligence approach for well-log fluid identification in dual-medium tight sandstone gas reservoirs. Front. Earth Sci. 13:1591110. doi: 10.3389/feart.2025.1591110
Received
10 March 2025
Accepted
09 April 2025
Published
28 April 2025
Volume
13 - 2025
Edited by
Shaohua Li, Yangtze University, China
Reviewed by
Muhammad Tayyab Naseer, Quaid-i-Azam University, Pakistan
Shengli Li, China University of Geosciences, China
Donggao Zhao, University of Missouri–Kansas City, United States
Updates
Copyright
© 2025 Wang, Qu, Yue, Li, Liu, Jin, Fu, Zhang, Chen, Wang and Li.
This is an open-access article distributed under the terms of the Creative Commons Attribution License (CC BY). The use, distribution or reproduction in other forums is permitted, provided the original author(s) and the copyright owner(s) are credited and that the original publication in this journal is cited, in accordance with accepted academic practice. No use, distribution or reproduction is permitted which does not comply with these terms.
*Correspondence: Dali Yue, yuedali@cup.edu.cn; Wei Li, wei_li@cup.edu.cn
Disclaimer
All claims expressed in this article are solely those of the authors and do not necessarily represent those of their affiliated organizations, or those of the publisher, the editors and the reviewers. Any product that may be evaluated in this article or claim that may be made by its manufacturer is not guaranteed or endorsed by the publisher.