 Luo Li
 Xuri Huang
 Weiping Cao
 Hai Yao1,2
 Yungui Xu
- 1State Key Laboratory of Oil and Gas Reservoir Geology and Exploitation, Southwest Petroleum University, Chengdu, China
- 2School of Geosciences and Technology, Southwest Petroleum University, Chengdu, China
- 3SLB, Houston, TX, United States
- 4Sichuan Wu Bin Model Worker and Artisan Talent Innovation Studio, Geophysical Investigation Institute of Sichuan Province, Chengdu, China
Surface waves have proven to be valuable instruments in subsurface investigation, finding applications in diverse fields such as hydrocarbon and mineral resource exploration. The computation of dispersion spectrums is a critical step in multi-channel analysis of both active and passive surface waves for imaging subsurface shear-wave velocity distribution. A high-resolution surface-wave dispersion spectrum is fundamental for accurate dispersion curve picking and shear-wave velocity structure inversion. This paper presents a high-resolution method for surface-wave dispersion spectrum computation using Tau-P transform implemented with an iterative threshold shrinkage algorithm scheme. In this method, Tau-P transform is formulated as a sparse inversion scheme, and the Tau-P coefficients are iteratively thresholded to achieve a high-resolution Tau-P domain representation. By transforming surface wave traces into the Tau-P domain with the above sparse inversion algorithm and then converting them to the frequency phase velocity domain, a high-resolution dispersion spectrum is achieved. This method can also be applied to compute surface wave dispersion spectrum for irregularly sampled data. Synthetic tests of the proposed method demonstrate that the proposed scheme generates a high-resolution surface-wave dispersion spectrum that matches the theoretical dispersion curve. Field data tests also demonstrate that the dispersion spectrum generated with the proposed algorithm shows higher resolution and less noise. Also, the resultant shear-velocity inversion result matches better with the collocated micrologging result than the result associated with the conventional Tau-P trans-form algorithm, indicating a higher-precision inversion result.
1 Introduction
In seismic exploration of the shallow subsurface, surface waves usually account for the major portion of seismic recordings. In their propagation, surface waves of different frequencies exhibit different phase velocities. This feature is referred to as dispersion. The dispersion feature of surface waves has been discovered to be dominantly controlled by the shear-velocity (Vs) distribution of the medium in which the surface waves are propagated, and dispersion can be used to analyze the Vs distribution of the medium (Aki and Richards, 1980; Lee and Solomon, 1979). Since Vs distribution is crucial information for various fields, including the exploration of hydrocarbon and mineral resources (Yang et al., 2011), shallow geohazard mitigation (Yilmaz et al., 2006), civil engineering (Nazarian et al., 1983; Foti et al., 2011), etc., surface waves and their dispersion features are demonstrating ever increasing significance in the above fields, especially with the development of seismic acquisition technologies such as wireless nodes and distributed acoustic sensing systems.
Since the dispersion feature of surface waves was discovered, various methods have been developed to utilize surface-wave dispersion to investigate shallow Vs distribution, and the computation of dispersion feature maps, usually referred to as dispersion spectrums, has been a critical step in surface wave processing procedures. Among the developed surface wave methods, the spectral analysis of surface waves (SASW) (Stokoe et al., 1994) method and the multi-channel analysis of surface waves (MASW) are extensively applied (Park et al., 1999a; Park and Miller, 2008; Mi et al., 2017). For these methods, surface-wave dispersion curves are extracted from seismic recordings and then used to estimate for subsurface Vs distribution via least-squares inversion for stochastic inversion algorithms. In recent years, passive surface wave methods have been developed as a very important supplement to traditional surface wave exploration using active sources; the above approaches have been extended for passive seismic recordings as well (Behm and Snieder, 2013; Bensen et al., 2007; D'Amico et al., 2008; Nakata et al., 2011). For passive surface wave methods, noise seismic traces are recording and processed to extract surface waves, and dispersion curves are computed to be inverted for Vs profiles. Since no active energy source is needed, passive surface methods are especially advantageous for environmentally sensitive areas and suitable for real-time imaging and permanent monitoring. With the development of waveform inversion methods, wave-equation-based dispersion inversion and dispersion spectrum inversion methods have been developed for surface wave recording because of the enhanced imaging ac-curacy (Li et al., 2017; Pan et al., 2019). These approaches estimate Vs distributions via a minimization of the difference between the dispersion curves or dispersion spectrums for the recorded data and simulated data, and the residual of dispersion curve or dispersion spectrum is back-propagated to update the Vs structure. In short, with the development of surface wave exploration technologies, computation of surface-wave dispersion has been and remains a fundamental step in surface wave processing.
To compute and visualize the dispersion feature of surface waves, McMechan and Yeldin proposed Tau-P transform applied for computation of dispersion spectrums for surface wave recordings (Mcmechan and Yedli, 1981). Also known as the slant-stack transform, Tau-P coefficients are computed by stacking on a surface wave gather along a straight line defined by a dip P and intercept Tau. The Tau-P coefficients are transformed into the f-P or f-v domain to illustrate the surface-wave energy for different frequencies and phase velocities. This method works best with higher-mode surface waves but suffers from a low resolution for the fundamental-mode surface waves and can be susceptible to truncation effect and data aliasing (Shao and Li, 2010). Since Tau-P transform is an extensively used and studied data-processing tool in exploration seismology, it is easily extended to the field of surface wave processing for dispersion computation. In 1987, Gabriels and introduced F-K transform for dispersion spectrum computation (Gabriels et al., 1987). This method is easy to implement, but it requires regularized spatial sampling for the surface wave recordings, and bad traces or missing traces can de-grade the quality of the computation results. In 1998, Park et al. proposed a phase-shift method that includes a temporal Fourier transform and spatial integration for the surface wave traces (Park et al., 1999a; Park et al., 1999b). In 2007, Xia et al. developed a frequency-decomposed slant-stacking algorithm and improved identification of dispersion curves for high frequencies (Xia et al., 2007). In 2008, Luo et al. developed a high-resolution Radon transform algorithm for dispersion spectrum computation. In this algorithm, an iteratively reweighted least-squares inversion is used for the linear Radon transform to achieve sparse transform coefficients, and it significantly improves the resolution of the resultant surface-wave dispersion spectrum (Luo et al., 2008). Many scholars introduced a vector wavenumber transform method to scan for the dispersion energy of surface waves and demonstrated high resolution for surface waves of both fundamental and high-order modes (Wang et al., 2019; Yang et al., 2019; Hu et al., 2020). Many scholars also expanded a nonlinear signal comparison method developed for global seismology to multi-channel surface wave exploration for the shallow subsurface and achieved high-resolution dispersion computation (Hu et al., 2018; Hu and Zheng, 2019; Yi et al., 2021). Su et al. developed a chirplet transform method for high-resolution dispersion imaging computation (Qin et al., 2021). Cheng et al. summarized the artifacts in surface-wave dispersion spectrums and the corresponding root causes, providing an in-depth understanding of the complexity of dispersion spectrums and facilitating further development for more precise dispersion spectrum computation (Cheng et al., 2023). In addition, Serdyukov et al. proposed the Slant f-k transform based on the standard S-transform, which performs better on noisy data compared to traditional f-k transforms (Serdyukov et al., 2019). Building upon this, researchers proposed a modified S-transform based high-resolution wave-field transformation method to unambiguously image the surface wave dispersion spectrum for low SNR (Mukherjee et al., 2025).
Dispersion spectrums or dispersion images of surface waves are crucial input for the inversion of Vs distribution. Therefore, it is of vital significance to enhance the resolution of computed dispersion spectrums so that accurate estimation of subsurface Vs can be achieved. Also, the success of seismic exploration largely depends on proper seismic data acquisition. Obstacles and physically inaccessible areas (e.g., buildings, rivers, highways, etc.) often force the collected data to contain missing or incomplete traces. Many scholars have proposed that the concept of compressed sensing can reconstruct regular surface wave-fields from under-sampled records (Zhan et al., 2018; Mukherjee and Elita, 2022; Cao et al., 2025). Also there are some other methods to compute dispersion spectrums from irregular-sampled surface wave data, like the Phase shift method and the F-J transform. Nevertheless, methods to compute high-resolution surface wave dispersion spectrum from irregularly sampled data remain poorly explored.
Here, we propose a novel high-resolution Tau-P transform algorithm for the computation of surface-wave dispersion spectrums. This algorithm is based on the sparse inversion scheme of an Iterative Shrinkage Thresholding Algorithm (ISTA) (Chambolle et al., 1998; Daubechies et al., 2004; Figueiredo and Nowak, 2003). Compared with conventional dispersion spectrum computation methods, this proposed algorithm produces dispersion spectrums with significantly higher resolution and signal-to-noise ratio. This method can still compute high-quality dispersion spectrum from surface wave records with missing traces and it is easy to implement and parameterize. With these advantages, this method can essentially benefit the surface wave process with more efficient and accurate dispersion curve picking. This paper first introduces the methodology of the proposed high-resolution Tau-P transform algorithm. Then synthetic examples demonstrate the performance of our proposed algorithm by comparing computation results with those generated with a conventional algorithm and theoretical values. Also, field data experiments demonstrate the performance of the proposed high-resolution algorithm in the computation of a dispersion spectrum and its impact on the subsequent Vs inversion. Lastly, conclusions are given.
2 Principles and methods
For the computation of surface-wave dispersion spectrums which reflect the variation of surface wave velocity with respect to the frequency of the recording, plane-wave de-composition has been an effective approach. This is because the propagation velocity of plane waves can be easily computed from their dips, and then, with a temporal Fourier transform, the frequency velocity spectrums of the surface wave recordings, dispersion spectrums in another word, can be achieved. Tau-P transform as a classical plane-wave decomposition algorithm has been widely used for computation of surface-wave dispersion spectrum. Tau-P-transform-based dispersion computation can be achieved with a three-step approach (space-time domain recording to Tau-p, Tau-P to f-p, and f-p to f-v transformations), or in a two-step fashion (space-time domain recording to f-p and f-p to f-v transformations). For both approaches, Tau-P transform is the core part and determines the performance of the final dispersion spectrum. Here, we first introduce the algorithm of Tau-P transform, and then present the proposed high-resolution Tau-P transform based on the ISTA algorithm.
2.1 Tau-P transform
Tau-P transform decomposes a time-space domain trace gather into plane-wave components with different dipping angles, through stacking along straight lines defined with an intercept of Tau and dip P. This process can be formulated as [Tau-p transform paper]:
where
To avoid temporal interpolation in the slant-stacking operation, Tau-P transform is usually implemented as the frequency space domain integration. This process is formulated as:
where
Equation 2 can be also expressed with a matrix formulation:
In this equation
With
2.2 ISTA-based Tau-P transform
Equation 3 shows the matrix formulation of Tau-P transform. This equation indicates that the Tau-P coefficients can be also achieved via an inversion with the objective function as:
The least-squares solution to Equation 4 is expressed as:
Equation 5 shows the process of the conventional solution. To achieve a sparse solution, a L1 regularization term is usually added to the objective function,
Beck et al., proposed the fast iterative shrinkage thresholding algorithm to solve the slow convergence problem (Beck and Teboulle, 2009). It has become a common tool for solving the 1-norm regularized linear inversion problems in Equation 6. The high-resolution linear or hyperbolic Radon transform belongs to exactly this kind of issue. Some authors have used it along with the high-resolution Radon transform to deal with the similar seismic wave problems, such as velocity and seismic data analysis (Gong et al., 2016; Li and Li, 2017; Zhang et al., 2024).
Among the various algorithms developed to solve this equation, ISTA is an efficient approach that is easy to implement. According to this method, the solution m is iteratively thresholded according to its amplitude with a decreasing threshold value, and a sparse solution to Equation 4 is achieved. This process is expressed as:
Here, α is the step length and
In Equations 8, 9, i is current iteration number and I is the total iteration number. a is the thresholding value, the value of a ranges from 0 to 1.
When this scheme is applied to Tau-P transform, the iterative thresholding process picks the high amplitude Tau-P coefficients first and then recovers lower-amplitude coefficients gradually; a high-resolution Tau-P transform can be achieved, and it also represents well the input seismic data.
Similar to Equations 2, 3, when
3 Synthetic data results
To illustrate the performance of an ISTA-based Tau-P transform on the computation of the dispersion spectrum of surface-wave gathers, we generate synthetic surface wave seismograms via a finite-difference solution to the elastic wave equation (Kelly et al., 1976) and compute the dispersion spectrum.
Table 1 shows the elastic parameters for a three-layer model used for numerical simulation of the surface waves, and a Ricker wavelet with dominant frequency of 30 Hz is used as the source wavelet. A total of 120 traces with a recording spacing of 2 m were recorded to form the synthetic seismic shot gather as shown in Figure 1A.
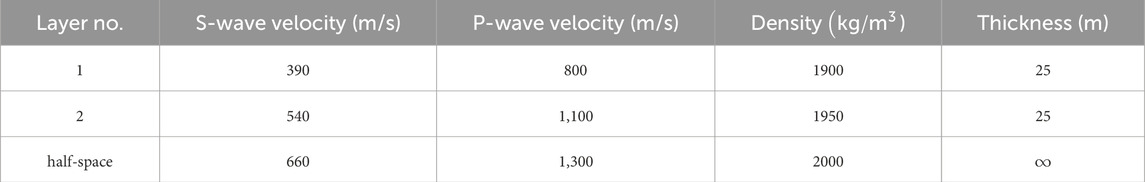
Table 1. Parameters for a three-layer model.
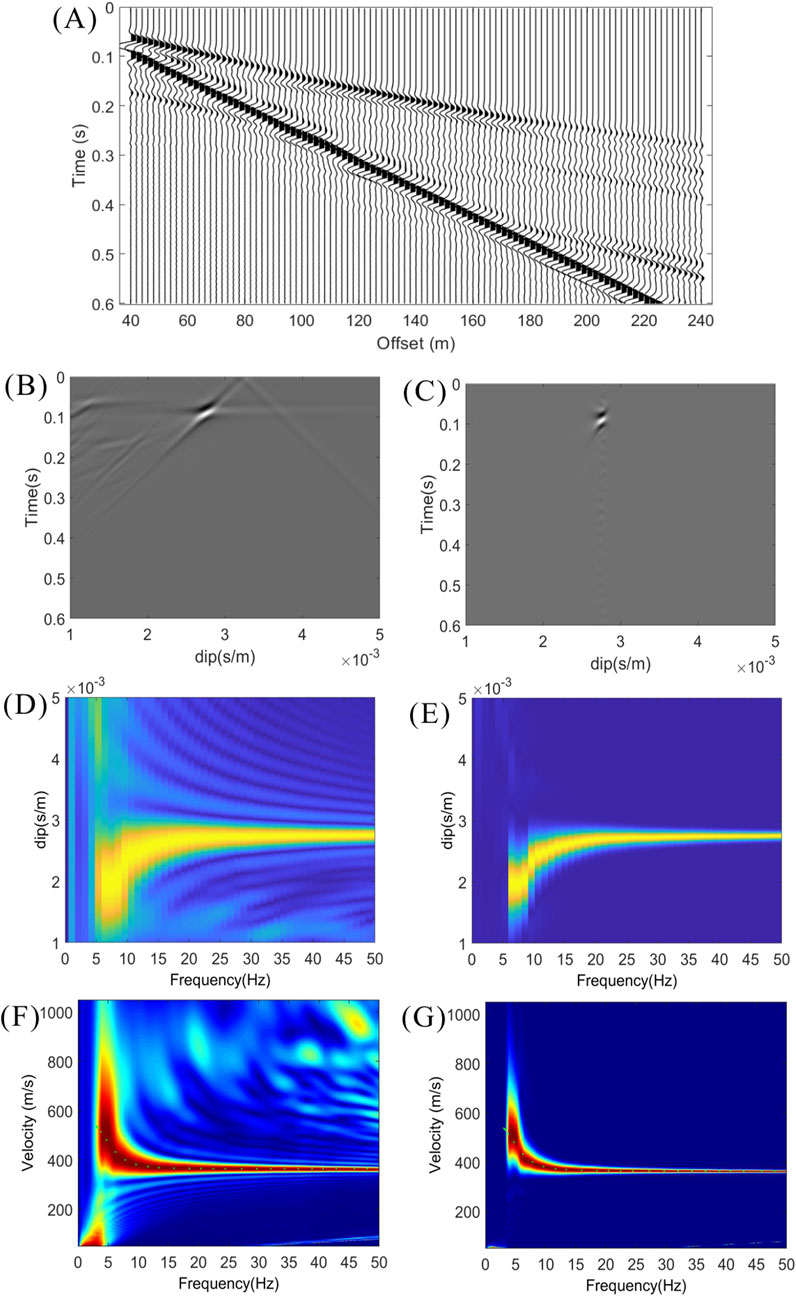
Figure 1. (A) The synthetic seismic shot gather. (B,C) The Tau-P panels computed using the conventional method and the proposed high-resolution method, respectively. (D,E) The f-P panels computed using the conventional method and the proposed high-resolution method, respectively. (F,G) The dispersion spectrums computed using the conventional method and the proposed high-resolution method, respectively.
The synthetic shot gather in Figure 1A is transformed to a Tau-P domain using the conventional method and the proposed high-resolution method, respectively. As shown in Figures 1B,C, the transform result generated with the high-resolution algorithm demonstrates a much more focused spectrum than the result associated with the conventional Tau-P transform algorithm. The f-P spectrums in Figures 1D,E also show this feature. With this shot gather, dispersion spectrums are computed with conventional Tau-P transform and the ISTA-based high-resolution Tau-P transform scheme as shown in Figures 1F,G. And the threshold value is 0.9. To verify the precision of the computed dispersion spectrums, dispersion curves are computed directly from the synthetic model in Table 1 and plotted as green dotted lines on the dispersion spectrums. As illustrated in Figures 1F,G, both dispersion spectrums overlay well with the simulated dispersion curve shown as the green dotted lines in this figure, and the dispersion spectrum computed with the ISTA-based Tau-P transform scheme shows a remarkably higher resolution than the one computed with a conventional Tau-P transform.
Furthermore, we further evaluated the impact of different threshold values on the dispersion spectrum calculation results, in order to analyze their effect on the stability and accuracy of the outcomes. Figure 2 mainly shows the calculated dispersion spectrums form Figure 1A under different threshold values. Figures 2A–C illustrate the results of dispersion spectrum computation using the ISTA-based high-resolution Tau-P transform with threshold values set to 0.3, 0.6, and 0.95. Figure 2D illustrates the results of dispersion spectrum computation using high-resolution linear Radon transform (Luo et al., 2008). According to the computed results, the resolution improves as the threshold value increases, and making it easier to accurately pick the dispersion curves in the post-processing stage. Compared to the high-resolution linear Radon transform (HR-LRT) method, the IST-based high-resolution method achieves higher resolution through threshold adjustment. If the threshold is too low, the resulting resolution may be insufficient. On the other hand, if the threshold is too high, it can lead to over-sparsification of the signal, where many useful components that should have been preserved are mistakenly discarded as noise.
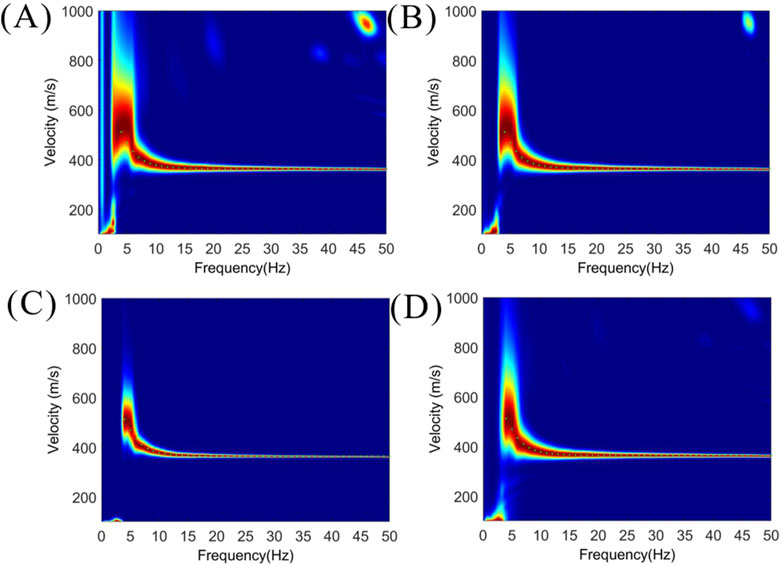
Figure 2. The dispersion spectrums computed from the synthetic seismic shot gather. (A–C) The dispersion spectrums computed using the proposed high-resolution method and the threshold values are 0.3, 0.6, and 0.95, respectively. (D) The dispersion spectrum computed using the high-resolution linear Radon transform (HR-LRT).
To further test the resilience of the proposed high-resolution Tau-P transform algorithm to noise, random noise is added to the input seismic gather, and dispersion spectrums are computed.
Figure 3A shows the data with random noise added to the seismic gather in Figure 1A. The noise amplitude is 20% of the peak amplitude of seismic traces. As illustrated in the Tau-P spectrums in Figures 3B,C and dispersion spectrums in Figure 3D and in Figure 3E, and the threshold value is 0.9, for noisy input, the proposed method produces results with a significantly higher resolution and signal-to-noise ratio than the conventional method.
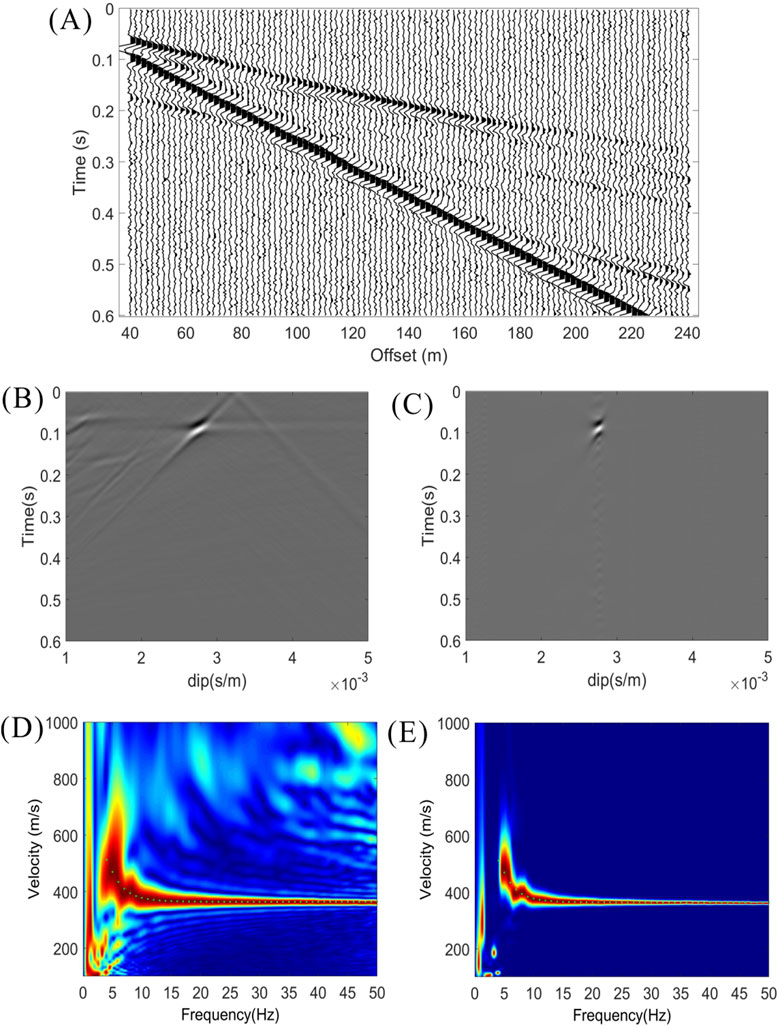
Figure 3. (A) The synthetic seismic shot gather with 20% random noise added. (B,C) The Tau-P panels computed using the conventional method and the proposed high-resolution method, respectively. (D,E) The dispersion spectrums computed using the conventional method and the proposed high-resolution method, respectively.
To further test the applicability of the proposed high-resolution Tau-P transform algorithm to irregularly sampled data, we randomly removed 40% of seismic traces in the input seismic gather and computed the corresponding dispersion spectrums.
Figure 4A shows the data with randomly traces removed 40% to the seismic gather in Figure 1A. As illustrated in the Tau-P spectrums in Figures 4B,C, for randomly traces removed, the proposed method produces results with a significantly higher resolution and signal-to-noise ratio than the conventional method. Due to irregularly sampled data, conventional method yields dispersion spectrums with lower resolution in low-frequency ranges in Figure 4D, making them difficult to accurately pick. In contrast, the dispersion spectrum derived from high-resolution algorithm in Figure 4E matches better with theoretical dispersion curve, and the threshold value is 0.8.
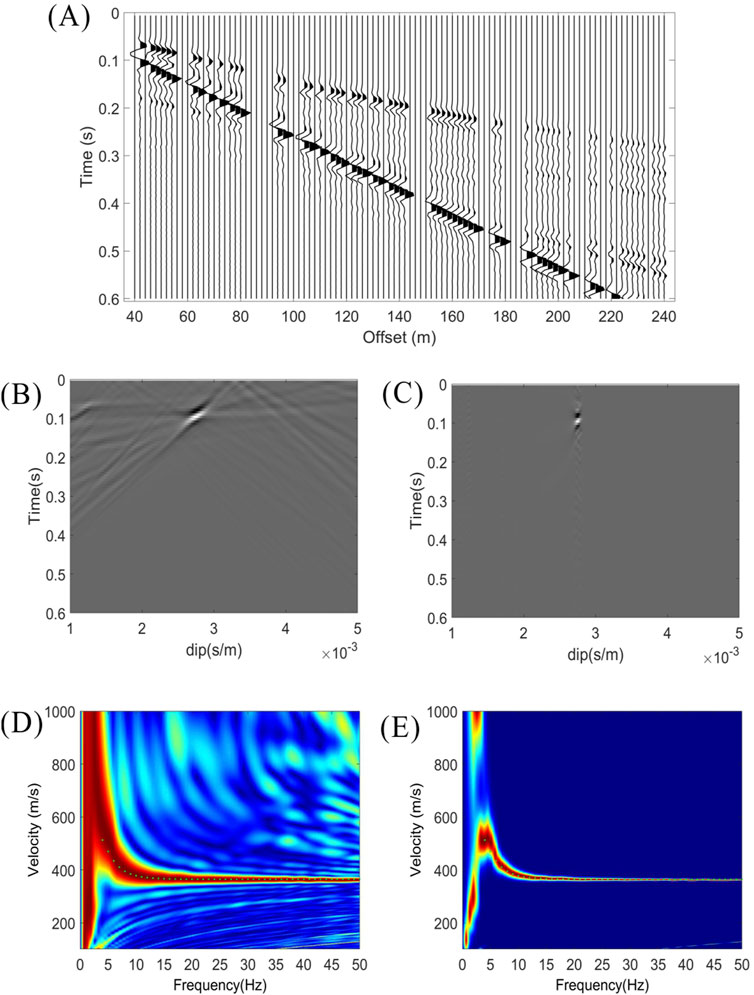
Figure 4. (A) The synthetic seismic shot gather with 40% randomly traces removed. (B,C) The Tau-P panels computed using the conventional method and the proposed high-resolution method, respectively. (D,E) The dispersion spectrums computed using the conventional method and the proposed high-resolution method, respectively.
Also, Figure 5 mainly shows the calculated dispersion spectrums from Figure 4A under different threshold values. Figures 5A–C illustrate the results of dispersion spectrum computation using the high-resolution Tau-P transform with threshold values set to 0.3, 0.6, and 0.95. Figure 5D illustrates the results of dispersion spectrum computation using high-resolution linear Radon transform (HR-LRT). When the threshold values are set to 0.3 and 0.6, the calculated dispersion spectrums exhibit lower resolution in the low-frequency range, which may lead to inaccurate dispersion curve picking. The high-resolution linear Radon transform also suffers from the same issue. When the threshold value is set to 0.95, the dispersion spectrum shows higher resolution and matches better with theoretical dispersion curve in the low-frequency range. Compared with the high-resolution linear Radon transform, the method proposed in this paper can achieve more accurate dispersion spectrums computation in the low-frequency components for irregularly sampled data through appropriate threshold adjustment.
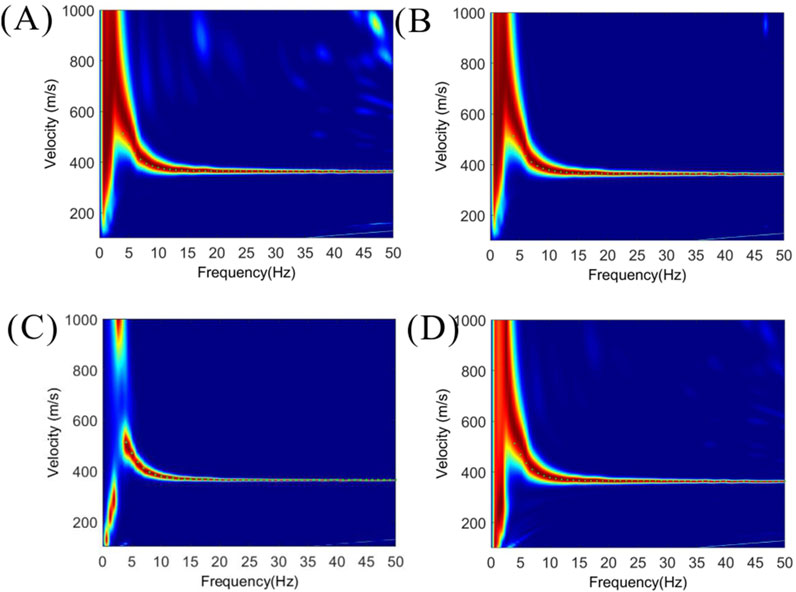
Figure 5. The dispersion spectrums computed from the synthetic seismic shot gather with 40% randomly traces removed. (A–C) The dispersion spectrums computed using the proposed high-resolution method and the threshold values are 0.3, 0.6, and 0.95, respectively. (D) The dispersion spectrum computed using the high-resolution linear Radon transform (HR-LRT).
4 Field data results
4.1 Dispersion spectrum computation and dispersion curve picking
This high-resolution algorithm for the computation of dispersion spectrums is also tested with field surface-wave datasets acquired in the suburb of Chengdu, the Sichuan province of China. We demonstrate the results for a shot gather with high signal-to-noise ratio and a shot gather with lower signal-to-noise ratio.
In the surface-wave shot gather in Figure 6A, there are a total of 240 receivers with a 2 m recording spacing, and the seismic source is located at the center of the recording array. We used only the right half of the shot gather for this test. As shown in this figure, strong surface waves are present in this dataset. We transformed the field data to a Tau-P domain using conventional Tau-P transform and the ISTA-based high-resolution Tau-P transform. As shown in the Figures 6B,C, the high-resolution Tau-P transform algorithm generates a remarkably more focused spectrum than the conventional Tau-P transform algorithm.
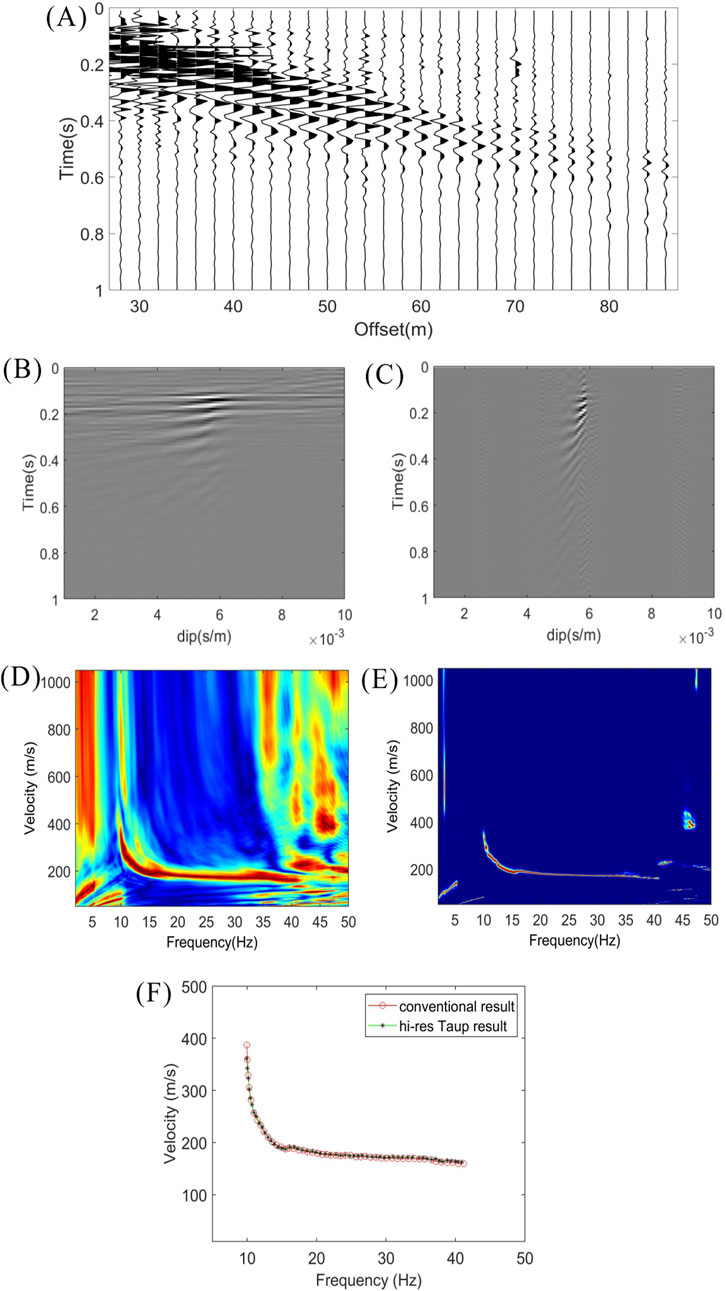
Figure 6. (A) A high signal-to-noise ratio shot gather. (B,C) The Tau-P panels computed using the conventional method and the proposed high-resolution method, respectively. (D,E) The dispersion spectrums computed using the conventional method and the proposed high-resolution method, respectively. (F) Dispersion curve picking from the dispersion spectrums. The red curve is picked from the conventional dispersion spectrum, and the black curve is the picked from the high-resolution dispersion spectrum.
Dispersion spectrums are computed for this shot gather with conventional Tau-P transform and the proposed high-resolution algorithm, as demonstrated in Figures 6D,E. In the figure, the threshold value is set to 0.9 and the dispersion spectrum computed with the proposed algorithm shows a much higher resolution than the one computed with conventional Tau-P transform and much fewer artifacts, especially for frequencies below 10 Hz and above 35 Hz.
This higher resolution and signal-to-noise ratio can significantly enhance the efficiency and precision in manual and automatic picking of the dispersion curves. In Figure 6F, the red curve is computed with conventional Tau-P trans-form and the green one is computed with the ISTA-based high-resolution Tau-P transform. Dispersion curves picked from these two spectrums show a close match between the two dispersion curves.
We test the proposed algorithm with a noisier shot gather from this dataset. As shown in Figure 7A, this shot gather contains components other than surface waves, such as P waves and noise, and the surface wave events are not as coherent as those in Figure 6A. Figures 7B,C show the dispersion spectrums of this shot gather computed with the conventional Tau-P transform and the proposed high-resolution version, and the threshold value is 0.8, and Figure 7D shows that the dispersion spectrum computed with high-resolution linear Radon transform (HR-LRT). The proposed high-resolution algorithm and HR-LRT method both produce a dispersion spectrum with much more focused energy and much less noise in the Figures 7C,D than the conventional Tau-P transform in the Figure 7B.
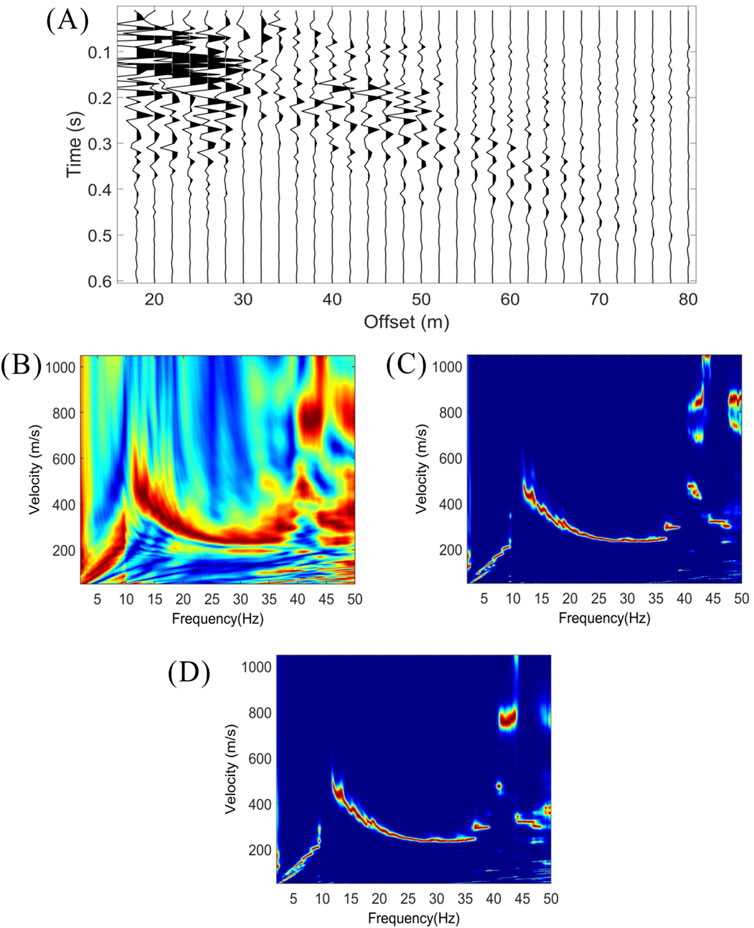
Figure 7. (A) A low signal-to-noise ratio shot gather. (B,C) The dispersion spectrums computed using the conventional method and the proposed high-resolution method, respectively. (D) The dispersion spectrum computed using the high-resolution linear Radon transform (HR-LRT).
We also test the proposed algorithm with a noisier shot gather which contains the 40% missing traces from this dataset. As shown in Figure 8A, due to the random removal of 40% seismic traces, continuous and distinct surface waves are invisible in the record.
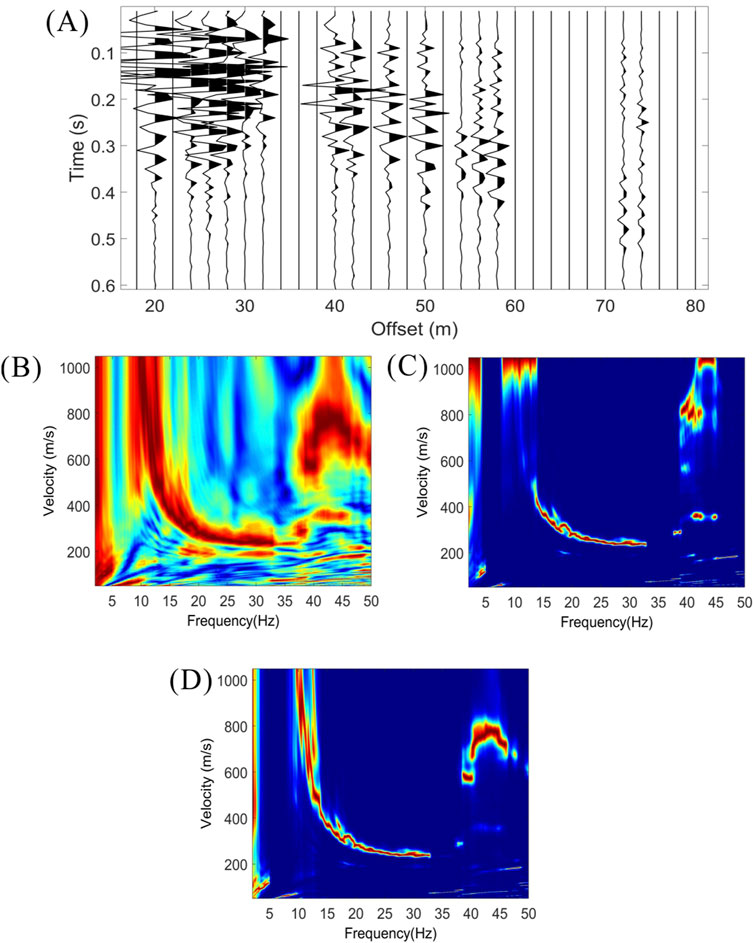
Figure 8. (A) A low signal-to-noise ratio shot gather with randomly traces removed 40%. (B,C) The dispersion spectrums computed using the conventional method and the proposed high-resolution method. (D) The dispersion spectrum computed using the high-resolution linear Radon transform (HR-LRT).
Figures 8B,C show the dispersion spectrums of this shot gather computed with the conventional Tau-P transform and the proposed high-resolution version, and the threshold value is 0.7. It shows that the proposed high-resolution algorithm produces a dispersion spectrum with much more focused energy and less noise than the conventional Tau-P transform. Figure 8D shows that the dispersion spectrum computed with high-resolution linear Radon transform (HR-LRT). Based on the dispersion spectrums obtained from irregularly sampled data, it can be observed that the proposed high-resolution algorithm demonstrates higher accuracy in the low-frequency components and matches better with the results derived from the complete gather shown in Figures 7B,C.
We also test the proposed high-resolution algorithm with a shot gather containing higher-mode surface wave energy in the Figure 9A. Figures 9B,C show the dispersion spectrums computed with the conventional Tau-P transform and the proposed high-resolution algorithm. As illustrated in the dispersion spectrums computed with the high-resolution algorithm captures the dispersion energies of different modes accurately, with remarkably improved resolution.
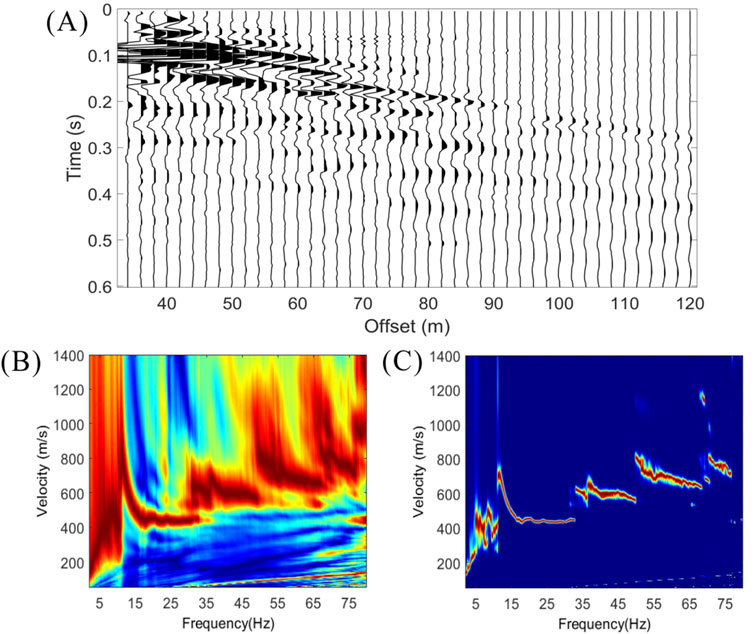
Figure 9. (A) A shot gather containing higher-mode surface waves. (B,C) The dispersion spectrums computed using the conventional method and the proposed high-resolution method, respectively.
4.2 Impact of high resolution dispersion spectrum on Vs inversion result
Inversion of dispersion curves is a crucial step in surface wave analysis for shear-wave velocity imaging. However, conventional algorithms usually produce a low-resolution and noisy dispersion spectrum at low frequencies, which decreases the accuracy of the picked dispersion curve and inversion results. In this part, we use another field surface-wave dataset to demonstrate the impact of the high-resolution algorithm on dispersion curve picking in the low-frequency zone and subsequent shear-wave velocity inversion results. We apply the proposed algorithm to a virtual surface-wave shot gather extracted from a 20-min roadside passive seismic data recording using a seismic interferometric method (Cao et al., 2021; 2023). Virtual surface-wave gathers usually contain strong interference components since they are extracted from noisy recordings. As shown in Figure 10A, strong surface-wave energy is extracted along with some noise interference in the gather.
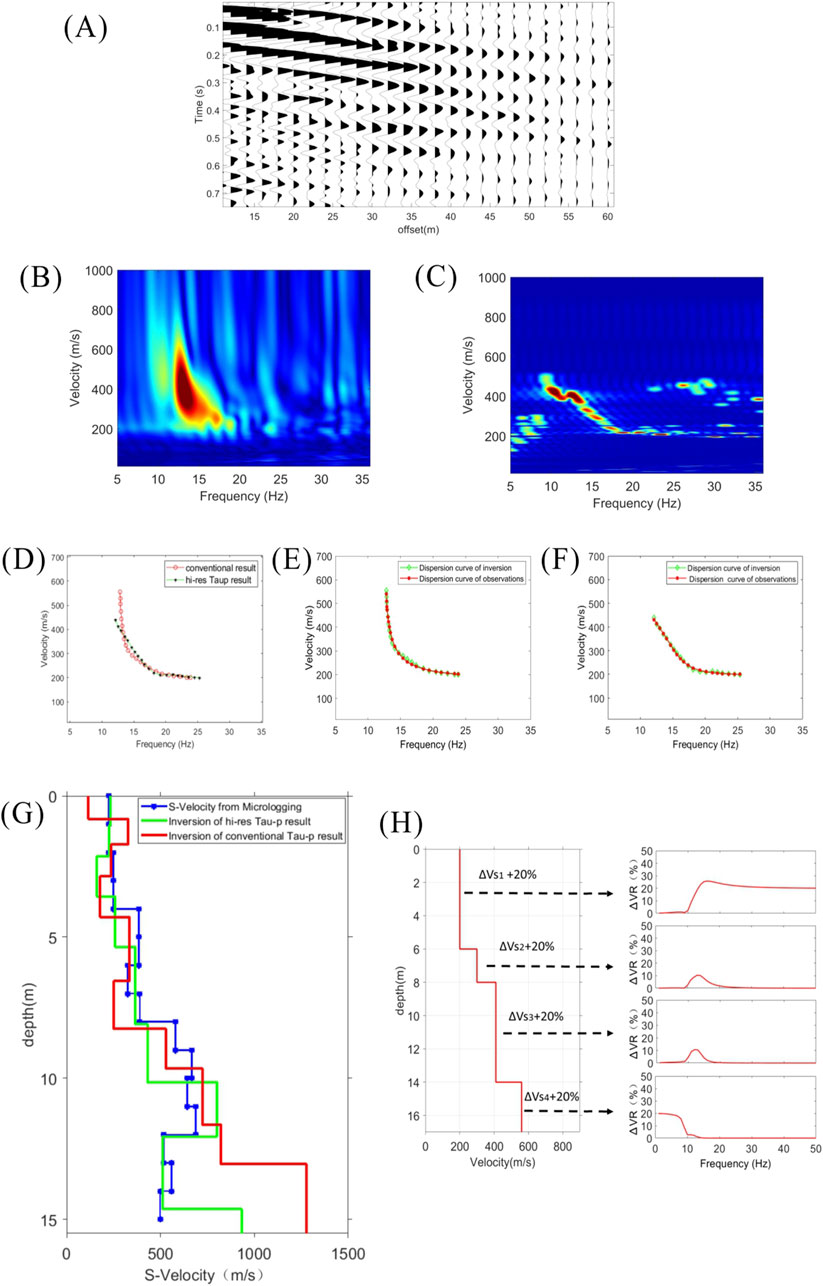
Figure 10. (A) A virtual surface-wave shot gather computed with deconvolution interferometry. (B,C) The dispersion spectrums computed using the conventional method and the proposed high-resolution method, respectively. (D) Dispersion curve picking from the dispersion spectrums. The red curve is picked from the conventional dispersion spectrum, and the black curve is the picked from the high-resolution dispersion spectrum. (E,F) The dispersion curve fitting results for the conventional method and the proposed high-resolution method, respectively. (G) The Vs inversion results for the dispersion curves calculated by the two methods. The red curve shows the inverted Vs associated with conventional Tau-P transform, and the green one is the inverted Vs associated with the proposed high-resolution algorithm; the blue curve is the Vs result computed from micrologging data. (H) The Sensitivity analysis of shear wave velocity at different depths corresponding to frequency bands.
Dispersion spectrums are computed for this virtual surface-wave shot gather with conventional Tau-P transform and the proposed high-resolution algorithm. As the Figure 10B shows, the dispersion spectrums in the low-frequency portions have a much lower resolution, and noise in recorded data can further blur the dispersion spectrum and add to the difficulty in dispersion curve picking in this zone. In Figure 10C, the high-resolution Tau-P transform algorithm generates a much sharper dispersion spectrum with less noise than the conventional Tau-P transform. Then dispersion curves are picked from these two dispersion spectrums, as shown in Figure 10D, These two dispersion curves overlap well for frequencies above 15 Hz, but there are clear discrepancies below 15 Hz. This observation is consistent with the remarkably lower resolution in the low frequencies in Figure 10B, since this low resolution significantly added to the ambiguity of dispersion curve picking.
With the dispersion curves in Figure 10D, Vs profiles are generated by a Monte-Carlo inversion method. Figures 10E,F respectively show the dispersion curve fitting results for the conventional method and the proposed high-resolution method. In addition, the inverted Vs profiles are displayed along with a Vs profile derived from collocated micrologging measurements, as shown in Figure 10G. It can be observed in Figure 10G that the two inverted Vs overlap well for a depth above 12 m and depart below this depth. This observation is consistent with the behavior of the dispersion curves in Figure 10D since deep Vs are mainly influenced by low frequencies. This result is consistent with longer wavelengths penetrate greater depths for a given mode, generally exhibit greater phase velocities, and are more sensitive to the elastic properties of the deeper layers. Conversely, shorter wavelengths are sensitive to the physical properties of near-surface layers, which indicates that low frequencies are more sensitive to deeper layers, while higher frequencies are more sensitive to shallower layers (Xia et al., 2004; Foti et al., 2014). For Vs below 12 m, the results associated with the high-resolution dispersion spectrum match much better with the micrologging result than the result associated with the low-resolution spectrum, indicating that the high-resolution spectrum enables a more precise Vs inversion through more accurate dispersion curve picking in the low-frequency zone. To further assess the reliability of the inversion results, a theoretical layered model was constructed by integrating three sets of Vs profiles, as shown in Figure 10H. The sensitivity of the dispersion curves to variations in shear wave velocity at different layers was investigated by independently increasing Vs values in each layer. Specifically, a 20% increase in Vs4 resulted in significant changes in the dispersion curves within low-frequency zone. When Vs3 was increased by 20%, notable variations appeared primarily in the 10–15 Hz band. In contrast, a 20% increase in Vs1 induced sensitivity in frequencies above 10 Hz. And the actual results are consistent with the theoretical test outcomes. Since micrologging is a more direct measurement of the Vs from boreholes, Vs from micrologging is generally believed to have high fidelity. Therefore, Figure 10G indicates that the Vs profile achieved using the high-resolution dispersion spectrum has higher precision than the inverted one based on the low-resolution dispersion spectrum.
5 Discussion
In this paper, the computation of dispersion spectrums for surface waves is discussed. A high-resolution computation algorithm is proposed because dispersion spectrum computation is an essential step in surface wave data processing. In many scenarios, such as short data-recording apertures or at low frequencies, the computed dispersion spectrums demonstrate low resolution and pose a severe challenge for accurate dispersion curve picking and subsequent Vs estimation. This proposed high-resolution algorithm demonstrates a clearly enhanced resolution and precision in computed dispersion spectrums compared to the conventional methods. Also, this method is easy to implement and parameterize because of the simplicity of the algorithm. Therefore, this method is a very use-full tool to tackle the aforementioned challenges.
Moreover, this high-resolution algorithm is based on a sparse inversion algorithm, which can effectively suppress random noise in the input seismic data. Compared with other higher-resolution methods, the proposed method can still compute more accurate and higher-resolution dispersion spectrums from irregularly sampled data by adjusting the threshold parameter appropriately. The high-resolution algorithm demonstrates superior applicability in processing surface wave data acquired from logistically constrained environments, such as densely constructed urban areas characterized by complex infrastructure, where acquisition operations face significant challenges. Similarly, this method is also applicable to processing irregular sampled data collected by seismic stations. As illustrated in the computed dispersion spectrums, the proposed algorithm also achieves a higher signal-to-noise ratio, and this enhancement can also increase the accuracy and efficiency of dispersion curve picking and subsequent Vs estimation. The advantages can benefit surface wave imaging, especially recently developed passive surface wave imaging methods. With the development of novel seismic acquisition tools such as autonomous nodes and fiber-optic acoustic sensing systems, passive surface wave imaging is garnering increasing popularity because of its advantages of real-time monitoring and environmental friendliness. However, the strong noise in the extracted surface waves usually degrades the accuracy and efficiency of dispersion curve extraction and Vs imaging precision. This proposed high-resolution algorithm has demonstrated significant potential in this area, and, combined with machine learning algorithms, it could further improve the efficiency and precision of passive surface imaging and monitoring.
6 Conclusion
This paper presents a novel method for computing high-resolution dispersion spectrums for surface waves. The proposed approach utilizes a Tau-P transform, which is further enhanced by incorporating the Iterative Shrinkage Thresholding Algorithm (ISTA) to effectively sparsify the Tau-P coefficients. The efficacy of the proposed method is demonstrated through both synthetic and field data tests, where it is shown to generate high-resolution dispersion spectrums that closely match the theoretical dispersion curve. The results also indicate that the proposed method yields a higher resolution and fewer artifacts in the dispersion spectrums, which can improve the precision and efficiency of dispersion curve picking in subsurface surface wave imaging. This benefit is of special significance, since the surface wave data volume is rapidly increasing, and the demand of real-time automatic processing is ever-increasing with the advancement of data acquisition technologies. Field tests also demonstrate inverted Vs associated with the proposed high-resolution method match better with collocated micrologging results in the deep part, indicating more precise Vs derived from the higher resolution spectrum generated with the proposed method. This experiment suggests that a high-resolution spectrum computed with the proposed method could enable more reliable Vs inversion results for scenarios of low-resolution dispersion spectrums, such as low frequencies and short recording arrays. The approach presented in this research offers a valuable instrument to improve the precision and efficiency of subsurface geological structures and rock properties’ comprehension. Consequently, it has significant potential to enhance the identification and development of hydrocarbon and mineral resources in a more efficient manner.
Data availability statement
The original contributions presented in the study are included in the article/supplementary material, further inquiries can be directed to the corresponding author.
Author contributions
LL: Conceptualization, Data curation, Formal Analysis, Investigation, Methodology, Software, Validation, Writing – original draft, Writing – review and editing. XH: Conceptualization, Funding acquisition, Project administration, Supervision, Writing – review and editing. WC: Conceptualization, Formal Analysis, Funding acquisition, Methodology, Software, Writing – review and editing. HY: Formal Analysis, Investigation, Software, Validation, Writing – review and editing. YX: Conceptualization, Software, Supervision, Writing – review and editing. HZ: Investigation, Supervision, Validation, Writing – review and editing. BW: Data curation, Investigation, Resources, Writing – review and editing.
Funding
The author(s) declare that financial support was received for the research and/or publication of this article. This work is supported in part by the National Natural Science Foundation of China No. 42174180; Sichuan Science and Technology Program No. 2025ZNSFSC0004; National Natural Science Foundation of China No. U24B2022.
Conflict of interest
Author WC was employed by SLB.
The remaining authors declare that the research was conducted in the absence of any commercial or financial relationships that could be construed as a potential conflict of interest.
Generative AI statement
The author(s) declare that no Generative AI was used in the creation of this manuscript.
Publisher’s note
All claims expressed in this article are solely those of the authors and do not necessarily represent those of their affiliated organizations, or those of the publisher, the editors and the reviewers. Any product that may be evaluated in this article, or claim that may be made by its manufacturer, is not guaranteed or endorsed by the publisher.
References
Aki, K., and Richards, P. (1980). Quantitative seismology; W. H. San Francisco, CA, USA: Freeman and Company.
Beck, A., and Teboulle, M. (2009). A fast iterative shrinkage-thresholding algorithm for linear inverse problems. SIAM J. imaging Sci. 2 (1), 183–202. doi:10.1137/080716542
Behm, M., and Snieder, R. (2013). Love waves from local traffic noise interferometry. The Leading Edge 32 (6), 628–632.
Bensen, G. D., Ritzwoller, M. H., Barmin, M. P., Levshin, A. L., Lin, F., Moschetti, M. P., et al. (2007). Processing seismic ambient noise data to obtain reliable broad-band surface wave dispersion measurements. Geophys 169, 1239–1260. doi:10.1111/j.1365-246x.2007.03374.x
Cao, J., Liu, J., Yin, H., Cai, Z., Yang, Q., Yang, H., et al. (2025). Can the compressed sensing theory be utilized in active source surface wave exploration? A primary result. J. Geophys. Eng. 22 (1), 149–164. doi:10.1093/jge/gxae125
Cao, W. P., Huang, X. R., Hu, Y. Z., Xu, Y., Tang, J., and Yao, H. (2023). Improving surface wave retrieval from traffic noise by deconvolution of the decomposed wavefield. Earth Space Sci. 10. doi:10.1029/2022ea002713
Cao, W. P., Huang, X. R., Yao, H., Hu, Y. Z., Xu, Y. G., and Tang, J. (2021). Seismic interferometry for traffic noise recorded by a distributed acoustic sensing system. Chin. J. Geophys 64. doi:10.6038/cjg2021O0513
Chambolle, A., De Vore, R. A., Lee, N. Y., and Lucier, B. J. (1998). Nonlinear wavelet image processing: variational problems, compression, and noise removal through wavelet shrinkage. IEEE Trans. Image Process 7, 319–335. doi:10.1109/83.661182
Cheng, F., Xia, J., and Xi, C. (2023). Artifacts in high-frequency passive surface wave dispersion imaging: toward the linear receiver array. Surv. Geophys 44, 1009–1039. doi:10.1007/s10712-023-09772-1
D'Amico, V., Picozzi, M., Baliva, F., and Albarello, D. (2008). Ambient noise measurements for preliminary site-effects characterization in the urban area of florence. Bull. Seism. Soc. Am. 98, 1373–1388. doi:10.1785/0120070231
Daubechies, I., Defrise, M., and Mol, C. D. (2004). An iterative thresholding algorithm for linear inverse problems with a sparsity constraint. Comm. Pure Appl. Math. 57, 1413–1457. doi:10.1002/cpa.20042
Figueiredo, M. A. T., and Nowak, R. D. (2003). An EM algorithm for wavelet-based image restoration. IEEE Trans. Image Process 12, 906–916. doi:10.1109/tip.2003.814255
Foti, S., Lai, C. G., Rix, G. J., and Strobbia, C. (2014). Surface wave methods for near-surface site characterization. London: CRC Press. doi:10.1201/b17268
Foti, S., Parolai, S., Albarello, D., and Picozzi, M. (2011). Application of surface-wave methods for seismic site characterization. Surv. Geophys 32, 777–825. doi:10.1007/s10712-011-9134-2
Gabriels, P., Snieder, R., and Nolet, G. (1987). In situ measurements of shear-wave velocity in sediments with higher-mode Rayleigh waves. Geophys. Prospect. 352, 187–196. doi:10.1111/j.1365-2478.1987.tb00812.x
Gong, X., Wang, S., and Zhang, T. (2016). Velocity analysis using high-resolution semblance based on sparse hyperbolic Radon transform. J. Appl. Geophys. 134, 146–152. doi:10.1016/j.jappgeo.2016.09.013
Hu, H., Senkaya, M., and Zheng, Y. C. (2018). A novel measurement of the surface wave dispersion with high and adjustable resolution: multi-channel nonlinear signal comparison. J. Appl. Geophys 160, 236–241. doi:10.1016/j.jappgeo.2018.11.015
Hu, H., and Zheng, Y. C. (2019). Data-driven dispersive surface-wave prediction and mode separation using high-resolution dispersion estimation. J. Appl. Geophys 171, 103867. doi:10.1016/j.jappgeo.2019.103867
Hu, S., Luo, S., and Yao, H. (2020). The Frequency-Bessel spectrograms of multicomponent cross-correlation functions from seismic ambient noise. J. Geophys. Res. Solid Earth 125 (8), e2020JB019630. doi:10.1029/2020jb019630
Kelly, K. R., Ward, R. W., Treitel, S., and Alford, R. M. (1976). Synthetic seismograms: a finite difference approach. Geophysics 41, 2–27. doi:10.1190/1.1440605
Lee, W. B., and Solomon, S. (1979). Simultaneous inversion of surface-wave phase velocity and attenuation: Rayleigh and Love waves over continental and oceanic paths. Bull. Seismol. Soc. Am. 69, 65–95. doi:10.1029/JB083iB07p03389
Li, J., Feng, Z., and Schuster, G. (2017). Wave-equation dispersion inversion. Geophys 208, 1567–1578. doi:10.1093/gji/ggw465
Li, Z. X., and Li, Z. C. (2017). Accelerated parabolic Radon domain 2D adaptive multiple subtraction with fast iterative shrinkage thresholding algorithm and its application in parabolic Radon domain hybrid demultiple method. J. Appl. Geophys. 143, 86–102. doi:10.1016/j.jappgeo.2017.04.014
Luo, Y., Xia, J., Miller, R. D., Xu, Y., Liu, J., and Liu, Q. (2008). Rayleigh-wave dispersive energy imaging using a high-resolution linear Radon transform. Pure Appl. Geophys 165, 903–922. doi:10.1007/s00024-008-0338-4
Mcmechan, G. A., and Yedli, M. J. (1981). Analysis of dispersive waves by wave field transformation. Geophysics 46, 869–874. doi:10.1190/1.1441225
Mi, B., Xia, J., Shen, C., Wang, L., Hu, Y., and Cheng, F. (2017). Horizontal resolution of multichannel analysis of surface waves. Geophysics 82, 51–EN66. doi:10.1190/geo2016-0202.1
Mukherjee, S., Bhaumik, M., and Naskar, T. (2025). Modified S-transform based high-resolution dispersion imaging method for multi-channel surface wave data. Soil Dyn. Earthq. Eng. 192, 109284. doi:10.1016/j.soildyn.2025.109284
Mukherjee, S., and Elita, Y. (2022). “Poisson binomial-based random undersampling scheme for near-surface compressive sensing,” in Second international meeting for applied geoscience and energy, 66–70.
Nakata, N., Snieder, R., Tsuji, T., Larner, K., and Matsuoka, T. (2011). Shear wave imaging from traffic noise using seismic interferometry by cross-coherence. Geophysics 76, SA97–SA106. doi:10.1190/geo2010-0188.1
Nazarian, S., Stokoe, H., and Hudson, W. R., (1983). Use of spectral analysis of surface waves method for determination of moduli and thicknesses of pavement systems; national research council, transport research record No. 930; falmer: Washington, DC, USA,
Pan, Y., Gao, L., and Bohlen, T. (2019). High-resolution characterization of near-surface structures by surface-wave inversions: from dispersion curve to full waveform. Geophys 40, 167–195. doi:10.1007/s10712-019-09508-0
Park, C. B., and Miller, R. D. (2008). Roadside passive multichannel analysis of surface waves (MASW). J. Environ. Eng. Geophys 13, 1–11. doi:10.2113/jeeg13.1.1
Park, C. B., Miller, R. D., and Xia, J. (1999a). Multichannel analysis of surface waves. Lead. Edge 18, 800–808. doi:10.1190/1.1444590
Park, C. B., Miller, R. D., and Xia, J. H. (1999b). Imaging dispersion curves of surface waves on multi-channel record; SEG expanded abstracts. Houston, TX, USA: Society of Exploration Geophysicists.
Qin, S., Rong, X. R., Wang, Z. N., Sun, C., Guo, Y., and Wu, D. (2021). A high-resolution dispersion imaging method of seismic surface waves based on chirplet transform. J. Geophys. Eng. 18, 908–919. doi:10.1093/jge/gxab061
Serdyukov, A. S., Yablokov, A. V., Duchkov, A. A., Azarov, A. A., and Baranov, V. D. (2019). Slant f-k transform of multichannel seismic surface wave data. Geophysics 84 (1), A19–A24. doi:10.1190/geo2018-0430.1
Shao, G. Z., and Li, Q. C. (2010). Joint application of τ-p and phase-shift stacking method to extract ground wave dispersion curve. Oil Geophys. Prospect 45, 836–840. doi:10.13810/j.cnki.issn.1000-7210.2010.06.010
Stokoe, H. S. G., Bay, W. J. A., and Roesset, J. M. (1994). “Characterization of geotechnical sites by SASW method,” in Geophysical characterization of sites. Editor R. D. Woods (Rotterdam, Netherlands: A.A. Balkema), 15–25.
Wang, J., Wu, G., and Chen, X. (2019). Frequency-Bessel transform method for effective imaging of higher-mode Rayleigh dispersion curves from ambient seismic noise data. J. Geophys. Res. Solid Earth 124 (4), 3708–3723. doi:10.1029/2018jb016595
Xia, J., Miller, R. D., Park, C. B., Ivanov, J., Tian, G., and Chen, C. (2004). Utilization of high-frequency Rayleigh waves in near-surface geophysics. Lead. Edge 23 (8), 753–759. doi:10.1190/1.1786895
Xia, J. H., Xu, Y., and Miller, R. D. (2007). Generating an image of dispersive energy by frequency decomposition and slant stacking. Pure Appl. Geophys 164, 941–956. doi:10.1007/s00024-007-0204-9
Yang, C. Y., Wang, Y., and Lu, J. (2011). Application of Rayleigh waves on PS-wave static corrections. J. Geophys. Eng. 9, 90–97. doi:10.1088/1742-2132/9/1/011
Yang, Z. T., Chen, X. F., Pan, L., Wang, J. N., Xu, J. X., and Zhang, D. Z. (2019). Multi-channel analysis of Rayleigh waves based on the vector wavenumber transformation method (VWTM). Chin. J. Geophys 62, 298–305. doi:10.6038/cjg2019M0641
Yi, J., Liu, Y. K., Hu, H., Zhang, Y., and Yang, Z. (2021). High-resolution multimode surface-wave dispersion spectrum imaging with a multichannel signal comparison method. Chin. J. Geophys 64, 1710–1720. doi:10.6038/cjg2021O0184
Yilmaz, Ö., Eser, M., and Berilgen, M. (2006). A case study of seismic zonationin municipal areas. Lead. Edge 25, 319–330. doi:10.1190/1.2184100
Zhan, Z., Li, Q., and Huang, J. (2018). Application of wavefield compressive sensing in surface wave tomography. Geophys. J. Int. 213 (3), 1731–1743. doi:10.1093/gji/ggy082
Keywords: surface wave, dispersion spectrum, Tau-p transform, high resolution, shear-wave velocity, irregularly sampled data
Citation: Li L, Huang X, Cao W, Yao H, Xu Y, Zhao H and Wu B (2025) High-resolution surface wave dispersion spectrum computation based on iterative threshold shrinkage algorithm and its application to irregularly sampled data. Front. Earth Sci. 13:1600734. doi: 10.3389/feart.2025.1600734
Received: 26 March 2025; Accepted: 30 June 2025;
Published: 11 July 2025.
Edited by:
Sanjit Kumar Pal, IIT(ISM) Dhanbad, IndiaReviewed by:
Xuping Feng, Southern University of Science and Technology, ChinaDunshi Wu, Northwest Branch of PetroChina Exploration and Development Research Institute, China
Copyright © 2025 Li, Huang, Cao, Yao, Xu, Zhao and Wu. This is an open-access article distributed under the terms of the Creative Commons Attribution License (CC BY). The use, distribution or reproduction in other forums is permitted, provided the original author(s) and the copyright owner(s) are credited and that the original publication in this journal is cited, in accordance with accepted academic practice. No use, distribution or reproduction is permitted which does not comply with these terms.
*Correspondence: Weiping Cao, Y2Fvd2VpcGluZ18yMDA0QGFsaXl1bi5jb20=