 Xiufeng Zhang1Guoying Li1Yang Chen1Hao Wang1
 Haikuan Zhang2*Haitao Li2
 Weisheng Du2Xiao Li2Xuewei Xu2Yuze He2
- 1Coal Industry Management Department, Shandong Energy Group Co., Ltd., Jinan, Shandong, China
- 2Deep Mining and Rock Burst Research Branch, Chinese Institute of Coal Science, Beijing, China
The prediction and classification of rockburst risk based on microseismic data is the premise of preventing rockbursts during deep mine excavation. By reviewing previous studies, this paper finds two problems that hinder the rockburst prediction: 1) there is a lack of research on the distribution features of monitoring data on the main controlling factors of rockbursts; 2) there is no research on the intra-class variance and inter-class gap of microseismic data. Based on the typical rockburst risk events, a quantitative information model of geology and mining is constructed. The relationship between the spatial–temporal distribution characteristics of microseismic data before a rockburst and the main controlling factors of a rockburst is studied. The results show that the distribution features may be different for the same type of microseismic (MS) and rockburst events, and different types of events may show similar distribution features. Therefore, based on the quantitative study of the relationship between the performance of a deep learning prediction algorithm and a rockburst prediction vector, a rockburst risk and type prediction algorithm based on a convolutional neural network (CNN)-gated recurrent unit (GRU) model with prototype-based prediction is proposed. The CNN-GRU model can produce prediction vectors by fusing implicit and explicit information extracted from the original MS data and early warning indicators. Cross-entropy loss, vector-prototype contrastive loss, and vector-prototype contrastive loss are proposed to automatically control the intra-class variance and inter-class gap of prediction vectors belonging to different rockburst risks and types. Many experiments show that the performance of the proposed CNN-GRU model with prototype-based prediction is superior to other algorithms in the prediction of rockburst risks and types based on MS data.
1 Introduction
As underground mining and excavations continue to expand at a rapid pace, a significant engineering challenge arises in the instability of the surrounding rock masses (Aydan et al., 2017). Rockburst, a representative instability phenomenon, is caused by the abrupt release of accumulated elastic strain energy, posing a grave threat to the safety of workers and causing extensive damage to underground engineering structures (Basnet et al., 2023). A significant number of researchers are committed to addressing this challenge by elucidating the occurrence mechanism (Askaripour et al., 2022; He et al., 2023), enhancing prediction accuracy (Basnet et al., 2023; Pu et al., 2019), and developing effective control measures (Li et al., 2019; He et al., 2018). Rockburst prediction aims to generate accurate signals prior to the occurrence of these disasters, serving as a prerequisite for controlling and managing the rockburst hazards. Nevertheless, due to its unpredictable emergence and numerous influencing factors, rockburst prediction remains a challenging task that has yet to be fully resolved.
Rockburst prediction is conventionally classified into long-term prediction and short-term prediction (Liang et al., 2020). Long-term rockburst prediction endeavors to utilize rock mechanical parameters for constructing a prediction model with the aim of assessing the rockburst probability and types of diverse surrounding rock masses under assorted field conditions. This task is customarily accomplished during the initial stage of engineering design or excavation (Liang and Zhao, 2022). The objective of short-term rockburst prediction, on the other hand, is to predict the time, types, and damage magnitude of dangerous rockburst events by conducting dynamic and static analyses on real-time monitoring data. It is typically carried out during the excavation period (Jinqiang et al., 2021). To attain satisfactory outcomes, researchers are dedicated to applying diverse methods for rockburst prediction, such as empirical analytical (He et al., 2018; Yang et al., 2018), experimental (Hu et al., 2023; Cheng et al., 2023), numerical (Wang et al., 2021; Manouchehrian and Cai, 2018), intelligent (Adoko and Zvarivadza, 2018; Xue et al., 2023), and expert system (Li et al., 2020) methods. Although each rockburst prediction method has its own advantages, in contrast to intelligent methods, traditional prediction methods hinge on extensive expert experience and meticulous judgment. Therefore, the machine learning method represents a promising alternative and has been adopted by numerous researchers to dissect and handle the intricate and nonlinear process of rockburst prediction.
Microseismic (MS) monitoring is a widely acknowledged and highly effective tool for identifying the dangerous signals and key controlling factors of rockburst types for short-term rockburst prediction. It is capable of monitoring the occurrence of rockbursts by extracting valuable signals that propagate from the fracturing process of rock masses. Recently, by capitalizing on the capabilities of machine learning in handling nonlinear problems, scholars have directed their attention to rockburst prediction based on MS data through the application of existing machine learning algorithms. Such algorithms encompass support vector machine (SVM) (Ji et al., 2020; Jin et al., 2022), convolutional neural network (CNN) (Dong et al., 2023; Zhang et al., 2021; Yin et al., 2021a), variants of RNN (Hu et al., 2023; Di et al., 2023a; Di et al., 2023b), convolutional long short-term memory (ConvLSTM) (Chen et al., 2023; Ma et al., 2021), and ensemble-learning (Liang et al., 2020; Yin et al., 2021b; Liang et al., 2021), among others (Yin et al., 2024a; Yin et al., 2024b; Cheng et al., 2024; Yin et al., 2021c). Zhang et al. (2021) and Yin et al. (2021a) have conducted an exploration of the key microseismic indexes that can characterize the development process of rockbursts and have applied the refined convolutional neural network (CNN) to predict rockbursts. In order to depict the spatiotemporal relationship within microseismic data and process the spatiotemporal indexes for rockburst prediction, Chen et al. (2023) developed a deep learning model founded on a ConvLSTM to forecast short-term rockburst risks. Concurrently, the ensemble-learning methodologies (Liang et al., 2020; Yin et al., 2021b; Liang et al., 2021) have also been employed to acquire a highly potent rockburst prediction model relying on MS parameters.
Previous research on the rockburst prediction first analyzed the distribution features of microseismic data before a rockburst occurred. Then, the rockburst prediction indexes are presented, and the machine learning algorithm is used to describe the relationship between the rockburst prediction indexes and the future rockburst risks and types. However, these studies ignore the influence of the main controlling factors of rockbursts on the distribution of MS events before a rockburst occurs. In the rockburst prediction and classification process, there is no quantitative analysis of the influence of the intra-class variance and inter-class gap of prediction vectors on the prediction accuracy. The prediction vectors are the result of rockburst prediction indexes or MS data processing by deep learning encoders.
A quantitative information model of geology and mining is constructed based on the different types of rockburst risk events. The temporal and spatial distribution characteristics of MS data before a rockburst, in the main controlling factors of rockburst (i.e., geological structure, roof, coal pillar, and high-stress coal mass), are studied. The results show that the distribution features of microseismic and rockburst events of the same type may differ, and different types of events may show similarities in space-time distribution. The relationship between the performance of a deep learning prediction algorithm and the prediction vector of rockbursts is studied. The rockburst prediction model must accurately distinguish the differences between different types of data and accurately describe the intra-class variance of monitoring data.
A rockburst risk and type prediction method based on a convolutional neural network (CNN)-gated recurrent unit (GRU) and prototype learning prediction head is proposed. The CNN-GRU model can generate prediction vectors by integrating both implicit and explicit information derived from original microseismic (MS) data and prediction indexes. Through the use of cross-entropy loss, vector-prototype contrastive loss, and inter-vector-prototype contrastive loss, the model can autonomously manage the intra-class variance and inter-class distance of prediction vectors corresponding to different rockburst risks and types. Extensive experimental results demonstrate that our proposed CNN-GRU model with prototype-based prediction outperforms alternative algorithms in forecasting rockburst risks and types using MS data.
2 Spatial–temporal and intensity evolution of rockbursts in MS data
Although the factors influencing rockbursts are complex, four controlling factors affecting the structure and stress of rockbursts are commonly recognized: geological structure, hard rock strata, coal pillars, and mining depth. The geological and mining data related to these four factors from typical rockburst events are first quantified. For each working face, the mining progress over a 10-day sliding window throughout the entire mining process is calculated. The geological and mining information models corresponding to different working faces are constructed. Then, by projecting the MS data to the quantified geological and mining information model, MS events and rockbursts are simply divided into four types, that is, the hard rock roof type, geological structure type, coal pillar type, and mining depth type, as shown in Figure 1. Some events are caused by more than one controlling factor.
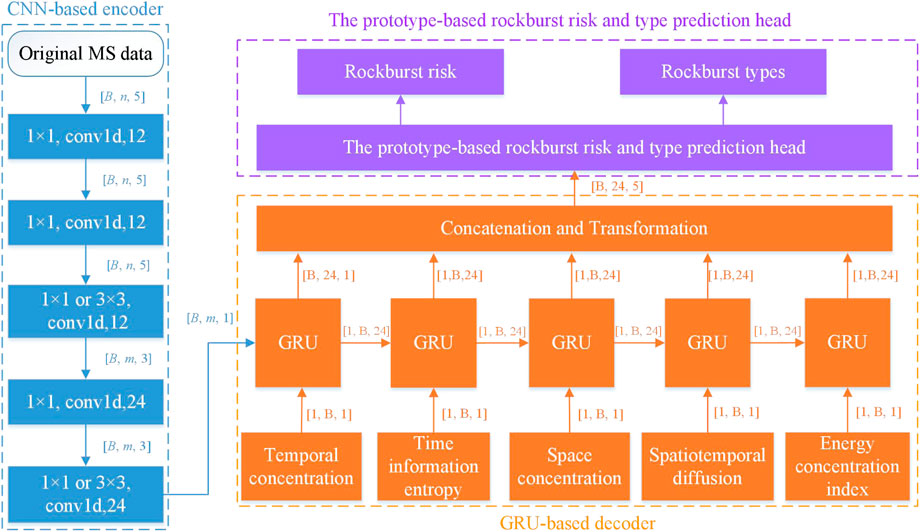
Figure 1. The architecture of the CNN-GRU rockburst risk and type prediction model with a prototype-based prediction head.
Figure 2 shows that the distribution of different types of MS events is disordered and irregular within 10 days before the rockburst. Even for the same type of events, microseismic events are clustered in several central regions and do not show similar distribution characteristics. Meanwhile, the same type of MS events is clustered in several central regions and do not show similar distribution characteristics. During long-term mining, most MS events show the characteristics of irregularity and relatively uniform distribution and occur in the area where the main control factors are active. When MS events occur intensively in some special areas, it indicates that there is a rockburst risk in the area. When MS events occur intensively in some special areas during the short term, this indicates that there is a rockburst risk in these areas.
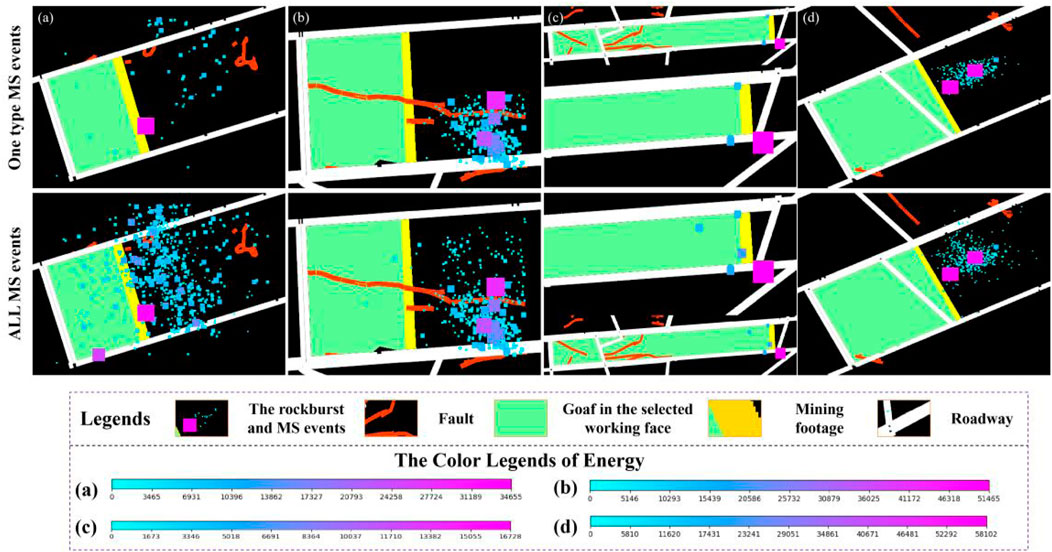
Figure 2. Rockbursts and MS events caused by different main controlling factors within the working face. The MS data of all figures are within 10 days of the rockburst occurrence. The first-row figures show the dangerous MS events influenced by the (a) hard rock roof, (b) geological structure, (c) coal pillar, or (d) gravity or mining depth factors. The second row figures show the projection results of all MS data.
The sequential expansion of the time and MS energy across the entire working face is illustrated in Figure 3. Over the long term, it is obvious that the main active controlling factors of a rockburst are the same as those of most MS events. This is because there are structural planes that hinder energy propagation among these four main controlling factors, and the occurrence area of most MS events can be used to determine the destination or main path of energy propagation. The variation of MS energy over time scales is disordered. From a short-term perspective within a rockburst occurrence, the energy and frequency of MS events have increased slightly, showing a relatively active state.
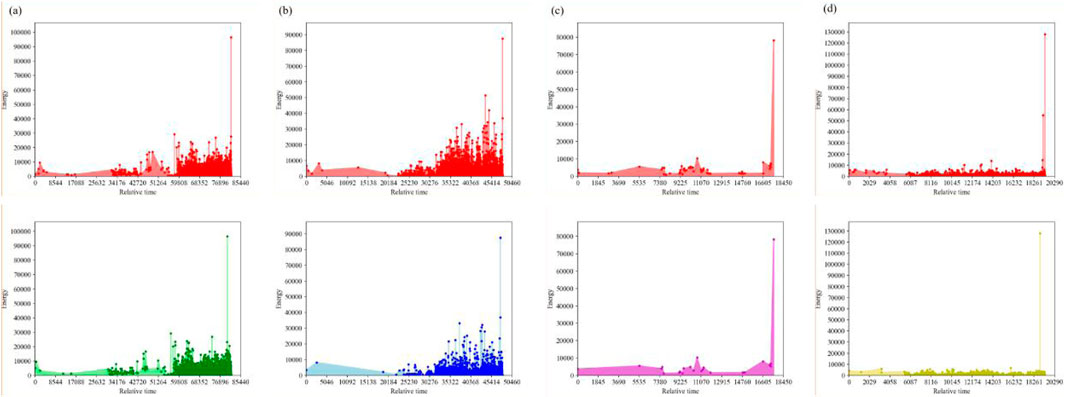
Figure 3. Time sequence exhibition of various MS events within the working faces where a (a) hard rock roof type rockburst, (b) geological structure type rockburst, (c) coal pillar type rockburst, and (d) mining depth or gravity type rockburst occurs. Selected working faces are the same as those in Figure 3. The MS event with the maximum energy value is the rockburst.
In summary, the MS events can be divided into four types according to the time and space projection of MS events on the controlling factors. For the entire mining process, all types of MS events are disordered and irregular in terms of temporal and spatial characteristics. When the same type of MS events evolves from disordered and scattered to ordered and intensive, the main controlling factor area may have a rockburst hazard. However, even in the short term of rockburst occurrence, MS events are clustered within several centers on the time and space scale. Therefore, it is difficult and complex to summarize the temporal and spatial characteristics of the same type of MS data and accurately distinguish between different types.
3 Relationship of prediction head and rockburst prediction vectors
In this paper, the content of rockburst prediction includes the risk and type. There are two rockburst risk prediction results: dangerous and non-dangerous. There are four rockburst type prediction results: gravity type, coal pillar type, roof type, and tectonic type. For the machine learning-based rockburst risk and type prediction method, the algorithms mainly consist of the encoder, decoder, and prediction head. The encoder is mainly responsible for analyzing the input MS data and extracting data features. For most previous rockburst prediction methods, the function of an encoder was replaced by the calculation formulas of prediction indexes. The decoder analyzes the feature space of the data features and processes them into vectors with rockburst risk and type information. The final prediction head maps such vectors to the probabilities of rockburst risk and rockburst types.
This section takes rockburst risk prediction as an example to study the distribution requirement of decoder output vectors and representative vectors in the prediction head. For the traditional rockburst risk prediction head, it is reasonable to assume that there are two representative vectors, that is, a non-dangerous representative vector w1 and a dangerous representative vector w2. After the rockburst prediction vector v is obtained, the essence of this problem is to determine the probability that v belongs to risk class C according to the relationship between v and the representative vector wc in the prediction head, which can be regarded as follows:
The least squares error between the dangerous probability calculated based on the vector v and the target yi can be written as follows:
where N is the total number of samples. To simplify the calculation, the C label is changed to yc = N/N1, and the other label is changed to
where mc and
where
where k is the class index. The SW is
The inter-class distance can be expressed as
where the SB is
According to Equation 6, the following equation can be obtained.
Combining Equation 8 and Equation 9, Equation 4 can be transformed to
Setting Equation 10 to zero, the following equation can be obtained:
Due to the differences in the monitoring data, SW is positive and not proportional to the unit matrix. Therefore, in the task of rockburst risk prediction, the vector v should not only maximize the variance between categories (
4 CNN-GRU model with the prototype-based prediction head
According to the analysis in Section 2 and Section 3, the distribution of rockburst data is very complicated, and it is difficult to describe the distribution of rockburst prediction vectors belonging to one rockburst risk class or type by a representative vector in the traditional classifier head. Moreover, the traditional prediction headers based on single or multi-layer perceptrons are updated by backpropagation. This results in the distribution space of the rockburst prediction vectors that cannot be reasonably controlled. Therefore, a novel CNN-GRU algorithm for comprehensively analyzing the original MS data and rockburst prediction indexes is presented to project the MS data to rockburst risk and type prediction vectors by automatically analyzing and fusing the spatiotemporal distribution features of MS data. Then, a prototype-based rockburst risk and type prediction head that can control the inter-class distance and intra-class variance of the prediction vectors is constructed.
4.1 The encoder-decoder based CNN-GRU algorithm
As mentioned in Section 2, the distribution characteristics of MS events in different stages of rockburst development are very complicated. Therefore, in previous studies, the MS data are first transformed into prediction indexes before inputting the machine learning model. In this paper, the CNN-GRU algorithm outputs the prediction vectors by comprehensively analyzing the original MS data and the prediction indexes, as shown in Figure 4.
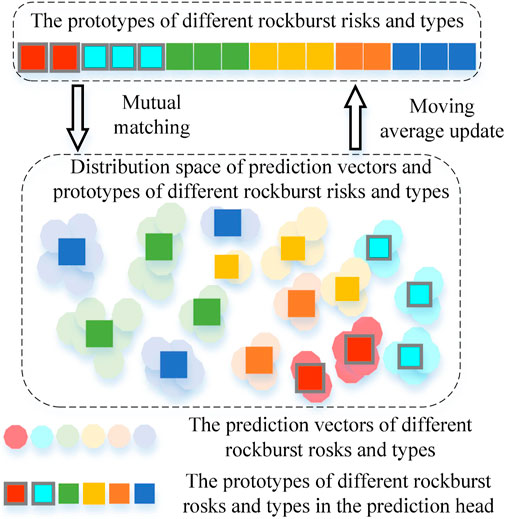
Figure 4. The illustration of prototype updating and matching in the prediction head.
The encoder consists of five one-dimensional (1D) CNN-based layers. Each 1D CNN layer contains a convolution layer, a batch normalization layer, and a rectified linear unit (ReLU) activation function. The number of convolution kernels in each layer is 12, 12, 12, 24, and 24, respectively. The input of the CNN-based encoder is the original MS data with a standardized time interval of two adjacent events, X, Y, and Z coordinates, and energy. If the number of analyzed MS data elements is n and the dimension of the prediction vector is 24, the input and output dimensions of the encoder are [batch size, n, 5] and [1, batch size, 24].
The decoder consists of five GRU-based modules. The hidden layer parameter of the first GRU module is the encoder output. The input of each GRU module is made up of different rockburst prediction indexes. The decoder outputs are the prediction vectors whose dimension is [1, batch size, 24]. In this model, the rockburst prediction index consists of standardized temporal concentration QT, the time information entropy Qt, space concentration QD, spatiotemporal diffusion ds, and energy concentration index QE. The temporal concentration QT can be formalized as
where QT,Var(Tn) and
Therefore, the time information entropy Qt is used to describe the aggregation degree of MS events in the time series, reflecting the disorder or order in the evolution of MS time.
where n is the total number of selected MS events.
The spatial distribution of MS events is important for understanding the stability of the coal rock mass in the mine.
where QD, Var(Rn), and
The spatiotemporal diffusion is summarized to reflect the dispersion degree of MS events in time and space.
where
The energy concentration index is established to reflect the energy change and MS distribution before the rockburst.
where QE, Var(En), and
4.2 The prototype-based rockburst risk and type prediction head
To control the inter-class distance and intra-class variance of the prediction vectors, a novel rockburst risk and type prediction head that can constantly adjust the position of the prototype is proposed, as seen in Figure 4. In the perceptron-based prediction head, the prototype can be regarded as the representative vector in the traditional prediction head.
In this method, the sub-centers of vectors belonging to class C are described by K prototypes, that is,
where the vector-class distance sv,c ∈ [−1, 1] is the distance to the closest prototype of class c. Based on Equation 12, the cross-entropy loss is
As studied in Section 3, the prediction head should push the prediction vector close to a certain prototype (i.e., the center of vectors) of class c and distant from other prototypes belonging to other classes. However, Equation 7 only considers one vector-class distance. Therefore, the updating method and other limiting conditions of the prototype should be studied.
The prototypes are selected and assigned by the online clustering. Prediction vectors within the same class are assigned to the prototypes of that class, and the prototypes are then updated according to the assignments. Formally, given the vectors
The unique assignment constraint
where
where ψ∈RK and ε∈RN are re-normalization vectors, computed by a few steps of the Sinkhorn–Knopp iteration.
The vector-prototype contrastive learning strategy is employed to maximize the prototype assignment posterior probability and the variation of different prototypes. The vector-prototype contrastive loss is
where the temperature τ controls the concentration level of representations. Equation 11 enforces each vector v to be similar with its assigned prototype
Equation 18 and Equation 22 inspire inter-class and inter-cluster discrimination but do not consider reducing the intra-cluster variation, that is, making vectors of the same prototype compact. Thus, a compactness-aware loss is employed for further regularizing representations by directly minimizing the distance between each prediction vector and its assigned prototype:
Note that both v and
where the updated weight μ is 0.999.
This training objective minimizes intra-cluster variations while maintaining separation between features with different prototype assignments. As shown in Figure 5, the total loss for prototype-based prediction head is
where λ1∼λ3 are the weights for the loss function. Their values are 1, 0.5, and 0.1 in the article.

Figure 5. The illustration of different loss functions for the prototype-based prediction head.
As shown in Figure 1, there are two outputs of the prototype-based prediction head, that is, the rockburst types and rockburst risks. There are four classes for the rockburst types, including geological structure, hard rock strata, coal pillars, and mining depth. The class of rockburst risks consists of dangerous and non-dangerous events.
5 Engineering application and experiment implementation details
5.1 Rockburst type and risk prediction data
In the experiments, microseismic data from three different rockburst-prone mines are utilized, with the number of monitoring data elements being 29,156, 48,318, and 32,796, respectively. The geological formations and mining conditions exhibit significant heterogeneity for these three mines. Because these mines are located in different places, the geological and mining conditions vary among these rockburst mines. The MS data information includes time interval, X, Y, and Z coordinates, and energy value, respectively. The types of rockburst events and MS events are determined by the projection results of events in different rockburst controlling factor areas. The rockburst types are geological structure, hard rock strata, coal pillars, and mining depth. The rockburst risk levels are dangerous and non-dangerous. In the original MS data, the proportion of rockburst risk events is very low. Therefore, in the training and testing stages, large energy events, obvious mine earthquakes, and rockbursts are defined as dangerous events, and other MS events are defined as non-dangerous samples. In the presented prototype-based prediction head, the prototype numbers for each rockburst type and risk level are set as 5.
In this paper, the standardized time interval of two adjacent events, the X, Y, and Z coordinates, and the energy are selected as the input features of the encoder. The standardized rockburst prediction indexes are selected as the input feature of the decoder. The target is future MS event types and risk levels. By employing the inputs as features and future MS event types and rockburst risk levels as labels, the samples for rockburst types and levels prediction are constructed. When processing the original MS data to sample features, by setting the fused number of MS events as n = 5, 6, …, 15, thirty datasets for each coal mine are constructed. The partition ratio of training and test samples is 7:3 based on the continuous timeline. Considering the imbalance between different risk level events as well as the number of dangerous and non-dangerous samples, the weighted sampling method is used during training.
5.2 Comparison methods and implementation details
The comparison methods are SVM (Ji et al., 2020), CNN (Zhang et al., 2021), LSTM (Di et al., 2023b), and CNN-GRU with traditional prediction head methods, which are the most popular supervised machine learning methods for rockburst risk and type prediction. The traditional prediction head is a two-layer MLP network.
The training epoch for each method is 200. For the comparison method with the traditional prediction head, the CE loss function is employed to evaluate the difference between the model output and the targets. The input of comparison methods is the combination of sample features. All experiments are implemented on Pytorch 1.10.2 + CUDA 11.3, in FP32 precision by using two RTX A6000 GPUs. A batch size of 512, an Adam optimizer with a momentum of 0.9, a weight decay of 4 × 10⁻⁵, and an initial learning rate of 5 × 10⁻⁴ are employed.
To show the performance of different algorithms, the evaluation metric of different algorithms adopts the prediction accuracy of different rockburst types (Types), non-dangerous samples (Non), and dangerous samples (Dan) on the testing dataset.
5.3 Comparison results of different rockburst types and risk prediction methods
The comparison study results are shown in Figure 6. The presented CNN-GRU model with the prototype-based prediction head shows the best performance. The accuracy of the proposed method on the testing set with different rockburst type samples, only non-dangerous samples, only dangerous events achieves 80.72%, 78.62%, and 82.57% in Mine 1, 78.19%, 89.13%, and 79.72% in Mine 2, and 76.07%, 86.92%, and 78.37% in Mine 3.
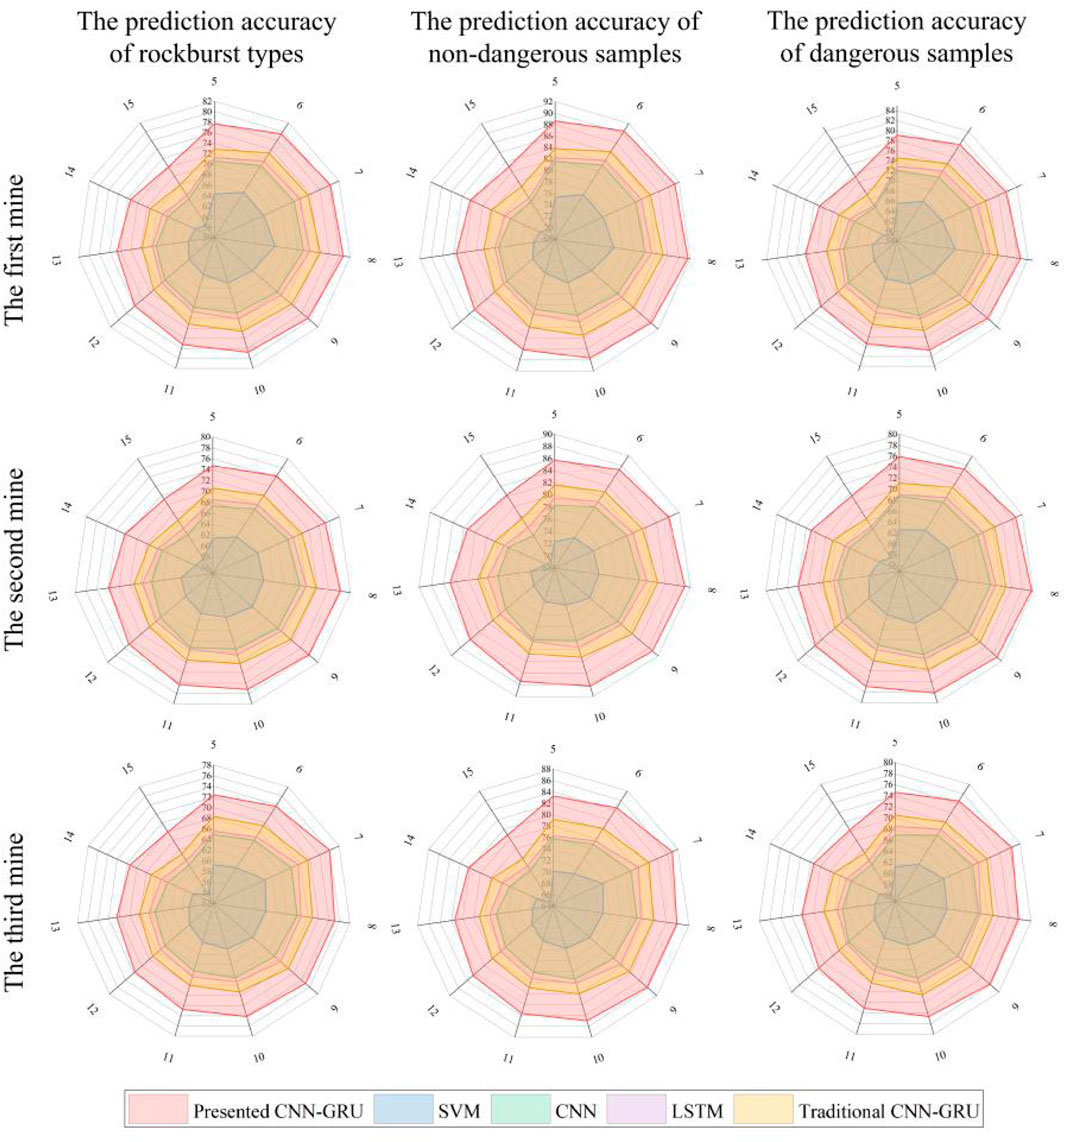
Figure 6. The performance comparison of the presented method and other methods. The presented CNN-GRU method is the presented CNN-GRU model with the prototype-based prediction head. The traditional CNN-GRU method is the CNN-GRU model with a two-layer MLP prediction head.
When different models reach the highest accuracy on different data sets, the corresponding fused MS event number n is similar. For Mine 1 and Mine 2, when the fused MS event number n is 8, almost all methods achieve the best performance. For Mine 3, the best performance of the entire method appears when the fused MS event number n is 7. This may be because the rockburst prediction indexes and MS data are mainly physical quantity indexes, considering the physical logic of coal rock mass failure and mining rate. For the same mine or workface, the physical logic and mining rate are similar.
6 Ablation experiments and discussion
6.1 The number of prototypes
The number of prototypes in the prediction head influences the accurate description of the intra-class variance and inter-class distance of the rockburst prediction vectors. It can also affect the output distribution of the prediction vector through the loss function. The results of setting the fused MS event number n to 8/8/7 for Mine 1, Mine 2, and Mine 3 are shown in Table 1. The optimal number of prototypes per class is five, considering the trade-off between performance and computation cost. When the number of prototypes is too small, it is impossible to describe the variance between vectors in different classes. Too many prototypes can result in overfitting and reduced computational efficiency.
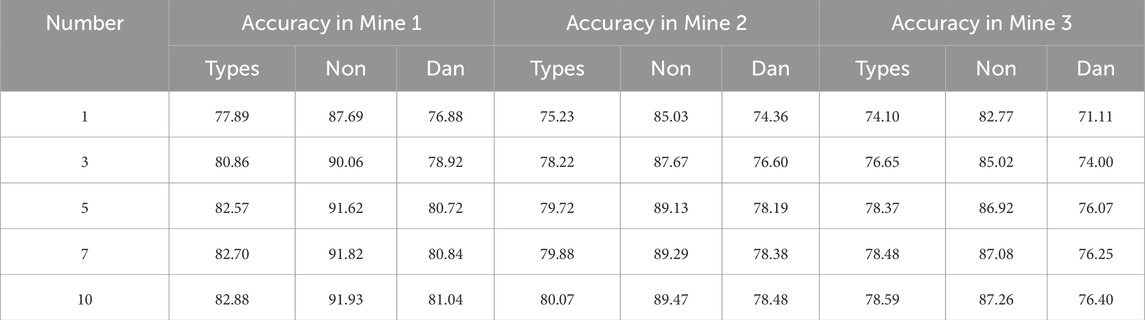
Table 1. The influence of prototype number on the presented CNN-GRU model with a prototype-based prediction head.
6.2 Different deep learning methods with the prototype-based prediction head
The prototype-based rockburst type and risk prediction head showed significant performance gain for the CNN-GRU method, as shown in Figure 6. To demonstrate the universality and superiority of the prototype-based rockburst type and risk prediction head, the prototype-based prediction head is employed with other methods. The fused MS event number n is set as 8/8/7 for Mine 1, Mine 2, and Mine 3. Table 2 reports that the prototype-based prediction head is obviously superior to the traditional prediction head for the employed deep learning methods. This is mainly because the traditional prediction head only uses the cross-entropy loss function to train, which cannot prevent the representative vectors of the same class from becoming similar in the training process. This results in the prediction head being unable to describe the inner-class variance even with a sufficient number of representative vectors. At the same time, it is impossible to control the encoder–decoder to ensure the same kind of output prediction vectors close in the distribution space for the traditional prediction head. These problems are overcome in the prototype-based prediction head.
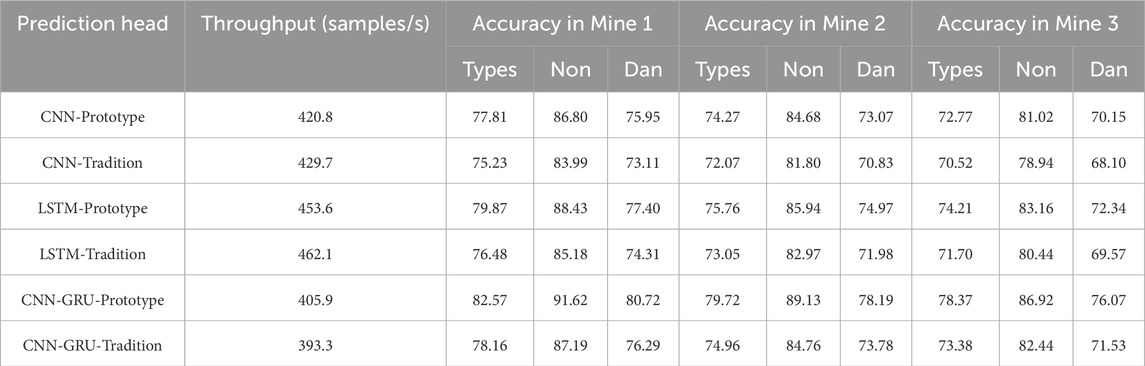
Table 2. The influence of prototype number on the presented CNN-GRU model with the prototype-based prediction head. CNN-GRU-Prototype and CNN-GRU-Tradition are the CNN-GRU model with a prototype-based prediction head and a traditional prediction head, respectively.
6.3 The weight of loss functions
There are three loss functions in Equation 25. Ablation studies conducted to evaluate their individual contributions, as shown in Table 3, demonstrate that all three components enhance model performance, albeit with varying impacts. The cross-entropy loss exhibits the most significant contribution, as it is the primary training objective. Meanwhile, the vector-prototype contrastive loss and the loss compactness-aware loss primarily regulate prototype distribution within the classifier. Notably, the experimental results reveal that maximizing the posterior probability of prototype assignments and enhancing prototype diversity between clusters are more critical than minimizing intra-cluster compactness.
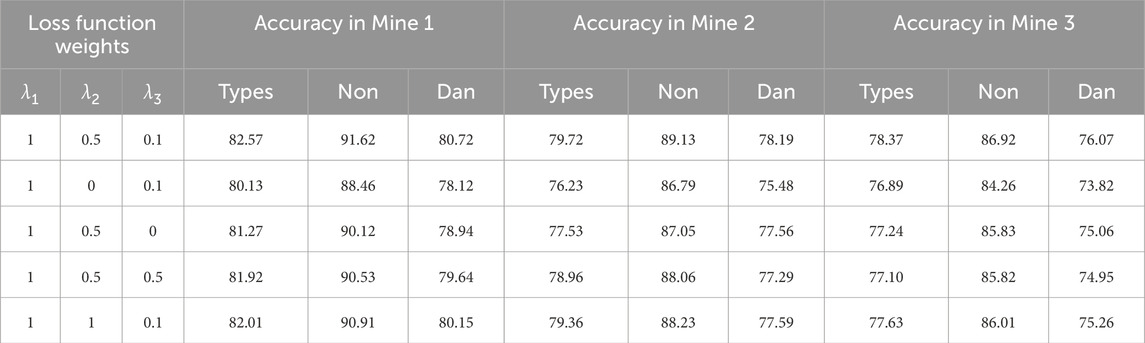
Table 3. The influence of loss function weights on the presented CNN-GRU model. The employed model is CNN-GRU-Prototype. λ1∼λ3 are the loss function weights for cross-entropy loss, vector-prototype contrastive loss, and loss compactness-aware loss in Equation 25.
6.4 The weight of loss functions
To evaluate the influence of input indicators on model performance, we conducted ablation experiments on five indicators input to the GRU model. The results are presented in Table 4. The experiments revealed that the energy concentration index contributed most significantly to model performance, while the time concentration index had the least impact. This phenomenon may be attributed to the fact that the energy concentration index directly reflects the accumulation and release processes of elastic strain energy within the rock mass. When energy becomes highly concentrated in a localized area, it indicates sufficient accumulation of strain energy, which may suddenly release upon reaching critical conditions, potentially triggering a rockburst.
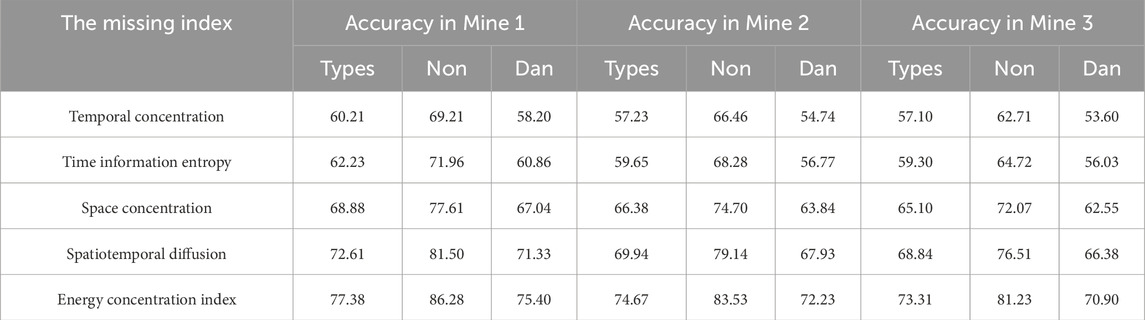
Table 4. The influence of input indexes on the presented CNN-GRU model.
7 Conclusion
To overcome the problems of previous rockburst prediction tasks, this paper constructs quantitative information models of geology and mining based on typical rockburst events. By studying the relationship between the spatial-temporal distribution characteristics of MS data before a rockburst and the main controlling factors of rockbursts, the results show that the distribution features may be different for the same type of MS and rockburst events. Different types of events may show similar distribution features. The quantitative research results on the relationship between the deep learning prediction algorithm performance and prediction vectors show that the rockburst prediction model must accurately distinguish among the various types of rockburst events and also accurately describe the intra-class variance of monitoring data.
Based on the above insights, a novel rockburst risk and type prediction algorithm based on a CNN-GRU model with prototype-based prediction is proposed. The CNN-GRU model consists of an encoder and a decoder, which can produce prediction vectors by fusing implicit and explicit information extracted from the original MS data and prediction indexes. The prototype-based prediction uses cross-entropy loss, vector-prototype contrastive loss, and vector-prototype contrastive loss to automatically control the intra-class variance and inter-class gap of rockburst risk and type prediction vectors. The performance superiority of the proposed algorithm compared with the previous algorithm is verified by the comparison experiment on the data of three mines. The ablation experiment also proves the universality of the proposed prototype-based prediction head in different algorithms for rockburst risk and type prediction.
Data availability statement
The original contributions presented in the study are included in the article/supplementary material, further inquiries can be directed to the corresponding author.
Author contributions
XZ: Writing – original draft, Writing – review and editing. GL: Writing – review and editing, Writing – original draft. YC: Writing – original draft, Writing – review and editing. HW: Writing – review and editing, Writing – original draft. HZ: Writing – original draft, Writing – review and editing. HL: Writing – original draft, Writing – review and editing. WD: Conceptualization, Visualization, Investigation, Software, Validation, Funding acquisition, Formal analysis, Supervision, Writing – review and editing, Resources, Data curation, Methodology, Project administration, Writing – original draft. XL: Writing – original draft, Writing – review and editing. XX: Writing – original draft, Writing – review and editing. YH: Writing – review and editing, Writing – original draft.
Funding
The author(s) declare that financial support was received for the research and/or publication of this article. The authors would like to acknowledge the support of Chinese Institute of Coal Science, Beijing 100013, China; the Shandong Energy Group Co., LTD, Jinan Shandong 250014, China (No. SNKJ2023A17-R01, No. SNKJ2022BJ03-R28); the Taishan Industrial Experts Program (No. tscx202408130); and the Key Science and Technology Project of the Ministry of Emergency Management of the People's Republic of China (2024EMST070702).
Conflict of interest
Authors XZ, GL, YC, and HW were employed by Shandong Energy Group Co., Ltd.
The remaining authors declare that the research was conducted in the absence of any commercial or financial relationships that could be construed as a potential conflict of interest.
The authors declare that this study received funding from Shandong Energy Group. The funder had the following involvement in the study: data collection and analysis, decision to publish, and preparation of the manuscript.
Generative AI statement
The author(s) declare that no Generative AI was used in the creation of this manuscript.
Publisher’s note
All claims expressed in this article are solely those of the authors and do not necessarily represent those of their affiliated organizations, or those of the publisher, the editors and the reviewers. Any product that may be evaluated in this article, or claim that may be made by its manufacturer, is not guaranteed or endorsed by the publisher.
References
Adoko, A., and Zvarivadza, T. (2018). A bayesian approach for predicting rockburst. in ARMA US Rock Mechanics/Geomechanics Symposium. Seattle, Washington ARMA.
Askaripour, M., Saeidi, A., Rouleau, A., and Mercier-Langevin, P. (2022). Rockburst in underground excavations: a review of mechanism, classification, and prediction methods. Undergr. Space 7 (4), 577–607. doi:10.1016/j.undsp.2021.11.008
Aydan, Ö., Geniş, M., Akagi, T., and Kawamoto, T. (2017). Assessment of susceptibility of rock bursting in tunnelling in hard rocks, Modern tunneling science and technology. London: Routledge, 391–396.
Basnet, P. M. S., Mahtab, S., and Jin, A. (2023). A comprehensive review of intelligent machine learning based predicting methods in long-term and short-term rock burst prediction. Tunn. Undergr. Space Technol. 142, 105434. doi:10.1016/j.tust.2023.105434
Chen, F., Liang, Z., and Cao, A. (2023). ConvLSTM for predicting short-term spatiotemporal distribution of seismic risk induced by large-scale coal mining. Nat. Resour. Res. 32 (3), 1459–1479. doi:10.1007/s11053-023-10193-5
Cheng, S., Yin, X., Gao, F., and Pan, Y. (2024). Microseismic data-driven short-term rockburst evaluation in underground engineering with strategic data augmentation and extremely randomized forest. Mathematics 12 (22), 3502. doi:10.3390/math12223502
Cheng, T., He, M., Li, H., Liu, D., Qiao, Y., and Hu, J. (2023). Experimental investigation on the influence of a single structural plane on rockburst. Tunn. Undergr. Space Technol. 132, 104914. doi:10.1016/j.tust.2022.104914
Di, Y., Wang, E., Li, Z., Liu, X., Huang, T., and Yao, J. (2023a). Predicting microseismic, acoustic emission and electromagnetic radiation data using neural networks. J. Rock Mech. Geotechnical Eng. 16, 616–629. doi:10.1016/j.jrmge.2023.05.012
Di, Y., Wang, E., Li, Z., Liu, X., Huang, T., and Yao, J. (2023b). Comprehensive early warning method of microseismic, acoustic emission, and electromagnetic radiation signals of rock burst based on deep learning. Int. J. Rock Mech. Min. Sci. 170, 105519. doi:10.1016/j.ijrmms.2023.105519
Dong, L., Shu, H., Tang, Z., and Yan, X. (2023). Microseismic event waveform classification using CNN-based transfer learning models. Int. J. Min. Sci. Technol. 33, 1203–1216. doi:10.1016/j.ijmst.2023.09.003
He, M., Cheng, T., Qiao, Y., and Li, H. (2023). A review of rockburst: experiments, theories, and simulations. J. Rock Mech. Geotechnical Eng. 15 (5), 1312–1353. doi:10.1016/j.jrmge.2022.07.014
He, M., Ren, F., and Liu, D. (2018). Rockburst mechanism research and its control. Int. J. Min. Sci. Technol. 28 (5), 829–837. doi:10.1016/j.ijmst.2018.09.002
Hu, L., Feng, X.-T., Yao, Z.-B., Zhang, W., Niu, W.-J., Bi, X., et al. (2023). Rockburst time warning method with blasting cycle as the unit based on microseismic information time series: a case study. Bull. Eng. Geol. Environ. 82 (4), 121. doi:10.1007/s10064-023-03141-3
Ji, B., Xie, F., Wang, X., He, S., and Song, D. (2020). Investigate contribution of multi-microseismic data to rockburst risk prediction using support vector machine with genetic algorithm. IEEE Access 8, 58817–58828. doi:10.1109/access.2020.2982366
Jin, A., Basnet, P. M. S., and Mahtab, S. (2022). Microseismicity-based short-term rockburst prediction using non-linear support vector machine. Acta Geophys. 70 (4), 1717–1736. doi:10.1007/s11600-022-00817-4
Jinqiang, W., Basnet, P., and Mahtab, S. (2021). Review of machine learning and deep learning application in mine microseismic event classification. Mining Mineral Deposits 15, 19–26. doi:10.33271/mining15.01.019
Li, N., Huang, B., Zhang, X., Yuyang, T., and Li, B. (2019). Characteristics of microseismic waveforms induced by hydraulic fracturing in coal seam for coal rock dynamic disasters prevention. Saf. Sci. 115, 188–198. doi:10.1016/j.ssci.2019.01.024
Li, N., Zare Naghadehi, M., and Jimenez, R. (2020). Evaluating short-term rock burst damage in underground mines using a systems approach. Int. J. Min. Reclam. Environ. 34 (8), 531–561. doi:10.1080/17480930.2019.1657654
Liang, W., Sari, A., Zhao, G., McKinnon, S. D., and Wu, H. (2020). Short-term rockburst risk prediction using ensemble learning methods. Nat. Hazards 104, 1923–1946. doi:10.1007/s11069-020-04255-7
Liang, W., Sari, Y. A., Zhao, G., McKinnon, S. D., and Wu, H. (2021). Probability estimates of short-term rockburst risk with ensemble classifiers. Rock Mech. Rock Eng. 54, 1799–1814. doi:10.1007/s00603-021-02369-3
Liang, W., and Zhao, G. (2022). A review of long-term and short-term rockburst risk evaluations in deep hard rock. J. Rock Mech. Eng. 41, 19–39. doi:10.13722/j.cnki.jrme.2021.0165
Ma, J., Ma, C., Jun, Z., Li, T., and Wang, X. (2021). Research on prediction of rockburst microseismic parameters based on CNN-LSTM hybrid model. IOP Conf. Ser. Earth Environ. Sci. 861, 052097. doi:10.1088/1755-1315/861/5/052097
Manouchehrian, A., and Cai, M. (2018). Numerical modeling of rockburst near fault zones in deep tunnels. Tunn. Undergr. Space Technol. 80, 164–180. doi:10.1016/j.tust.2018.06.015
Pu, Y., Apel, D. B., Liu, V., and Mitri, H. (2019). Machine learning methods for rockburst prediction-state-of-the-art review. Int. J. Min. Sci. Technol. 29 (4), 565–570. doi:10.1016/j.ijmst.2019.06.009
Wang, J., Apel, D. B., Pu, Y., Hall, R., Wei, C., and Sepehri, M. (2021). Numerical modeling for rockbursts: a state-of-the-art review. J. Rock Mech. Geotechnical Eng. 13 (2), 457–478. doi:10.1016/j.jrmge.2020.09.011
Xue, Y., Li, Z., Song, D., He, X., Wang, H., Zhou, C., et al. (2023). A method to predict rockburst using temporal trend test and its application. J. Rock Mech. Geotechnical Eng. 16, 909–923. doi:10.1016/j.jrmge.2023.07.017
Yang, J., Chen, W., Tan, X., and Yang, D. (2018). Analytical estimation of stress distribution in interbedded layers and its implication to rockburst in strong layer. Tunn. Undergr. Space Technol. 81, 289–295. doi:10.1016/j.tust.2018.07.007
Yin, X., Cheng, S., Yu, H., Pan, Y., Liu, Q., Huang, X., et al. (2024b). Probabilistic assessment of rockburst risk in TBM-excavated tunnels with multi-source data fusion. Tunn. Undergr. Space Technol. 152, 105915. doi:10.1016/j.tust.2024.105915
Yin, X., Liu, Q., Huang, X., and Pan, Y. (2021a). Real-time prediction of rockburst intensity using an integrated CNN-Adam-BO algorithm based on microseismic data and its engineering application. Tunn. Undergr. Space Technol. 117, 104133. doi:10.1016/j.tust.2021.104133
Yin, X., Liu, Q., Lei, J., Pan, Y., Huang, X., and Lei, Y. (2024a). Hybrid deep learning-based identification of microseismic events in TBM tunnelling. Measurement 238, 115381. doi:10.1016/j.measurement.2024.115381
Yin, X., Liu, Q., Pan, Y., and Huang, X. (2021b). A novel tree-based algorithm for real-time prediction of rockburst risk using field microseismic monitoring. Environ. Earth Sci. 80, 504–519. doi:10.1007/s12665-021-09802-4
Yin, X., Liu, Q., Pan, Y., Huang, X., Wu, J., and Wang, X. (2021c). Strength of stacking technique of ensemble learning in rockburst prediction with imbalanced data: comparison of eight single and ensemble models. Nat. Resour. Res. 30, 1795–1815. doi:10.1007/s11053-020-09787-0
Keywords: rockburst prediction, rockburst types, deep learning, microseismic data, prototype learning
Citation: Zhang X, Li G, Chen Y, Wang H, Zhang H, Li H, Du W, Li X, Xu X and He Y (2025) A prototype-based rockburst types and risk prediction algorithm considering intra-class variance and inter-class distance of microseismic data. Front. Earth Sci. 13:1601090. doi: 10.3389/feart.2025.1601090
Received: 27 March 2025; Accepted: 28 April 2025;
Published: 29 May 2025.
Edited by:
Xin Yin, City University of Hong Kong, Hong Kong SAR, ChinaReviewed by:
Huan Sun, Hainan University, ChinaYunpeng Zhang, China University of Geosciences Wuhan, China
Copyright © 2025 Zhang, Li, Chen, Wang, Zhang, Li, Du, Li, Xu and He. This is an open-access article distributed under the terms of the Creative Commons Attribution License (CC BY). The use, distribution or reproduction in other forums is permitted, provided the original author(s) and the copyright owner(s) are credited and that the original publication in this journal is cited, in accordance with accepted academic practice. No use, distribution or reproduction is permitted which does not comply with these terms.
*Correspondence: Haikuan Zhang, ODIwODE4NDE0QHFxLmNvbQ==