 Qian Li
 Yiyong Sui1*
- 1School of Petroleum Engineering, China University of Petroleum (East China), Qingdao, China
- 2Petroleum Development Center of ShengLi Oilfield, Dongying, China
- 3Engineering Technology Department of Daqing Oilfield Limited Company, Daqing, China
- 4Exploration and Development Research Institute of Dagang Oilfield Company, Tianjin, China
- 5Tianjin Branch of CNPC Logging, Tianjin, China
Traditional methods for predicting post-fracturing productivity in horizontal fractures primarily use fracture and formation parameters for calculations. Complex fracture data are difficult to obtain, and these methods do not consider the effects of displacement mechanisms, fracturing techniques, or time factors on post-fracturing productivity. To address the limitations and shortcomings of existing post-fracturing performance prediction methods for horizontal fractures, a horizontal fracture well productivity prediction model was established by combining physical mechanisms with data-driven approaches. First, based on physical mechanisms, factors influencing well productivity were selected from reservoir properties and fracturing operations. Second, relevant characteristic parameters were chosen from geological conditions, production characteristics, and fracturing techniques to perform clustering analysis on fracturing intervals in the data sample. Intervals with similar multidimensional physical features were grouped into the same category. Under the assumption of similar characteristics and mechanisms, correlation analysis was conducted for each fracturing interval category to identify the dominant controlling factors affecting post-fracturing productivity in each reservoir type. Machine learning algorithms were used to establish intelligent models describing the relationships between post-fracturing production enhancement effects, dominant factors, and production time for each reservoir category. Finally, during fracturing design, the optimal productivity prediction model was matched to each interval based on its characteristics to predict post-fracturing productivity. Additionally, the influence patterns of proppant volume on well productivity were comprehensively analyzed to optimize reasonable proppant volumes for different wells and intervals. Field validation showed that the productivity prediction model achieved an average error of 7.06%, providing a basis for horizontal fracture engineering design and achieving cost reduction and efficiency improvement in oilfield development.
1 Introduction
Fracturing of Vertical wells in shallow oil reservoirs has the characteristics of small scale, low cost, and good effectiveness, is one of the most commonly used methods to increase production. In shallow oil reservoirs, the relatively low vertical stress coupled with a high horizontal in-situ stress dominance results in a propensity for hydraulic fractures to propagate horizontally. As the cornerstone of fracturing design optimization, productivity forecasting for hydraulically fractured wells encompasses dual methodologies: stimulation ratio quantification and production profile prediction. Conventional evaluation of horizontal fracture efficacy predominantly relies on analytical solutions for stimulation ratio (SR) computation. Since McGuire and Sikora (1960) pioneered the methodology for predicting productivity of vertically fractured wells via stimulation ratio in 1960, numerous scholars worldwide have conducted extensive studies under diverse conditions to investigate the relationships between stimulation ratios and fracture geometry dimensions coupled with conductivity. Prats (1961) proposed a methodology for calculating the SR under steady-state flow conditions in 1961. Cui Disheng (Choi, 1986) developed a comprehensive SR calculation framework incorporating multiple contributing factors: fracture stimulation effects, formation damage mitigation, drainage area configuration, and well placement optimization, thereby advancing a more holistic predictive model for post-fracturing productivity enhancement. Liang and Zhao (2019) established a correlation between Estimated Ultimate Recovery (EUR) and 10 key production-influencing factors for fractured horizontal wells using Random Forest algorithms. Raymond and Binder (1967) analytically derived stimulation ratios for a centrally located fractured well within a circular drainage area under pseudo-steady state flow conditions. Zhang (2020) developed a COMSOL-based predictive model quantifying stimulation ratios and liquid production rates through systematic analysis of reservoir properties (permeability, porosity), fracture parameters (length, conductivity), and operational variables (flow rate, bottom hole pressure), explicitly accounting for parameter sensitivity and cross-correlation effects. Ma (2022) formulated a semi-analytical single-well model for fractured horizontal wells in heterogeneous tight oil reservoirs, leveraging Laplace-space Green’s functions for rectangular domains. This model specifically evaluates fracture penetration ratio and permeability contrast impacts on post-fracturing productivity. Mohaghegh et al. (2017) implemented a neuro-fuzzy framework combining fuzzy clustering for well typology classification, Key Performance Indicator analysis for dominant factor identification, and Artificial Neural Networks integrating geological (TOC, brittleness index), completion (stage spacing), and stimulation (proppant intensity) parameters to predict early-phase production. Pan et al. (2018) applied grey correlation analysis to identify critical productivity drivers—proppant volume, net pay thickness, total injected fluid volume, and stimulation stages—subsequently constructing a multiple linear regression model for initial production forecasting in tight oil horizontal wells. Wang and Chen (2019) proposed machine learning-driven productivity prediction models for hydraulically fractured horizontal wells by integrating Artificial Neural Networks and Support Vector Machines (SVM). Yan et al. (2021) developed predictive frameworks for post-fracturing production in tight sandstone reservoirs under limited historical datasets, employing an ensemble of Elastic Net regression, Decision Trees, and SVM to identify salient parameters from multi-domain fracture-influencing factors. Tang and Wang (2023) constructed an XGBoost-based productivity forecasting model for 267 horizontal wells in the Sulige Gas Field, leveraging petrophysical features (gas saturation, porosity) and engineering variables (total proppant volume, cluster spacing) as model inputs to quantify fracture-reservoir interactions.
In summary, analytical formulas for post-fracturing performance prediction inherently require fracture parameters as inputs. However, shallow reservoir fracturing operations are typically low-cost and small-scale, making fracture parameter acquisition challenging. Furthermore, with advancements in multi-fracture stimulation technologies, critical variables such as fracture count are absent in conventional analytical models. These formulas yield static productivity estimates, whereas actual post-fracturing production exhibits dynamic temporal decline behavior. Consequently, analytical approaches demonstrate limited applicability in modern fracturing evaluation. Existing data-driven methodologies predominantly adopt well-centric modeling frameworks while neglecting the impacts of diverse displacement mechanisms (e.g., water flooding, polymer flooding, ASP flooding) on stimulated productivity. In shallow reservoirs undergoing various enhanced oil recovery processes, distinct displacement physics–including viscosity modification (polymer), interfacial tension reduction (surfactant), and mobility control (ASP) – differentially influence fracture-reservoir interactions. Therefore, developing displacement mechanism-specific data-driven productivity prediction models for targeted fracturing intervals shows significant potential to enhance fracturing design accuracy and optimize cost-benefit ratios.
2 Methodology
2.1 Main technical principles
Post-fracturing performance varies significantly across different fracturing intervals, stimulation techniques, and displacement mechanisms due to distinct underlying physical mechanisms. The workflow involves three key steps: (as shown in Figure 1):
1. Data Collection and preprocessing: Sample data from wells and target fracturing intervals are collected and preprocessed.
2. Fracturing layer clustering: fracturing intervals are grouped into clusters based on multidimensional features, including geological conditions production characteristics, and stimulation parameters Clusters are formed under the assumption that intervals within the same group share identical attributes, mechanisms, and post-fracturing productivity enhancement patterns.
3. Model Development: For each cluster, dominant factors governing horizontal fracture performance are analyzed. Tailored productivity prediction models are then established for horizontal fracture-dominated intervals, achieving higher accuracy and efficiency for specific geological and operational categories.
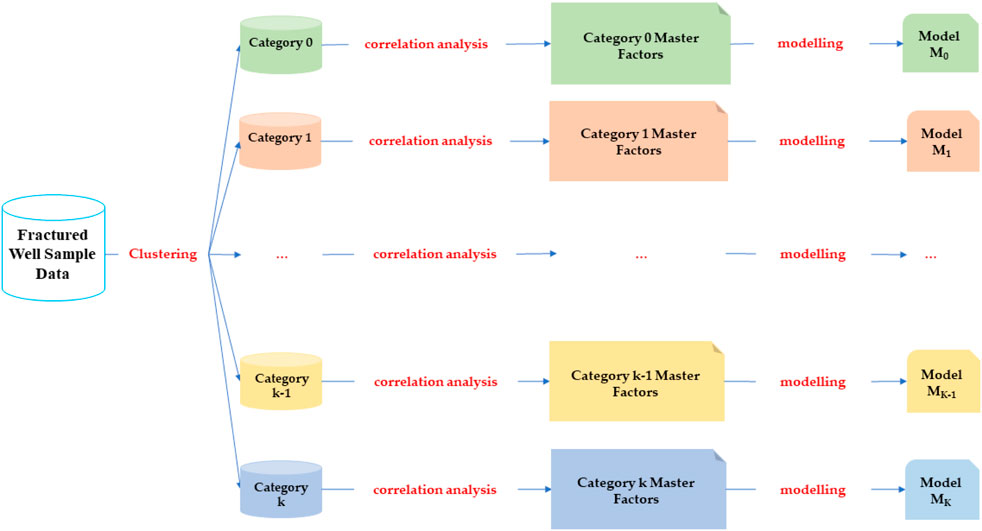
Figure 1. Modeling schematic of the fractured well capacity prediction model.
During fracturing design, the target interval is classified using a clustering model based on its characteristic features. The classified interval category is then matched with the optimal productivity prediction model tailored for that specific interval type. By activating the selected model and inputting relevant interval data and stimulation parameters, the post-fracturing production behavior—including production trends and decline patterns—can be predicted for the target interval. As shown in Figure 2.
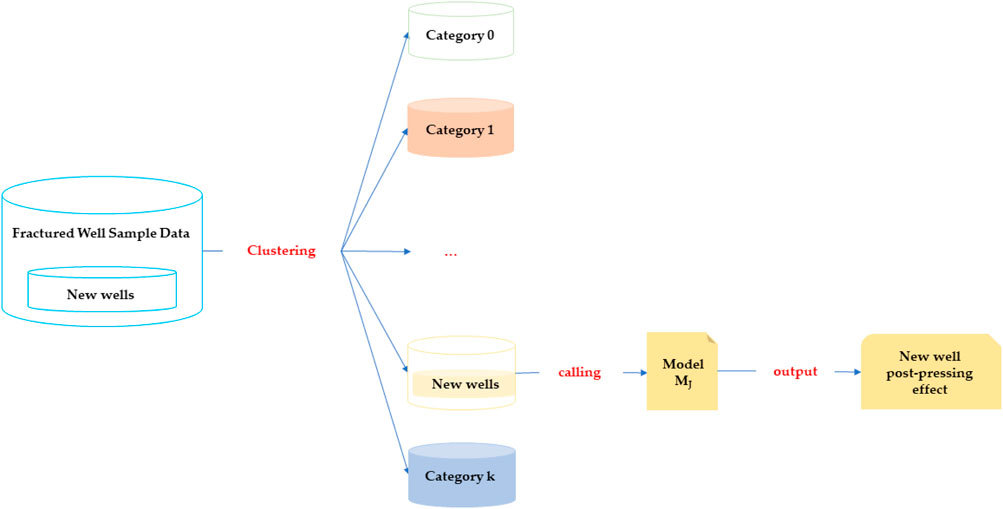
Figure 2. Schematic diagram of post-fracturing capacity intelligence model application.
2.2 Data collection and preprocessing
Based on the physical mechanisms of fracturing-induced productivity enhancement, 12 characteristic parameters were selected, encompassing pre-fracturing geological parameters, production parameters, and fracturing operational parameters, along with two additional features: displacement mechanism and fracturing technique type. The displacement mechanisms primarily include water flooding, polymer flooding, and ASP flooding, while fracturing techniques are categorized into conventional fracturing, multi-fracture stimulation, and selective zonal fracturing. A dataset comprising 5,268 fractured well samples was established, as detailed in Table 1. The distribution of sample data across these categories is presented in Table 2. The dataset structured enables physics-informed machine learning while maintaining operational reality constraints.

Table 1. Data composition of the data sample set.
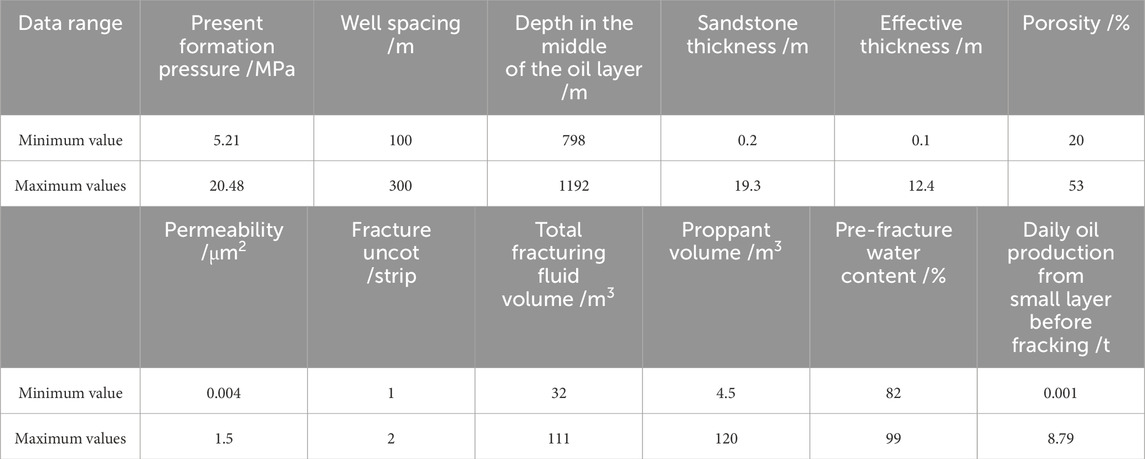
Table 2. Data range of dataset.
For clustering analysis of fracturing intervals, numerical data are required. In addition to standard preprocessing steps such as normalization, the original dataset contains two categorical/textual variables—displacement mechanisms and fracturing techniques—which were converted into numerical representations using dummy variable encoding (Jin et al., 2023). For displacement mechanisms, ASP flooding was selected as the reference category, with water flooding and polymer flooding encoded as “01” and “10,” respectively. For fracturing techniques, selective zonal fracturing served as the reference category, while conventional fracturing and multi-fracture stimulation were encoded as “01” and “10.” The dataset before and after transformation is presented in Table 3.
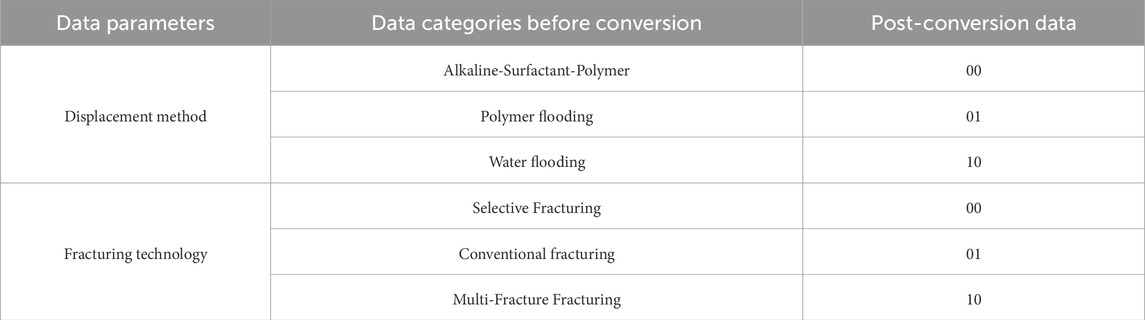
Table 3. Dummy variable coded transformational relationships between the replacement method and the fracturing process.
2.3 Cluster analysis of fractured intervals
The dataset is partitioned into subsets of similar characteristics based on the similarity between different intervals. Each subset contains samples with closely aligned properties, while maintaining distinct differences between subsets. This approach facilitates a comprehensive understanding of key information patterns within the fracturing well data. The K-means clustering algorithm (Wang, 2018; Chen and Xiao, 2004) — an iterative analytical method—provides interpretable results where cluster centroids represent the characteristic attributes of each group. As clustering outcomes critically depend on the selection of cluster numbers (k), determining the optimal k-value is pivotal, particularly when fracturing interval categories lack predefined definitions.
For this analysis, k-values ranging from 2 to 13 were systematically tested on the fracturing well dataset. Clustering performance was evaluated using the silhouette coefficient metric, which quantifies both intra-cluster cohesion (a(i)) and inter-cluster separation (b(i)) for each k-value. The silhouette score s(i) — calculated as:
Serves as a composite evaluation criterion. Higher s(i) values indicate superior clustering configurations, with the k-value yielding the maximum s(i) identified as the optimal classification scheme for multidimensional fracturing interval features.
As shown in Figure 3, the silhouette coefficient initially increases with the number of clusters (k) and gradually plateaus. The maximum silhouette coefficient is achieved at k = 9, indicating optimal clustering results. Therefore, the fracturing intervals in the dataset exhibit the best clustering performance when classified into 9 categories.
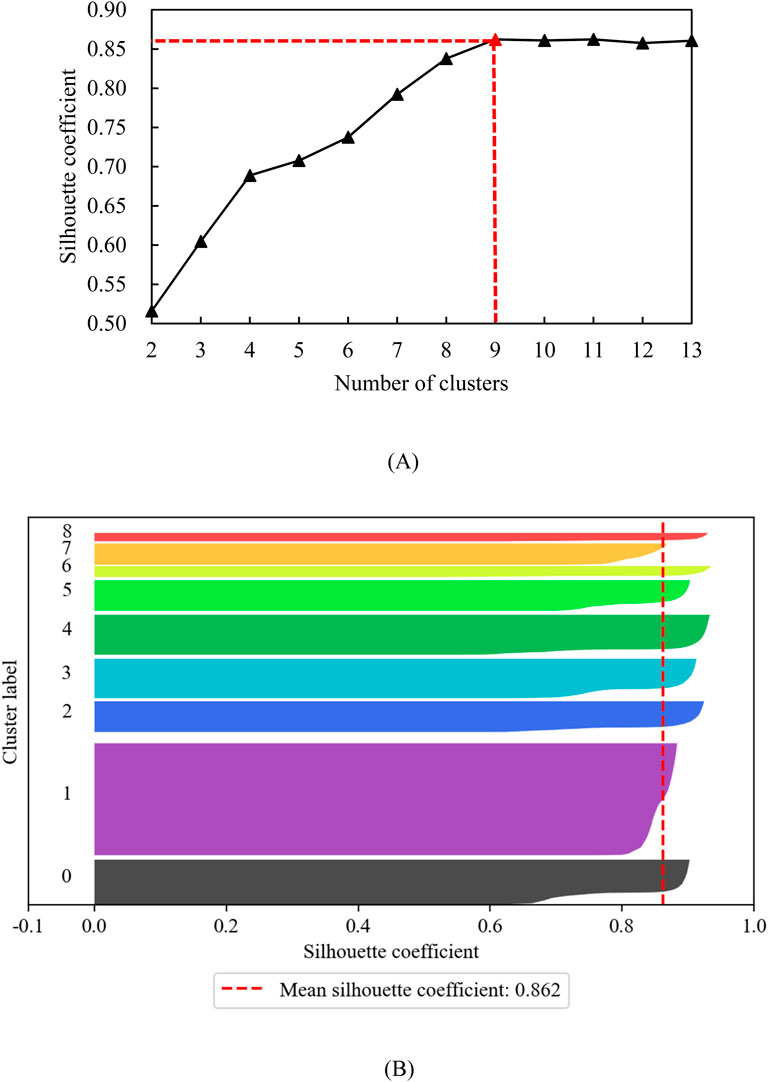
Figure 3. Evaluation of Clustering Results. (A) The silhouette coefficient score situation for each cluster (B) Silhouette coefficient at k = 9.
2.4 Principal controlling factor analysis
The Maximal Information Coefficient (MIC) is a nonparametric statistical method rooted in mutual information theory, designed to quantify association strength between variables, particularly adept at capturing complex linear and nonlinear relationships in high-dimensional data. Its core principle involves dynamically partitioning data grids to compute the maximum mutual information across varying resolutions. Compared to Pearson’s correlation coefficient, which only identifies linear associations, MIC demonstrates significantly enhanced sensitivity to nonlinear patterns such as exponential, periodic, and piecewise relationships, while maintaining robustness against noise and outliers.
In hydraulic fracturing engineering, nonlinear characteristics frequently govern interactions between reservoir parameters (porosity ϕ, permeability k), operational parameters (proppant volume m, fracture count N), and productivity. Certain parameters exhibit threshold effects on productivity enhancement—where exceeding critical values leads to stabilized stimulation effects—while others follow power-law relationships with production outcomes. Traditional regression models struggle to characterize such complexities, whereas MIC enables precise identification of dominant factors through global optimization of variable association patterns.
Based on geomechanical and flow theory, the following multidimensional parameters were analyzed:
Geological Parameters:
Porosity (ϕ)
Permeability (k)
Sandstone thickness (h)
Reservoir mid-depth (D)
Operational Parameters:
Proppant volume (m)
Fracture count (N)
Dynamic Parameters:
Current reservoir pressure (P)
Well spacing (L)
Pre-fracturing water cut (f)
Target Variable:
Post-fracturing productivity (Q)
Z-score standardization applied to eliminate dimensional heterogeneity. For each variable pair (Xi, Q), dynamic grid partitioning was performed in 2D space. Mutual information maxima were computed across grid resolutions. Normalized MIC values (0 ≤ MIC ≤1) were derived, characteristics with a MIC value greater than 0.4 can be considered as primary control factors, with results visualized in Figure 4.
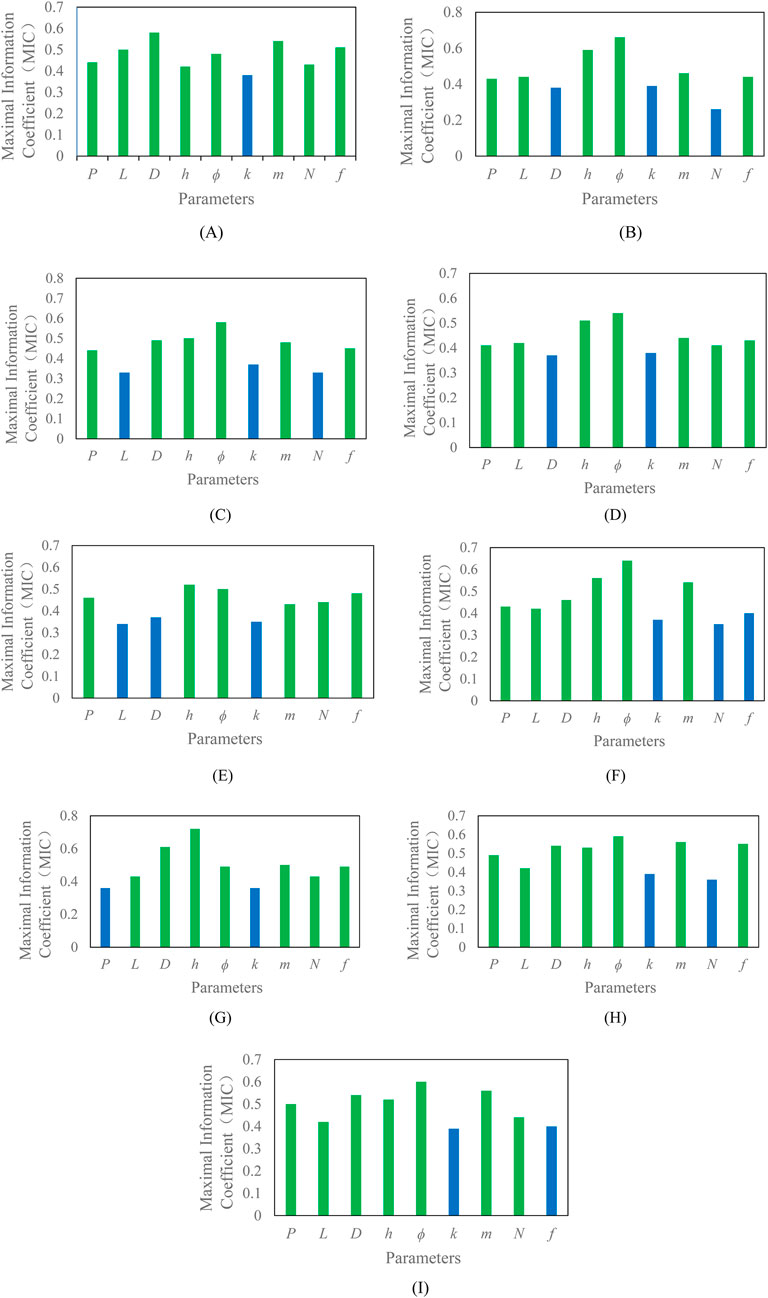
Figure 4. Correlation between main control factors and production capacity in different intervals. (A) Model 0 (B) Model 1 (C) Model 2 (D) Model 3 (E) Model 4 (F) Model 5 (G) Model 6 (H) Model 7 (I) Model 8.
The results demonstrate that distinct geological characteristics and microscale mechanistic variations across reservoir categories lead to divergent macro-scale dominant factors governing post-fracturing productivity within each fracturing interval type.
2.5 Intelligent prediction modeling development
The training dataset for each category of fractured well productivity is denoted as D = {(Xi, Qi)} (i = 1,2,3, … ,n), where Xi∈Rp represents the multidimensional feature vector determined by dominant governing factors, and Qi∈R corresponds to the post-fracturing productivity. The dataset D was split into training and testing sets in an 8:2 ratio. Machine learning was performed on the training set to develop post-fracturing productivity prediction models for each fracturing interval category using Gradient Boosted Regression Trees (GBRT), Random Forests (RF), and Bagging. The post-fracturing productivity prediction models were optimized after comparing and analyzing the evaluation metrics.
2.5.1 Random forest models for post-fracturing capacity prediction
The Random forest algorithm is used to establish a post-fracturing capacity prediction model, and the schematic diagram of the Random forest regression algorithm is shown in Figure 5. The maximum values of model tree depth, number of trees and corresponding R2 coefficients of determination for the random forest model for capacity prediction are detailed in Table 4. The average value of the R2 coefficient of determination of the nine types of fracturing well production capacity prediction models established by the random forest regression algorithm is 0.85 for the test set and 0.97 for the training set, which is a difference of 0.12.
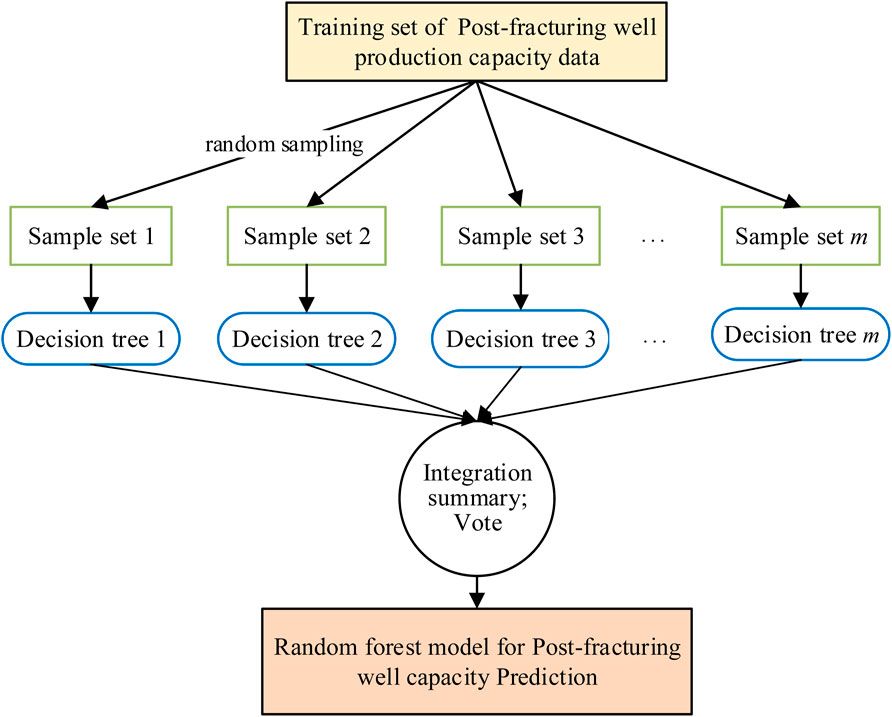
Figure 5. Process of random forest training.

Table 4. Tree depth, tree number and maximum R2 determination coefficient of 9 types of fracturing well productivity prediction models (Random Forest).
2.5.2 Bagging models for post-fracturing capacity prediction
The Bagging algorithm is used to establish a post-fracturing capacity prediction model, and the schematic diagram of the Bagging regression algorithm is shown in Figure 6.
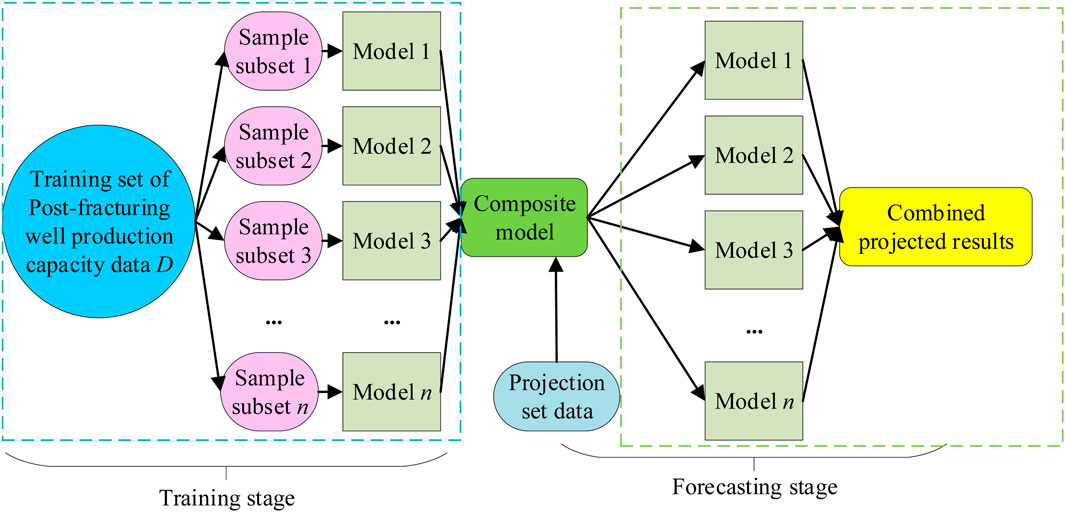
Figure 6. Principle diagram of Bagging regression algorithm.
The maximum values of model tree depth, number of trees and corresponding R2 coefficients of determination for the Bagging model for capacity prediction are detailed in Table 5. As shown in Table 5, the R2 coefficient of determination of the nine types of fracturing well production capacity prediction models established by Bagging regression algorithm is 0.87 on average for the test set and 0.95 on average for the training set, with an average difference of 0.09 between the two.

Table 5. Tree depth, tree number and maximum R2 determination coefficient of 9 types of fracturing well productivity prediction models (Bagging).
2.5.3 GBRT models for post-fracturing capacity prediction
The GBRT algorithm is used to establish a post-fracturing capacity prediction model, and the schematic diagram of the GBRT regression algorithm is shown in Figure 7. During the construction of the productivity prediction models, key parameters considered included tree depth and number of trees. A Bayesian optimization approach was employed to determine the hyperparameters of the nine GBRT models for different fracturing interval categories, as detailed in Table 6.
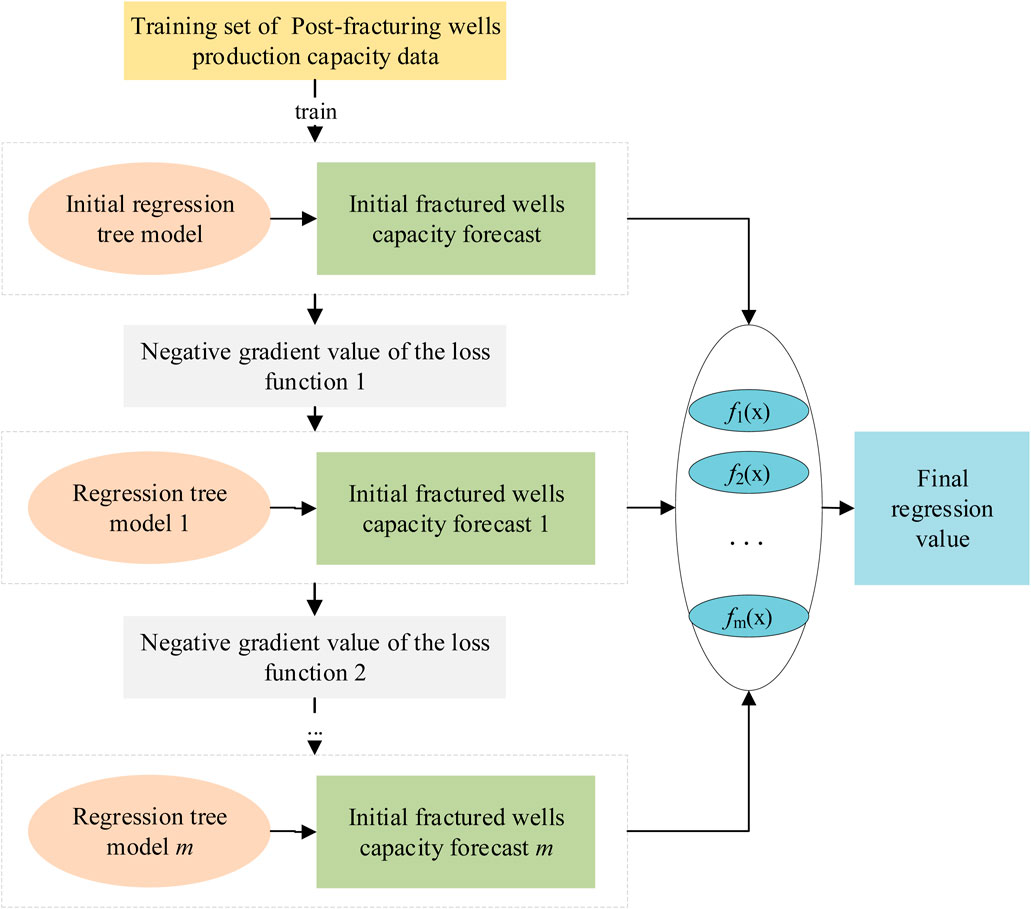
Figure 7. Establishment process of post fracturing production capacity prediction model.

Table 6. Maximum values of model tree depth, number of trees, and corresponding R2 coefficients of determination for 9 types of fractured well production capacity prediction models (GBRT).
Comparative analysis of the prediction effect of three 9-class small-layer fracturing well capacity prediction regression models. It can be seen that the Random Forest regression algorithm established by the nine categories of fracturing well capacity prediction model has the smallest R2 coefficient of determination, and the fracturing well capacity prediction GBRT regression model is better than the Bagging model as a whole.
3 Case study
3.1 Proppant volume optimization on the fracturing production rate
The proppant volume is one of the critical parameters influencing fractured well productivity. Designing an appropriate proppant volume prior to fracturing operations not only maximizes the oil-enhancement effects of stimulation but also effectively controls single-well operational costs and improves the cost-benefit ratio (Guo et al., 2024). Insufficient proppant volume leads to inadequate fracture width and uneven proppant distribution, reducing the effective stimulated reservoir volume and reservoir permeability. Conversely, excessive proppant volume may cause proppant flowback or poor packing, hindering the formation of high-conductivity fractures and even resulting in fracturing failure. Therefore, optimizing proppant volume is essential for ensuring fracturing efficacy and enhancing hydrocarbon productivity.
The impact of proppant volume on post-fracturing productivity can be analyzed using predictive models. Sensitivity analysis was conducted on proppant volume for three fracturing intervals from three wells using the productivity prediction model, as shown in Figure 8. Key findings include that proppant volume exhibits distinct impact patterns on productivity across different intervals, yet each interval possesses an optimal proppant volume range. Within this range, fracturing achieves peak production enhancement for the specific interval.
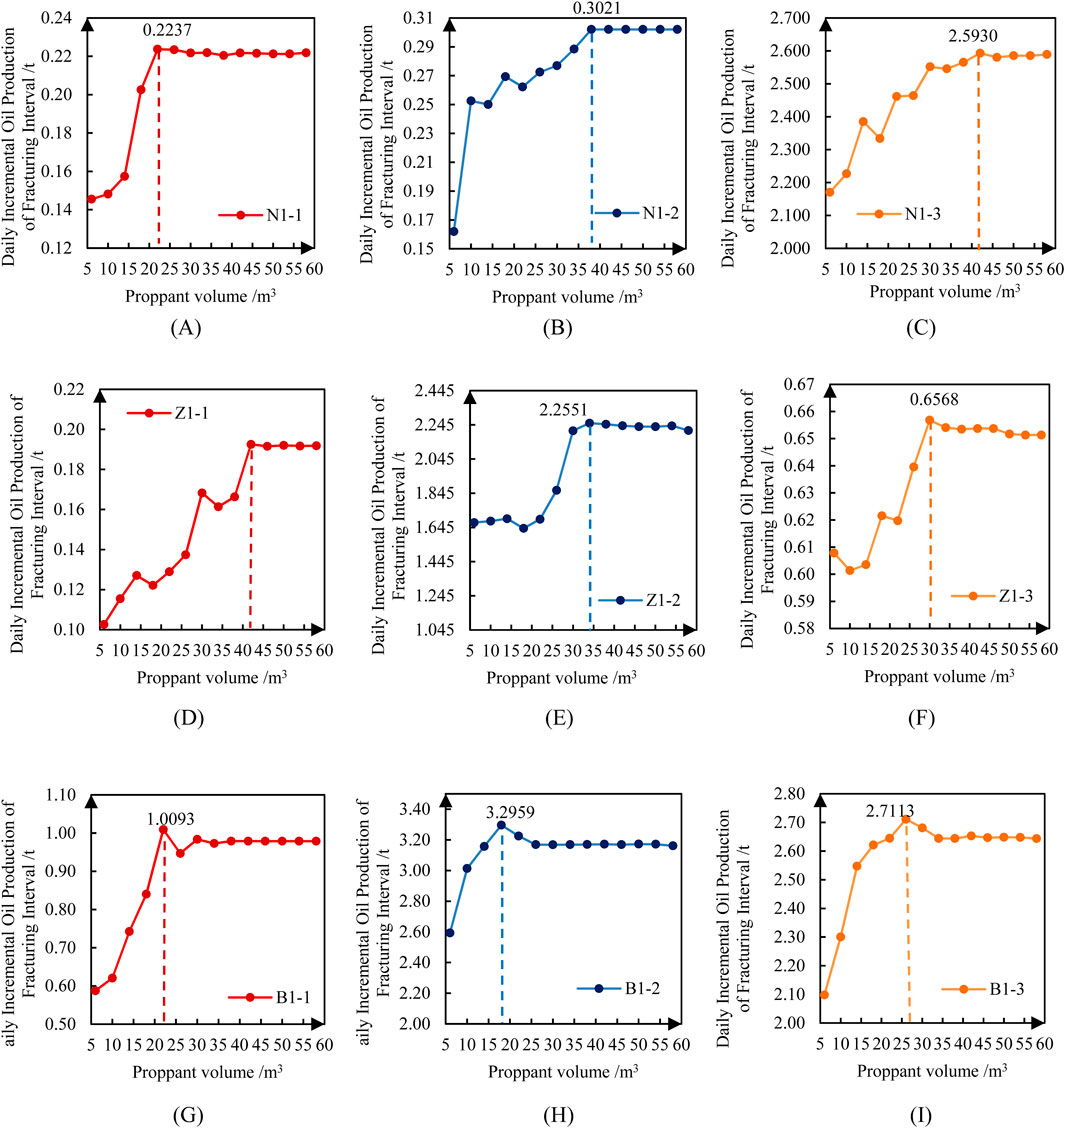
Figure 8. Proppant volume optimization based on maximum production. (A) N1-1 (B) N1-2 (C) N1-3 (D) Z1-1 (E) Z1-2 (F) Z1-3 (G) B1-1 (H) B1-2 (I) B1-3.
3.2 Capacity prediction after hydraulic fracturing
A total of 72 oil wells were randomly selected from out-of-sample datasets to validate the post-fracturing productivity GBRT model. The model predicted production rates for the first month after stimulation, which were then compared with actual field data. As illustrated in Figure 9, the dashed lines represent actual daily incremental oil production, while the solid lines denote predicted values.
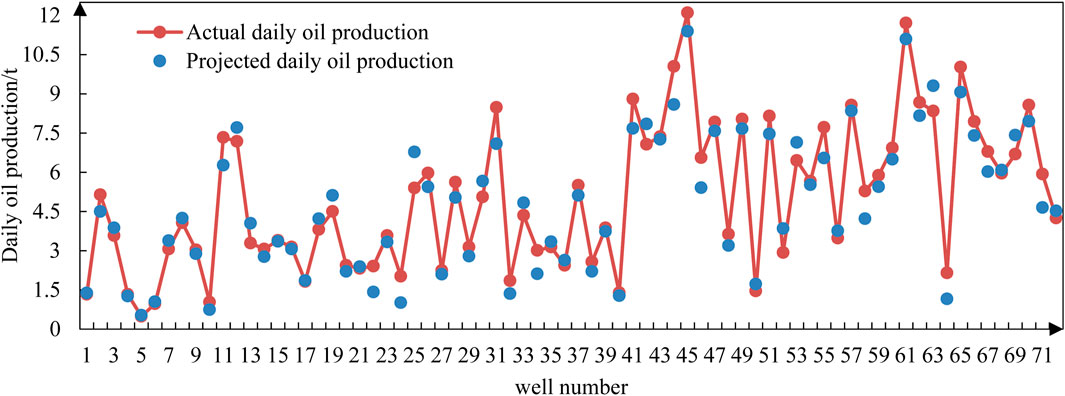
Figure 9. Predicted daily oil production vs. actual daily oil production.
The performance metrics across the nine model categories in Table 7.
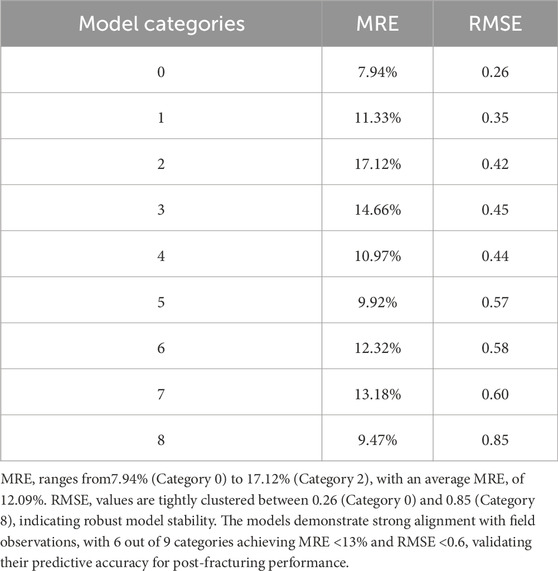
Table 7. Accuracy of prediction models in practical applications.
4 Conclusion
(1) Based on the physical mechanisms of horizontal fracture fracturing, relevant characteristic parameters were selected from geological conditions, production characteristics, and fracturing techniques to perform clustering analysis on fracturing intervals in the data sample. Similar intervals were categorized, and categorical modeling studies were conducted. This approach allows for matching the best model to different fracturing intervals according to their corresponding categories, thereby improving model applicability.
(2) For each category of fracturing intervals, correlation analysis was performed to identify the dominant controlling factors influencing post-fracturing productivity in each reservoir type. The dominant factors affecting post-fracturing performance differ slightly across interval categories. Machine learning algorithms such as Random forest, Bagging and GBRT were used to establish models describing the relationships between post-fracturing production enhancement effects, dominant factors, and production time for each reservoir category. The fracturing well capacity GBRT prediction model can predict productivity after fracturing in different intervals.
(3) In the era of smart oilfields, data-driven models hold broad application prospects for horizontal fracture fracturing productivity prediction. They can fully utilize data assets, uncover production patterns, compensate for the limitations of physical models, and improve the accuracy and reliability of post-fracturing productivity predictions.
Data availability statement
The raw data supporting the conclusions of this article will be made available by the authors, without undue reservation.
Author contributions
QL: Methodology, Writing – original draft. YS: Methodology, Writing – review and editing, Formal Analysis. ML: Writing – original draft, Data curation, Software. BG: Methodology, Writing – review and editing. LL: Investigation, Conceptualization, Writing – review and editing. YZ: Conceptualization, Writing – review and editing.
Funding
The author(s) declare that no financial support was received for the research and/or publication of this article.
Conflict of interest
Author BG was employed by Engineering Technology Department of Daqing Oilfield Limited Company. Author LL was employed by Exploration and Development Research Institute of Dagang Oilfield Company. Author YZ was employed by Tianjin Branch of CNPC Logging.
The remaining authors declare that the research was conducted in the absence of any commercial or financial relationships that could be construed as a potential conflict of interest.
The reviewer FZ declared a shared affiliation with the authors QL and YYS to the handling editor at the time of review.
Generative AI statement
The author(s) declare that no Generative AI was used in the creation of this manuscript.
Publisher’s note
All claims expressed in this article are solely those of the authors and do not necessarily represent those of their affiliated organizations, or those of the publisher, the editors and the reviewers. Any product that may be evaluated in this article, or claim that may be made by its manufacturer, is not guaranteed or endorsed by the publisher.
Supplementary material
The Supplementary Material for this article can be found online at: https://www.frontiersin.org/articles/10.3389/feart.2025.1601363/full#supplementary-material
References
Chen, J., and Xiao, S. (2004). A systematic cluster analysis method for evaluating the effect of oil and gas wells after fracturing. Nat. Gas. Ind. (10), 56–58. doi:10.3321/j.issn:1000-0976.2004.10.018
Choi, D. (1986). Calculation of production increase multipliers for fractured wells. Oil Drill. Prod. Technol. 10 (1), 67–71. doi:10.13639/j.odpt.1986.01.014
Guo, B., Qu, X., Xu, Y., Cao, J., and Meng, L. (2024). Correlation analysis of construction yield of low-permeability fracturing with geological parameters and construction parameters in Sha II section of Bohai Sea region. China Petroleum Chem. Stand. Qual. 44 (14), 154–155+158. doi:10.3969/j.issn.1673-4076.2024.14.051
Jin, T., Xia, Y., and Jiang, H. (2023). A physics-informed neural network approach for surrogating a numerical simulation of fractured horizontal well production prediction. Energies 16 (24), 7948. doi:10.3390/en16247948
Liang, Y., and Zhao, P. (2019). A machine learning analysis based on big data for eagle ford shale formation. Calgary, AB, Canada: Society of Petroleum Engineers, 1–21. doi:10.2118/196158-MS
Ma, L. (2022). Horizontal well capacity prediction model for fractured horizontal wells in non-homogeneous tight reservoirs. Petroleum Geol. and Oilfield Dev. Daqing 41 (04), 168–174. doi:10.19597/j.issn.1000-3754.202103021
McGuire, W. J., and Sikora, V. J. (1960). The effect of vertical fractures on well productivity, 1618.SPE. doi:10.2118/1618-G
Mohaghegh, S. D., GaskariA, R., and Maysami, M. (2017). Shale analytics: making production and operational decisions based on facts: a case study in marcellus shale. SPE184822. doi:10.2118/184822-MS
Pan, Y., Jing, W., Xu, Y., Zhao, S., Li, J., Tao, D., et al. (2018). Volumetric fracturing capacity prediction study of horizontal wells in volcanic reservoirs. Lithol. Reserv. 30 (03), 159–162. doi:10.12108/yxyqc.20180318
Prats, M. (1961). Effect of vertical fractures on reservoir behavior-incompressible fluid case, 1575.SPE. doi:10.2118/1575-G
Raymond, L. R., and Binder, G. G. (1967). Productivity of wells in vertically fractured managed formation, 1454.SPE. doi:10.2118/1454-PA
Tang, Q., and Wang, T. (2023). XGBoost-based capacity prediction for fractured horizontal wells. China Petroleum Chem. Stand. Qual. 43 (24), 15–17. doi:10.3969/j.issn.1673-4076.2023.24.006
Wang, S., and Chen, S. (2023). Insights to fracture stimulation design in unconventional reservoirs based on machine learning modeling. J. Petroleum Sci. Eng. 174, 682–695. doi:10.1016/j.petrol.2018.11.076
Wang, W. (2018). Application of cluster analysis in selection of wells and intervals for repeated fracturing of horizontal wells. Chem. Eng. Equip. (03), 76–78.
Yan, Z., Zheng, Y., Sun, S., Yu, C., and Wang, Y. (2021). Data-driven post-fracturing production prediction based on tight sandstones in Changqing oilfield. China Energy Environ. Prot. 43 (10), 96–101. doi:10.19389/j.cnki.1003-0506.2021.10.018
Keywords: data-driven, horizontal fracture fracturing, productivity optimization, application, controlling factors
Citation: Li Q, Sui Y, Luo M, Guan B, Liu L and Zhao Y (2025) Data-driven intelligent productivity prediction model for horizontal fracture stimulation. Front. Earth Sci. 13:1601363. doi: 10.3389/feart.2025.1601363
Received: 27 March 2025; Accepted: 30 June 2025;
Published: 01 August 2025.
Edited by:
Xin Sun, Sinopec Matrix Co., LTD., ChinaReviewed by:
Fuqiong Huang, China Earthquake Networks Center, ChinaYingkun Fu, University of Alberta, Canada
Fengjiao Zhang, China University of Petroleum, China
Copyright © 2025 Li, Sui, Luo, Guan, Liu and Zhao. This is an open-access article distributed under the terms of the Creative Commons Attribution License (CC BY). The use, distribution or reproduction in other forums is permitted, provided the original author(s) and the copyright owner(s) are credited and that the original publication in this journal is cited, in accordance with accepted academic practice. No use, distribution or reproduction is permitted which does not comply with these terms.
*Correspondence: Yiyong Sui, c3VpeXlAMTI2LmNvbQ==, c3VpeXlAdXBjLmVkdS5jbg==