 Zhongyu Zhang
 Wentao Jia
 Weimin Zhang
- College of Meteorology and Oceanology, National University of Defense Technology, Changsha, China
From 18 to 21 August 2024, short-duration torrential rains hit Northeastern China. A severe marine heatwave occurred in China’s offshore simultaneously, significantly affecting water vapor transport and precipitation system evolution. From the air-sea interaction perspective, this study analyzes how offshore marine heatwaves regulate atmospheric rivers—weather systems triggering heavy precipitation—to reveal the mechanism by which sea surface temperature anomalies influenced this torrential rain. First, the study identified physical characteristics of atmospheric rivers and marine heatwaves using multi-source meteorological and oceanographic data plus relevant algorithms, and analyzed their correlation with North China’s rainstorm. Then, sea surface temperature sensitivity experiments were conducted via the Weather Research and Forecasting model to diagnose how sea surface temperature anomalies indirectly affect precipitation intensity and distribution through atmospheric rivers. Key conclusions are: (1) Statistical analysis shows atmospheric rivers exist in East Asia in August, with trajectories mostly along the East Asian coast and obvious spatiotemporal variations. On 20 August 2024, a strong atmospheric river extended from South China to Northeast China, moving mainly along China’s eastern coast and providing abundant water vapor for precipitation. (2) Favorable circulation patterns combined with the marine heatwaves jointly drove the formation of atmospheric rivers and precipitation. The extreme precipitation was synergistically driven by an extremely long-persisted marine heatwave over the East China Sea, which provided a continuous moisture source for the atmospheric river. The interaction between upper-level and lower-level jet streams enhanced moisture transport and atmospheric baroclinic instability, thereby promoting the triggering of convective precipitation. (3) Experiments with the WRF+3DPWP show the long-persisted marine heatwave affects lower atmospheric circulation, strengthening the southeasterly jet along China’s eastern coast to boost atmospheric river intensity and related precipitation. Cyclonic circulation anomalies near the Yellow Sea also promote trough and cold vortex formation. Besides, higher sea surface temperature increases low-level atmospheric humidity and water vapor flux, enhances atmospheric instability, and promotes convective system development. From the novel “marine heatwave–atmospheric river–heavy rainfall” perspective, this study clarifies the 2024 summer North China torrential rain’s physical mechanisms and influencing factors, highlights local air-sea interaction’s role in short-term weather and climate, and provides new references for improving heavy rainfall prediction.
1 Introduction
Atmospheric rivers (ARs), as critical components of zonal atmospheric moisture transport, exert profound impacts on the hydrological cycle and extreme precipitation across mid-latitude regions (Guan and Waliser, 2015). Guan and Waliser conducted a pioneering global analysis of AR dynamics (frequency, migration patterns, and zonal scales) from 1997 to 2014, identifying high-activity AR corridors spanning southeastern China to the U.S. West Coast. Their work highlighted that AR frequency peaks in extratropical ocean basins while remaining minimal in polar regions, laying the foundation for understanding ARs’ global distribution (Guan and Waliser, 2015). Subsequent studies have solidified ARs’ role in regional extreme precipitation: Ralph et al. demonstrated that ARs drive up to 92% of extreme rainfall events in California (Ralph et al., 2018), while Lavers and Villarini linked AR activity to widespread flooding in the central United States (Lavers and Villarini, 2013). Parallel research in Iran (Neda and Hassan, 2020) and Western Europe (Ramos et al., 2020) further confirmed ARs’ universal influence on precipitation regimes, with variations in AR intensity and trajectory directly shaping the magnitude and spatial distribution of regional rainfall.
In East Asia, the interplay between ARs and the monsoon system makes the region particularly susceptible to AR-related extreme precipitation, and recent studies have advanced understanding of region-specific mechanisms. Sun et al. focused on northern China, showing that the convergence of dry, cold air masses from the Northeast Cold Vortex and warm, moist airflow transported by ARs creates a thermodynamic “confrontation zone” that sustains heavy rainfall (Sun et al., 2018). Building on this, Pan and Lu analyzed major flood events in the Yangtze River basin (1985–2016), revealing that East Asian ARs act as transoceanic moisture conduits—drawing water vapor from the Arabian Sea, Bay of Bengal, and South China Sea—with their paths constrained by the northwest Pacific subtropical high (Pan and Lu, 2019). Liang et al. extended this work to long-term climate scales using ERA5 reanalysis and APHRODITE precipitation data, finding that ARs have been a key driver of China’s “south flooding, north drought” pattern over decades. They further projected that global warming will amplify AR-associated precipitation by enhancing atmospheric humidification and altering jet stream zonal amplitude (Liang et al., 2022). Qin et al. complemented these findings by noting that ARs elevate precipitable water in affected regions and maintain lower-tropospheric vertical instability, providing both the thermodynamic fuel and dynamic trigger for intense convective rainfall (Qin et al., 2024). Despite these advances, a critical gap remains: few studies have explored how ARs interact with extreme oceanic anomalies—specifically marine heatwaves (MHWs)—to amplify heavy rainfall via local air-sea feedbacks, especially in the context of China’s offshore waters.
Marine heatwaves—defined as prolonged (≥5 consecutive days) anomalous ocean warming exceeding the 90th percentile of a 30-year climatological baseline (Hobday et al., 2016)—have emerged as a defining climate hazard of the 21st century, with far-reaching impacts on ocean-atmosphere interactions. Oliver et al. synthesized global MHW research in a landmark review, emphasizing that MHWs disrupt ocean heat and moisture fluxes, alter atmospheric circulation, and exacerbate extreme weather on adjacent landmasses (Oliver et al., 2020). Frölicher et al. documented a 54% increase in global MHW frequency since 1982, with a 17% per decade rise in intensity—trends projected to accelerate under RCP8.5 scenarios (Thom et al., 2023). For East Asia’s marginal seas (a key region for this study), Ma et al. conducted a 42-year (1982–2023) observational analysis of the East China Sea, finding that MHW indices (frequency, duration, and cumulative intensity) exhibit significantly positive trends: the annual frequency of MHWs increased by 0.42 times/decade, with coastal waters from northern Jiangsu to northeastern Taiwan experiencing the most pronounced intensification. This trend is driven by enhanced solar radiation and reduced latent heat loss from the ocean surface, creating persistent warm sea surface temperature (SST) anomalies that modulate overlying atmospheric circulation (Ma et al., 2025). These regional MHWs modulate AR dynamics through dual pathways: first, by increasing sea-air latent heat flux (by 15–20 W/m2 per °C SST anomaly) to strengthen low-level jets (LLJ) that steer ARs northward; second, by expanding the warm moist air mass over the ocean, which extends AR persistence by 1–2 days. Global and basin-scale SST modes further amplify these local effects. A compelling case comes from coastal marine heatwaves in the Santa Barbara Channel (U.S. West Coast), where Chan et al. found that persistent MHWs (duration >30 days) enhance ocean-atmosphere moisture exchange by 25%–30%, strengthening the low-level jets that sustain ARs. When these ARs encounter coastal orography, the enhanced moisture transport doubles the intensity of extreme rainfall compared to non-MHW periods—this mechanism underscores how MHW-induced SST anomalies can amplify AR-related precipitation across mid-latitude coastal regions (Kit et al., 2024).
Notably, SST anomalies are known to influence AR dynamics: Ma et al. found that mesoscale SST anomalies in the Kuroshio Extension exert long-range impacts on ARs making landfall along the U.S. West Coast, modulating their intensity and associated rainfall (Liu et al., 2021).
However, current research on the AR affecting China has primarily focused on its large-scale water vapor transport function. The physical processes by which the AR interacts with extreme oceanic anomalies (such as marine heatwaves) to amplify heavy rainfall through local air-sea feedback mechanisms remain a relatively understudied area. From 18 to 21 August 2024, North China and Northeast China experienced a historic extreme rainfall event driven by the combined influence of a Northeast Cold Vortex, the subtropical high, and a northward-moving AR. Notably, prior to and during this event, China’s eastern coastal regions—particularly the Yellow Sea—were undergoing an intense marine heatwave with significantly anomalous SSTs. We hypothesize that this Yellow Sea marine heatwave was not merely a background condition. It likely played a crucial role in modulating the intensity and persistence of the AR by enhancing local moisture and energy supply, thereby amplifying rainfall intensity over North China and Northeast China. This study explores the impact of marine heatwaves and atmospheric rivers on heavy rainfall, with a focus on the role of local sea-air interactions. Through the implementation of numerical simulations, the study elucidates the underlying physical mechanisms, thereby further enrichment of research theories related to atmospheric rivers.
2 Data and methods
2.1 Data
The meteorological data employed in this study is predominantly sourced from datasets disseminated by the European Centre for Medium-Range Weather Forecasts (ECMWF), encompassing ERA5 single-layer hourly data from 1940 to the present and ERA5 pressure-level hourly data from 1940 to the present. The spatial resolution of this dataset is 0.25° × 0.25°. The model provides detailed information on numerous meteorological variables, including precipitation, vertically integrated horizontal water vapor transport (IVT), wind fields, and geopotential height. ERA5 data employs advanced numerical weather prediction models and data assimilation techniques, integrating diverse global observational sources. The daily-averaged SST data originate from the OISST V2 dataset, which was released by the U.S. National Oceanic and Atmospheric Administration (NOAA). The spatial resolution of this dataset is 0.25° × 0.25°. The OISST V2 dataset is a synthesis of multiple satellite observations, incorporating some in-situ measurements. The data undergoes meticulous interpolation and quality control processing to accurately reflect the spatiotemporal variability of global ocean surface temperatures. Furthermore, numerical simulations employ the FNL global atmospheric reanalysis data provided by the National Centers for Environmental Prediction (NCEP) and the HYCOM global ocean reanalysis data as model background fields and initial boundary conditions.
2.2 Methods
2.2.1 Atmospheric river identification algorithm
This study utilizes the PanLu2.0 algorithm for the identification of atmospheric rivers. In comparison with earlier algorithms, PanLu2.0 introduces a dual-threshold recognition approach, underpinned by Gaussian-smoothed local thresholds and regional thresholds. The model employs image segmentation techniques to effectively distinguish ARs governed by different physical mechanisms and weather systems, such as subtropical high-pressure systems, extratropical cyclones (EC), and tropical cyclones (TC) (Pan and Lu, 2020). The algorithm is composed of the following steps: the detection of preliminary AR regions; the generation of AR trajectories; and the exclusion of non-AR paths.
The initial step in the AR region detection process entails the calculation of the local threshold for the designated study area. The local threshold, as defined by this algorithm, is the 85th percentile of IVT intensity across all grid cells and time steps within the study area. Subsequently, Gaussian kernel density smoothing (GKS) is implemented to delineate the spatially smoothed 85th percentile of IVT intensity as the local threshold. The local threshold can be expressed as follows:
where
Next, the regional threshold is calculated, defined as the 80th percentile of IVT intensity across all grids within the study area. Regions meeting both the regional and local intensity thresholds, with a length ≥2000 km and aspect ratio ≥2, are identified as ARs.
To extract and characterize the geometric features of the AR, this algorithm fits a smooth trajectory to the AR region identified in the first step. This trajectory is obtained by smoothly connecting the IVT-weighted centroids of all cross-sections within the AR region. The reference grid for each cross-section is defined at the location of the maximum IVT value. The direction of the weighted IVT is calculated based on the 30% nearest neighbors at the reference grid point. For detailed methodology, refer to Pan and Lu (2020).
2.2.2 Ocean heatwave detection algorithm
Hobday et al. defined the 90th percentile SST during a 30-year climate baseline period as the marine heatwave threshold. Marine heatwave events were characterized as anomalous warming episodes in which SSTs exceed this threshold continuously for a minimum of 5 days. During the anomalous warming period, brief dips below the threshold are permissible, provided that such dips do not persist for more than two consecutive days. The disparity between the peak temperature recorded during the marine heatwave event and the climatological mean temperature is denoted as the Marine Heatwave Intensity (MHWI) (Hobday et al., 2016).
The average SST temperature at any point on the grid is calculated as follows:
Where T denotes the SST on the d-th day of the y-th year (
s of the climate baseline period.
The seasonally varying SST threshold for each grid cell is calculated as follows:
where
the threshold and the seasonal climatology temperature represent the 31-day smoothed

Table 1. Definition and calculation method of heatwave index.
2.2.3 WRF+3DPWP
The WRF (Weather Research and Forecasting version 4.0) model is a widely used numerical weather prediction model primarily employed for research and operational weather forecasting. The WRF model is composed of multiple modules, including the preprocessing system WPS, the ARW dynamic solver, and postprocessing modules. However, the conventional WRF model is deficient in its absence of an ocean module, instead relying exclusively on static SST data as the model’s surface boundary condition. 3DPWP (3-Dimensional Price Weller and Pinkel) is a compact three-dimensional ocean model specifically designed to simulate oceanic mixed-layer and upper-ocean dynamic processes. It can be coupled with the traditional WRF model to form a simplified WRF+3DPWP air-sea coupled model, which demonstrates good performance in simulating and forecasting sea-air interactions (Huang et al., 2023; Li and Tan, 2023).
3 Analysis of precipitation and atmospheric river characteristics
3.1 Precipitation and weather conditions
Starting 18 August 2024, the northeastern Chinese provinces of Liaoning and Jilin experienced persistent heavy rainfall, accompanied by localized severe convective weather such as thunderstorms with strong winds, resulting in severe flooding. The epicenter of precipitation was located in Huludao City, western Liaoning Province. From 18 to 22 August 2024, Huludao City experienced an exceptionally intense rainstorm event. The citywide coverage of heavy rainfall reached 78.9%, with a maximum cumulative precipitation of 540 mm and a peak daily rainfall of 527.7 mm. These figures surpassed all previous records since meteorological observations began in Liaoning Province. This precipitation event reached an exceptionally intense level, marking the strongest rainfall in Huludao since 1951. Figure 1 shows the cumulative precipitation distribution during this period, revealing that rainfall was concentrated along China’s eastern coastline, stretching from South China to Northeast China. The heaviest rainfall occurred on the 19th and 20th, with the precipitation center located in southern Guangdong Province (22°N–23°N, 112°E–114°E) and western Liaoning Province. From the 21st onward, the precipitation process weakened, with small areas of heavy rainfall occurring in Fujian Province (24°N-25°N, 117°E-119°E) and eastern Liaoning Province.

Figure 1. Daily precipitation (mm) for August 19–20, 2024 (a) 00:00 on 19 August 2024 to 00:00 on 20 August 2024; (b) 00:00 on August 20 to 00:00 on 21 August 2024, (c) 00:00 on August 21 to 00:00 on 22 August 2024, (d) 00:00 on August 22 to 00:00 on 23 August 2024. Shadings denote daily accumulated precipitation, with units in millimeters (mm); the color bar (right of the figure) indicates precipitation intervals (0.1–10 mm, 10–25 mm, 25–50 mm, 50–100 mm). Red dashed boxes in each subfigure mark the core heavy rainfall area (Liaoning Province) with the red star marking Huludao City.
To further investigate the causes of heavy rainfall in Northeast China, a detailed analysis of the weather patterns during this precipitation event is necessary. Figure 2 presents the upper-level circulation configurations at 00:00 on 18 August 2024, and 00:00 on 20 August 2024. On 18 August 2024, the upper-level jet stream and mid-to-lower tropospheric circulation jointly modulated the precipitation environment over Northeast China. At the 200-hPa level (Figure 2a): The westerly jet stream over Northeast China intensified vertical ascent—a key dynamic trigger mechanism for precipitation. At the 500-hPa level (Figure 2a): A baroclinic zone formed between the cold, dry northwesterly flow behind the trough and the warm, moist southwesterly flow ahead of it, enhancing atmospheric instability. At the 850-hPa level (Figures 2b,d): The low-level southwesterly flow served as the primary moisture transport belt—its robust southwesterly winds conveyed moisture from the East China Sea to Northeast China. This low-level jet interacted with the 500-hPa baroclinic zone, further intensifying the updrafts.

Figure 2. Upper-level conditions for August 2024: (a) 200 hPa wind field and 500 hPa geopotential height at 00:00 on the 18th and (c) at 00:00 on the 20th; (b) 850 hPa wind field and 850 hPa geopotential height at 00:00 on the 18th and (d) at 00:00 on the 20th. In (a,c), black contours denote geopotential height with units in decameters (dam), where the interval between adjacent contours is 4 dam; wind barbs in (a,b) represent wind direction and speed (1 full barb = 10 m/s, 1 half barb = 5 m/s). In (b), shadings denote 850 hPa temperature gradient with units in °C/100 km (red = strong gradient, blue = weak gradient). In (d), shadings denote specific humidity with units in grams per kilogram (g/kg), and red contours denote wind speed ≥8 m/s (low-level jet range).
In the presence of a low-pressure trough, the influence of cold advection significantly enhanced frontal development, thereby increasing the probability of precipitation. On 20 August 2024, despite alterations in the circulation pattern over northeastern China, conditions remained conducive to precipitation. At the 200-hPa level, the Northeast region continues to be influenced by the upper-level jet stream, albeit with a closer proximity to the jet stream axis. This proximity may enhance vertical motion development, further promoting precipitation formation. The anticyclonic circulation entrenched over China’s northernmost regions played a pivotal role in trapping moisture and inducing localized convergence. This anticyclone formed a dynamic barrier, blocking the northward movement of the low-level jet stream—the primary conduit for transporting moisture from the East China Sea—thereby intensifying moisture convergence. The deflected southwest low-level jet stream interacted with the northeast winds from the anticyclone over western Liaoning, forming a moisture convergence zone. A thorough examination of the weather patterns over the past 2 days indicates that precipitation in Northeast China is predominantly influenced by frontal activity, thereby classifying it as a classic frontal precipitation process. During this period, the synergistic circulation at both upper and lower levels engendered favorable conditions for precipitation, with the most pronounced rainfall occurring along the frontal zone where cold and warm air masses converge.
3.2 Atmospheric river characteristics
Preliminary research suggests that the summer months represent the peak season for atmospheric rivers within the East Asian region. Figure 3 presents the trajectories of East Asian atmospheric rivers, as identified through the utilization of the PanLu2.0 algorithm for August 2024. Overall, the trajectories exhibit a clear coastal concentration, mainly distributed between 15°N and 45°N and 110°E–130°E. They extend north-south along East Asia’s eastern coastline and western North Pacific marginal seas: originating from the northern South China Sea, they stretch north through the Taiwan Strait, East China Sea, and Yellow Sea, pass China’s eastern coast, and finally reach southern Northeast China and western Korean Peninsula—aligning with East Asian summer water vapor transport directions. A prominent north-south main trajectory is visible: starting from South China’s coast, it extends northeast along East China’s coast, passing the Shandong Peninsula to southern Northeast China, with a continuous path and large span. A gray dashed line is added to mark the 1982–2023 August climatological mean northernmost AR boundary (38°N), which is derived from 42 years of ERA5 reanalysis data and validated by Liang et al. (2022). It can be observed that in August 2024, within the active region of atmospheric rivers in East Asia (110°E to 130°E), the vast majority of atmospheric river trajectories extended beyond the climatological northernmost boundary of atmospheric rivers. This rare northward-moving atmospheric river transported substantial moisture from the East China Sea to northeastern China, playing a crucial role in the formation of the recent torrential rainfall. This figure illustrates the atmospheric rivers’ spatial pattern and core transport paths, providing direct trajectory evidence for analyzing the period’s extreme precipitation water vapor source and air-sea interaction’s regulatory effect on atmospheric rivers.
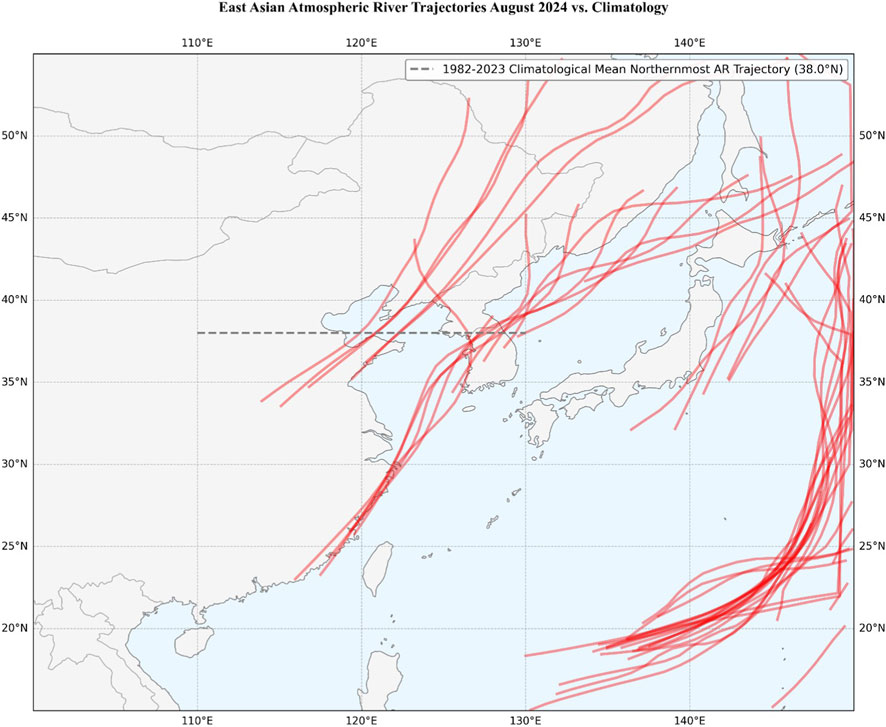
Figure 3. Trajectory Map of East Asian Atmospheric Rivers Identified Using the PanLu2.0 Algorithm for August 2024 [The gray dashed line represents the climatological average northernmost latitude line for atmospheric rivers from 1982 to 2023, confined within the active longitude band of atmospheric rivers (110°E–130°E)].
Figure 4 illustrates the distribution of atmospheric rivers from August 19 to 22, 2024, demonstrating the evolution of their intensity and trajectory over time. On August 19, the IVT high-value band expanded northward into East China and North China. This phenomenon signifies a shift in the atmospheric river’s moisture transport pathway towards the north, accompanied by an intensification of the system. This shift has resulted in the supply of substantial moisture, leading to heavy precipitation in these regions. By August 20, the IVT high-value band persisted in maintaining an elevated state over East China. This indicates that the atmospheric river maintained its moisture transport, albeit with diminished intensity, a phenomenon that is probably attributable to evolving circulation patterns. On August 21, the IVT high-value band underwent a further shift northward, extending into Northeast China. This indicated the atmospheric river’s moisture transport pathway persisted in its northward progression, exhibiting augmented intensity, thereby fostering precipitation in Northeast China. By August 22, the IVT high-value band had gradually dissipated along China’s coastal regions, coinciding with the weakening of the corresponding precipitation event. In general, the development and evolution of the atmospheric river exhibited a high degree of consistency with the precipitation events. Table 2 delineates the specific parameters of the atmospheric river during this period.

Figure 4. IVT Distribution Map of Atmospheric River (Unit: kg/(m·s)) and Trajectory Distribution, August 19–22, 2024. (a) IVT distribution on August 19, 2024; (b) IVT distribution on August 20, 2024; (c) IVT distribution on August 21, 2024; (d) IVT distribution on August 22, 2024. The red solid curve denotes AR trajectory.
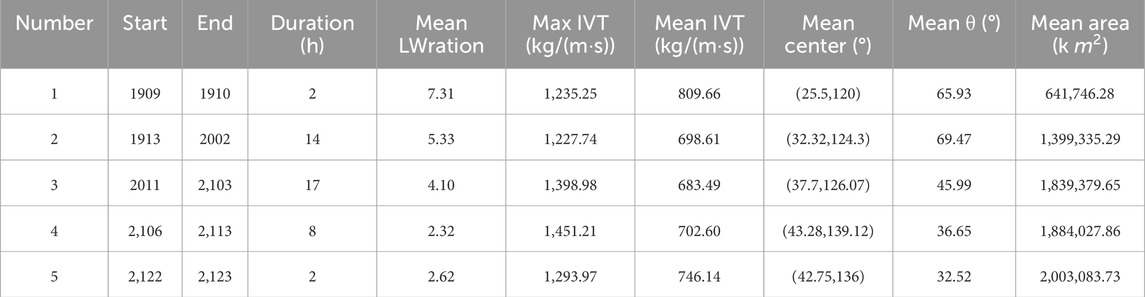
Table 2. East Asian Atmospheric River-Related Indices, August 18–22, 2024 [Start/End Time (DDHH UTC): DD = August 2024 days, HH = UTC hour (e.g., 1909 = 09:00 UTC 19 August)].
From August 18 to 22, 2024, a series of five atmospheric river events transpired across East Asia. The temporal variability of these events encompasses a range of durations, average precipitation levels, maximum and average IVT, and the geographical area of affected regions. The initial and fifth events were comparatively brief, with durations of only 2 hours, suggesting the possibility of transient weather phenomena. The second and third events were more protracted, with durations of 14 and 17 h, respectively, indicating more substantial and enduring regional impacts. The average transportation volumes of IVT are 809.66, 698.61, 683.49, 702.60 and 746.14 kg/(m·s). These water vapor transports provide abundant water vapor for the occurrence of precipitation. Among these events, the second atmospheric river exhibited a relatively high Mean IVT of 698.61 kg/(m·s), indicating strong moisture transport capacity. However, the affected area was not the largest, suggesting relatively concentrated precipitation distribution. In contrast, the fourth atmospheric river event, though lasting only 8 h, exhibited a high maximum IVT value of 1,451.21 kg/(m·s). This finding suggests that, despite its brief duration, the event resulted in significant water vapor transport, potentially leading to substantial precipitation within a relatively short timeframe.
By analyzing precipitation conditions and the presence of atmospheric rivers on specific dates, determine whether the day was influenced by an atmospheric river. If an atmospheric river existed on that day, precipitation occurred, and the atmospheric river overlapped with the precipitation area, the day is deemed affected by an atmospheric river. Days with AR are defined as Phase one (August 4, 5, 20, 21, and 22, 2024), while Days without AR are defined as Phase 2 (all other dates in August 2024). Three metrics were used to analyze the precipitation: total precipitation, average precipitation, and proportion of rainy days (daily precipitation >5 mm). These metrics were calculated across both periods. The results of the study indicate that atmospheric rivers affected Northeast China for a period of 5 days in August, yet contributed over half of the monthly precipitation in certain regions. Spatially, precipitation during Phase I was concentrated in specific areas of Liaoning and Jilin, while Phase II precipitation was more dispersed and weaker in intensity, primarily occurring in Liaoning and Jilin provinces (Figures 5a,d). The daily average precipitation exhibited more pronounced differences, with values exceeding 50 mm during atmospheric river events, compared to less than 10 mm during other periods, indicating a fivefold disparity (Figures 5b,e). Furthermore, the proportion of rainy days south of 45°N reached nearly 100% under atmospheric river influence, compared to only about 15% during normal conditions (Figures 5c,f). This finding underscores the robust correlation between atmospheric rivers and extreme precipitation events. The atmospheric river was a critical meteorological factor in the severe rainstorms and flooding that occurred in Liaoning Province from August 18 to 22.

Figure 5. Comparison of precipitation characteristics in Northeast China during the atmospheric river event phase (Phase I) and without atmospheric river event influence (Phase II), showing total precipitation, average precipitation (in mm), and proportion of rainy days (in %). Panels (a– c) represent Phase I, while panels (d–f) represent Phase II (Red dashed boxes in each subfigure mark the Liaoning Province with the red star marking Huludao City).
4 Marine heatwave
According to the findings of the preceding analysis of atmospheric rivers and precipitation, the moisture for this torrential rainfall in northern China was predominantly transported northward by atmospheric rivers, with their primary pathways traversing China’s coastal regions. During the summer of 2024, an extended and intense marine heatwave event occurred along China’s eastern coastline. According to our analysis, the main factors contributing to the occurrence of MHW in the Yellow Sea and East China Sea are that these areas have been long affected by the subtropical high-pressure system. The clear and cloudless weather allows the sea surface to receive more solar radiation, resulting in abnormal SST. The persistent SST anomalies exerted varying degrees of influence on atmospheric circulation and surrounding weather and climate patterns. This section commences by examining the characteristics of marine heatwaves in China’s coastal waters.
The marine heatwave events that occurred during the summer of 2024 were primarily situated in the East China Sea and Yellow Sea. The study area for the East China Sea in this paper spans latitudes 21°N to 33°N and longitudes 118°E to 130°E. The study area for the Yellow Sea spans latitudes 31°N to 42°N and longitudes 120°E to 125°E. In accordance with the definition proposed by Hobday et al., the ocean heatwave time coefficients were determined for the Yellow Sea and East China Sea, as illustrated in Figure 6. In the East China Sea (Figure 6a), MHW events exhibited a peak concentration between May and October in 2024. It is noteworthy that the SSTs from June to August were considerably higher than the seasonal means and the established threshold, indicating a heightened frequency and intensity of ocean heatwave events during this period. In contrast, MHW events in the Yellow Sea (Figure 6b) also occurred between May and October but began later and ended earlier, with overall SST peaks that were slightly lower than those in the East China Sea. This observation suggests that MHW events in the Yellow Sea may exhibit a degree of intensity and persistence that is slightly less pronounced compared to those observed in the East China Sea. In summary, the nearly continuous and intense occurrence of MHW events from June to August provided abundant moisture conditions for precipitation in Northeast China.

Figure 6. Temporal coefficients of marine heatwave events in the East China sea (a) and yellow sea (b).
To more intuitively illustrate the spatiotemporal distribution characteristics of marine heatwaves in China’s offshore waters, we calculated the spatial distribution patterns of various marine heatwave indices (Figure 7). The figure indicates that this marine heatwave primarily occurred in the East China Sea and Yellow Sea regions, persisting for over 50 days with virtually no interruption. Over the past 10 years, the average duration in summer is 18.2 days. The most significant SST anomaly was observed in the Yellow Sea near the Korean Peninsula, reaching nearly 5 °C. Persistent anomalies in SST exert a significant influence on atmospheric circulation patterns, such as the intensity and position of the Western Pacific subtropical high, thereby affecting the stability of atmospheric stratification at the surface. Additionally, as discussed in Chapter 3, the trajectory of the atmospheric river coincided with the areas of the sea affected by the heatwave. During this period, anomalies in SST also impacted the heat flux and water vapor balance of the atmospheric river, thereby influencing precipitation.
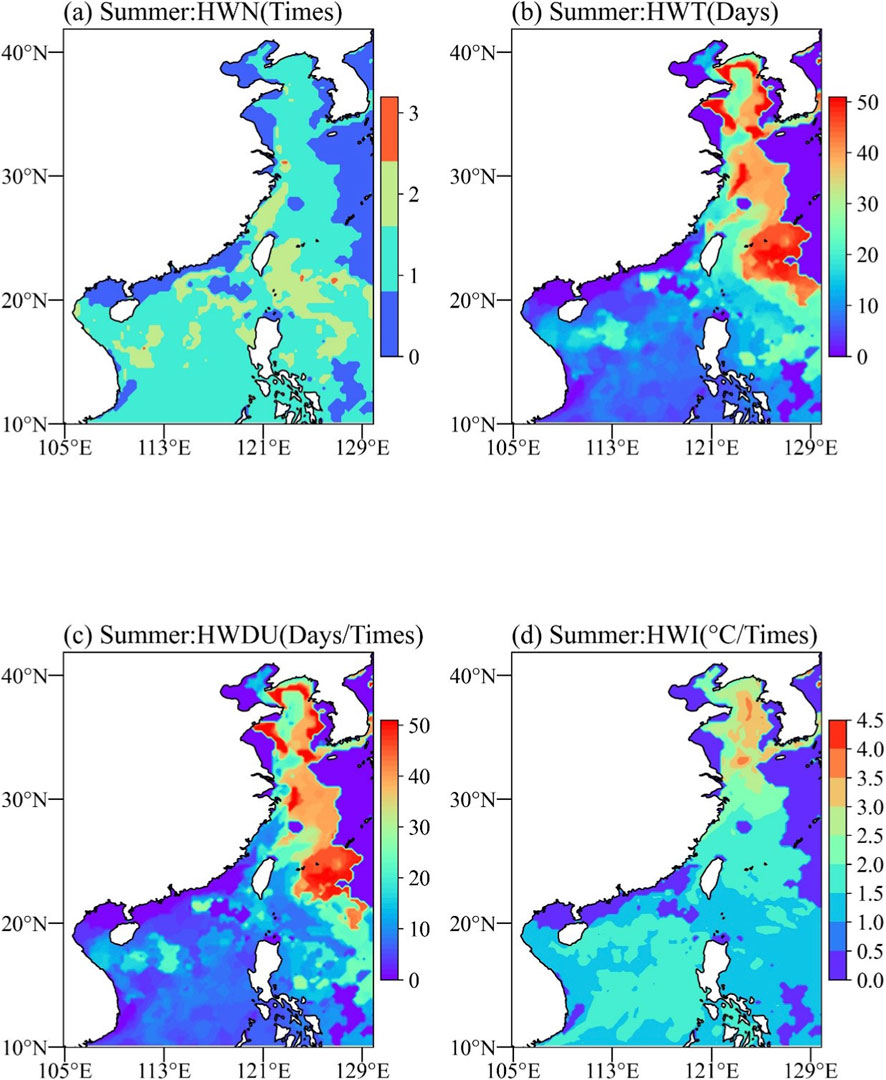
Figure 7. Index distribution map of MHW in China’s coastal waters in August 2024. (a–d) represent HWN, HWT, HWDU, and HWI, respectively.
5 Impact of sea surface temperature anomalies on precipitation
The objective of this study was to investigate the impact of a marine heatwave event on atmospheric rivers and heavy rainfall in northern China. To this end, a simulation of the precipitation event was conducted using the WRF+3DPWP ocean-atmosphere coupled model, and sensitivity tests were performed by varying SSTs.
5.1 Pattern area settings and parametric solutions
This study utilizes WRF v4.3 (Weather Research and Forecasting version 4.3) to simulate the influence of SST on atmospheric rivers and precipitation. The duration of the simulation is 5 days, from August 19 to 24 August 2024. The model utilizes a single-layer grid that is centered at 117.5°E longitude and 32.5°N latitude, with a resolution of 16 km × 16 km. The aforementioned corresponds to 131 × 176 grid points and 45 vertical levels, with a 12-s integration step and Lambert projection. The model employed NCEP’s FNL global tropospheric analysis and forecast reanalysis data (6-hourly) at 0.25 ° × 0.25 ° resolution as the weather background field and initial boundary conditions. The physical parameterization scheme employed is detailed in Table 3.
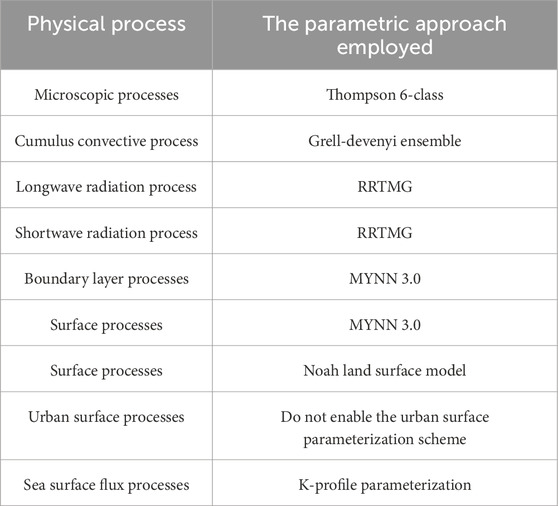
Table 3. Physical parameterization schemes employed in the WRF+3DPWP model.
To further investigate the mechanism by which marine heatwaves influence atmospheric rivers, this study conducted sensitivity tests on SST. To this end, the climatological ocean field provided by HYCOM for the period from 1994 to 21 August 2014, at 00:00 UTC was utilized as the climatological background, and sensitivity tests were performed with the WRF + ROMS coupled model. Without modifying other physical schemes or variables, the SST within the study region was reduced to simulate a scenario without marine heatwaves.
5.2 Sensitivity test comparison
Figure 8 presents a comparison of precipitation and SST data from the real simulation and the sensitivity test. CNTL (Control Experiment) inputs the actual atmospheric and oceanic conditions from the August 2024 heavy rainfall event to reconstruct the actual evolution of the atmospheric river and heavy rainfall. Its results serve as a baseline for quantifying the impact of marine heatwaves. EXP (Sensitivity Experiment) only modifies the sea surface temperature (SST) input (replacing observed SST in the marine heatwave region with the 1991–2020 climatological average SST to eliminate the heatwave signal). All other initial/boundary conditions and physical parameterization schemes remain identical to CNTL. This experiment isolates the role of the marine heatwave. By comparing results with CNTL, it clarifies the heatwave’s impact on atmospheric river intensity, moisture transport, and heavy rainfall. Initially, a comparison was made between ERA-5 and CNTL results. Overall, precipitation simulated in the control experiment was higher than ERA-5, likely due to factors such as ERA-5 reanalysis data’s lower resolution, which introduces errors when compared to observed conditions. However, the locations of precipitation centers were largely consistent between the two, indicating that the WRF model’s simulation results are credible. A comparison of the two tests revealed significant discrepancies, indicating that variations in SST have a discernible impact on precipitation patterns. Precipitation disparities manifested geographically along the Yellow Sea coast, encompassing northern Jiangsu, the Shandong Peninsula, and Liaoning Province. The magnitude of the largest observed difference in eastern Liaoning exceeded 100 mm. A close examination of variations in SST between sensitivity and control experiments has revealed the presence of spatial patterns, with a conspicuous increase in temperature observed in the Yellow Sea and East China Sea regions. This warming has the potential to enhance evaporation, thereby increasing the atmospheric water vapor content and providing additional moisture sources for precipitation formation. The pronounced precipitation differences indicate that SST increases directly influence regional water cycles, with the most intense effects observed in eastern Liaoning. This precipitation increase is likely to be associated with elevated atmospheric water vapor resulting from rising sea temperatures, which in turn can trigger stronger convective activity and precipitation events in these regions.

Figure 8. Comparison of ERA5, CNTL, and EXP: (a–d) SST-related scenarios: (a) ERA5 observed SST, (b) WRF control experiment (real scenario) SST, (c) WRF sensitivity experiment (modified SST, no MHW) SST, and (d) SST difference (real minus modified). ; (e–h) Cumulative precipitation from August 18 to 23, 2024 (e) ERA5 observed precipitation, (f) WRF control experiment precipitation, (g) WRF sensitivity experiment precipitation, and (h) precipitation difference (real minus modified).
Furthermore, an analysis of the humidity, wind, and geopotential height fields at varying pressure levels (500-hPa, 850-hPa, 925-hPa) was conducted, revealing substantial discrepancies between the observed scenario and the scenario with diminished SSTs (Figure 9). These discrepancies unequivocally illustrate the mechanism through which ocean thermal conditions influence atmospheric circulation and precipitation. Circulation patterns indicate the presence of significant cyclonic anomalies at 500-hPa and 850-hPa over the Yellow Sea and Bohai Sea, suggesting that elevated SSTs promote the development of mid-level troughs and northeastern low-pressure systems. Furthermore, these low-pressure circulation anomalies promote vertical atmospheric ascent, enhancing the triggering of severe convective weather. At 850-hPa and 925-hPa, an anticyclonic circulation anomaly persists over seas south of 35°N. This phenomenon is known to intensify the southeasterly jet stream along China’s eastern coast, thereby strengthening atmospheric rivers and delivering greater moisture to the northeastern heavy rainfall region. Anomalies in atmospheric specific humidity are primarily concentrated in the lower atmosphere at 925-hPa. Rising SSTs and intensified jet stream winds over the ocean increased surface evaporation rates and associated turbulent heat fluxes. The combined effect of these factors resulted in an increase in humidity within the atmospheric boundary layer.
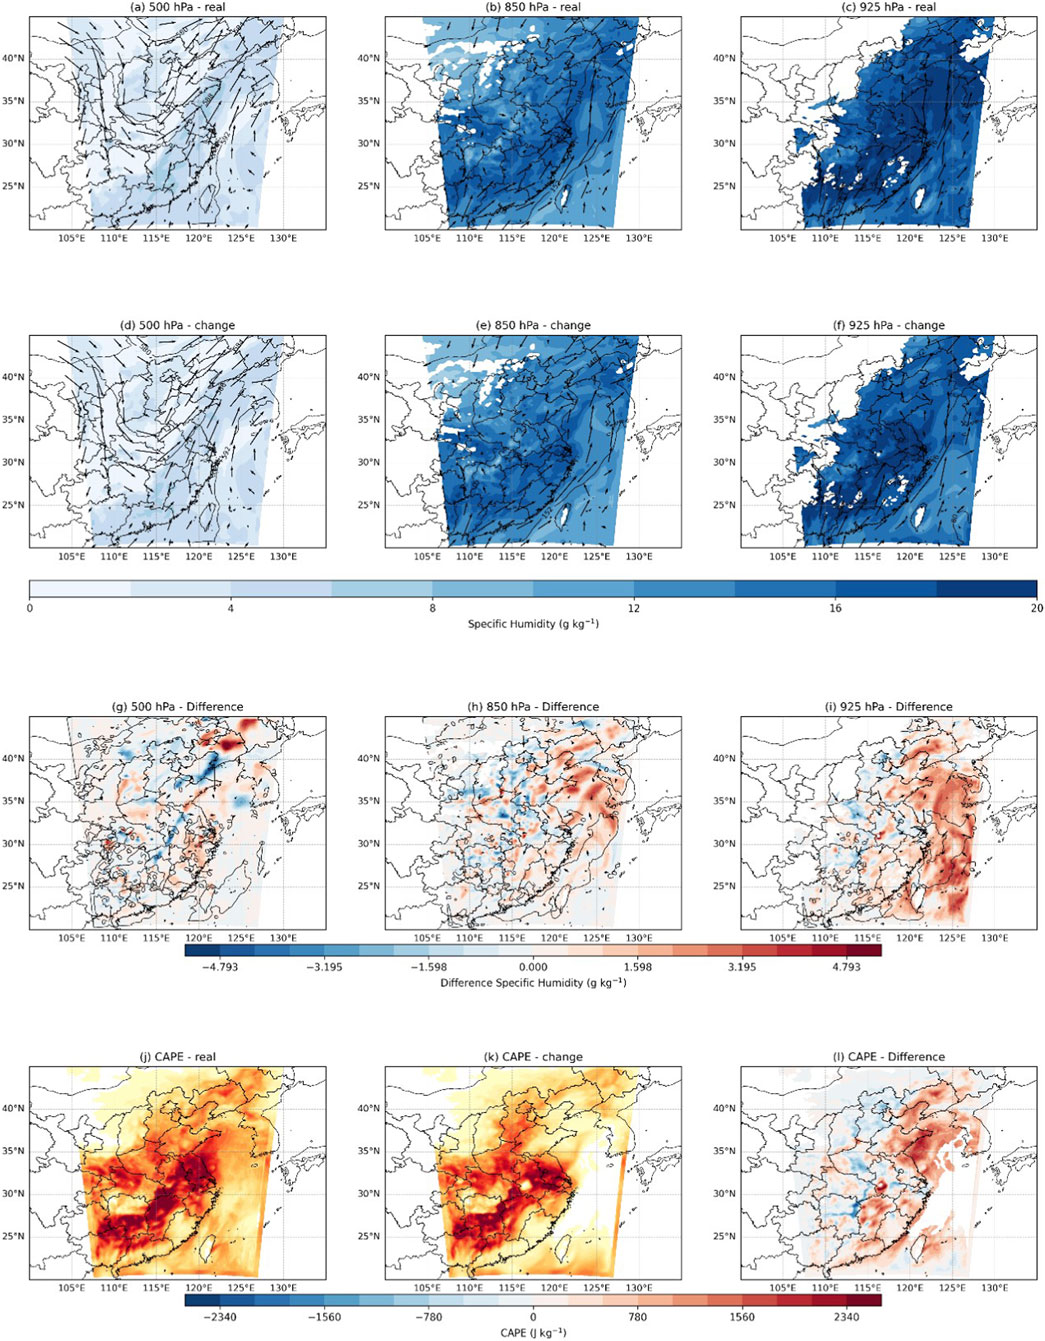
Figure 9. Comparison of humidity fields, wind fields, and geopotential height fields at different pressure levels at 12:00 on 21 August 2024. Top row (a–c) shows the actual scenario; middle row (d–f) shows the scenario with reduced SST; bottom row (g–i) shows the differences between the two scenarios.
Additionally, we calculated Convective Available Potential Energy (CAPE) under varying SST conditions. CAPE is a metric used to characterize atmospheric stability and contained unstable energy, serving as a crucial indicator for studying severe convective weather. The figure indicates that SST anomalies also exert an influence on atmospheric stability in Northeast China. In the context of rising sea temperatures, a notable increase in CAPE values has been observed, particularly in the Yellow Sea and East China Sea regions. This phenomenon is indicative of heightened atmospheric instability, which in turn fosters the development of convective activity and the subsequent formation of severe convective weather systems. The combination of heightened atmospheric instability and increased low-level atmospheric humidity engenders favorable conditions for heavy rainfall and extreme precipitation events in Northeast China. Changes in oceanic thermal conditions have been demonstrated to exert significant impacts on atmospheric circulation, humidity fields, and atmospheric stability. Rising sea temperatures have been shown to alter the thermal structure of the atmosphere, thereby influencing precipitation distribution and intensity by affecting wind fields and humidity patterns.
As previously stated, the atmospheric river constituted a pivotal weather system that exerted significant influence on the precipitation event. Consequently, a comparative analysis was conducted to assess the disparity in atmospheric river intensity between the CNTL and EXP models, as illustrated in Figure 10. On August 19, the IVT difference was primarily concentrated in the southern East China Sea and exhibited relatively small values. This phenomenon can be attributed to the atmospheric river’s nascent stage of development at the time, exhibiting minimal influence from SSTs (see Figure 10a). By August 20, the IVT difference became more pronounced as the atmospheric river entered its intensification phase. From August 21 to 22, the IVT difference reached its zenith, with the vast majority of China’s eastern coastal regions demonstrating positive IVT anomalies that exceeded 200 kg/(m·s). This finding suggests that the anomalously elevated SST significantly enhanced moisture transport, leading to a substantial increase in precipitation in Northeast China (Figures 10c,d). By August 23, the precipitation event had largely concluded, and the atmospheric river gradually weakened and dissipated (Figure 10e). The study found that SST anomalies played a pivotal role in determining the intensity of the atmospheric river, thereby indirectly influencing the heavy rainfall process in Northeast China.

Figure 10. Differences in IVT between the actual scenario and the SST reduction scenario during the period from August 19 to 23, 2024. (a) IVT difference on August 19, 2024; (b) IVT difference on August 20, 2024; (c) IVT difference on August 21, 2024; (d) IVT difference on August 22, 2024; (e) IVT difference on August 23, 2024. The color bar indicates the magnitude of IVT difference (unit: kg/(m·s)).
6 Summary and discussion
This study analyzes the influence of atmospheric rivers and marine heatwaves on heavy rainfall in northern China during the summer of 2024. The analysis is based on multi-source meteorological and oceanic reanalysis data as well as numerical models. It elucidates the physical mechanisms underlying the interactions among various factors. The primary conclusions that can be drawn from this analysis are as follows.
1. Atmospheric rivers are a common occurrence in East Asia during the summer months. During the extreme heavy rainfall event in Northeast and North China from August 18 to 22, 2024, the atmospheric river AR identified by the PanLu2.0 algorithm played a pivotal role in moisture transport: its core corridor (IVT >500 kg/(m·s)) extended northward along the Yellow Sea to western Liaoning, delivering continuous warm and moist air to the rainfall core area. Observational data show that the peak intensity of the AR (max IVT = 1,451.21 kg/(m·s) on August 21) coincided with the peak precipitation period in Huludao, where cumulative rainfall reached 540 mm. Based on the analysis of this August 2024 case study, it is observed that within the scope of this event, precipitation levels and the proportion of rainy days (daily precipitation >5 mm) in Northeast China (Liaoning, western Jilin) were considerably elevated under the influence of the AR—with average daily precipitation in the affected area being 5 times higher than that in non-AR periods of the same month.
2. During this period, an exceptionally intense marine heatwave persisted for over 50 days in the Yellow Sea and East China Sea, with temperature anomalies exceeding 5 °C in some areas. The atmospheric river’s trajectory coincided with the affected waters, leading to the observed phenomenon. SST anomalies have been demonstrated to influence the atmospheric river’s heat flux and moisture budget, thereby affecting precipitation. The findings from WRF+3DPWP numerical simulations and SST sensitivity tests suggest that ocean heatwaves significantly elevate SSTs, thereby enhancing the intensity and moisture transport capacity of atmospheric rivers and increasing precipitation intensity and coverage. Conversely, the absence of ocean heatwaves would result in a significant weakening of both atmospheric river intensity and precipitation.
3. A comparative experimental investigation has yielded the following findings regarding the physical mechanisms linking marine heatwaves to atmospheric rivers and precipitation: Abnormally high SSTs have been shown to alter lower-level atmospheric circulation patterns, while concomitantly intensifying jet streams over the ocean and air-sea flux exchange. This phenomenon, however, has the indirect effect of enhancing the intensity and extent of atmospheric rivers. The enhanced transport of water vapor has been demonstrated to trigger adjustments in atmospheric circulation, thereby further expanding the intensity and influence of atmospheric rivers. Consequently, there is an abundance of water vapor and energy available for the formation of torrential rainfall.
To clarify the causal link between MHWs and ARs, this study first analyzed their spatiotemporal overlap and temporal lag using observational datasets—ERA5 reanalysis data (for AR identification and intensity quantification) and OISST V2 data (for MHW monitoring). For spatial coincidence, as shown in Figure 3 (AR trajectories) and Figure 7 (MHW index distribution), the core trajectory of the AR event during August 18–22, 2024, was highly consistent with the MHW-affected area: the AR extended northward along the East China Sea and Yellow Sea (spanning 118°E–125°E, 31°N–42°N)—a region where MHWs persisted for over 50 days (total MHW days, HWT >50 days, Figure 7b) with local SST anomalies exceeding 3 °C (MHW intensity, HWI >3 °C, Figure 7d). For the temporal lag relationship, a cross-correlation analysis between MHW intensity (MHWI) and AR intensity (mean IVT) revealed a significant directional time lag: the peak of MHW intensity in the Yellow Sea preceded the peak of AR intensity by 1–2 days, which increases atmospheric boundary-layer moisture content and strengthens the southeasterly LLJ over the Yellow Sea. The intensified LLJ then acts as a “moisture conveyor belt” for the AR, promoting the AR’s northward penetration into northern China and further intensification 24–48 h later. This clear temporal sequence excludes the possibility of reverse causality and directly supports the hypothesis that MHWs precede and actively regulate ARs during the study period.
In the East Asian monsoon region, summer torrential rains frequently coincide with organized deep convective systems, specifically mesoscale convective systems (MSCs). Due to limitations in the available space, this paper does not provide further analysis of the triggering mechanisms or the mesoscale convective systems involved in this torrential rain event. Future research endeavors should integrate high-resolution numerical models to elucidate the intricate interactions between fronts, topography, and the ocean. In the context of global climate change, ocean heatwaves are becoming increasingly prevalent and intense. Their interaction with atmospheric rivers exerts a substantial influence on extreme precipitation events. The continuous observation and simulation of these interactions are imperative for enhancing the forecasting of heavy rainfall and the mitigation of associated disasters.
Data availability statement
The original contributions presented in the study are included in the article/supplementary material, further inquiries can be directed to the corresponding authors.
Author contributions
ZZ: Writing – original draft. WJ: Writing – review and editing. WZ: Writing – review and editing. YZ: Writing – review and editing. ZG: Writing – review and editing.
Funding
The authors declare that no financial support was received for the research and/or publication of this article.
Conflict of interest
The authors declare that the research was conducted in the absence of any commercial or financial relationships that could be construed as a potential conflict of interest.
Generative AI statement
The authors declare that no Generative AI was used in the creation of this manuscript.
Any alternative text (alt text) provided alongside figures in this article has been generated by Frontiers with the support of artificial intelligence and reasonable efforts have been made to ensure accuracy, including review by the authors wherever possible. If you identify any issues, please contact us.
Publisher’s note
All claims expressed in this article are solely those of the authors and do not necessarily represent those of their affiliated organizations, or those of the publisher, the editors and the reviewers. Any product that may be evaluated in this article, or claim that may be made by its manufacturer, is not guaranteed or endorsed by the publisher.
References
Guan, B., and Waliser, D. E. (2015). Detection of atmospheric Rivers: evaluation and application of an algorithm for global studies. J. Geophys. Res. 120 (24), 12514–12535. doi:10.1002/2015jd024257
Hobday, A. J., Alexander, L. V., Perkins, S. E., Smale, D. A., Straub, S. C., Oliver, E. C., et al. (2016). A hierarchical approach to defining marine heatwaves. Prog. Oceanogr. 141, 227–238. doi:10.1016/j.pocean.2015.12.014
Huang, J., Pickart, R. S., Chen, Z., and Huang, R. X. (2023). Role of air-sea heat flux on the transformation of Atlantic water encircling the nordic seas. Nat. Commun. 14 (1), 141. doi:10.1038/s41467-023-35889-3
Kit, Y. K. C., Li, K., Adriane, M. M., Amelia, L. R., and Gretchen, E. H. (2024). Coastal marine heatwaves in the Santa Barbara channel: decadal trends and ecological implications. Front. Mar. Sci. 11, 1476542. doi:10.3389/fmars.2024.1476542
Lavers, D. A., and Villarini, G. (2013). Atmospheric Rivers and flooding over the central United States. J. Clim. 26 (20), 7829–7836. doi:10.1175/jcli-d-13-00212.1
Li, D. Y., and Tan, Z. M. (2023). The role of ocean–atmosphere interactions in tropical cyclone intensity predictability. J. Atmos. Sci. 80 (5), 1213–1226. doi:10.1175/jas-d-22-0152.1
Liang, J., Yong, Y. Y., and Hawcroft, M. K. (2022). Long-term trends in atmospheric rivers over East Asia. Clim. Dyn. 60 (3), 643–666. doi:10.1007/s00382-022-06339-5
Liu, X., Ma, X. H., Chang, P., Jia, Y. L., Fu, D., Xu, G. Z., et al. (2021). Ocean fronts and eddies force atmospheric rivers and heavy precipitation in western North America. Nat. Commun. 12 (1), 1268. doi:10.1038/s41467-021-21504-w
Ma, Q., Liu, Z. J., Yin, W. B., Lu, M. X., and Ma, J. M. (2025). Regional divergence in long-term trends of the marine heatwave over the East China Sea. Atmosphere 16 (10), 1150. doi:10.3390/atmos16101150
Neda, E., and Hassan, L. (2020). Identifying atmospheric river events and their paths into Iran. Theor. Appl. Climatol. 140 (3), 1125–1137. doi:10.1007/s00704-020-03148-w
Oliver, E. C., Benthuysen, J. A., Darmaraki, S., Donat, M. G., Hobday, A. J., Holbrook, N. J., et al. (2020). Marine heatwaves. Annu. Rev. Mar. Sci. 13 (1), 313–342. doi:10.1146/annurev-marine-032720-095144
Pan, M. X., and Lu, M. Q. (2019). A novel atmospheric river identification algorithm. Water Resour. Res. 55 (7), 6069–6087. doi:10.1029/2018wr024407
Pan, M. X., and Lu, M. Q. (2020). East Asia atmospheric river catalog: annual cycle, transition mechanism, and precipitation. Geophys. Res. Lett. 47 (15), e2020GL089477. doi:10.1029/2020gl089477
Qin, H., Qin, Y. F., Wu, Y. S., Wang, Z. Y., and Liu, L. (2024). Study on the mechanism of warm-sector torrential rain in Guangxi under atmospheric Rivers background. Plateau Meteorol. 43 (2), 381–397. doi:10.7522/j.issn.1000-0534.2023.00067
Ralph, F. M., Dettinger, M. D., Cairns, M. M., Galarneau, T. J., and Eylander, J. (2018). DEFINING “ATMOSPHERIC RIVER”: how the glossary of meteorology helped resolve a debate. Bull. Am. Meteorological Soc. 99 (4), 837–839. doi:10.1175/bams-d-17-0157.1
Ramos, A. M., Sousa, P. M., Dutra, E., and Trigo, R. M. (2020). Predictive skill for atmospheric rivers in the western Iberian peninsula. Nat. Hazards Earth Syst. Sci. 20 (3), 877–888. doi:10.5194/nhess-20-877-2020
Sun, Y. S., Wang, Y. Q., Shen, X. Y., Zhou, Y. S., and Deng, G. (2018). Diagnostic analysis on a heavy rainfall associated with the northeast cold vortex and atmospheric river. Plateau Meteorol. 37 (4), 970–980.
Thomas, L. F., Erich, M. F., and Nicolas, G. (2023). Marine heatwaves under global warming. Nature 560 (7718), 360–364. doi:10.1038/s41586-018-0383-9
Wu, Y. F., Jia, Y. L., Ji, R., and Zhang, J. (2020). SST warming in recent decades in the gulf stream extension region and its impact on atmospheric Rivers. Atmosphere 11 (10), 1109. doi:10.3390/atmos11101109
Keywords: atmospheric rivers, marine heatwaves, WRF+3DPWP, heavy rainfall, sea-air interaction
Citation: Zhang Z, Jia W, Zhang W, Zhou Y and Gao Z (2025) Analysis of the impact of atmospheric rivers and marine heatwaves on heavy rainfall in northeastern China during the summer of 2024. Front. Earth Sci. 13:1693783. doi: 10.3389/feart.2025.1693783
Received: 27 August 2025; Accepted: 13 November 2025;
Published: 03 December 2025.
Edited by:
Kevin Cheung, Nanjing University of Information Science and Technology, ChinaReviewed by:
Yuanyuan Guo, Fudan University, ChinaSihua Huang, Shanghai Meteorological IT Support Center, China
Copyright © 2025 Zhang, Jia, Zhang, Zhou and Gao. This is an open-access article distributed under the terms of the Creative Commons Attribution License (CC BY). The use, distribution or reproduction in other forums is permitted, provided the original author(s) and the copyright owner(s) are credited and that the original publication in this journal is cited, in accordance with accepted academic practice. No use, distribution or reproduction is permitted which does not comply with these terms.
*Correspondence: Wentao Jia, bnVkdF9qd3RAMTYzLmNvbQ==; Yuliang Zhou, MTU1NjczMTU3MTNAMTYzLmNvbQ==