 Shujuan Li1,2,3*
 Jing Chen1,2,3*
 Hong Huo1,2,3Huaming Shang1,2,3Xinyu Lu1,2,3
 Tongwen Zhang2,4
 Junqiang Yao1,2,3Weiyi Mao1,3,5Mengying Yao1,3Liyun Ma1,3Dilinuer Tuoliewubieke1,2,3
- 1Institute of Desert Meteorology, China Meteorological Administration, Urumqi, China
- 2Key Laboratory of Tree-ring Physical and Chemical Research, China Meteorological Administration, Urumqi, China
- 3Field Scientific Experiment Base of Akdala Atmospheric Background, China Meteorological Administration, Urumqi, China
- 4Xinjiang Climate Center, Urumqi, China
- 5Xinjiang Key Laboratory of Desert Meteorology and Sandstorm, Urumqi, China
Introduction: As the “Water Tower of Central Asia,” the Pamir Plateau is critical for regional water security. Research on its extreme precipitation is therefore vital for water resource assessment, hydrological modeling, and disaster risk planning.
Methods: Using daily observational data and the Peak Over Threshold method, we constructed extreme precipitation series across the region. Forty-six statistical functions were applied to select the optimal fit for return period analysis at each station, enabling the estimation of precipitation amounts across eight return periods.
Results: (1) Extreme precipitation exhibits non-synchronous variation with annual precipitation. While about two-thirds of stations show increasing daily extremes, 42.9% show opposite trends between the two. Spatially, extremes are lowest in the southwestern plateau and highest in the Fergana Basin. (2) The contribution of extreme precipitation to multiyear totals ranges from 24.0% to 40.0%, peaking at 88.13% in some years, and shows a significant negative correlation with annual precipitation. Stations above 3,400 m record higher amounts, suggesting a maximum precipitation belt above the previously recognized 2,000–3,500 m range. (3) Stations with annual precipitation below 150 mm exhibit the strongest extremes, where a single 50–100 year return period event can approach or exceed half of the local annual total. (4) The Wakeby and Gen.Pareto distributions show the widest applicability for the region, each optimal for 36% of stations. Extreme precipitation increases 2–3-fold as return periods extend from 2 to 100 years, reaching a maximum of 68.1 mm.
Discussion: These findings highlight significant flood risks and ecological vulnerability, particularly in arid areas with fragile ecosystems. The identified spatial patterns and the lack of a universally applicable distribution function underscore the complexity of extreme precipitation in the Pamir Plateau. This work provides a critical foundation for improved water resource management and climate adaptation strategies in Central Asia.
1 Introduction
The Pamir Plateau, located in southwestern Central Asia, features vast mountain ranges with an average elevation exceeding 4,500 m. Spanning several Central Asian countries, including China, Tajikistan, Pakistan, and Kyrgyzstan, it serves as a major moisture barrier in the region. Precipitation over the Pamir Plateau plays a crucial role in the water resources of Central Asia’s arid zones. Its complex terrain supports extensive glaciers, rivers, and lakes, making it one of the primary water sources in Central Asia and earning it the title “Water Tower of Central Asia.”
In recent decades, extreme precipitation has increased at approximately two-thirds of global observation sites, including those in the eastern Pamir Plateau (Sun et al., 2021; Zheng, 2023; Han et al., 2025). From 1936 to 2005, all extreme precipitation-related indices in Central Asia showed an upward trend except for consecutive dry days (CDD) (Yao et al., 2021; Zhang et al., 2017). However, average precipitation has not consistently increased: regions such as the Syr Darya River basin (Yao and Chen, 2015) and the Alay Mountains (Opała Owczarek and Niedzwiedz, 2019) have experienced varying degrees of precipitation rise, while the Amu Darya River basin (Wang, 2016) and the Muztagh Ata region (at 7,010 m altitude) in the eastern Pamirs have shown a declining trend in recent years (Duan et al., 2015). Some studies also suggest that Central Asia exhibited a warm-dry trend from 1901 to 2002 (Wang et al., 2010), with the Pamir Plateau becoming wetter in spring but drier in summer, indicating contrasting seasonal trends (Chen et al., 2025).
With intensified global warming, extreme precipitation events such as floods and droughts are becoming more frequent, posing severe threats to human safety and constraining sustainable socioeconomic development in affected regions (IPCC, 2023). As a critical water source region in arid Central Asia, the importance of the Pamir Plateau is self-evident. However, current understanding of the spatiotemporal distribution characteristics of extreme precipitation on the plateau remains inadequate in several aspects. First, existing research has predominantly focused on the regional scale of Central Asia (Wei et al., 2023; Lei et al., 2024; Gummadi et al., 2025), lacking refined and targeted studies dedicated to the unique topographic unit of the Pamir Plateau itself. Second, identified as the center of maximum interannual precipitation variability in Central Asia (Hu et al., 2017; Yan and Zhao, 2022), the Pamir Plateau exhibits pronounced spatial-temporal heterogeneity in its extreme precipitation trends (Zou et al., 2021), yet its quantitative characteristics have not been fully revealed. Third, discrepancies among different data sources and their biases relative to observational records have led to inconsistent research findings (Wang et al., 2017), creating a pressing need to use reliable data for extreme precipitation research on the Pamir Plateau.
The return period, defined as the average time interval between occurrences of an event of a specific magnitude, is used to characterize the occurrence probability of extreme events. It is commonly applied to estimate the recurrence intervals of natural disasters such as earthquakes and floods of varying magnitudes (Tsunetaka, 2021; Muhammad et al., 2016). Extreme precipitation estimates for different return periods are fundamental inputs for hydrological models. They are used to drive scenario simulations and are crucial for model calibration and optimization (Zscheischler et al., 2018; Stein et al., 2021; Zhang et al., 2022). They also constitute essential prerequisite data and core support for disaster risk planning (Wang et al., 2024; Weinthal and Sowers, 2020), serve as the primary basis for establishing and revising design standards in engineering (Biancamaria et al., 2016), and act as evaluation criteria for meteorological extreme events (Brunner et al., 2019; Peres and Cancelliere, 2016), and so on.
This study focuses on the characteristics of extreme precipitation and the estimation of precipitation for corresponding return periods in the Pamir Plateau. Accurately assessing extreme precipitation across various return periods is critical for quantitatively understanding its evolving patterns on the plateau, providing a reliable benchmark for analyses based on multiple data sources in the region, and enhancing the knowledge of water resource dynamics in Central Asia. Furthermore, it offers essential scientific support for regional water allocation, the development and refinement of hydrological models, and the optimization of disaster prevention designs and early-warning systems.
The remainder of this paper is organized as follows: Section 1 describes the data and methodology used for analyzing extreme precipitation in the Pamir Plateau. Section 2 presents the core findings, including the characterization of extreme precipitation, station-specific selection of optimal fits from 46 probability distribution functions, and estimates of extreme precipitation magnitudes across return periods. Sections 3 and 4 provide the discussion and conclusions, respectively.
2 Data and methods
2.1 Data
This study focuses on the Pamir Plateau (36°N–41°N, 72°E–77°E), utilizing observational data from meteorological stations within this domain (Figure 1). A total of 28 stations with extended temporal coverage were selected, including three national reference meteorological station in China’s Pamir region: Tashkurgan, Wuqia, and Turgart. These three stations provide consistent daily precipitation records from 1961 to 2023, sourced from the Xinjiang Meteorological Information Center. The remaining 25 stations across Uzbekistan, Tajikistan, and Kyrgyzstan, provide daily precipitation data obtained from the GHCN-D v2.0 dataset via the KNMI Climate Explorer (http://climexp.knmi.nl/getstations.cgi). Precipitation records of the 23 stations begin in 1940 but were mostly discontinued by 1991 or earlier, while records for two stations extend to 2006. All data underwent strict quality control. Station-specific distributions of annual precipitation samples and corresponding valid observation periods are illustrated in Figure 1. Among the observational network, 11 stations maintain quality-controlled records of 50 years or longer, 6 stations have valid records between 30 and 50 years, and 11 stations have data coverage of less than 30 years.

Figure 1. Spatial distribution of meteorological stations, observation durations, and valid data periods across the Pamir Plateau. (The study area of the Pamir Plateau is located at 36°N–41°N, 72°E–77°E. The ★ symbol denotes Station Name_Observation Period/Valid Data Years; for example: BAITOK_1959∼1987/13 indicates that the BAITOK station’s observation span is 1959–1987, but its quality-controlled valid data period is 13 years).
2.2 Research method for return period of extreme precipitation
2.2.1 Construction of extreme precipitation sequences
In the study of extreme precipitation events, the choice of threshold must balance both the “rarity” of events and the sufficiency of samples. It is generally required that the sample rate remains below 10% and that at least one event occurs each year (Chen et al., 2022). For the 28 stations on the Pamir Plateau, using the 99th percentile as the threshold makes it difficult for some stations to meet the condition of having at least one sample per year. The 93rd–96th percentiles represent the optimal range for selecting extreme precipitation thresholds in Central Asia (Wang et al., 2020). Totally, the 95th percentile (R95p) strikes a good balance between spatial representativeness and sample size, making it more suitable for most stations (Chen et al., 2022). This threshold has also been applied in analyses of extreme precipitation characteristics in Central Asia by Lai et al. (2020) and Ma et al. (2020). Therefore, this study employs the Peak Over Threshold (POT) method to identify extreme precipitation events, utilizing the R95p as the threshold. Annual datasets were screened under the constraint that missing sequences constitute less than one-third of yearly records. Valid precipitation observations were extracted and sorted in descending order, with the top 5% of sequences designated as POT extreme precipitation events. Eight return periods as 2, 3, 5, 10, 20, 30, 50 and 100 years were selected.
2.2.2 Data quality control and homogeneity testing
A rigorous quality control process was applied to the data. Using complete calendar years as the fundamental units of analysis, a clear completeness threshold was set: only years with missing data not exceeding one-third of the annual record were retained. This criterion ensures data continuity while maximizing the use of available observational information. Each selected sample was individually inspected to confirm the absence of obvious recording errors, outliers, or invalid data caused by non-meteorological factors; all values fall within reasonable physical ranges.
For the original station precipitation data in the study area, we used a suite of five tests: the Standard Normal Homogeneity Test (SNHT), the Two-Phase Regression (TPR), the Pettitt test, the Buishand test, and the Von Neumann ratio test (Liu et al., 2012). Data were considered robustly homogeneous and retained for analysis only if at least four of the tests passed. At the 5% significance level, none of these tests—SNHT, TPR, Buishand, Pettitt, or von Neumann—detected significant change points or non-homogeneities. The entire precipitation dataset is statistically homogeneous. Although missing data at some stations result in discontinuous records, which may reduce the statistical power of the tests, the available data support the conclusion of homogeneity.
2.2.3 Classification of precipitation intensity levels
Most regions of Central Asia and Northwest China are arid. We adopted the precipitation intensity classification from the Xinjiang local standard Precipitation Scale (DB 65/T 3273—2011), rather than the precipitation intensity classification recommended by the World Meteorological Organization (WMO). The 24-h precipitation intensity levels are defined as Table 1.

Table 1. Xinjiang local precipitation scale and the WMO-recommended precipitation intensity classification.
2.2.4 Screening optimal fitting functions for extreme precipitation return periods
Using the POT extreme precipitation sequences from 28 stations across the Pamir Plateau, we fitted 46 probability distribution functions to the data at each site (Table 2). The optimal distribution for each site was selected to estimate precipitation magnitudes corresponding to different return periods. Parameters of the extreme value distributions were estimated using the least squares method, and the statistical goodness of fit was evaluated with the Kolmogorov-Smirnov (K-S) and Anderson-Darling (A-D) tests.

Table 2. 46 probability distribution functions for fitting.
2.2.5 Contribution rate difference metric
A contribution rate difference metric was introduced to identify the primary seasons of extreme precipitation occurrence. The formula is as follows:
In Equation 1, PMAMJJA and PMAMOND represent the contribution proportion of extreme precipitation to total precipitation during MAMJJA (March–August) and MAMOND (March, April, May, October, November, December), respectively. B means the bias between PMAMJJA and PMAMOND。For each station, B effectively captures the seasonal concentration of extremes. A larger positive values of contribution rate difference (B) suggests that extreme precipitation is mainly concentrate in summer (JJA), strong negative values of it represent extreme precipitation tends to occur in winter (OND), while the values near zero, means extreme precipitation is more likely to happen in spring (MAM).
3 Analysis of extreme precipitation characteristics and return level estimation in the Pamir Plateau
3.1 Precipitation characteristics of the Pamir Plateau
The extremality of precipitation is a relative concept compared to average conditions. Average precipitation is comparatively straightforward to understand. Therefore, even this paper focuses on extreme precipitation, average precipitation is still introduced here to serve as a baseline for interpreting extreme precipitation and its impacts.
Station elevations across the Pamir Plateau range from 469 m (Taxkorgan) to 4,169 m (SAJMAK), a topographic variation that contributes to strong spatial heterogeneity in precipitation distribution (Figure 2a). Mean annual precipitation varies from 63.56 mm (Torugart) to 1089.81 mm (LEDNIK*, i.e., LEDNIK_PHEDCHENKO_(IM._GORBUNO Station, same hereafter) (Figure 2b), representing a 17-fold difference. Most stations (82.1%, 23 sites) exhibit increasing trends in annual precipitation, while a minority (18.9%, 5 stations)—mainly in the northern plateau—show decreasing trends (Figure 2a). The spatial pattern of annual maximum precipitation align with mean precipitation, with a 17.4-fold difference between wettest and driest stations. A stark contrast appears in annual minimum precipitation: CAAR-TAS in the northern plateau recorded 616.3 mm, whereas MURGAB in the southeastern plateau recorded only 2.3 mm—a 268-fold disparity that far exceeds the variability in mean and maximum precipitation.

Figure 2. (a) Spatial distribution of mean annual precipitation and temporal trends on the Pamir Plateau; (b) Station elevation, annual maximum/minimum/mean precipitation, and linear regression coefficients of annual precipitation. (Colored circles ○ in (a) denote mean annual precipitation magnitudes; Red/blue stars ☆ represent linear regression coefficients of annual precipitation; LEDNIK* indicates the station of LEDNIK_PHEDCHENKO_(IM._GORBUNO, hereafter identical).
Approximately 46% of the stations (13 sites) in the Pamir Plateau are located above 3,000 m (Figures 2a,b). The correlation coefficient between mean annual precipitation and altitude is 0.35, which is statistically significant at the 0.1 level, but remains too low to robustly support the established paradigm that “precipitation increases with elevation across the Pamir Plateau” (Zhang and Duan, 2021). The three stations with the highest annual precipitation (all exceeding 500 mm)—LEDNIK* (1089.91 mm), UZGEN (1031.56 mm), and GULCA (570.49 mm), are all located above the elevation of 3,400 m (3,438 m, 3,540 m, and 3,840 m respectively). Only 5 of the 12 stations with moderate precipitation (200–500 mm) lie above 3,000 m above sea level (ASL) (Figure 2b). Analysis of IMERG satellite fusion data indicates that maximum precipitation altitudes in the Pamir Plateau primarily falls within the mid-elevation zone (2,000–3,500 m) (Wang et al., 2023), despite our observational evidence suggests a potentially higher elevation band for peak precipitation. This divergence necessitates further investigation with enhanced observational networks and higher-resolution datasets.
3.2 Contribution of extreme precipitation to total precipitation
Research since the early 21st century indicates that the eastern Pamir has entered a new wet phase, characterized by a notable rise in the frequency and intensity of positive precipitation anomalies (Chen et al., 2018). This conclusion is based on mean precipitation analyses from three long-term stations: Wuqia, Torugart, and Taxkorgan. However, expanded observational networks reveal divergent extreme precipitation patterns across the broader plateau (Figure 3). Specifically, 64.3% of stations (18 sites) show increasing trends in extreme precipitation, while 35.7% (10 sites) exhibit decreasing trends (Figure 3a). Remarkably, at 42.9% of stations (12 sites), the trend in extreme precipitation contradicts that of annual precipitation (Figures 2a, 3a). Spatially, regions with historically low extreme precipitation are concentrated in the southwestern plateau, whereas the highest extremes are found in the northwestern Fergana Basin—the driest region with the lowest mean annual precipitation across the Pamir (Figures 2a, 3a).

Figure 3. Pamir Plateau station analysis: (a) Historical precipitation extremes and extreme precipitation trends; (b) Spatial distribution of extreme precipitation contribution rate to total precipitation; (c) Linear relationship for extreme precipitation contribution rate to total precipitation. (Colored circles ○ in (a) denote magnitudes of annual historical precipitation extremes; Red/blue stars ☆ represent linear regression coefficient b of 95% extreme precipitation sequences).
Under global mean conditions, studies suggests that the contribution of extreme precipitation to total precipitation is lowest in mid-elevation zones (2,000–4,000 m), highest in low-elevation areas (≤2,000 m), and intermediate at high elevations (≥4,000 m) (Li et al., 2024). In contrast, based on limited station data across the Pamir Plateau, no clear linear relationship is observed between extreme precipitation contribution and elevation (Figure 3c), with a no-significant correlation coefficient of −0.11. Instead, the contribution rate of extreme precipitation shows a stronger association with annual total precipitation. The overall contribution of POT extreme precipitation to total precipitation ranges from 24.0% (LEDNIK*) to 39.96% (CATIR-KUL’) (Figure 3b), with western stations generally exhibiting lower values than eastern ones. A significant negative correlation exists between annual precipitation and extreme precipitation contribution, with a coefficient of −0.45 (statistically significant at the 0.02 level), indicating that drier regions tend to have a higher relative contribution from extreme precipitation to some degree. Among the 16 stations with annual precipitation below 250 mm (Figure 3c), 68.75% of stations show a higher extreme precipitation contribution exceeding 30%, whereas all stations with annual precipitation above 250 mm exhibit a lower extreme contribution below 30%. The most striking case was recorded at MURGAB in 1916, where extreme precipitation accounted for 88.13% of the annual total, which was only 69.9 mm.
3.3 Monthly distribution of extreme precipitation across Pamir Plateau
Based on ERA5 reanalysis data, May is identified as the peak period for extreme precipitation over the Pamir Plateau (Zhao et al., 2025). Analysis of observational data (Figure 4a) reveals that extreme precipitation predominantly occurs from March to August, exhibiting significant spatiotemporal heterogeneity. At 53.6% of stations (15 sites), over 70% of extreme precipitation samples occur during March–August, and 5 of these stations exceed 80%. The station TAHTAMISHBEC in the southeastern plateau records the highest concentration at 93.33%, primarily in May (13.33%), July (26.67%), and August (33.33%). At 35.7% of stations (10 sites), the highest proportions occur in March–May and October–December, with samples from these two periods together accounting for over 72.3% of the total. Three stations (BULUN-KUL’, ALTYN-MAZAR, GULCA) display a relatively even monthly distribution, with extreme precipitation moderately concentrated during March-June.

Figure 4. Distribution of monthly extreme precipitation (a) and monthly distribution difference (b) across Pamir Plateau. (The difference is the bias between the total proportion of MAMJJA and MAMOND, separately).
According to Equation 1, the spatial distribution of differences in extreme precipitation contribution is shown in Figure 4b. Extreme precipitation events occur mainly in spring and winter in the western Pamir, and are concentrated in spring and summer in the Eastern Pamir. In particular, all stations in the northwestern Pamir Plateau—located within the foothill valley basins of the Fergana Basin, experience extreme precipitation primarily in the cold season (winter), for the other plateau-core stations, extreme precipitation occurs predominantly during the warm season (spring and summer).
3.4 Return period characteristics for extreme precipitation events in the Pamir Plateau
3.4.1 Determination of the optimal distribution function
The POT extreme precipitation series was fitted with different functions listed in Table 1 to evaluate the optimal function for the return period at each station. According to the K-S and A-D test results, the function with the smallest K-S and A-D statistic is considered optimal. The results are presented in Figure 5 and Table 3. Marked spatial differences are observed in the optimal distribution functions across the stations on the Pamir Plateau. Among the 28 stations, eight functions were selected as optimal. The Wakeby and Gen.Pareto functions covered the largest number of stations, with each applied to 10 stations. The rest eight stations are best represented by the Inv. Gaussian, Weibull, Burr, Gen. Logistic, Fatigue Life, and Pearson 6 functions.
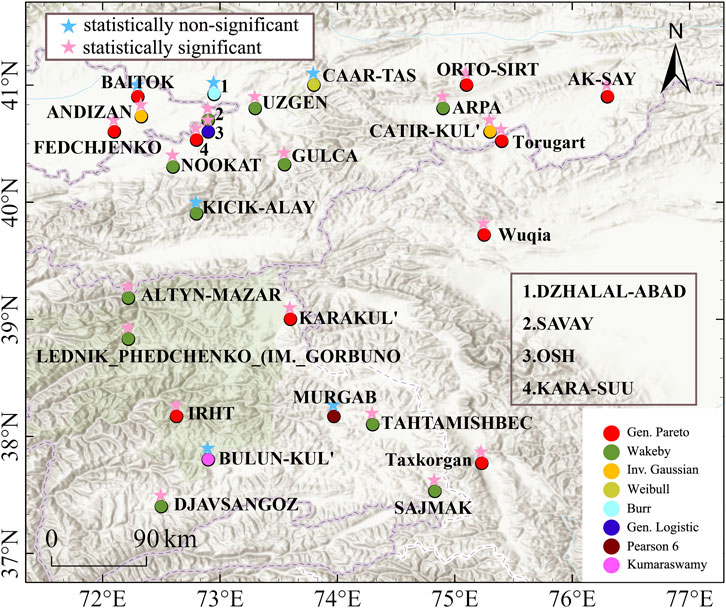
Figure 5. Optimal fitted distributions for return periods and K-S test results at stations across the Pamir plateau.

Table 3. The optimal fitting function and K-S and A-D test statistics value.
In the K-S and A-D goodness-of-fit test for the optimal distribution functions (Figure 5; Table 3), 22 out of the 28 observation stations passed the test at the 0.01 significance level, indicating that the selected distributions provide a reasonable fit to the extreme precipitation sequences at these stations. However, the optimal distributions for six stations (CAAR-TAS, DZHALAL-ABAD, KICIK-ALAY, MURGAB, BULUN-KUL’, and BAITOK) did not pass the K-S and A-D test at the 0.01 significance level. This may be due to complex precipitation mechanisms and strong local influences from topography and moisture sources at these locations. Consequently, the statistical characteristics of their extreme precipitation sequences—such as skewness, kurtosis, or tail behavior—are difficult to capture adequately with a single standard probability distribution. Taking CAAR-TAS as an example and referring to Figure 2b, this station is one of the wettest in the study area with a mean annual precipitation of 1031.6 mm (second only to LEDNIK* station at 1089.8 mm). It also exhibits a substantial difference between its maximum and minimum annual precipitation. Its unique high-precipitation background may lead to systematic differences between the shape of its probability distribution and that of general models. Therefore, return period estimates for these six stations may carry considerable uncertainty.
3.4.2 Estimation of return period precipitation
Based on the optimal function analysis, the estimated return period precipitation results are shown in Figure 6 and Table 4 (where T denotes the return period). The results indicate that longer return periods lead to greater disparities in precipitation amounts between stations, yet smaller differences in terms of magnitude categories. For a 2-year return period (Figure 6a), the maximum extreme precipitation on the Pamir Plateau was 34.9 mm (at NOOKAT station), and the minimum was 6.5 mm (at FEDCHJENKO station), with a difference of 28.4 mm between the two stations. When the return period increased to 100 years (Figure 6h), the maximum extreme precipitation reached 68.1 mm (at ALTYN-MAZAR station), while the minimum was 16.4 mm (at FEDCHJENKO station), resulting in a difference of 51.7 mm. The 10-year return period (Figure 6d) emerges as a critical threshold for a transition in extreme precipitation magnitude: At this return period, 50% of stations recorded precipitation between 6.1 and 24.0 mm, while the others recorded precipitation between 24.1 and 48.0 mm. For return periods shorter than 10 years (Figures 6a–c), precipitation was predominantly moderate to heavy rain (less than 24.0 mm). At return periods longer than 10 years (Figures 6e–h), even precipitation increased incrementally and was primarily concentrated between 24.1 and 48.0 mm across most stations, the overall distribution of magnitude categories remained relatively consistent and was dominated by torrential rain. Spatially, return period precipitation was relatively low in the southern Pamir Plateau and the remote mountainous areas of the Fergana Basin in the northwest Plateau, but was higher at a few scattered stations in the western region.

Figure 6. Spatial distribution of extreme precipitation under different return periods (T) at various stations on the Pamir Plateau (a) T=2a; (b) T=3a; (c) T=5a; (d) T=10a; (e) T=20a; (f) T=30a; (g) T=50a; (h) T=100a (Black circles (●) in FIGURE 6d indicate missing values).

Table 4. Return period precipitation estimates based on optimal functions.
The spatial distribution of extreme precipitation in the Pamir Plateau fundamentally reflects the influence of different climatic backgrounds and moisture supply mechanisms. The region exhibits a general “wetter in the west, drier in the east” pattern, controlled by the mid-latitude westerlies. Abundant moisture originating from the remote Atlantic is forced to uplift by the western slopes of the plateau, leading to enhanced precipitation in the western Pamir. In contrast, the southern regions and the Fergana Basin lie in the rain shadow on the leeward side, resulting in significantly reduced precipitation (Gao et al., 2022). The stations with high extreme precipitation values in the west are likely situated within topographic channels, which more effectively capture and amplify synoptic-scale disturbances (e.g., extratropical cyclones) embedded in the westerly flow. Differences in moisture sources are the fundamental cause of the spatial heterogeneity of extreme precipitation across the plateau. The western Pamir primarily relies on moisture from the Atlantic-European-African corridor, which contributes over 70% of the moisture during winter and spring (Mao et al., 2024). Driven by the zonal westerly flow, moisture from the Atlantic source region is transported directly to the western plateau (Mao et al., 2025). Although the eastern Pamir is influenced by moisture from the Indian Ocean, the atmospheric precipitable water in this region is inherently low (Guan, 2015). Even when monsoonal moisture occasionally intrudes northward during summer, its limited content fundamentally restricts the maximum intensity of extreme precipitation (Mao et al., 2024; Guan X, 2015).
In summary, the relatively high levels of extreme precipitation in the western Pamir stems from its direct exposure to the moisture-rich and dynamically active westerlies. Conversely, areas such as the southern Pamir and the Fergana Basin experience relatively low extreme precipitation due to their location in the rain shadow and constrained moisture supply.
3.4.3 Relationship between return period precipitation, elevation, and mean annual precipitation
Across different return periods, precipitation exhibited a weak relationship with altitude (Figure 7a). For the 2-year return period, the correlation coefficient between precipitation and altitude across the study stations on the Pamir Plateau was −0.08. For return periods ranging from 3 to 100 years, the correlation coefficient gradually decreased from 0.16 to −0.12, with none passing the significance test. Conversely, the relationship between return period precipitation and the station’s own mean annual precipitation is relatively strong (Figure 7b). As the return period gradually increases from 2 to 100 years, the correlation coefficient between mean annual precipitation and return period precipitation rose from −0.57 to −0.63, with all values passing the significance test at the 0.001 level. From the perspective of individual stations, those with lower mean annual precipitation tend to have return period precipitation that constitutes a larger proportion of their annual total (Figure 7b).

Figure 7. Stations on the Pamir Plateau: (a) Estimated precipitation under different return periods; (b) Proportion of return period precipitation relative to mean annual precipitation.
On the Pamir Plateau, for a 100-year return period, the estimated precipitation at 8 stations accounts for over 42% of their mean annual precipitation, with the maximum proportion reaching 67.8% (TAHTAMISHBEC station, mean annual precipitation is 68 mm). While annual precipitation at these stations is generally below 150 mm, not all arid stations exhibit such high proportions. For instance, three stations—BULUN-KUL’, SAJMAK, and DJAVSANGOZ—each with annual precipitation under 150 mm, have a maximum proportion of only 19.1%. Nevertheless, this pattern underscores the particular importance of extreme precipitation events at most stations with annual precipitation at or below 150 mm. Under 50–100 years return periods, a single extreme precipitation event can approach or even exceed half of the local mean annual precipitation. Adverse factors such as fragile ecosystems, limited soil water retention capacity make these areas highly susceptible to severe rainstorm-induced flooding (Yin et al., 2023). Establishing effective ecological adaptation strategies is therefore a critical challenge in these regions.
4 Discussion
Research on return periods of extreme precipitation in the Pamir Plateau is highly limited, primarily due to scarcity of observational data. Automatic weather stations help address the observational gaps, but their short data records are hindered by their brief history, limiting their value for return period analysis. High-quality proxy data represent a potential solution. To identify reliable proxy sources, we evaluated the applicability of GPCC, ERA5, and the satellite-terrain fused AERA5-Asia dataset (Ma et al., 2020) over the Pamir Plateau for the period 1982–2006.
Drawing on the evaluation methodology for reanalysis data established by Liu et al. (2022), we selected metrics including the Pearson correlation coefficient, root mean square error (RMSE) and other elements for data assessment. The spatial resolutions of ERA5, GPCC, and AERA5-Asia are 0.25° × 0.25°, 1° × 1°, and 0.1° × 0.1°, respectively. However, in comparison with observational data, the quality of these reanalysis data is almost inversely related to their spatial resolution (Figure 8): the AERA5-Asia merged data, with the highest resolution, exhibits the lowest correlation and largest bias, while the GPCC daily precipitation data, with the lowest resolution, shows the best overall correlation and smallest bias. The ERA5 data falls between these two. Among the three reanalysis datasets, GPCC demonstrates the relatively highest quality. Nevertheless, with its spatial resolution of only 1° × 1°, it is unable to capture the complex topoclimates of the Pamir Plateau or adequately represent the distribution of extreme precipitation.

Figure 8. Correlation coefficient (a) and RMSE (b) for different reanalysis datasets and observational data over the Pamir Plateau.
With the substantial increase in computational power and the rise of AI technologies, machine learning techniques such as Convolutional Neural Networks (CNNs), Random Forests, and the eXtended Long Short-Term Memory network (xLSTM) have demonstrated considerable potential for regional climate downscaling and bias correction (Xiang et al., 2025; Krizhevsky et al., 2017; Zhou et al., 2025). These methods can effectively learn the nonlinear relationships between precipitation and large-scale circulation patterns over complex terrain, thereby generating more reliable high-resolution climate fields. At the same time, significant upgrades in numerical forecasting systems (Lyu et al., 2022; To et al., 2024; Hua Z, et al., 2025) and continuous advancements in multi-source remote sensing data (Teng et al., 2024; Gu et al., 2024; Gascoin et al., 2024) jointly provide richer inputs and physical constraints for building data-driven models. These technological advances hold long-term benefits for improving data scarcity in high-mountain regions such as the Pamir Plateau. However, at the current research stage, limited on-site observational data remain the most direct and reliable foundation for conducting preliminary climate analysis in this region.
Like the Pamir Plateau, the Tibetan Plateau (TP) is also one of Asia’s major moisture barriers. Climate change on the TP exerts profound impacts on the climate regulation of Asia and even the Northern Hemisphere (Zhang et al., 2022; Ma et al., 2023). Both plateaus face the same core challenge in extreme precipitation analysis—the scarcity and heterogeneity of high-quality observational data—which inevitably leads to uncertainties and discrepancies in results (Sun et al., 2020; Ding et al., 2023). Evidence suggests a climatic connection between the two plateaus: spring warming over the TP can significantly enhance summer extreme precipitation in Central Asia, including the Pamir region (Ma et al., 2025). Therefore, research on the TP can provide an important reference for understanding extreme precipitation in the Pamir.
Spatially, while extreme precipitation decreases from southeast to northwest over the TP (Ding et al., 2023; Xiong et al., 2019), the Pamir Plateau, dominated by the westerlies, exhibits a more complex spatial pattern, contrasting sharply with the monsoon-dependent characteristics of the TP. In terms of long-term trends, significant increases in extreme precipitation have been observed in the western and central-western parts of the TP (Sun et al., 2020; Ding et al., 2025), which partially aligns with the findings of this study in the Pamir Plateau, suggesting a potential coordinated response of high-altitude regions to warming. However, the “dry-south and wet-north” pattern of extreme precipitation changes over the TP (Liu et al., 2024) indicates a highly regionalized response. Thus, the Pamir Plateau is not merely a simple western extension of the TP but a unique region with independent climatic drivers. Advances in extreme precipitation analysis over the TP have greatly benefited from the establishment of a robust observational network. Although both plateaus belong to the Asian mountain hydro-meteorological system, the characteristics of extreme precipitation in the Pamir and the TP show similarities yet distinct. Research findings from the TP offer only limited reference for understanding the Pamir. A deeper understanding of the complex extreme precipitation characteristics of the Pamir still requires the enhancement of localized observational networks and targeted research.
Across the entire study area, the MURGAB station in the central-southern Pamir Plateau has the longest valid observational record, spanning 80 years. Including this station, 39.3% (11 stations) have valid records of 50 years or longer, 21.4% of the stations have records between 30 and 50 years, and 39.3% have records shorter than 30 years. Consequently, estimates of extreme precipitation for the 100-year return period may be subject to considerable uncertainty. Estimating precipitation for return periods exceeding the available observational record—particularly at sites with shorter data spans, such as those with less than 30 years of observations but requiring 30-year or longer return period estimates—is inherently subject to uncertainty. For stations where the record length is shorter than the target return period, such extrapolated extreme precipitation values should be interpreted primarily as theoretical references.
Return period extreme value estimation entails certain uncertainties, primarily stemming from the statistical inference theory itself, limited sample size, and the complex spatiotemporal distribution of precipitation extremes (Jiang et al., 2017; Aalbers et al., 2025). The complex topography of the Pamir Plateau, resulting in highly uneven precipitation distribution, further aggravates the uncertainties in extreme value model selection and fitting. At the same time, the limited stations in this study inherently presents constraints such as sparse spatial coverage, uneven station distribution, and inconsistent temporal record lengths, all of which impose certain impacts on precipitation trend detection, distribution fitting, and return period precipitation estimation. Although this study, through the selection of an optimal fitting function, has achieved a certain degree of improvement in the reliability of the analytical results, the inherent uncertainties caused by the function itself, data distribution, and other factors remain unavoidable.
Notably, when estimating return period precipitation, even with the same optimal fitting function, stations with higher precipitation under shorter return periods might exhibit lower precipitation under longer return periods (e.g., ALTYN-MAZAR and NOOKAT stations). This may be caused by inherent statistical biases in the function itself, threshold selection, or parameter instability, rather than representing genuine physical climate characteristics. Alternatively, it might arise from spatial variations due to the unique extreme precipitation distribution characteristics of individual stations, which warrants further investigation.
5 Conclusion
Based on station observation data from the Pamir Plateau between 1936 and 2023, we analyzed the characteristics of POT-based extreme precipitation at each station across the region and estimated precipitation for return periods of 2, 3, 5, 10, 20, 30, 50, and 100 years. The conclusions are as follows:
1. At sites with annual precipitation below 150 mm, persistent drought coexist with increasing precipitation extremes, resulting in higher vulnerability to extreme rainfall. When return periods extends to 50–100 years, a single extreme precipitation event can approach or even exceed half of the local annual precipitation, significantly complicating water resource management and disaster response in these regions.
2. Extreme precipitation and annual precipitation trends are not fully synchronized, with 42.8% of stations showing opposite trends between the two variations. Spatially, areas with the lowest precipitation extremes are located in the southwestern plateau, while the highest values are concentrated in the driest northwestern Fergana Basin. Additionally, extreme precipitation at return periods exceeding 20 years exhibits the highest variability, with daily precipitation levels shifting noticeably from moderate-to-heavy rain to predominantly heavy rain, leading to a substantial increase in disaster risk. When the return period extends from 2 to 100 years, extreme precipitation amounts can increase by 2–3-folds, reaching a maximum of 68.1 mm.
3. Annual precipitation in the Pamir Plateau shows weak dependence on elevation. However, stations above 3,400 m record higher precipitation amounts. The observed maximum precipitation belt is higher than the previously recognized range of 2,000–3,500 m. The average contribution rate of extreme precipitation ranges from 24.0% (at LEDNIK* station) to 39.96%, which is significantly negatively correlated with annual precipitation. At stations with annual precipitation below 250 mm, over 68.75% of stations exhibit an extreme precipitation contribution rate greater than 30%.
The optimal fitting functions for extreme precipitation vary spatially across stations. The Wakeby and Gen.Pareto functions are identified as the most suitable for this region, each fitting for 36% of the stations, thereby offering more reliable tools for regional risk assessment. Using a single fitting function to estimate return period precipitation in the Pamir region may lead to significant deviations.
Data availability statement
The original contributions presented in the study are included in the article/supplementary material, further inquiries can be directed to the corresponding authors.
Author contributions
SL: Formal Analysis, Methodology, Writing – original draft, Writing – review and editing. JC: Methodology, Software, Writing – original draft, Investigation. HH: Software, Writing – original draft. HS: Data curation, Writing – original draft. XL: Visualization, Writing – original draft. TZ: Funding acquisition, Writing – original draft. JY: Supervision, Writing – original draft. WM: Supervision, Writing – original draft. MY: Data curation, Resources, Writing – original draft. LM: Data curation, Resources, Writing – original draft. DL: Data curation, Resources, Writing – original draft.
Funding
The author(s) declared that financial support was received for this work and/or its publication. This work was funded by National Key Research and Development Program of China (2023YFE0102700); Key R&D Program of Xinjiang Uygur Autonomous Region (2022B03021-1), National Natural Science Foundation of China (42171038); Natural Science Foundation of Xinjiang Uygur Autonomous Region (2022D01D86); Shanghai Cooperation Organization (SCO) Science and Technology Partnership and International S&T Cooperation Program (2023E01022); S&T Development Fund of CAMS (2021KJ034); and Scientific Research and Operational Fund of Xinjiang Meteorological Bureau (IDM2022002).
Acknowledgements
The authors acknowledge the Xinjiang Meteorological Information Center and the KNMI Climate Explorer for managing and providing station observation data.
Conflict of interest
The author(s) declared that this work was conducted in the absence of any commercial or financial relationships that could be construed as a potential conflict of interest.
Generative AI statement
The author(s) declared that generative AI was not used in the creation of this manuscript.
Any alternative text (alt text) provided alongside figures in this article has been generated by Frontiers with the support of artificial intelligence and reasonable efforts have been made to ensure accuracy, including review by the authors wherever possible. If you identify any issues, please contact us.
Publisher’s note
All claims expressed in this article are solely those of the authors and do not necessarily represent those of their affiliated organizations, or those of the publisher, the editors and the reviewers. Any product that may be evaluated in this article, or claim that may be made by its manufacturer, is not guaranteed or endorsed by the publisher.
References
Aalbers, E. E., Lenderink, G., van Meijgaard, E., de Vries, H., and van den Hurk, B. J. J. M. (2025). Uncertainty in projected precipitation change and its dependency on aggregation to the river-basin scale. J. Geophys. Res. Atmo. 130 (15), e2025JD043768. doi:10.1029/2025JD043768
Biancamaria, S., Lettenmaier, D. P., and Pavelsky, T. M. (2016). The SWOT mission and its capabilities for land hydrology. Surv. Geophys. 37 (02), 307–337. doi:10.1007/s10712-015-9346-y
Brunner, M. , I., Liechti, K., and Zappa, M. (2019). Extremeness of recent drought events in Switzerland: dependence on variable and return period choice. Nat. Hazards Earth Syst. Sci. 19 (10), 2311–2323. doi:10.5194/nhess-19-2311-2019
Chen, J., Mao, W., and Li, H. (2018). Analysis of intraseasonal variation of spring precipitation and its related circulation anomalies during recent 57 years in Parmirs, Southern Xinjiang, China. Desert Oasis Meteorol. 12 (5), 46–54. doi:10.12057/j.issn.1002-0799.2018.05.007
Chen, J., Yao, J., Dilinuer, T., Li, J., Li, S., Yang, L., et al. (2022). Central Asia daily extreme precipitation in observations and gridded datasets: a threshold criteria perspective. Front. Environ. Sci. 10, 1007365. doi:10.3389/fenvs.2022.1007365
Chen, P., Sun, B., Wang, H., and Yao, J. (2025). Opposite long-term trends in precipitation during spring and summer over the Pamir Plateau and influential factors. Atmos. Res. 323, 108169. doi:10.1016/j.atmosres.2025.108169
Ding, Z., Zhai, P., and Wu, R. (2023). Recent change in summer rainfall over the Tibetan Plateau: roles of anthropogenic forcing and internal variability. Clim. Dyn. 61 (3–4), 1887–1902. doi:10.1007/s00382-023-06661-6
Ding, Z., Ha, Y., Hu, Y., Zhu, Y., Dai, H., and Zhong, Z. (2025). Spatiotemporal characteristics of summer extreme precipitation over the Inner Tibetan Plateau in recent decades. Npj Clim. Atmos. Sci. 8, 193. doi:10.1038/s41612-025-01089-7
Duan, k., Xu, B., and Wu, G. (2015). Snow accumulation variability at altitude of 7010m a.s.l. in Muztag Ata Mountain in Pamir Plateau during 1958–2002. J. Hydrol. 531 (3), 912–918. doi:10.1016/j.jhydrol.2015.10.013
Gao, J., Zhao, Y., Yao, J. Q., and Wang, M. Y. (2022). Spatiotemporal evolution of atmospheric water cycle factors in arid regions of Central Asia under climate change. Arid Zone Res. 39 (05), 1371–1384. doi:10.13866/j.azr.2022.05.04
Gascoin, S., Luojus, K., Nagler, T., Lievens, H., Masiokas, M., Jonas, T., et al. (2024). Remote sensing of mountain snow from space: status and recommendations. Front. Earth Sci. 12, 1381323. doi:10.3389/feart.2024.1381323
Gu, F., Zhang, S., Zhang, Q., Li, D., Fu, Y., and Chen, X. (2024). The velocity extraction and feature analysis of glacier surface motion in the Gongar region based on multi-source remote sensing data. Front. Earth Sci. 12, 1413531. doi:10.3389/feart.2024.1413531
Guan, X. F. (2015). Characteristics of water vapor distribution and transport and their impacts in arid regions of central asia and china. Beijing, China: University of Chinese Academy of Sciences. Available online at: https://cc.cqvip.com/app/search/doc/degree/1872843058.
Gummadi, S., Samineni, S., and Lopez-Lavalle, L. A. B. (2025). Assessing high-resolution precipitation extremes in Central Asia: evaluation and future projections. Clim. Change 178 (02), 29. doi:10.1007/s10584-025-03872-0
Han, Y., Wang, Y., Ma, X., and Shang, Y. (2025). Glacier and snow cover dynamics and their affecting factors on the Pamir plateau section of the China. Pak. Econ. Corridor. Land 14 (4), 880. doi:10.3390/land14040880
Hu, Z., Zhou, Q., Chen, X., Qian, C., Wang, S., and Li, J. (2017). Variations and changes of annual precipitation in Central Asia over the last century. Int. J. Climatol. 37, 157–170. doi:10.1002/joc.4988
Hua, Z., Hakim, G., and Anderson-Frey, A. (2025). Performance of the Pangu-Weatherdeep learning model in forecastingtornadic environments. Geophys. Res. Lett. 52, e2024GL109611. doi:10.1029/2024GL109611Received
IPCC (2023). Climate change 2023: synthesis report: contribution of working groups I, II and III to the sixth assessment report of the intergovernmental panel on climate change. Cambridge and New York: Cambridge University Press.
Jiang, Y., Yin, Y., Chen, P., Sun, H., and Fan, J. (2017). Study on probabilistic characteristic and uncertainty in fitting of precipitation extremes over Xinjiang during 1961-2014. Adv. Clim. Change Res. 13 (1), 52–60. doi:10.12006/j.issn.1673-1719.2016.162
Krizhevsky, A., Sutskever, I., and Hinton, G. E. (2017). ImageNet classification with deep convolutional neural networks. Commun. ACM 60 (06), 84–90. doi:10.1145/3065386
Lai, S., Xie, Z., Bueh, C., and Gong, Y. (2020). Fidelity of the APHRODITE dataset in representing extreme precipitation over central Asia. Adv. Atmos. Sci. 37, 1405–1416. doi:10.1007/s00376-020-0098-3
Lei, H., Ma, Q., Chang, Y., Gu, Y., Wan, S., Zhu, Z., et al. (2024). Multiscale interactions driving summer extreme precipitation in central Asia. Geophys. Res. Lett. 51 (12), e2024GL108882. doi:10.1029/2024GL108882
Li, S., Chen, Y., Wei, W., Fang, G., and Duan, W. (2024). The increase in extreme precipitation and its proportion over global land. J. Hydrol. 628, 130456. doi:10.1016/j.jhydrol.2023.130456
Liu, J., Ma, Z., and Fan, G. (2012). Research on the comparison of different homogeneity test methods. Meteorol. Mon. 38 (9), 1121–1128. doi:10.7519/j.issn.1000-0526.2012.09.012
Liu, T., Zhu, X., Guo, R., and Xu, K. (2022). Applicability of ERA5 reanalysis of precipitation data in China. Arid. Land Geogr. 45 (01), 66–79. doi:10.12118/j.issn.1000-6060.2021.132
Liu, S., Zhou, T., Jiang, J., Zou, L., Zhang, L., Zhang, W., et al. (2024). Contributions of stationary and transient water vapor transports to the extreme precipitation changes over the Tibetan Plateau. JGR Atmos. 129 (22), e2024JD040966. doi:10.1029/2024JD040966
Lyu, Y., Zhu, S., Zhi, X., Dong, F., Zhu, C., Ji, L., et al. (2022). Subseasonal forecasts of precipitation over maritime continent in boreal summer and the sources of predictability. Front. Earth Sci. 10, 970791. doi:10.3389/feart.2022.970791
Ma, Z. Q., Xu, J. T., Zhu, S. Y., Yang, J., Tang, G. Q., Yang, Y. J., et al. (2020). AIMERG: a new Asian precipitation dataset (0.1°/half-hourly, 2000–2015) by calibrating the GPM-era IMERG at a daily scale using APHRODITE. Earth Syst. Sci. Data 12, 1525–1544. doi:10.5194/essd-12-1525-2020
Ma, Q., Zhang, J., Game, A. T., Chang, Y., and Li, S. (2020). Spatiotemporal variability of summer precipitation and precipitation extremes and associated largescale mechanisms in central Asia during 1979–2018. J. Hydrol. X 8, 100061. doi:10.1016/J.HYDROA.2020.100061
Ma, Q., Lei, H., Feng, T., Hu, R., Niu, M., Hu, Z., et al. (2023). Impact of spring Tibetan Plateau snow cover on extreme precipitation in Pakistan in July and August 2022. Atmos. Res. 295, 107007. doi:10.1016/j.atmosres.2023.107007
Ma, Q., Zhang, L., Hu, R., Wu, H., Yan, P., Chang, Y., et al. (2025). Intensified Tibetan Plateau spring warming exacerbate summer extreme precipitation in central Asia since the 2000s. JGR Atmos. 130 (12), e2024JD043074. doi:10.1029/2024JD043074
Mao, X., Xing, L., Shang, W., Li, S., and Duan, K. (2024). Moisture sources for precipitation over the Pamirs Plateau in winter and spring. Q. J. R. Meteorol. Soc. 150 (759), 820–833. doi:10.1002/qj.4624
Mao, X., Xing, L., Shang, W., and Duan, K. (2025). Impact of sea-land thermal contrast along the silk road on spring precipitation over Pamirs Plateau. Clim. Dyn. 63 (01), 28. doi:10.1007/s00382-024-07508-4
Muhammad, N. S., Julien, P. Y., and Salas, J. D. (2016). Probability structure and return period of multiday monsoon rainfall. J. Hydrol. Eng. 21 (01), 04015048. doi:10.1061/(ASCE)HE.1943-5584.0001253
Opała-Owczarek, M., and Niedźwiedź, T. (2019). Last 1100 yr of precipitation variability in western central Asia as revealed by tree-ring data from the Pamir-Alay. Quat. Res. 91 (1), 81–95. doi:10.1017/qua.2018.21
Peres, D. J., and Cancelliere, A. (2016). Estimating return period of landslide triggering by Monte Carlo simulation. J. Hydrol. 541, 541256–541271. doi:10.1016/j.jhydrol.2016.03.036
Stein, L., Clark, M. P., Knoben, W. J. M., Pianosi, F., and Woods, R. A. (2021). How do climate and catchment attributes influence flood generating processes? A large-sample study for 671 catchments across the contiguous USA. Water Resour. Res. 57 (4), e2020WR028300. doi:10.1029/2020WR028300
Sun, J., Yang, K., Guo, W., Wang, Y., He, J., and Lu, H. (2020). Why has the inner Tibetan Plateau become wetter since the mid-1990s? J. Clim. 33 (19), 8507–8522. doi:10.1175/JCLI-D-19-0471.1
Sun, Q., Zhang, X., Zwiers, F., Westra, S., and Alexander, L. V. (2021). A global, continental, and regional analysis of changes in extreme precipitation. J. Clim. 34 (01), 243–258. doi:10.1175/JCLI-D-19-0892.1
Teng, Q., Luo, L., Li, S., Xing, L., Shao, K., Wang, S., et al. (2024). A framework for flood inundation extraction based on microwave and optical remote sensing images. Front. Earth Sci. 12, 1511834. doi:10.3389/feart.2024.1511834
To, D., Quinting, J., Hoshyaripour, G. A., Goetz, M., Streit, A., and Debus, C. (2024). Architectural insights into and training methodology optimization of Pangu-Weather. Geosci. Model Dev. 17 (23), 8873–8884. doi:10.5194/gmd-17-8873-2024
Tsunetaka, H. (2021). Comparison of the return period for landslide-triggering rainfall events in Japan based on standardization of the rainfall period. Earth Surf. Process. Landforms 46 (14), 2984–2998. doi:10.1002/esp.5228
Wang, X. (2016). The impact of climate change on the water cycle in the pamir plateau-karakoram-kunlun mountains snow and ice basin. Beijing, China: University of Chinese Academy of Sciences. Available online at: https://cc.cqvip.com/app/search/doc/degree/1873260344.
Wang, J., Chen, F., Jin, L., and Bai, H. (2010). Characteristics of the dry/wet trend over arid central Asia over the past 100 years. Clim. Res. 41, 51–59. doi:10.3354/cr00837
Wang, Q., Yi, S., and Sun, W. (2017). Precipitation-driven glacier changes in the Pamir and Hindu Kush mountains. Geophys. Res. Lett. 44 (06), 2817–2824. doi:10.1002/2017GL072646
Wang, Z., Wen, X., Lei, X., Tan, Q., Fang, G., and Zhang, X. (2020b). Effects of different statistical distribution and threshold criteria in extreme precipitation modelling over global land areas. Int. J. Climatol. 40, 1838–1850. doi:10.1002/joc.6305
Wang, L., Niu, H., Chen, R., Sun, W., Huai, B., Han, C., et al. (2023). Different maximum precipitation altitudes and precipitation gradient characteristics of different basins in the Third Pole region. J. Hydrol. 626, 130343. doi:10.1016/j.jhydrol.2023.130343
Wang, X., Xia, J., Dong, B., Li, Q., and Zhang, X. (2024). Hydrodynamics-based assessment of flood losses in an urban district under changing environments. Nat. Hazards 120 (15), 14755–14783. doi:10.1007/s11069-024-06792-x
Wei, W., Zou, S., Duan, W., Chen, Y., Li, S., and Zhou, Y. (2023). Spatiotemporal variability in extreme precipitation and associated large-scale climate mechanisms in Central Asia from 1950 to 2019. J. Hydrol. 620, 129417. doi:10.1016/j.jhydrol.2023.129417
Weinthal, E., and Sowers, J. (2020). The water-energy nexus in the Middle East: infrastructure, development, and conflict. WIREs Water 7 (4), e1437. doi:10.1002/wat2.1437
Xiang, X., Li, Y., Wu, X., Liu, Z., Wu, L., Wu, B., et al. (2025). Future variation and uncertainty source decomposition in deep learning bias-corrected CMIP6 global extreme precipitation historical simulation. Front. Earth Sci. 13. doi:10.3389/feart.2025.1601615
Xiong, J., Yong, Z., Wang, Z., Cheng, W., Li, Y., Zhang, H., et al. (2019). Spatial and temporal patterns of the extreme precipitation across the Tibetan Plateau (1986–2015). Water 11 (7), 1453. doi:10.3390/w11071453
Yan, J., and Zhao, Y. (2022). Spatial evolution characteristics of precipitation and air temperature over central Asia. J. Chengdu Univ. Inf. Technol. 37 (05), 592–600. doi:10.16836/j.cnki.jcuit.2022.05.016
Yao, J., and Chen, Y. (2015). Trend analysis of temperature and precipitation in the Syr Darya Basin in Central Asia. Theor. Appl. Climatol. 120, 521–531. doi:10.1007/s00704-014-1187-y
Yao, J., Chen, Y., Chen, J., Zhao, Y., Tuoliewubieke, D., Li, J., et al. (2021). Intensification of extreme precipitation in arid Central Asia. J. Hydrology 598, 125760. doi:10.1016/j.jhydrol.2020.125760
Yin, J., Gao, Y., Chen, R., Yu, D., Wilby, R., Wright, N., et al. (2023). Flash floods: why are more of them devastating the world’s driest regions? Nature 615, 212–215. doi:10.1038/d41586-023-00626-9
Zhang, Q. (2021). Characteristics of precipitation in the Pamirs in 2017 based on WRF simulation. Arid. Land Geogr. 44 (06), 1707–1716. doi:10.12118/j.issn.1000-6060.2021.06.19
Zhang, M., Chen, Y., Shen, Y., and Li, Y. (2017). Changes of precipitation extremes in arid Central Asia. Quat. Int. 436, 43616–43627. doi:10.1016/j.quaint.2016.12.024
Zhang, H., Zhang, J., Fang, H., and Yang, F. (2022). Urban flooding response to rainstorm scenarios under different return period types. Sustain. Cities Soc. 87, 104184. doi:10.1016/j.scs.2022.104184
Zhang, S., Meng, L., Zhao, Y., Yang, X., and Huang, A. (2022). The influence of the Tibetan Plateau monsoon on summer precipitation in central Asia. Front. Earth Sci. 10, 771104. doi:10.3389/feart.2022.771104
Zhao, W., Ma, Y., Takemi, T., Chen, X., and Cao, D. (2025). Investigating the underlying mechanisms of monsoon season heavy precipitation in Central Asian high Mountain areas. J. Clim. 38 (01), 277–292. doi:10.1175/JCLI-D-24-0041.1
Zheng, Y. (2023). Remote sensing monitoring of glacier elevation changes and analysis of spatio-temporal variation of mass balance in a typical Asian alpine region. Henan Polytechnic University. Available online at: https://cc.cqvip.com/app/search/doc/degree/3463052926.
Zhou, J., Jiang, J., Wang, Y., Bai, W., Wang, F., Chen, L., et al. (2025). Urban road collapse risk assessment based on the extended xLSTM network. J. Saf. Sci. Resil. 6 (04), 100205. doi:10.1016/j.jnlssr.2024.10.005
Zou, S., Abuduwaili, J., Duan, W., Ding, J., De, M., Van De Voorde, T., et al. (2021). Attribution of changes in the trend and temporal non-uniformity of extreme precipitation events in Central Asia. Sci. Rep. 11 (01), 15032. doi:10.1038/s41598-021-94486-w
Keywords: extreme precipitation, flood risks, optimal fitting function, Pamir Plateau, precipitation estimation, return periods
Citation: Li S, Chen J, Huo H, Shang H, Lu X, Zhang T, Yao J, Mao W, Yao M, Ma L and Tuoliewubieke D (2026) Characteristics of extreme precipitation and precipitation estimation under different return periods in the Pamir Plateau. Front. Earth Sci. 13:1694635. doi: 10.3389/feart.2025.1694635
Received: 28 August 2025; Accepted: 15 December 2025;
Published: 20 January 2026.
Edited by:
Chenghai Wang, Lanzhou University, ChinaCopyright © 2026 Li, Chen, Huo, Shang, Lu, Zhang, Yao, Mao, Yao, Ma and Tuoliewubieke. This is an open-access article distributed under the terms of the Creative Commons Attribution License (CC BY). The use, distribution or reproduction in other forums is permitted, provided the original author(s) and the copyright owner(s) are credited and that the original publication in this journal is cited, in accordance with accepted academic practice. No use, distribution or reproduction is permitted which does not comply with these terms.
*Correspondence: Shujuan Li, bGlzakBpZG0uY24=; Jing Chen, Y2hlbmppbmdAaWRtLmNu