 Jun Jia1,2
 Xiaopeng Guo
- 1State Key Laboratory of Geohazard Prevention and Geoenvironment Protection, Chengdu University of Technology, Chengdu, China
- 2Key Laboratory for Geo-Hazard in Loess Area MNR, Xi’an Center of China Geological Survey, Xi’an, China
In the Loess Plateau, extreme rainfall events frequently trigger instability in loess cut-slopes with weak structures. Nevertheless, the deformation and failure characteristics of terraced loess cut-slopes with cracks under extreme rainfalls remain insufficiently studied and poorly understood. This paper presents the centrifuge model test on the deformation and failure behaviors of the terraced loess slope under intermittent rainfall conditions. The terraced loess slope, featuring two berms and a prefabricated crack along its crest, was initially subjected to loading up to 50 g before undergoing intermittent rainfalls. The deformation and failure processes of the slope were monitored using laser displacement meters and a high-resolution digital camera mounted. Furthermore, comprehensive monitoring and analysis were conducted on the slope’s mechanical-hydrological responses, including variations of earth pressure and volumetric water content. Finally, numerical modellings using the hybrid finite-discrete element method were performed to extensively explore the effect of crack on the physical and mechanical responses to rainfall. The experimental and numerical results indicate that the slope failure process exhibits distinct evolutionary characteristics under rainfall conditions. Rainfall infiltration triggers the phased responses. Early-stage rainfall causes upper slope erosion with subsequent sediment deposition in lower sections. As rainfall continues, erosion focus shifts downward while upper slope erosion persists. Progressive infiltration leads to soil structure weakening, evidenced by reduced stress concentration and inward migration of the maximum shear stress zone. This process is accelerated by pre-existing cracks that establish preferential infiltration pathways. Notably, while increasing rainfall intensity and frequency exacerbate erosion (manifested as gully widening and deepening) and earth pressure fluctuations, the spatial distribution of erosion remains constrained by preformed cracks, particularly in controlling gully initiation points at the slope top. The findings can provide a basis for assessing the stability of fissured loess slopes and forecasting the potential for rainfall-triggered loess landslides.
1 Introduction
The Loess Plateau is the world’s largest loess sedimentary area, covering an area of approximately 640,000 km2. Loess is characterized by a large-pore skeleton structure, abundant carbonates, vertical joints, water sensitivity and collapsibility. It is widely distributed in the northwest of China, particularly in the Loess Plateau (Peng et al., 2019). With the implementation of a series of construction projects, the urbanization of China’s Loess Plateau has further developed rapidly (Zhang et al., 2022; Tang et al., 2024). While these projects have spurred regional development, they have also generated extensive terraced cut-slopes. Due to the formative environmental conditions and excavation-induced unloading effects, these slopes contain cracks of varying scales (Ren et al., 2025). The tension cracks, developed on the slope top and near the slope shoulder where tensile stress is concentrated, are highly susceptible to rainwater infiltration, triggering the deformation and failure of loess slopes.
Rainfall is widely recognized as a primary factor inducing the landslides in the loess regions (Chen et al., 2020). Especially in recent years, with the emergence of extreme weather conditions, extreme rainfall has been frequent, exacerbating loess landslide occurrences (Lin et al., 2024). For example, a loess landslide occurred on 17 September 2011 in Xi’an, causing 32 deaths (Zhuang and Peng, 2014). A giant loess landslide induced by heavy rainfall on 1 September 2022 in Qinghai Province, Northwest China, resulting in 7 fatalities (Zhang et al., 2023). In the past few decades, numerous studies have explored loess landslide failure mechanisms under rainfall using laboratory model tests, field experiments, and numerical modellings (Tu et al., 2009; Wang et al., 2014; Peng et al., 2015; Tang et al., 2015; Li et al., 2016; Wu et al., 2017; Chen et al., 2018; Wang et al., 2019; Zhang et al., 2019; Sun et al., 2019; Sun et al., 2021; Zhang et al., 2020; Chang W. et al., 2021; Wang et al., 2022; Guo et al., 2023; Lu et al., 2023; Zhen et al., 2023; Zhu et al., 2024). Among the above methods, laboratory model tests are the most commonly applied approach. Some of researches investigated the mechanical and hydrological responses of loess slopes under heavy rainfall through performing reduced-scale model tests (Wu et al., 2017; Zhang et al., 2019; Chang Z. et al., 2021; Guo et al., 2023; Zhen et al., 2023; Jia et al., 2024; Leng et al., 2024). Previous studies reveal that cracks/fissures have a significant effect on the failure of loess slopes (Zhu et al., 2024). The influence of cracks/fissures on the loess collapse and mechanical characteristics was studied by performing triaxial shear tests, uniaxial compression tests and tensile tests (Sun et al., 2016; Xu et al., 2022; Xu et al., 2023; Liu et al., 2025). In addition to experiments on loess samples, few studies have been conducted on fissured loess slope models to assess the effect of crack on the failure mechanisms of slopes via model tests or numerical modellings (Jiang et al., 2023). For instance, Sun et al. (2019) investigated the deformation and failure process of loess slopes with and without the vertical crack under different rainfall patterns by performing physical model experiments, and reported that the vertical joint affected the integrity of the slope and accelerated its deformation during rainfall. Chang W. et al. (2021) investigated the effect of tension fissure on loess slope instability mechanism and failure evolution process under the condition of surface water infiltration and seismic action using PFC3D discrete element software. The numerical results show that the instability process of the loess slope under water infiltration into the fissure can be divided into subsidence, extrusion, failure, and stability stages. Ren et al. (2025) conducted reduced-scale model tests on loess slopes with vertical crest tension crack under extreme rainfall conditions, and found that tension cracks at the slope crest significantly affects the infiltration speed of the wetting front during extreme rainfall.
Compared to 1 g reduced-scale model tests, centrifuge model tests simultaneously achieve prototype gravity conditions and accurately replicates deformation/settlement characteristics within significantly reduced timeframes. Therefore, centrifuge testing represents the most reliable approach for simulating slope deformation and failure under true stress-field conditions. Based on centrifuge model tests, Cheng et al. (2021) explored the effect of fissures on linear loess slope stability by monitoring the displacement and internal earth pressure of loess slope during acceleration loading. They demonstrated that the fissures alter slope integrity and stress distribution, facilitate water infiltration, and critically compromise slope stability. However, up to now, the deformation and failure behaviors of terraced loess slope under intermittent extreme rainfall conditions remain poorly understood. Consequently, centrifuge model tests are required to be carried out to reveal the mechanical and hydrological responses and failure mechanisms of terraced loess slopes under extreme rainfall.
In the present study, centrifuge model test was conducted to investigate the deformation and failure behaviors of the terraced loess slopes under intermittent rainfall with different intensities. The deformation of the slope surface was monitored by laser displacement meters during testing. A series of images concerning the deformation and failure of the loess slope were recorded by a digital camera installed on the top of the test box. Moreover, the variations of earth pressures and volumetric water contents during loading and rainfall were monitored by the sensors embedded inside the slope. In addition, numerical simulations using the hybrid finite-discrete element method were performed to thoroughly investigate the effect of crack on the physical and mechanical responses to rainfall. The findings obtained from the current study can provide the references for scholars to evaluate the stability of terraced loess slopes with cracks, and to better understand the failure characteristics of terraced loess slopes under intermittent heavy rainfall.
2 Experimental methodology
2.1 Test apparatus
Artificial rainfall model tests were conducted on a terraced loess slope using the TLJ-500 geotechnical centrifuge at the State Key Laboratory of Geohazard Prevention and Geoenvironment Protection in Chengdu University of Technology. The TLJ-500 is a high-capacity centrifuge with an effective rotation radius of 4.5 m, capable of generating a maximum centrifugal acceleration of 250 g and supporting a maximum capacity of 500 g t, making it suitable for large-scale geotechnical simulations.
A rigid test box with internal dimensions of 1,200 mm (length) × 1,000 mm (width) × 800 mm (height) was used to construct the slope model. One side of the box was made of transparent Plexiglass, allowing for real-time observation of soil deformation, water infiltration, and failure process during the test. The box was securely mounted inside the centrifuge to ensure stability under high centrifugal forces. Figure 1 illustrates the rainfall system configuration and test box arrangement within the centrifuge.
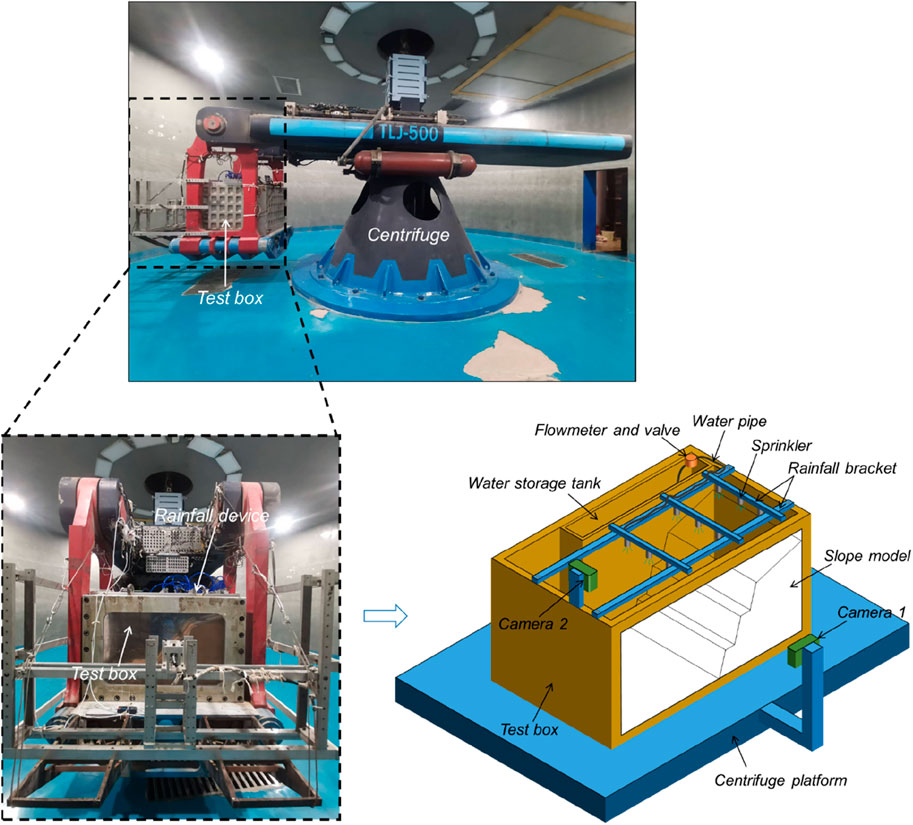
Figure 1. Centrifuge model test apparatus.
The rainfall system was designed to simulate natural precipitation under controlled conditions. The system consists of the following key components: (1) Water storage tank: Supplies water to the system at a regulated flow rate; (2) Rainfall nozzles (9 spray heads): Generates raindrops with controlled intensity and distribution; (3) Submersible pump: Delivers water from the storage tank to the rainfall nozzles; (4) Rainfall bracket: Positioned above the test box to maintain stability during centrifugation; (5) Water pipeline and diverter: Ensures uniform water distribution across multiple nozzles; (6) Radar level meter: Monitors water levels and rainfall accumulation in real time. The rainfall system was wirelessly controlled, allowing for precise adjustments during the experiment. The effective rainfall coverage area was 1.0 m × 0.85 m, ensuring uniform application across the slope model.
2.2 Test material
The Malan loess samples employed in this study were obtained from a loess slope located in Mizhi County, Yulin City, Shaanxi Province. During sampling, each loess sample bag was sealed with plastic wrap to minimize moisture loss. Throughout the experiments, the temperature in the centrifuge room was maintained consistent with the field sampling temperature using air conditioning. To thoroughly characterize the material properties, an extensive suite of laboratory tests was performed to evaluate both the physical and mechanical characteristics of the loess. The experimental program included determinations of: natural moisture content, bulk density, specific gravity, maximum dry density, grain size distribution (as shown in Figure 2), Atterberg limits (comprising liquid limit and plastic limit), plasticity index, liquidity index, hydraulic conductivity, compression modulus, and shear strength parameters. Additionally, the soil-water characteristic curve (SWCC) of the loess was established through the transient water release and imbibition method, with the results presented in Figure 3. A comprehensive summary of the fundamental physical and mechanical properties of the investigated loess is provided in Table 1.
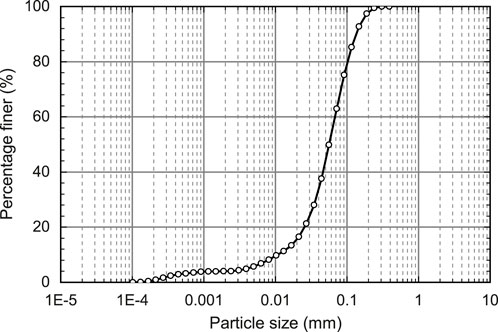
Figure 2. Particle size distribution of the loess.
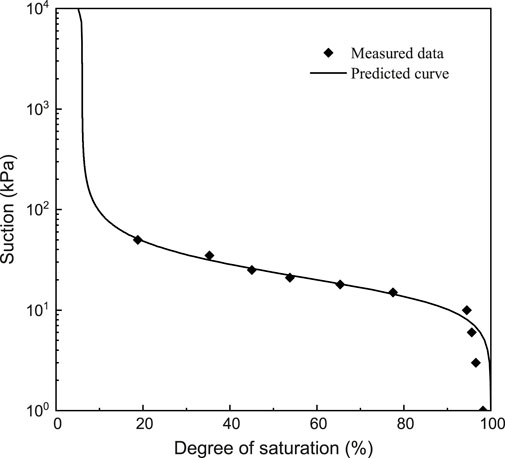
Figure 3. Soil-water retention behavior of the tested loess.

Table 1. Properties of the loess.
2.3 Test scheme and monitoring arrangement
In the current study, the mechanical response characteristics of loess slopes, and the deformation-failure evolution process were systematically investigated by carrying out the centrifuge modeling test of loess slopes under the action of heavy rainfall. The experimental design used intermittent heavy rainfall conditions under different rainfall intensities, with the rainfall intensity increasing from 5.3 mm/h to 12.6 mm/h step by step, and the rainfall cycling three times at each level of rainfall intensity (see Figure 4). The duration of a single rainfall is 14 h, and 86.5-h interval is set at the end of each rainfall. Therefore, a total of 15 rainfall events were applied to the loess slope. The intensity and duration of the rainfall were selected to represent the realistic severe prototype storm event, in compliance with the scaling laws governing centrifuge modeling. This rainfall level was chosen both because it falls within the range of historically recorded extreme rainfall events and because of the constraints imposed by the experimental setup, which has a minimum achievable rainfall intensity of 5.3 mm/h.
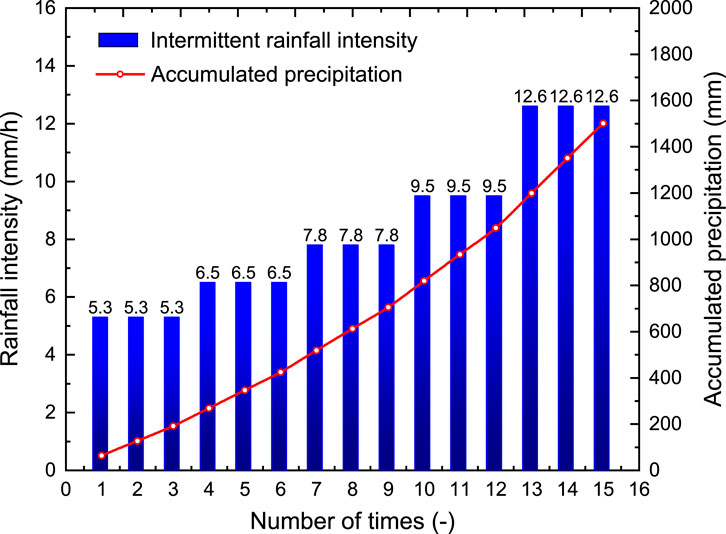
Figure 4. Relationship of rainfall intensity and number of times.
As shown in 5, the modeled slope is designed as a terraced structure with overall dimensions of 1,000 mm (length) × 850 mm (width) × 527 mm (height) and a 60 mm thick foundation soil layer at the bottom. The main body of the slope consists of three secondary slopes, each with a height of 140 mm, a berm width of 50 mm, and a slope angle of 60°. A prefabricated crack was constructed at the top of the slope model, and the crack were 40 mm in depth and 4 mm in width to simulate the characteristics of crack development in natural slopes. By setting the crack condition, it can systematically reveal the influence law of structural features on slope stability. The determination of model size and crack parameters is based on the principle of similarity ratio to ensure that the test results can reflect the mechanical behavior characteristics of the prototype slope. The centrifugal model test was designed based on a geological prototype of a loess cut slope along a highway in Qingjian County, Yulin City, Shaanxi Province. A scaled indoor model was constructed using data obtained from field surveys and UAV aerial mapping. The prototype slope features a three-tiered stepped structure, with a total height of approximately 18 m (each tier being 5–7 m high) and berm measuring 2–3 m in width. Geological field investigations revealed that, under years of intermittent rainfall, erosion features such as gullies and sinkholes progressively developed on the slope. These eventually led to a landslide during rainy season in 2023.
The centrifugal acceleration in the model test is set as N = 50 g, and according to the similarity theory, it is known that the geometric similarity ratio Cl=N=50. Table 2 lists the similarity ratios in the centrifuge model test. From Table 2, it can be seen that each level of the prototype slope is 7 m high, the width of berm is 2.5 m, and the total height of the slope is about 26.35 m. The rainfall intensity in the centrifugal machine is 265–630 mm/h, and the time of each rainfall is 20.2 s. After the rainfall is over, the slope model continues to run for 124.6 s under the condition of 50 g and then rainfall is applied again.
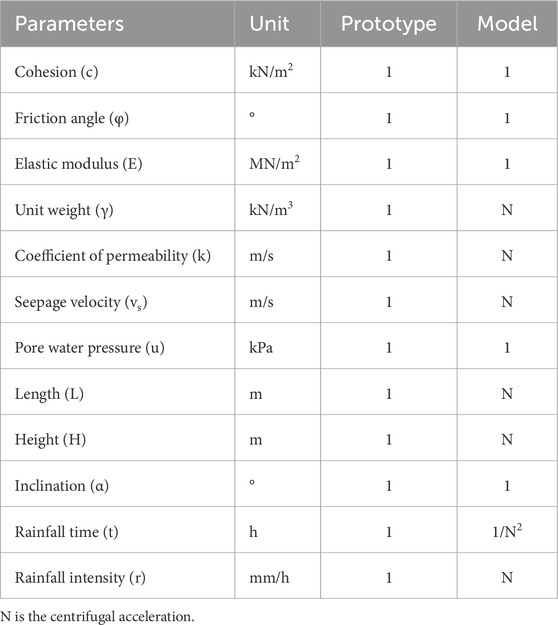
Table 2. Scale ratios in centrifuge model tests.
In order to comprehensively capture the mechanical response and deformation evolution characteristics of loess slope under the action of heavy rainfall, this study adopts a multi-sensor collaborative monitoring system, including earth pressure, water content and displacement. Soil pressure monitoring: 5 earth pressure sensors are buried in the key locations of the slope (such as the toe of the slope, the middle of the slope, the top of the slope, etc.) to record the changes of the internal stress of the soil body during loading and rainfall. Water content monitoring: 5 volumetric water content sensors are arranged in layers along the depth direction of the slope to monitor the temporal and spatial distribution characteristics of water content during rainwater infiltration. Displacement monitoring: 3 laser displacement meters are aligned at the top and berms of the slope to measure the surface deformation of the slope during loading and rainfall. In order to visually record the macro deformation and damage process of the slope, the test adopts a camera synchronized observation scheme: a camera (downward angle) is installed on the top of the model box, focusing on the monitoring of the top of the slope settlement, the slope surface local collapse and the overall damage situation.
All sensor data are recorded in real time through a high-speed acquisition system, and the sampling frequency is set according to the test requirements to ensure the accurate capture of the dynamic process. At the same time, the camera shooting and sensor data acquisition adopt time synchronization control, which is convenient for subsequent data fusion analysis. Figure 5 shows the detailed arrangement of the sensor program.
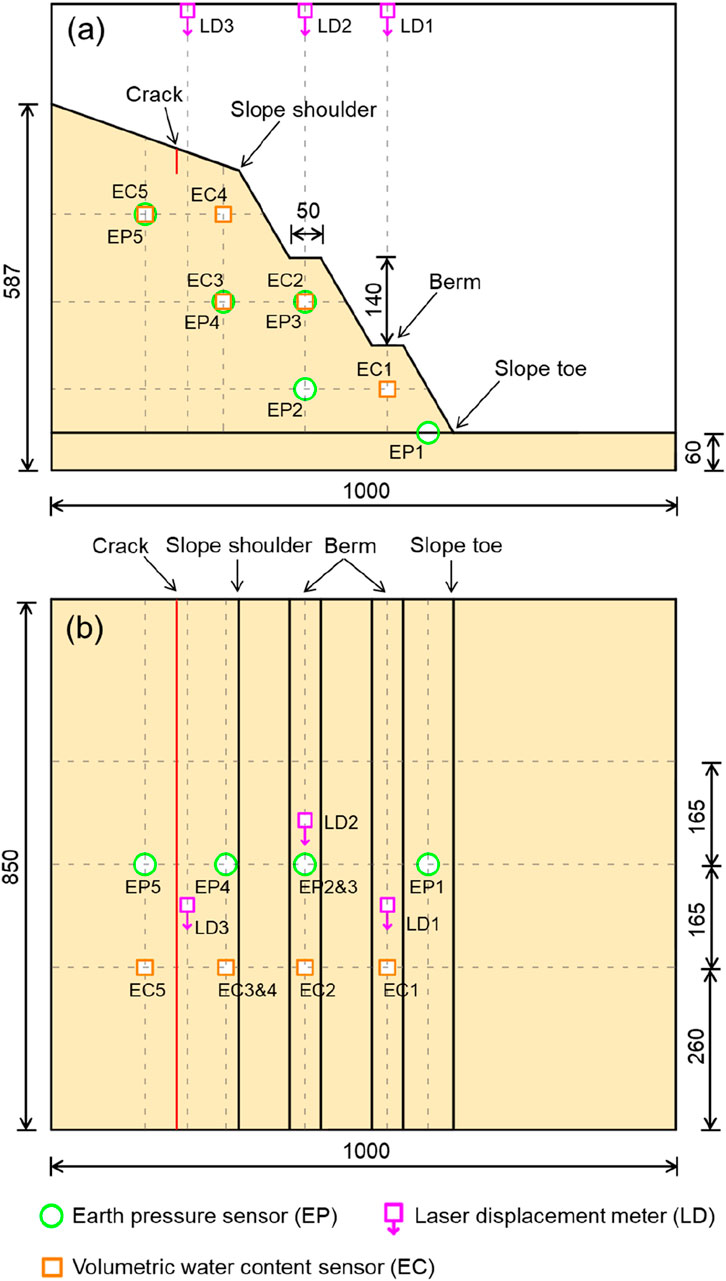
Figure 5. Layout of the monitoring sensors: (a) side view and (b) plan view.
2.4 Model construction and testing procedure
The construction process of the terraced loess slope model is divided into four parts:
1. Pre-preparation work. Before filling the slope, a soft tape is pasted on the inner wall of the model box at certain distance intervals in order to measure and control the height of the slope soil during the filling process, and in addition, petroleum jelly is also coated on the inner wall in order to reduce the frictional resistance between the soil and the side wall of the test box.
2. Filling soil. Weigh a certain mass of loess, and then spread it in the model box, scrape the surface of the soil with a scraper, and then use a tamper to tamp the filling soil. Measure each layer of filled soil after tamping to ensure that a uniform degree of compactness is achieved. To ensure that the laboratory loess accurately represents in-situ conditions, both the moisture content and compactness of the soil were strictly controlled throughout the experiment.
3. Sensor arrangement. After the thickness of the fill soil reaches a predetermined height, the deployment of the sensors begins. First of all, use the foundation soil scraper to scrape the soil surface flat and supplemented by a level measuring tape to ensure the level of the foundation surface, and then arrange the sensors, the use of leveling bubbles to ensure that the measurement direction of the sensor is accurate.
4. Slope excavation and leveling. Repeat the above (2) and (3) steps until the total height of the slope reaches 587 mm, at which time the filling process of the slope model is completed. After the filling is completed, the slope is excavated with scrapers at a graded level (three-stage slope), and then the surface of the excavated slope is repaired and leveled. After that, the surface was covered with plastic film and maintained for 24 h.
5. Crack construction. After steps (1), (2), (3) and (4) are completed, a crack parallel to the direction of the slope is excavated with a tool knife on the leveled slope surface, and then medium-coarse sand is filled into the crack to facilitate the infiltration of rainwater and to prevent the soil around the crack from collapsing. After that, the surface was covered with plastic film and maintained for 24 h.
This is the whole process of slope modeling and sensor placement, followed by the connection and testing of the monitoring equipment. In addition, the laser displacement meter needs to be fixed to the designed position of the rainfall support. Connect the wires of all sensors to the data acquisition system, and then detect whether the sensors work properly through the control software on the screen. One digital camera was set up on the top of the model box, after which it was connected to the control system. Figure 6 presents the construction process of the terraced loess slope model.
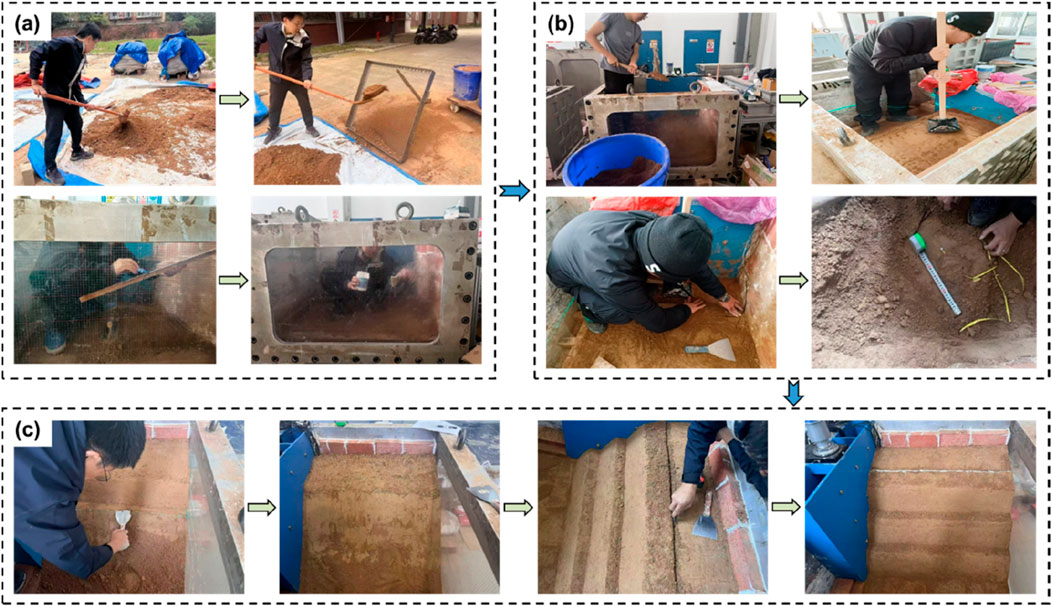
Figure 6. Construction process of the terraced loess slope model: (a) Preparation of soil and model box, (b) Filling soil and sensor arrangement, and (c) Slope excavation and crack construction.
Before applying rainfall, according to the rainfall conditions designed for the test, set the collection interval (1s) and the corresponding rainfall intensity and duration of the data acquisition instrument through the control software. After the parameters were configured, the centrifuge was started, loaded step by step to the target acceleration of 50 g, and operated stably for 5 min, so that the internal stresses of the slope model reached the equilibrium state. Subsequently, the rainfall equipment was activated to apply simulated rainfall lasting 20.2 s to the slope model. After completing the scheduled rainfall, the 50 g centrifugal force was continued for 124.6 s to observe the deformation response of the slope. If the slope did not show any obvious damage, the rainfall was applied cyclically until the overall destabilization damage of the slope occurred. Figure 7 shows the acceleration-time curve of the centrifuge model test.
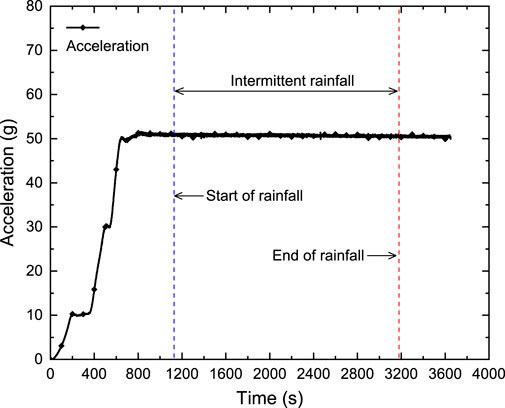
Figure 7. Curve of centrifugal acceleration versus time.
3 Model test results and analyses
Based on the images captured by the digital camera and monitored data obtained by the sensors, the mechanical and hydrological behaviors of the terraced loess slope in response to the intermittent heavy rainfall were analyzed and discussed.
3.1 Deformation and failure characteristics of terraced loess slope
Slope exhibits different states under different external conditions. Figure 8 shows the terraced loess slope at initial state, acceleration of 50 g, and final state after intermittent heavy rainfall. It should be noted that the three red points on the slope surface in the figure are the measurement points of the laser displacement sensors. During the gradual acceleration of the model slope from 0 g to 50 g, the slope primarily undergoes vertical consolidation settlement. This occurs because the increase in acceleration leads to greater soil self-weight and intensified particle movement, resulting in reduced pore space and overall volume compression. The stress concentration occurs at the toe of each sublevel of the slope, especially at the bottommost toe, where the slope surface peels off. Moreover, multiple tension cracks have appeared at the top of the slope and various berms, and the prefabricated cracks at the top of the slope have expanded. After experiencing multiple rainfall events with different rainfall intensities, the slope underwent significant deformation and damage, with severe erosion from slope top to slope toe. Several gullies of varying depths and widths developed, and the loess on the slope was eroded by rainwater and accumulated at the toe of the terraced loess slope.
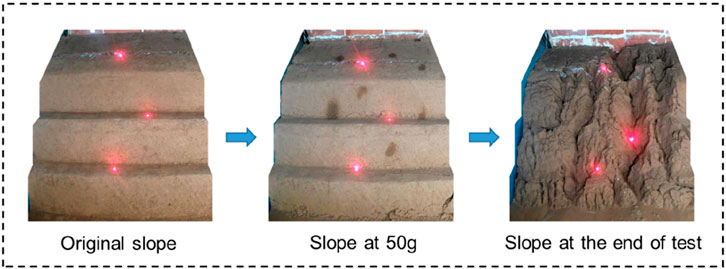
Figure 8. Different states of the loess slope in the test.
Figure 9 presents the deformation and failure of terraced loess slopes under different rainfall intensities. It should be mentioned that three rainfall events were conducted under each level of rainfall intensity. In the current experiment, five different rainfall intensities were chosen, resulting in a total of 15 rainfall events applied to the slope. As shown in the figure, with the increase of intermittent rainfall frequency, the range of erosion and damage to the slope increases, and the gullies widens and deepens. Meanwhile, the slope is accompanied by local collapse phenomenon. When the rainfall intensity is relatively low (r = 5.3 mm/h), the local soil on the surface of the terraced loess slope changes from an unsaturated state to a saturated state after the first rainfall, and the third sublevel slope surface is eroded by rainfall and peels off. The eroded soil particles accumulate at the second sublevel berm. Most of the rainfall runoff at the top of the slope is collected in the prefabricated cracks at the top of the slope. The reason why erosion and damage occur first on the third sublevel slope surface is that compared to the other two berms, the catchment area between the cracks at the top of the slope and the slope shoulder is the largest. In addition, there is a certain angle between the top of the slope and the horizontal plane, leading to the rainfall infiltration rate lower than that at the berm. Therefore, under the same rainfall conditions, the runoff on the third sublevel slope surface is the largest. After the second rainfall, the slope surface suffered severe erosion and developed more gullies. Several gullies were formed on the third sublevel slope surface, and a gully connecting two berms was formed on the second sublevel slope surface. In addition, a sinkhole was formed on the first sublevel slope, and local collapse damage occurred at the toe of the slope. After the third rainfall, the gully deepened and widened, and local collapse and damage occurred on all three slope surfaces. The collapse range of the first sublevel slope expanded. The collapsed soil on the slope was eroded by rainfall and accumulated at various levels of berms and the toe of the slope due to runoff. When the rainfall intensity increases (r = 6.5 mm/h), the degree of slope erosion becomes more severe, the gullies deepen and widen further, and the range of slope collapse expands significantly. Although the intensity and frequency of rainfall have increased, the starting position of the gully at the top of the slope is controlled by prefabricated cracks. At this rainfall intensity (r = 6.5 mm/h), as the number of rainfall events increases, the degree of erosion increases, and several tensile cracks appear on the slope surface. The soil is completely saturated and severely fragmented. Afterwards, with the further increase in rainfall intensity and frequency, the erosion and damage to the slope further developed, and the gullies continued to deepen, but the number of gullies no longer increased. Rainwater collected in the existing gullies and continuously eroded the soil in the gullies, continuously transporting and accumulating soil particles towards the toe of the slope. Under multiple intermittent heavy rainfall events, the slope eventually formed a micro landform with crisscrossing gullies, and a thick accumulation area was formed at the toe of the slope.
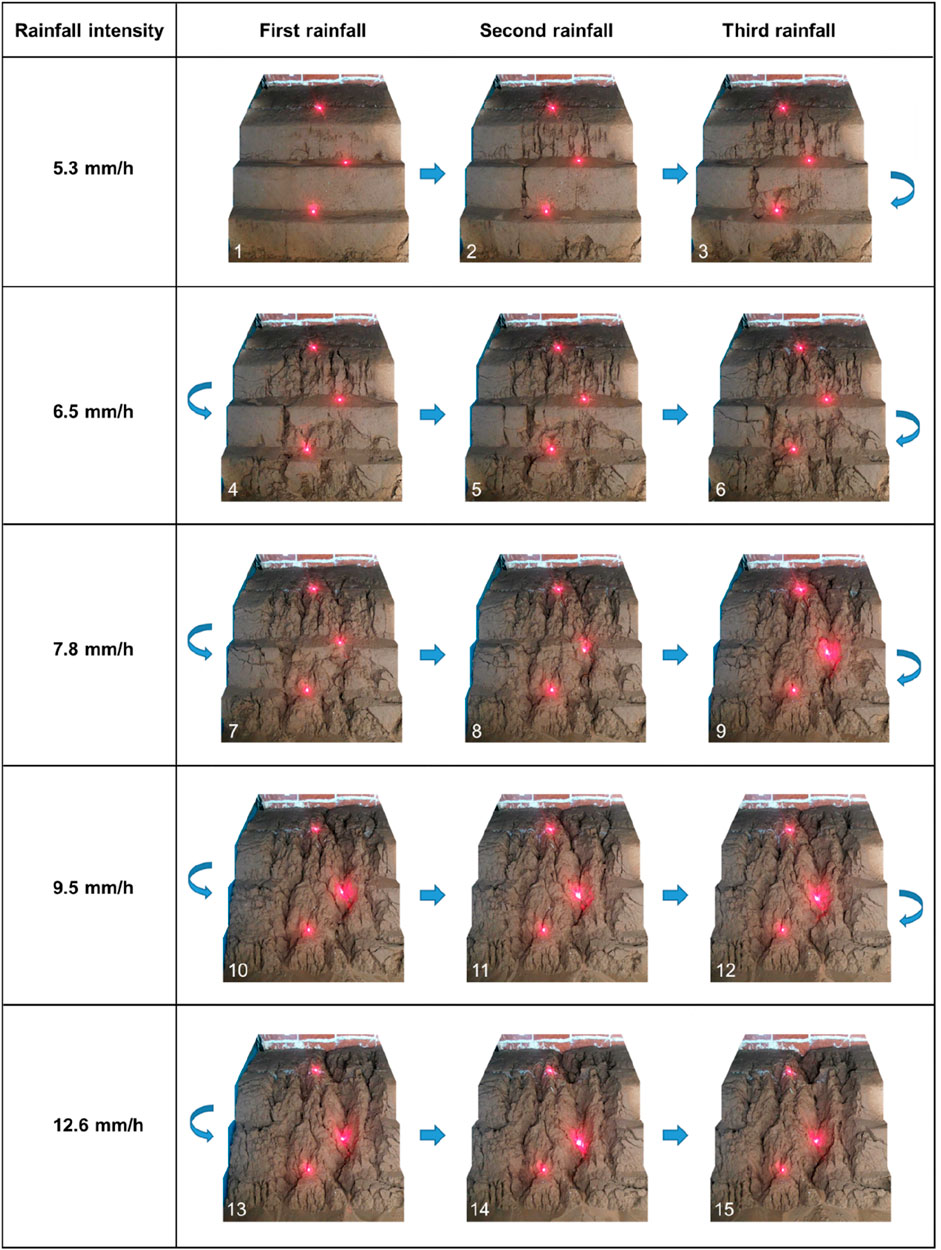
Figure 9. Deformation and failure processes of the loess slope during intermittent rainfall.
Figure 10 shows the time-dependent deformation curves of the slope surface measured by three laser displacement sensors. The detailed positions of the three laser displacement sensors are shown in Figure 5. It should be noted that the five shaded stripes in Figure 10 correspond to rainfall processes of five different intensities. Each stripe includes three rainfall events and three intermittent periods, but the last stripe includes three rainfall events and two intermittent periods. According to the deformation of the slope surface, the deformation and failure of the terraced loess slope can be divided into three stages: loading-consolidation stage, rainfall erosion-deformation stage, and post-rainfall stability stage. During the loading-consolidation stage, the displacement at different points shows a regular variation with the change of acceleration. The displacement of the slope increases with the increase of acceleration, and when the acceleration reaches the predetermined value (50 g), the deformation of the slope first slightly increases and then tends to stabilize. During the rainfall erosion-deformation stage, the trend of slope deformation measured by the three displacement sensors is significantly affected by the rainfall process. During the entire rainfall process, the slope displacement (LD3) near the crack on the top of the slope increases continuously with the increase of intermittent rainfall intensity and frequency, that is, the soil at the top of the slope is continuously eroded by rainfall. The slope displacement (LD2) at the second sublevel berm first decreases and then increases in fluctuation, that is, the eroded soil on the third sublevel slope and slope top first accumulates at this berm, and then with the increase of rainfall intensity, the soil on this berm is continuously eroded. The slope displacement (LD1) at the first sublevel berm first decreases and then slightly increases with the rainfall process, that is, the berm is first accumulated with soil particles and then eroded. Among the three displacement monitoring points, LD2 has the largest displacement change amplitude, and its abrupt changes all occur during the rainfall event stage. In the early stage of rainfall, the lower part of the slope mainly receives the accumulation of soil after erosion from the upper part. In the later stage of rainfall, the soil in the lower part of the slope begins to be continuously eroded and accumulates towards the toe of the slope, while the soil at the top of the slope is continuously eroded throughout the entire rainfall process. In the stable stage after rainfall, the deformation of the slope at each monitoring point is basically stable, showing a slight increasing trend. This is because the slope soil undergoes creep under the action of rainwater infiltration and loading.
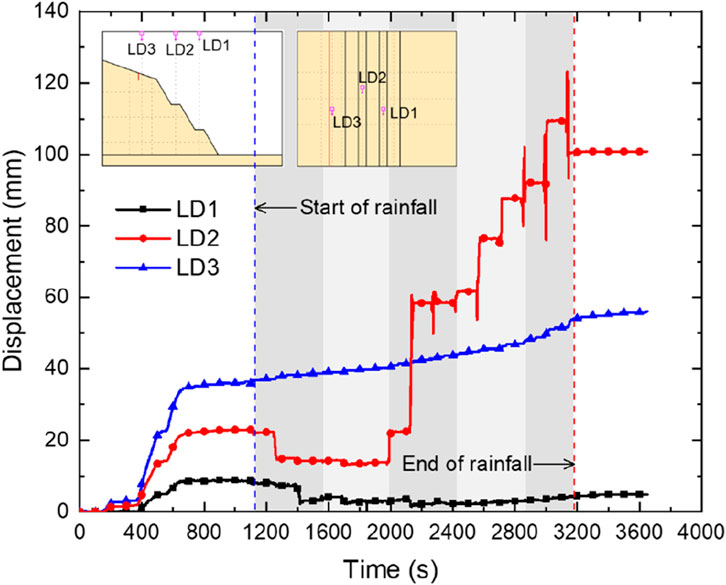
Figure 10. Slope surface deformation monitored by laser displacement meters.
3.2 Earth pressure response of terraced loess slope
Figure 11 shows the variation curve of earth pressure over time measured by the earth pressure gauges embedded inside the slope. The detailed location of the earth pressure gauges is shown in Figure 5. According to the trend of earth pressure changes, the mechanical response process of the slope can also be divided into three stages: loading-stress increase stage, rainfall erosion-stress fluctuation stage, and post-rainfall stress stability stage. In the first stage, the vertical stress inside the slope increases continuously with the increase of acceleration. When the acceleration reaches 50 g, the stress inside the slope first slightly adjusts and then tends to stabilize, reaching a stress equilibrium state. During the intermittent rainfall stage (i.e., the second stage), the earth pressure at different points fluctuates with the rainfall process. EP1 has the highest earth pressure value, which is due to the thick overlying soil layer and obvious stress concentration phenomenon. The earth pressure of EP3 is the smallest, which is due to the thinnest soil layer on top of the earth pressure gauge at that location. In the early stage of rainfall, the earth pressure of EP2 and EP3 first increases and then continuously decreases. The main reason is that rainfall erosion moves the upper soil of the slope to above EP2 and EP3, causing the overlying soil layer to thicken. The reason for the slight increase in earth pressure values of EP1 and EP4 is that the soil in the slope gradually saturates, leading to an increase in soil weight. The earth pressure decrease in EP5 is due to the expansion of cracks caused by rainfall, resulting in the downward sliding of the soil at the top of the slope and a reduction in overlying earth pressure. As the rainfall continues, the earth pressure values at each point decrease, with EP1, EP2, and EP5 showing the greatest reduction. EP1 decreases continuously with the increase of rainfall intensity and frequency, which is related to the continuous erosion and peeling of the soil at the toe of the slope (see Figure 9), leading to stress release. EP2 and EP4 are buried inside the slope, and their sensitivity to changes in the overlying soil is relatively low, resulting in their value changes slight. The earth pressure of EP3 and EP5 significantly decrease in the middle and late stages of rainfall, which is related to the strong erosion caused by rainfall (see Figure 9). In the late stage of rainfall, the values of EP3 and EP5 decrease to almost zero, indicating that the soil at EP3 and EP5 is most severely eroded, and the overlying soil is almost completely eroded. The change in earth pressure reflects the variation law of the internal stress field of the slope, which is closely related to the rainfall process. The erosion stress of the soil decreases, the accumulation stress of the soil increases, and the sudden drop in earth pressure is related to the local collapse of the slope. In the third stage, after the rainfall, the slope soil undergoes internal stress adjustment due to creep, and overall the earth pressure tends to be constant.
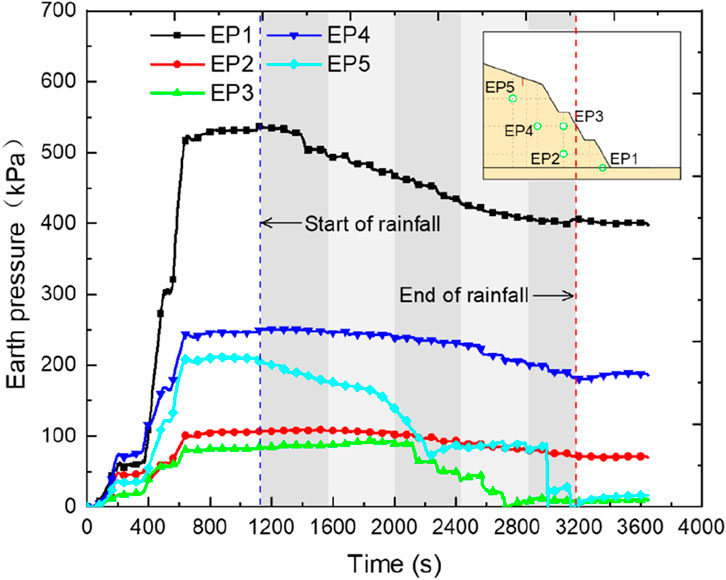
Figure 11. Variation of earth pressure with time in the loess slope.
3.3 Water content response of terraced loess slope
Figure 12 shows the variation curve of volume moisture content over time measured by the moisture content meters embedded inside the slope. The detailed location of the moisture content meters is shown in Figure 5. As shown in the figure, the transport law of water in the slope under rainfall is significantly affected by the loading and rainfall processes. During the loading and consolidation stage of the slope, except for EC2, the moisture content of each monitoring point increases with the increase of acceleration. When the acceleration reaches 50 g and runs stably for a period of time, the soil moisture content gradually tends to stabilize. The moisture content increases with the increase of acceleration, because as the acceleration increases, the self-weight load on the soil increases, and thus the soil is compacted and the pores decrease. In the end, the total volume decreases, resulting in an increase in moisture content. The moisture content measured by EC2 does not change with the acceleration, which may be because EC2 is closest to the slope surface and tensile cracks are generated near the slope surface at the second sublevel berm during the loading process, making it difficult to compact the soil. The moisture content measured by EC3 increases the most during the loading stage, which is related to the burial depth of EC3. The soil in the deep part of the slope is more compressed and consolidated, resulting in a greater reduction in volume. During the rainfall erosion and infiltration stage, the response characteristics of moisture content at different locations vary with the rainfall process. Except for EC3, the soil moisture content at each point first remains constant with rainfall and then rapidly increases. Due to the deep burial depth of EC3, the rainwater infiltration line always does not reach this point during the entire rainfall process, so the measured moisture content at this point remains unchanged. The response time of EC2 is earliest because the sensor is buried under the berm and has a shallow depth. In addition, during the loading process, tension cracks are generated at this location, making it easier for rainwater to collect and infiltrate into the interior of the slope. The special location of EC2 and the presence of internal cracks in the slope make it easy to collect and dissipate rainwater, resulting in the largest change in measured moisture content. The moisture content curve fluctuates throughout the entire rainfall and intermission period. The values of EC1, EC4, and EC5 remain basically unchanged under the first two rainfall intensity conditions, and then as the rainfall intensity and frequency increase, the infiltration line reaches the sensor position, causing a sudden increase in moisture content. Due to the presence of prefabricated cracks at the top of the slope, although EC5 is buried deeper, its measured moisture content suddenly increases slightly earlier than EC4. In the post-rainfall stage, due to the slope always being within a 50 g gravity field, rainwater continues to migrate towards the interior of the slope, resulting in a continuous decrease in the surface soil moisture content (EC2 and EC4) and a slight increase in the deep soil moisture content (EC1 and EC5).
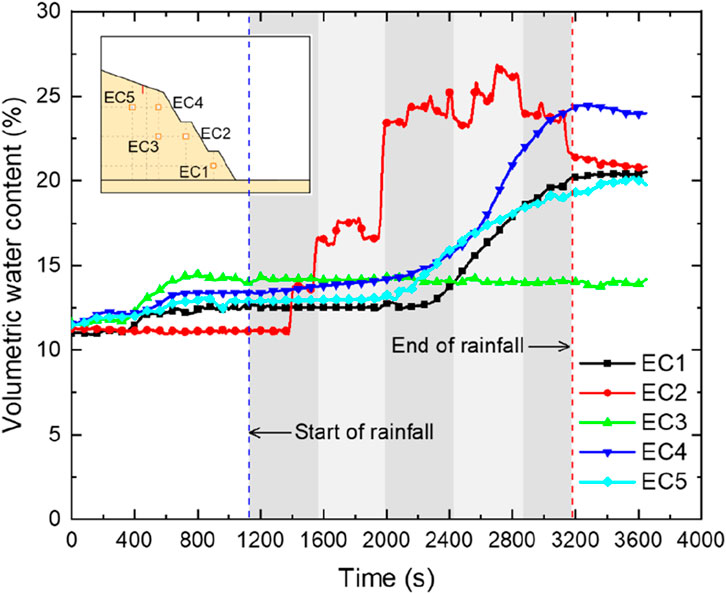
Figure 12. Variation of volumetric water content with time in the loess slope.
4 Numerical modellings
To extensively explore the deformation and failure processes of terraced loess slope under rainfall, numerical simulations were conducted using a hybrid finite-discrete element method (FDEM). The influence of the crack on the slope stability was investigated further.
4.1 Numerical model
A Y-Mat program was used to establish the numerical model of terraced loess slope. The theoretical basis of the Y-Mat program is the hybrid FDEM proposed by Munjiza et al. (1995), which can effectively solve material deformation and fracture problems. Y-Mat program is based on the original program Y code. Additionally, it has been improved in three aspects, including a simpler and more efficient algorithm to calculate the contact force, an algorithm for tangential contact force closer to the actual physical process, and a plastic yielding criterion (e.g., Mohr-Coulomb) to modify the elastic stress for fitting the mechanical behavior of elastoplastic materials. Then, a program integrating the core algorithm, pre-processing, and post-processing was written on the MATLAB platform to facilitate numerical simulation. More details concerning the Y-Mat program can be found in Liu et al. (2022).
Based on the results of centrifuge model test, a numerical model was established, as shown in Figure 13. The length, the left height, and the right height are 60 m, 36 m, and 10 m, respectively. The boundary condition of this model is to fix the normal displacement of the left and right sides and the bottom. The crack in depth of 2.0 m is constructed using adhesive crack model elements embedded between any two adjacent mesh elements. The numerical calculation parameters were determined based on the results obtained from laboratory experiments and trial calculation. The Y-Mat program was used to first calculate the self-weight balance of the model. Then, rainfall was applied to the model by reducing the mechanical parameters of the loess. It is mentioned that simulating landslide deformation and failure coupled with rainfall infiltration remains a challenging task in numerical modeling. A simplified approach can effectively capture the rainfall infiltration process. Unlike previous methods that uniformly weakened all parameters or those of a specific stratigraphic layer, the current strategy involves dynamically updating parameters to achieve equivalent infiltration depth, i.e., weakening parameters to depths corresponding to the actual infiltration over time. Additionally, infiltration occurs more rapidly in cracked zones compared to intact areas. Finally, the mechanical calculation was performed again to calculate the deformation and failure processes. To monitor the variation in slope surface deformation and the internal stress field, several monitoring points were established, including six displacement points and seven stress points, as shown in Figure 14.
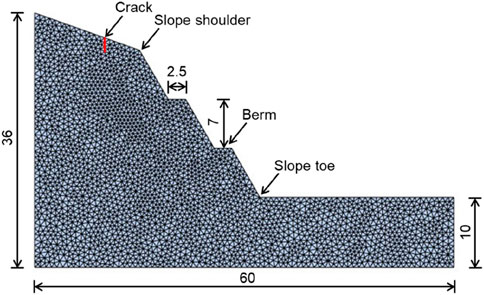
Figure 13. Numerical mesh and monitoring points of the terraced loess slope model (unit: m).
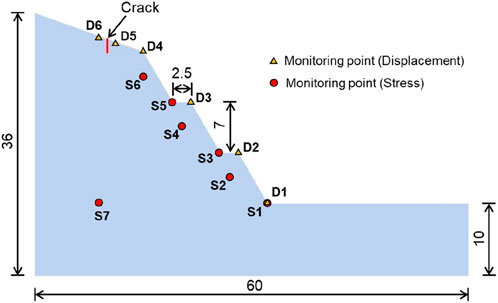
Figure 14. Location of the displacement and stress monitoring points (unit: m).
4.2 Numerical results and analyses
Figure 15 shows the deformation and failure process of the terraced loess slope obtained from the FDEM numerical simulation. The deformation and failure process of the terraced loess slope under rainfall can be mainly divided into three stages: shallow soil spalling, local collapse, and overall collapse. In the early stages of rainfall, the shallow soils experience peeling, and the surface soil becomes loose (see Figures 15b,c). As the rainfall continues, the potential sliding surfaces in sublevels of slope gradually connect, and the soil begins to collapse and accumulate towards the toe of the slope (Figure 15d). Then tension cracks appeared at the top of the slope, and the collapse range increased. The thickness of soil accumulation near the toe of the slope increased and slid further away (see Figure 15e). Finally, the loose soil on the slope slid down to the toe of the slope, causing the overall collapse of the slope, but the collapse boundary at the top of the slope was controlled by the prefabricated crack on the top of the slope (Figure 15f).
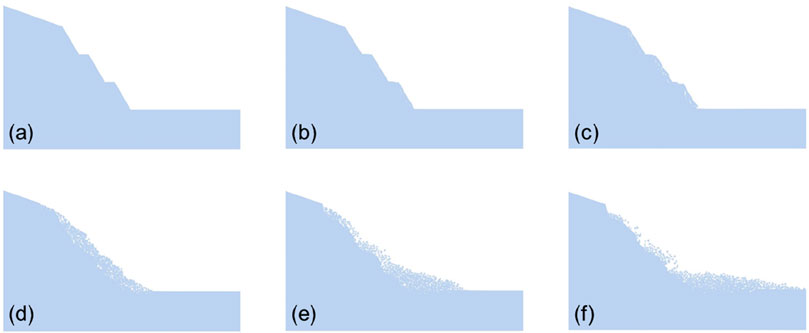
Figure 15. Deformation and failure processes of the terraced loess slope during rainfall. (a) step 0; (b) step 40000; (c) step 75000; (d) 130000; (e) 215000 and (f) 405000.
Figure 16 shows the cloud map of the total displacement of the terraced slope during the rainfall. As shown in the figure, the maximum displacement of the slope under the action of rainfall shifts from the top of the slope to the slope surface, and the total displacement of the shallow soil on each sublevel of slope surface increases. As the rainfall infiltration continues, the deformation of the slope intensifies, and the shallow soil undergoes significant subsidence, with the shallow sliding surfaces of each sublevel slope interconnected. As rainfall gradually infiltrates into the deep soil, the displacement range of the slope increases and deformation intensifies. Some of the soil collapses and accumulates on the toe of the slope and berms, resulting in multiple tensile cracks at the top of the slope. Afterwards, the rainfall further infiltrated, causing the slope to continue collapsing, and the soil at the top of the slope also accumulated towards the toe of the slope, pushing the soil to accumulate further away. Finally, almost all of the loose soil on the slope collapsed to the toe of the slope and further away, and the collapse boundary at the top of the slope was controlled by the prefabricated crack.
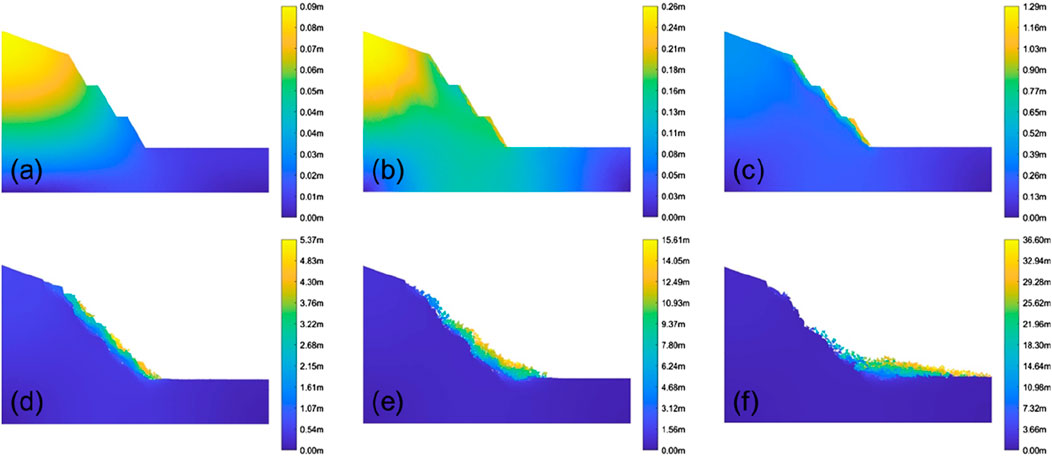
Figure 16. Total displacement contour of the terraced loess slope during rainfall. (a) step 0; (b) step 40000; (c) step 75000; (d) 130000; (e) 215000 and (f) 405000.
Figure 17 plots the displacement (horizontal, vertical, and total) against the calculation step for all six monitoring points during the rainfall event. It can be observed that the displacement variations at different locations differ significantly, which is closely associated with the slope deformation and failure process. Regarding horizontal displacement, the order of magnitude is D3 > D2 > D4 > D5 > D6 > D1, with the largest displacements observed in the middle part of the slope (D2 and D3). Major deformation occurs mainly at the crest of each sublevel slope (D2, D3, D4), while displacement at the slope toe (D1) remains relatively small. Due to the presence of pre-existing cracks at the slope top, the outer side of the crack experiences substantial deformation, whereas the inner side shows minimal horizontal displacement. Moreover, the deformation rate at D5 lags behind that at D4 because the slope at D4 collapses first, resulting in the loss of lateral support at D5, which in turn accelerates its subsequent deformation. The variation pattern of vertical displacement differs from that of horizontal displacement. The order of vertical displacement magnitude is D4 > D5 > D3 > D2 > D6 > D1, with the maximum value occurring at the crest of the third sublevel slope (D4) and the minimum at the slope toe (D1). Except for D5, the vertical displacement rate at each point initially increases and then decreases, indicating that under rainfall infiltration, the slope undergoes accelerated deformation first before tending to stabilize. Based on the total displacement curves, the greatest deformation is observed in the upper part of the slope. In contrast, deformation at the slope toe and inside the crack is relatively small. The displacement values at the slope top (D6) and the slope toe (D1) are almost equal and represent the least deformed areas throughout the slope.
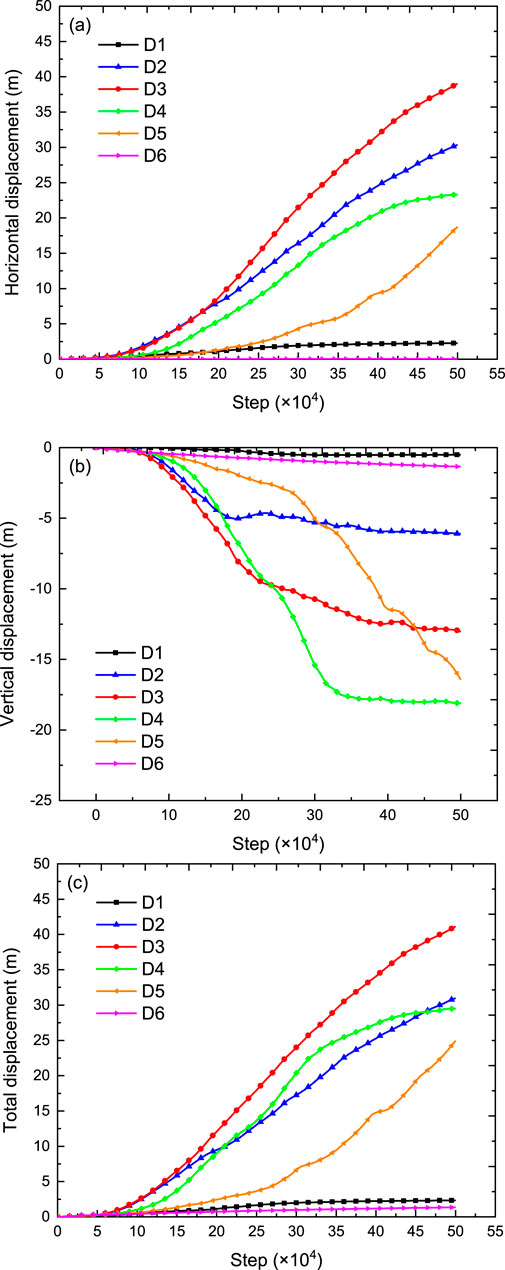
Figure 17. Displacement curves of the monitoring points in terraced loess slope during rainfall: (a) horizontal displacement, (b) vertical displacement and (c) total displacement.
Figure 18 shows the shear stress cloud map of the terraced loess slope during rainfall. As shown in the figure, in the early stage of rainfall, the maximum shear stress is located at the toe of each sublevel slope, indicating a significant stress concentration phenomenon at the toe of the slope. As the rainfall continues, the shallow soil gradually saturates, and the internal stress of the soil is released, with the maximum shear stress located near the toe of the lowest slope. With the intensification of rainfall infiltration, the soil on the slope becomes loose, and thus the stress concentration effect weakens, resulting in the maximum shear stress gradually developing towards the interior of the slope. Subsequently, as the rainfall continues and the soil collapses, the internal stress of the slope adjusts and becomes more uniform.
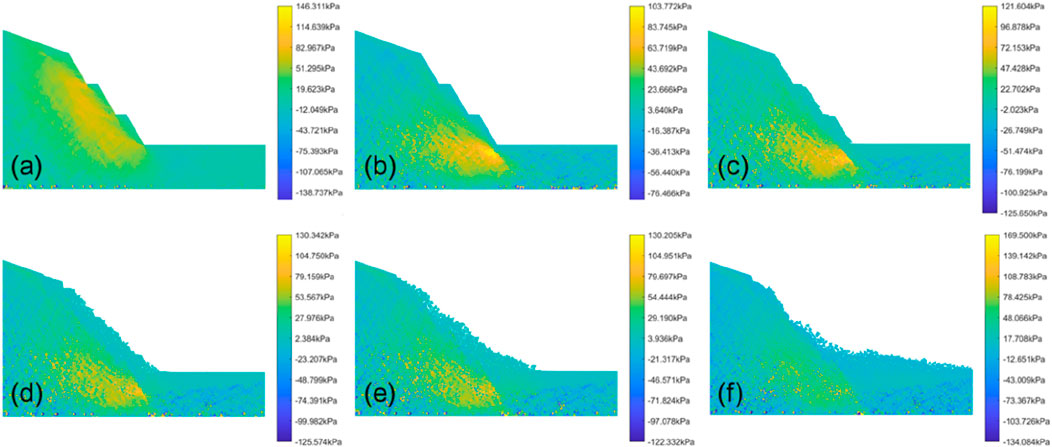
Figure 18. Shear stress contour of the terraced loess slope during rainfall. (a) step 0; (b) step 40000; (c) step 75000; (d) 130000; (e) 215000 and (f) 405000.
Figure 19 plots the stress (maximum principal stress, minimum principal stress and shear stress) against the calculation step for all seven monitoring points during the rainfall event. It can be seen that the characteristics of the stress duration curves at the monitoring points vary significantly with location and can be categorized into two types. The first type corresponds to internal monitoring points within the sliding mass (S1–S6). Located inside the sliding body, these points are directly influenced by slope deformation and inter-particle collisions. Their stress duration curves exhibit large fluctuations until the slope deformation enters a relatively stable phase, after which the amplitude of stress variation decreases markedly. The second type refers to the external monitoring point (S7), which lies outside the sliding zone and is only indirectly affected by slope movement. As a result, its stress duration curve remains generally stable. Although some initial variation occurs due to stress redistribution within the slope, the curve stabilizes in later stages without pronounced fluctuations.
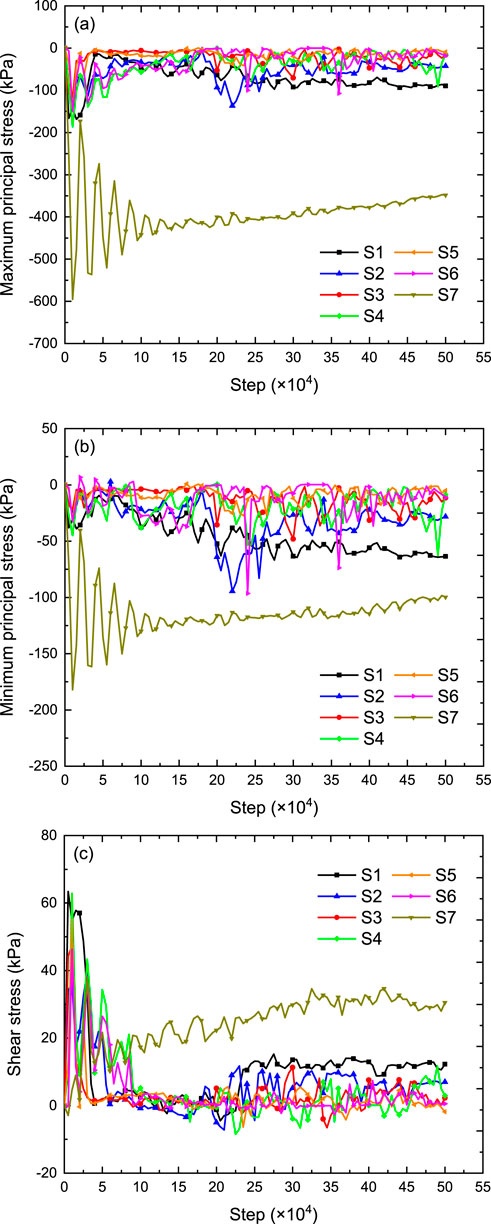
Figure 19. Stress curves of the monitoring points in terraced loess slope during rainfall: (a) maximum principal stress, (b) minimum principal stress and (c) shear stress.
5 Discussions
Centrifuge model tests provided direct physical evidence of the slope failure process under controlled conditions, yielding valuable observational data such as deformation patterns and the timing of failure initiation. These experimental results were used to calibrate and validate a numerical model, ensuring its accuracy in replicating key features like the deformation-time history and final failure mode. The numerical model also enabled continuous monitoring of the internal stress field and displacement field distribution within the slope over time. More importantly, once validated, the model allowed the investigation of parameters difficult to measure experimentally, such as the evolution of shear strain and the progressive failure mechanism at different depths.
Previous experimental and numerical studies have shown that both rainfall patterns and slope geometry significantly influence the deformation and failure behavior of loess slopes (Sun et al., 2019; Zhang et al., 2019). Rainfall intensity primarily affects the temporal progression of slope deformation and failure, with less impact on the overall failure mode. When the rainfall intensity reached a certain level, the rainwater not only infiltrated into the slope but also flowed along the slope surface (Sun et al., 2021). In the present study, the minimum rainfall intensity is 5.3 mm/h, which is relatively large, thus the scouring failure replace the damage pattern of landslides and become the main failure pattern of slopes. Under these conditions, scouring failure tends to replace landslides as the dominant failure pattern, a finding consistent with Zhen et al. (2023). Furthermore, the failure mode differs between continuous and intermittent heavy rainfall. Under intermittent rainfall, erosion often occurs at the slope shoulder, while collapse is observed at the toe. After multiple rainfall events, tension cracks frequently develop at the trailing edge of the slope.
Slope geometry also plays a critical role in failure mode. Studies involving nearly vertical, linear, and terraced slopes have revealed distinct failure mechanisms (Sun et al., 2019; Zhang et al., 2019; Chang Z. et al., 2021; Guo et al., 2023). For instance, nearly vertical fill slopes are prone to intermittent, sudden shallow failures under short-term continuous rainfall, whereas terraced fill slopes exhibit gradual shallow failures during prolonged rainfall. The linear and terraced slopes show different deformation responses, largely due to variations in rainwater infiltration patterns and rates. Infiltration is typically faster on slope berms than on slope surfaces, leading to spatially heterogeneous shear strength distribution. After several intermittent rainfall events, cracks often develop, particularly along the slope crest. These tension cracks, in turn, significantly influence wetting front advancement during subsequent extreme rainfall (Ren et al., 2025), highlighting the important role of cracks in slope stability. Key crack characteristics—such as depth, location, width, and filling condition—govern their function as preferential flow paths and strongly affect failure initiation. It should be noted that the current conclusions are based on specific test conditions, and their generalizability may be limited. Future work will focus more closely on the influence of fissures on the rainfall-induced failure process of loess slopes.
6 Conclusion
In this paper, centrifuge model tests were carried out to investigate the deformation and failure behaviors of the terraced loess slope under heavy rainfall. The terraced loess slope has two berms and three sublevel slopes with gradient of 60°. The deformation and failure characteristics of the loess slope under rainfall infiltration were obtained by the digital camera installed on the top of the test box. Additionally, the surface deformation, earth pressure, volumetric water content in response to the rainfall were monitored by the sensors buried inside the slope. Furthermore, numerical modellings were performed to thoroughly investigate the effect of crack on the physical and mechanical responses to rainfall. Based on the analyses of centrifuge model test and numerical simulation results, the following conclusions can be drawn:
1. During gradual acceleration, the slope primarily experiences vertical consolidation settlement. Stress concentrations occur at the toe of each sublevel slope, particularly at the lowest toe, where surface peeling occurs. As intermittent rainfall intensity and frequency increases, soil erosion and slope damage expand, and gullies widen and deepen. Despite increased rainfall intensity and frequency, the gully’s initiation point at the slope top remains controlled by prefabricated cracks.
2. Based on slope surface deformation, the failure process of terraced loess slope can be categorized into three stages: loading-consolidation, rainfall-induced erosion-deformation, and post-rainfall stabilization. During early rainfall, eroded soil from the upper slope primarily accumulates in the lower section. In later stages, continuous erosion shifts to the lower slope, transporting sediment toward the toe, whereas the upper slope experiences sustained erosion throughout rainfall.
3. The mechanical response of the slope, as reflected by earth pressure trends, progresses through three distinct phases: loading-induced stress increase, rainfall-triggered stress fluctuation, and post-rainfall stress stabilization. The change in earth pressure reflects the variation law of the internal stress field of the slope, demonstrating a strong correlation with rainfall patterns. As erosion-induced stress diminishes and accumulation-induced stress rises, abrupt earth pressure reductions correlate with localized slope failures.
4. Overall, the water content exhibits a positive correlation with acceleration, rainfall intensity, and frequency. During rainfall, the water content remains initially stable before undergoing rapid increase upon wetting front arrival at the monitoring point. Pre-existing and developing cracks on the slope form preferential flow paths that significantly enhance rainwater infiltration into the slope interior.
5. The deformation and failure process of the terraced loess slope under rainfall can be mainly divided into three stages: shallow surface spalling, localized collapse, and global slope failure. With continued rainfall infiltration, progressive slope collapse occurs, transporting soil from the upper slope toward the toe and causing distal accumulation. Progressive rainfall infiltration leads to soil loosening, reducing stress concentration effects and causing the maximum shear stress zone to migrate deeper into the slope.
Data availability statement
The raw data supporting the conclusions of this article will be made available by the authors, without undue reservation.
Ethics statement
Written informed consent was obtained from the individual(s) for the publication of any identifiable images or data included in this article.
Author contributions
JJ: Formal Analysis, Investigation, Visualization, Writing – original draft, Funding acquisition. YD: Conceptualization, Writing – review and editing, Methodology. XG: Conceptualization, Funding acquisition, Methodology, Supervision, Writing – review and editing, Data curation. GL: Software, Validation, Visualization, Writing – review and editing. QG: Data curation, Investigation, Methodology, Writing – review and editing.
Funding
The author(s) declare that financial support was received for the research and/or publication of this article. This work is supported by the Natural Science Foundation of Shaanxi Province (No. 2024JC-YBQN-0299; 2025SF-YBXM-292; 2025JC-YBMS-301), the National Key R&D Program of China (2023YFC3008401) and China Geological Survey Project (No. DD20221739; DD20251318).
Conflict of interest
The authors declare that the research was conducted in the absence of any commercial or financial relationships that could be construed as a potential conflict of interest.
Generative AI statement
The author(s) declare that no Generative AI was used in the creation of this manuscript.
Any alternative text (alt text) provided alongside figures in this article has been generated by Frontiers with the support of artificial intelligence and reasonable efforts have been made to ensure accuracy, including review by the authors wherever possible. If you identify any issues, please contact us.
Publisher’s note
All claims expressed in this article are solely those of the authors and do not necessarily represent those of their affiliated organizations, or those of the publisher, the editors and the reviewers. Any product that may be evaluated in this article, or claim that may be made by its manufacturer, is not guaranteed or endorsed by the publisher.
References
Chang, W., Wang, P., Wang, H., Chai, S., Yu, Y., and Xu, S. (2021). Simulation of the Q2 loess slope with seepage fissure failure and seismic response via discrete element method. Bull. Eng. Geol. Environ. 80 (4), 3495–3511. doi:10.1007/s10064-021-02139-z
Chang, Z., Huang, F., Huang, J., Jiang, S. H., Zhou, C., and Zhu, L. (2021). Experimental study of the failure mode and mechanism of loess fill slopes induced by rainfall. Eng. Geol. 280, 105941. doi:10.1016/j.enggeo.2020.105941
Chen, G., Meng, X., Qiao, L., Zhang, Y., and Wang, S. (2018). Response of a loess landslide to rainfall: observations from a field artificial rainfall experiment in bailong river basin, China. Landslides 15, 895–911. doi:10.1007/s10346-017-0924-6
Chen, Y., Liu, G., Li, N., Du, X., Wang, S., and Azzam, R. (2020). Stability evaluation of slope subjected to seismic effect combined with consequent rainfall. Eng. Geol. 266, 105461. doi:10.1016/j.enggeo.2019.105461
Cheng, Y., Huo, A., Zhao, Z., and Peng, J. (2021). Analysis of loess fracture on slope stability based on centrifugal model tests. Bull. Eng. Geol. Environ. 80 (5), 3647–3657. doi:10.1007/s10064-021-02135-3
Guo, Z., Huang, Q., Liu, Y., Wang, Q., and Chen, Y. (2023). Model experimental study on the failure mechanisms of a loess-bedrock fill slope induced by rainfall. Eng. Geol. 313, 106979. doi:10.1016/j.enggeo.2022.106979
Jia, J., Pei, X., Guo, X., Cui, S., Sun, P., Fan, H., et al. (2024). Laboratory model tests on the deformation and failure of terraced loess slopes induced by extreme rainfall. Land 13, 1631. doi:10.3390/land13101631
Jiang, X. D., Hou, T. S., Guo, S. L., and Chen, Y. (2023). Influence of cracks on loess collapse under heavy rainfall. Catena 223, 106959. doi:10.1016/j.catena.2023.106959
Leng, X., Dong, Y., Cui, L., Zhou, L., and Luo, S. (2024). An integrated investigation of the failure mechanism of loess landslide induced by raining: from field to laboratory. Bull. Eng. Geol. Environ. 83 (11), 442. doi:10.1007/s10064-024-03937-x
Li, C., Yao, D., Wang, Z., Liu, C., Nashun, W., Liu, Y., et al. (2016). Model test on rainfall-induced loess–mudstone interfacial landslides in qingshuihe, China. Environ. Earth Sci. 75, 835. doi:10.1007/s12665-016-5658-6
Lin, G., Lan, H., Li, P., Li, L., Liu, S., and Sun, W. (2024). Role of rainfall temporal distribution on effective infiltration in the loess slope and prediction model. Eng. Geol. 335, 107541. doi:10.1016/j.enggeo.2024.107541
Liu, G., Ma, F., Zhang, M., Guo, J., and Jia, J. (2022). Y-Mat: an improved hybrid finite-discrete element code for addressing geotechnical and geological engineering problems. Eng. Comput. Int. J. Comput. -Aided Eng. Softw. 5, 39. doi:10.1108/EC-12-2020-0741
Liu, K., Wang, X., Zhan, H., Lian, B., Xue, C., Hu, S., et al. (2025). An experimental study of creep characteristics of fissured loess based on triaxial tests. Catena 250, 108768. doi:10.1016/j.catena.2025.108768
Lu, X., Jiang, Y., Wang, N., and Shen, H. (2023). Progressive deformation and failure mechanism of loess fill slopes induce by rainfall: insights from flume model tests. Bull. Eng. Geol. Environ. 82, 385. doi:10.1007/s10064-023-03413-y
Munjiza, A., Owen, D. R. J., and Bicanic, N. (1995). A combined finite-discrete element method in transient dynamics of fracturing solids. Eng. Comput. 12, 145–174. doi:10.1108/02644409510799532
Peng, J., Fan, Z., Wu, D., Zhuang, J., Dai, F., Chen, W., et al. (2015). Heavy rainfall triggered loess–mudstone landslide and subsequent debris flow in tianshui, China. Eng. Geol. 186, 79–90. doi:10.1016/j.enggeo.2014.08.015
Peng, J., Wang, S., Wang, Q., Zhuang, J., Huang, W., Zhu, X., et al. (2019). Distribution and genetic types of loess landslides in China. J. Asian Earth Sci. 170, 329–350. doi:10.1016/j.jseaes.2018.11.015
Ren, X., Sun, W., Lan, H., Bao, H., Li, L., Liu, S., et al. (2025). Influence of tension cracks on moisture infiltration in loess slopes under high-intensity rainfall conditions. Sci. Rep. 15 (1), 4488. doi:10.1038/s41598-025-88865-w
Sun, P., Peng, J., Chen, L., Lu, Q., and Igwe, O. (2016). An experimental study of the mechanical characteristics of fractured loess in Western China. Bull. Eng. Geol. Environ. 75 (4), 1639–1647. doi:10.1007/s10064-015-0793-y
Sun, P., Wang, G., Wu, L. Z., Igwe, O., and Zhu, E. (2019). Physical model experiments for shallow failure in rainfall-triggered loess slope, northwest China. Bull. Eng. Geol. Environ. 78, 4363–4382. doi:10.1007/s10064-018-1420-5
Sun, P., Wang, H., Wang, G., Li, R., Zhang, Z., and Huo, X. (2021). Field model experiments and numerical analysis of rainfall-induced shallow loess landslides. Eng. Geol. 295, 106411. doi:10.1016/j.enggeo.2021.106411
Tang, Y. M., Xue, Q., Li, Z. G., and Feng, W. (2015). Three modes of rainfall infiltration inducing loess landslide. Nat. Hazards 79, 137–150. doi:10.1007/s11069-015-1833-4
Tang, D., Deng, L., Fan, W., Yang, Y., and Fang, R. (2024). Extension mechanism and failure mode investigation on a fissured loess slope induced by loading. Bull. Eng. Geol. Environ. 83 (7), 294. doi:10.1007/s10064-024-03787-7
Tu, X. B., Kwong, A. K. L., Dai, F. C., Tham, L. G., and Min, H. (2009). Field monitoring of rainfall infiltration in a loess slope and analysis of failure mechanism of rainfall-induced landslides. Eng. Geol. 105 (1-2), 134–150. doi:10.1016/j.enggeo.2008.11.011
Wang, J. J., Liang, Y., Zhang, H. P., Wu, Y., and Lin, X. (2014). A loess landslide induced by excavation and rainfall. Landslides 11 (1), 141–152. doi:10.1007/s10346-013-0418-0
Wang, J., Zhang, D., Wang, N., and Gu, T. (2019). Mechanisms of wetting-induced loess slope failures. Landslides 16 (5), 937–953. doi:10.1007/s10346-019-01144-4
Wang, J., Zhang, D., Zhang, Y., Chen, H., and Ma, W. (2022). Variations in hydraulic properties of collapsible loess exposed to wetting and shearing. Acta Geotech. 17 (7), 2995–3015. doi:10.1007/s11440-021-01427-y
Wu, L. Z., Zhou, Y., Sun, P., Shi, J. S., Liu, G. G., and Bai, L. Y. (2017). Laboratory characterization of rainfall-induced loess slope failure. Catena 150, 1–8. doi:10.1016/j.catena.2016.11.002
Xu, J., Zhou, L., Li, Y., Ding, J., Wang, S., and Cheng, W. C. (2022). Experimental study on uniaxial compression behavior of fissured loess before and after vibration. Int. J. Geomechanics 22 (2), 04021277. doi:10.1061/(asce)gm.1943-5622.0002259
Xu, J., Hu, K., Zhou, L., Li, Y., Ye, W., and Wang, S. (2023). Influence of wet–dry cycles on uniaxial compression behavior of fissured loess. Environ. Earth Sci. 82 (1), 5. doi:10.1007/s12665-022-10684-3
Zhang, S., Zhang, X., Pei, X., Wang, S., Huang, R., Xu, Q., et al. (2019). Model test study on the hydrological mechanisms and early warning thresholds for loess fill slope failure induced by rainfall. Eng. Geol. 258, 105135. doi:10.1016/j.enggeo.2019.05.012
Zhang, D., Wang, J., Chen, C., and Wang, S. (2020). The compression and collapse behaviour of intact loess in suction-monitored triaxial apparatus. Acta Geotech. 15 (2), 529–548. doi:10.1007/s11440-019-00829-3
Zhang, H. X., Zeng, R. Q., Zhang, Y., Zhao, S. F., Meng, X. M., Li, Y. X., et al. (2022). Subsidence monitoring and influencing factor analysis of Mountain excavation and valley infilling on the Chinese loess Plateau: a case study of Yan’an new district. Eng. Geol. 297, 106482. doi:10.1016/j.enggeo.2021.106482
Zhang, S., Sun, P., Li, R., and Wang, F. (2023). Preliminary investigation on a catastrophic loess landslide induced by heavy rainfall on 1 September 2022 in Qinghai, China. Landslides 20, 1553–1559. doi:10.1007/s10346-023-02086-8
Zhen, J., Yang, X., Wang, B., Fan, H., and Meng, M. (2023). Study on the destruction of backfilled loess slopes by short-term extreme rainfall erosion. Bull. Eng. Geol. Environ. 82 (11), 406. doi:10.1007/s10064-023-03426-7
Zhu, Y., Zhang, Y., Lan, H., Peng, J., Zheng, H., Zhao, D., et al. (2024). Effect of crack depth on the initiation and propagation of crack-induced sliding in a paleosol area on a loess slope: three-dimensional investigation based on model testing and laser scanning. Eng. Geol. 342, 107745. doi:10.1016/j.enggeo.2024.107745
Keywords: loess plateau, terraced loess slope, centrifuge model test, rainfall erosion, crack, numerical simulation
Citation: Jia J, Dong Y, Guo X, Liu G and Gu Q (2025) Failure behaviors of terraced loess slope induced by intermittent heavy rainfall: centrifuge model test and numerical simulation. Front. Earth Sci. 13:1696569. doi: 10.3389/feart.2025.1696569
Received: 01 September 2025; Accepted: 01 October 2025;
Published: 17 October 2025.
Edited by:
Chong Xu, Ministry of Emergency Management, ChinaReviewed by:
Jian Ji, Hohai University, ChinaSartsin Phakdimek, Suranaree University of Technology, Thailand
Copyright © 2025 Jia, Dong, Guo, Liu and Gu. This is an open-access article distributed under the terms of the Creative Commons Attribution License (CC BY). The use, distribution or reproduction in other forums is permitted, provided the original author(s) and the copyright owner(s) are credited and that the original publication in this journal is cited, in accordance with accepted academic practice. No use, distribution or reproduction is permitted which does not comply with these terms.
*Correspondence: Xiaopeng Guo, c2pjZ3hwQDE2My5jb20=