Abstract
The Tarim Large Igneous Province (TLIP), as a major igneous province in China, has long been a focus of geological research due to its complex rock assemblages and genetic mechanisms. This study investigates the Permian mafic dikes (diabase and sillite) in the Puchang area of the TLIP, combining zircon U-Pb geochronology, major-trace element geochemistry, and Sr-Nd-Hf isotopic analyses to reveal their petrogenesis and tectonic evolutionary significance. Zircon dating results show that the weighted mean ages of diabase and sillite are 273 ± 3 Ma and 272 ± 2 Ma, respectively, indicating their formation in the late Early Permian. Geochemically, the diabase exhibits medium-K calc-alkaline affinities, with enriched light rare earth elements ((La/Yb)n = 4.62–13.81) and negative anomalies in Nb, Ta, and Ti, while the sillite belongs to the low-K calc-alkaline series, showing weak REE fractionation. Both of the diabase and sillite are similar to OIB patterns in trace element compositions. Both rock types have εHf(t) values of −2.5 to +1.2, (87Sr/86Sr)ᵢ of 0.70431–0.70522, and εNd(t) of 0.20–0.57, reflecting depleted mantle characteristics. Lithological and geochemical evidence indicate that the magmatic source was garnet-spinel lherzolite derived from low-degree partial melting of continental lithospheric mantle metasomatized by subduction components. The magmas underwent fractional crystallization of Fe-Ti oxides and pyroxene with minor crustal contamination during evolution. Combined with regional tectonic evolution, these Puchang mafic dikes formed in the late stage (273–272 Ma) of lithospheric thinning caused by mantle plume thermal erosion, serving as an important supplement to the “mantle plume-lithosphere interaction” model of the TLIP. This study provides new insights into the source properties and tectonic setting of the multiphase magmatism in the TLIP.
1 Introduction
Large igneous provinces (LIPs) are typically characterized by massive eruptions within a short period, consisting of widely distributed huge volumes of mafic magmas, together with minor associated alkaline felsic and silica-undersaturated magmas. Although their duration can reach 75 million years (Ma), more than 75% of their main components are formed within a time span of 1–5 Ma (Bryan and Ernst, 2008), and are generally interpreted as products of mantle plume activity (Campbell and Griffiths, 1990; Campbell, 2007). The Tarim Large Igneous Province (TLIP) is another large igneous province in China that has been widely recognized internationally after the Emeishan Large Igneous Province (Tian et al., 2010; Pirajno et al., 2011; Yu et al., 2011; Xia et al., 2012; Ju and Hou, 2014). Compared with typical large igneous provinces (LIPs) such as the Emeishan and Siberian traps, the TLIP exhibits a more complex lithological assemblage, almost encompassing all rock types found in existing LIPs. It is thus recognized as the LIP with the most complex rock combinations globally (Xu et al., 2014; Jin et al., 2019; Li et al., 2025). In recent years, studies on the mantle plume of the TLIP have attracted increasing attention from geologists. Numerous scholars have conducted extensive research on different rock units of the TLIP, gaining certain insights into its rock assemblages, distribution range, magmatic evolution, and genetic mechanisms (Yang et al., 2007; Zhou et al., 2009; Tian et al., 2010; Zhang et al., 2010; Li et al., 2011; Zhang et al., 2013; Cheng et al., 2014; Xu et al., 2014; Zhang et al., 2014; Cheng et al., 2015; Zou et al., 2015; Zhang et al., 2016; Cheng et al., 2017; Cheng et al., 2018; Jin et al., 2025). They believe that the complex rock assemblages in the TLIP might be the result of the interaction between the mantle plume and the subducting slab at different depths. (Zhang et al., 2013; Cheng et al., 2015; Cheng et al., 2017; Cheng et al., 2018). The magmatism of the TLIP lasted for a relatively long time (ca. 300 to 270 Ma). According to previous isotopic chronology studies on the TLIP, it is mainly divided into three stages (Xu et al., 2014; Cheng et al., 2015; Cheng et al., 2017; Cheng et al., 2018). The early magmatism is represented by the kimberlitic rocks in Wajilitage (ca. 300 Ma), whose age is the earliest measured for the TLIP. These rocks are considered to have formed by partial melting of the enriched lithospheric mantle under the action of a mantle plume, and this melting was triggered by the impact of the Tarim mantle plume (Zhang et al., 2013). The second-stage magmatism is dominated by widely distributed continental flood basalts (ca. 290 Ma) and bimodal volcanic rocks composed of minor rhyolites (Yu et al., 2011; Cheng et al., 2018). Scholars have proposed two main genetic models for the basaltic magmas. One group suggests that partial melting of metasomatized lithospheric mantle, induced by mantle plume underplating, generated these magmas (Yu et al., 2011; Wei et al., 2014; Zhou et al., 2014), whereas others argue they formed via decompression melting of the mantle plume (Cheng et al., 2018). The flood basalts outcrop in multiple areas of Tarim (e.g., Kalpin and Bachu regions), indicating the onset of large-scale magmatism in the Tarim area. Overall, the eruption period of basalts represents the climax of magmatism in the TLIP. The late-stage magmatism is characterized by complex rock types, mainly including basic intrusions (pyroxenite and gabbro), alkaline rocks (Ijolite-syenite and nepheline syenite), and granite, etc., and is developed with a large number of diorite dikes, diabase dikes, sillite dikes, lamprophyre dikes, carbonatite dikes and granite dikes (Zhang et al., 2008; Li et al., 2012; Zhang et al., 2013; Wei et al., 2014; Cheng et al., 2015; Zou et al., 2015; Cheng et al., 2017; Zhu et al., 2021). Mafic intrusions (distributed in Bachu, Wajilitage, Puchang, and Bashsuhong areas) show large variations in formation ages (275–290 Ma) (Yang et al., 2007; Zhang et al., 2008; Li et al., 2011). Scholars suggest that the mafic magmas were generated by partial melting of the lithospheric mantle caused by the underplating of the mantle plume (Yang et al., 2007; Zhang et al., 2008; Zhou et al., 2009; Zhang et al., 2010; Li et al., 2011; Li et al., 2012; Xu et al., 2014; Zou et al., 2015), and then formed through long-term fractional crystallization evolution of Fe- and Ti-rich basaltic magmas (Zhou et al., 2009; Zhang et al., 2010; Li et al., 2012; Wei et al., 2014; Xu et al., 2014). Alkaline rocks (distributed in Wajilitage, Halajun, and Bashsuhong areas) have formation ages ranging from 268 to 278 Ma (Yang et al., 2007; Zhang et al., 2008). Some scholars suggest that they formed through fractional crystallization of melts from the Tarim mantle plume in a closed system (Wei et al., 2019; Kong et al., 2021). Granitic rocks, conversely, were generated by magmatic mixing of melts from the mantle and crust, or by partial melting of newly intruded mafic rocks in the lower crust induced by asthenospheric mantle underplating, followed by fractional crystallization (Su et al., 2017).
Previous studies on the late-stage magmatism of the TLIP have predominantly focused on large mafic-ultramafic intrusions, alkaline rocks, and granites, while late-stage dykes have received limited attention. Here, we investigate the mafic dykes (diabase and sillite) in the Puchang area of the TLIP, using zircon U-Pb geochronology, petrography, major-trace element geochemistry, and Hf-Sr-Nd isotopes to constrain their mineralogy, petrogenesis, and magma sources. Integrating regional geological data, this study aims to provide new constraints on the evolutionary processes of the TLIP.
2 Regional geological background
The Tarim Craton is located in the southwestern part of Xinjiang Uygur Autonomous Region, Northwest China. It borders the Tianshan Orogenic Belt (a part of the Central Asian Orogenic Belt) to the north, the Kunlun Orogenic Belt to the south, and the Altyn Tagh Orogenic Belt to its southeast (Cao et al., 2014; Zhang et al., 2014). The Tarim Craton is one of the three major ancient cratons in China (the other two being the North China Craton and the Yangtze Craton) (Figure 1a) (Han et al., 2011). Due to its location in the southern part of the Central Asian Orogenic Belt, it plays a very important role in the geological evolution of the Central Asian tectonics.
FIGURE 1

Distribution map of Early Permian basalts in the Tarim Basin (a) and geological map of the Puchang area (b) (Tian et al., 2010); KD–Kuqa Depression; NTD–Northern Tarim Uplift; NTD–Northern Depression; CTU–Central Uplift; SWD–Southwestern Depression; STU–Southern Tarim Uplift; SED–Southeastern Depression.
The Puchang area is located in the northwestern margin of the Tarim Block. Since the Late Paleozoic, intense magmatism has occurred in the Tarim Basin, forming corresponding mineral deposits. The exposed strata in the Puchang region include the Late Cambrian–Middle Ordovician Qiulitag Formation, Upper Silurian Kalpintag Formation, Upper Carboniferous Kangkelin Formation, Lower Permian Balikelike Formation, and Neogene Xiyu Formation (Yu et al., 2011). The strata exhibit a monoclinal structure, dipping northwest at an angle of 50°–60°. The southern limb is disrupted by strike-thrust faults that dip northwest, often overthrusting the Cenozoic strata to form a basin-range tectonic pattern. North–south-trending faults are also well-developed. The magmatic rocks in the area are primarily composed of the Puchang mafic complex and late-stage alkaline and acidic dikes. The Puchang mafic complex intrudes the Upper Carboniferous Kangkelin Formation, which consists of siliceous slate, marble, and skarnized slate. Its western and eastern parts are covered by Neogene sediments. The main lithologies of the Puchang complex include plagioclase-bearing clinopyroxenite, gabbro, and anorthosite, with gabbro being the dominant component. Abundant dikes were emplaced during the late stage of magmatism, such as diabase dikes, sillite dikes, lamprophyre dikes, diorite dikes, and granite dikes. The dikes vary in width (0.5–3 m) and length (100–300 m), with diabase and sillite dikes mainly intruding into pyroxenite and gabbro bodies (Figure 1b).
3 Petrographic and mineralogical characteristics
The Puchang diabase shows a gray-green color in hand specimens (Figure 2a), with doleritic texture and massive structure, composed of pyroxene, plagioclase, and magnetite. Pyroxene occurs as anhedral to subhedral columnar grains (0.1–0.5 mm, accounting for about 25%), interspersed with subhedral magnetite grains, and the rock is mostly chloritized; plagioclase is subhedral to subhedral columnar, developed with polysynthetic twins (Figure 2b), with a particle size of 0.3–0.5 mm, accounting for about 70%; limonitized magnetite is anhedral granular, with a particle size of less than 0.2 mm, accounting for about 5%. The Puchang sillite is gray-black in hand specimens (Figure 2c), with porphyritic texture, doleritic groundmass, and massive structure, and phenocrysts of pyroxene and plagioclase can be seen. Microscopic observation shows that the phenocrysts are mainly clinopyroxene and plagioclase, and the groundmass is mainly composed of clinopyroxene, plagioclase and magnetite with doleritic texture (Figure 2d). The clinopyroxene (5%–10%) in the phenocrysts has larger particles, good euhedral degree, and is euhedral to subhedral particles with a particle size of 1′1.5 mm, some of which are polycrystalline; plagioclase (10%–15%) has good euhedral degree and a particle size of 1–1.5 mm. In the groundmass, euhedral fine plate-like labradorite is randomly distributed, and the surface still has secondary fine-grained zoisitization. Plagioclase (40%–60%) is strip-shaped with a particle size of 0.3–0.5 mm, between which fine pyroxene (25%–30%, 0.1–0.2 mm) and magnetite particles (5%–6%, 0.1–0.2 mm) are filled, and pyroxene is mostly replaced by calcite and chlorite.
FIGURE 2

Field and microscopic photographs of medium-grained barren diabase (a,b) and fine-grained mineralized diabase (c,d) from the Puchang intrusion. Mineral abbreviations: Cpx, Mineral abbreviations; Pl, Plagioclase; Mt, Magnetite.
4 Analytical methods
Fifteen fresh bedrock samples were collected in the field, of which two were used for zircon U-Pb dating and Hf isotope analysis, and thirteen for geochemical analysis. The sampling locations are shown in Figure 1.
4.1 Zircon U-Pb dating and Hf isotope analysis
Zircon picking, target fabrication, and photomicrography (transmitted/reflected light and cathodoluminescence, CL) were performed at the Hebei Institute of Regional Geological Survey. The separation followed standard procedures: after crushing and heavy-liquid/magnetic separation, euhedral, transparent zircon crystals free of inclusions were handpicked under a binocular microscope. Zircons were mounted in epoxy resin, polished to expose crystal cores, and imaged using transmitted/reflected light and CL microscopy to characterize their morphological and internal structural features. Zircon grains without obvious cracks or inclusions were selected for dating based on these images, ensuring analytical accuracy.
Zircon U-Pb isotopic analysis was performed using a GeoLas2005 laser ablation system coupled with an Agilent 7500a ICP-MS at Wuhan Sample Solution Analytical Technology Co., Ltd. The laser ablation was conducted with a spot diameter of 32 μm and He as the carrier gas. Zircon standard 91500 was used as the internal standard for U-Th-Pb isotope calibration, while GJ-1 served as the monitoring standard. For trace element calibration, NIST610 was employed as the external standard and 29Si as the internal standard. Detailed analytical procedures and instrument parameters are described in Liu et al. (2008). Zircon Hf isotope analysis was conducted using a LA-MC-ICP-MS at Wuhan Sample Solution Analytical Technology Co., Ltd., with the same laser ablation system (GeoLas2005) as the U-Pb dating. Hf isotope measurements were performed on the same spots or within the same growth zones as the U-Pb analyses, using a laser spot size of 44 μm. Detailed analytical procedures and calculation parameters follow (Hu et al., 2012). Zircon U-Pb and Hf isotope data were processed using ICPMSDataCal 12.8 software. Common Pb correction was applied following the method of Andersen (2002); Concordia diagrams and weighted mean ages were calculated using Isoplot 4.15 (Vermeesch, 2018).
4.2 Whole-rock geochemical analysis
After detailed petrographic identification in the laboratory, fresh and intact unaltered parts of samples were selected, with weathered, altered, or fractured portions removed by cutting, surface dust cleaned, and samples crushed to below 75 μm before being sent to ALS Analysts (Guangzhou) for whole-rock major and trace element analysis. Major elements were analyzed using a PANalytical PW2424 X-ray fluorescence spectrometer via a fusion method (ME-XRF26d), where samples were mixed with a lithium tetraborate–lithium nitrate flux containing lithium nitrate, fused at high temperature, poured into a platinum mold to form a glass disc for XRF analysis, and loss on ignition (LOI) was measured by heating at 1000 °C, with total oxides calculated by summing LOI and XRF results (relative error <5%). Rare earth elements were analyzed using method ME-MS81 on an inductively coupled plasma mass spectrometer (ICP-MS), involving fusion with a lithium metaborate flux at 1025 °C, digestion with nitric, hydrochloric, and hydrofluoric acids, and ICP-MS measurement (relative error <10%), with detailed procedures and precision described in Liu et al. (2008).
4.3 Whole-rock Sr-Nd isotope analysis
Whole-rock Sr–Nd isotope analysis was performed using a multi-collector inductively coupled plasma mass spectrometer (MC-ICP-MS) at Wuhan Sample Solution Analytical Technology Co., Ltd. The analytical procedure included: (1) digestion of 50–200 mg of whole-rock powder in a crucible at high temperature for >24 h, followed by evaporation to dryness and addition of hydrochloric acid; (2) separation of Rb, Sr, Sm, and Nd using ion-exchange resins, with collected solutions evaporated to dryness prior to analysis. Mass fractionation was corrected using 86Sr/88Sr = 8.3752 and 146Nd/144Nd = 0.7219 (Lin et al., 2016). Standardization was performed using BCR-2 and AGV-2, with measured values consistent with recommended values within error limits (Zhang et al., 2020). Detailed analytical protocols are described in Gao et al. (2004).
5 Analysis results
5.1 Zircon U-Pb dating results
To precisely constrain the formation age of the late-stage dikes, zircon U-Pb geochronological analyses were conducted on a diabase sample (TW24-1) and a sillite sample (TW34-1) collected from the field. Cathodoluminescence (CL) images reveal that zircons from both the diabase and sillite exhibit high euhedrality, occurring predominantly as euhedral to subhedral granular and prismatic crystals. The zircons range from 80 to 150 μm in size, with length-to-width ratios between 1:1 and 2:1. CL images display distinct magmatic oscillatory zoning (Figure 4), indicative of their magmatic origin (Hoskin and Schaltegger, 2003).
For each rock type, 20 representative zircon grains were selected for U-Pb dating, with analytical spots and results shown in Figure 3 and Table 1. The diabase sample (TW24-1) yielded 13 valid data points after correction, with most data points plotting on or near the concordia line in the U-Pb concordia diagram (Figure 4a); individual zircon 206Pb/238U ages range from 268 to 275 Ma, giving a weighted mean age of 273 ± 3 Ma (MSWD = 0.52). The sillite sample (TW34-1) provided 8 valid data points, with most data points falling on the concordia line (Figure 4c); individual zircon 206Pb/238U ages range from 271 to 275 Ma, yielding a weighted mean age of 272 ± 2 Ma (MSWD = 0.53). Collectively, these results indicate that both the diabase and sillite are products of Early Permian magmatic activity.
FIGURE 3

Zircon CL Images of Puchang Diabase and Sillite (The red solid circles and yellow dashed circles denote the U-Pb and Hf isotope analysis sites).
TABLE 1
| Sample spot no. | Pb(ppn) | Th(ppn) | U(ppn) | Th/U | 207Pb/206Pb | 207Pb/206Pb | 207Pb/235U | 207Pb/235U | 206Pb/238U | 206Pb/238U | 207Pb/206Pb | 207Pb/206Pb | 207Pb/235U | 207Pb/235U | 206Pb/238U | 206Pb/238U |
|---|---|---|---|---|---|---|---|---|---|---|---|---|---|---|---|---|
| Ratio | 1sigma | Ratio | 1sigma | Ratio | 1sigma | Age (Ma) | 1sigma | Age (Ma) | 1sigma | Age (Ma) | 1sigma | |||||
| Diabase from Puchang area, sample TW24-1 | ||||||||||||||||
| TW24-1-1 | 31 | 131 | 217 | 0.60 | 0.05605 | 0.00285 | 0.31825 | 0.01768 | 0.04381 | 0.00130 | 454 | 110 | 318 | 13 | 275 | 8 |
| TW24-1-2 | 42 | 159 | 303 | 0.53 | 0.05456 | 0.00286 | 0.31995 | 0.01803 | 0.04260 | 0.00158 | 394 | 119 | 312 | 13 | 275 | 10 |
| TW24-1-3 | 27 | 104 | 202 | 0.52 | 0.05641 | 0.00284 | 0.31915 | 0.01937 | 0.04318 | 0.00152 | 478 | 111 | 312 | 14 | 275 | 9 |
| TW24-1-4 | 303 | 1198 | 2067 | 0.58 | 0.05400 | 0.00152 | 0.31649 | 0.01203 | 0.04443 | 0.00123 | 372 | 63 | 302 | 9 | 273 | 8 |
| TW24-1-5 | 48 | 174 | 338 | 0.51 | 0.05590 | 0.00385 | 0.30750 | 0.01710 | 0.04108 | 0.00176 | 450 | 154 | 295 | 13 | 269 | 11 |
| TW24-1-6 | 81 | 331 | 492 | 0.67 | 0.05114 | 0.00316 | 0.31412 | 0.01588 | 0.04107 | 0.00142 | 256 | 143 | 277 | 12 | 274 | 9 |
| TW24-1-7 | 22 | 87 | 191 | 0.45 | 0.05285 | 0.00279 | 0.31106 | 0.01591 | 0.04523 | 0.00119 | 320 | 120 | 290 | 12 | 272 | 7 |
| TW24-1-8 | 24 | 90 | 212 | 0.42 | 0.05302 | 0.00321 | 0.31402 | 0.02012 | 0.04286 | 0.00110 | 328 | 137 | 293 | 15 | 274 | 7 |
| TW24-1-9 | 65 | 262 | 392 | 0.67 | 0.05389 | 0.00210 | 0.30235 | 0.01429 | 0.04206 | 0.00093 | 365 | 89 | 299 | 11 | 275 | 6 |
| TW24-1-10 | 21 | 88 | 208 | 0.43 | 0.05310 | 0.00270 | 0.30704 | 0.01948 | 0.04386 | 0.00105 | 332 | 115 | 295 | 15 | 274 | 6 |
| TW24-1-11 | 41 | 192 | 314 | 0.61 | 0.05416 | 0.00218 | 0.30370 | 0.01369 | 0.04293 | 0.00093 | 376 | 91 | 292 | 10 | 268 | 6 |
| TW24-1-12 | 31 | 138 | 238 | 0.58 | 0.05437 | 0.00240 | 0.31534 | 0.01704 | 0.04392 | 0.00111 | 387 | 100 | 301 | 13 | 274 | 7 |
| TW24-1-13 | 59 | 269 | 414 | 0.65 | 0.05103 | 0.00188 | 0.31495 | 0.01343 | 0.04326 | 0.00108 | 243 | 85 | 286 | 10 | 273 | 7 |
| Silite from Puchang area, sample TW34-1 | ||||||||||||||||
| TW34-1-1 | 811 | 3843 | 2460 | 1.56 | 0.05328 | 0.00116 | 0.30275 | 0.00824 | 0.04299 | 0.00089 | 339 | 45 | 284 | 6 | 271 | 5 |
| TW34-1-2 | 159 | 396 | 449 | 0.88 | 0.05387 | 0.00103 | 0.30248 | 0.00834 | 0.04266 | 0.00087 | 703 | 70 | 523 | 22 | 275 | 20 |
| TW34-1-3 | 84 | 248 | 365 | 0.68 | 0.05434 | 0.00149 | 0.30594 | 0.00743 | 0.04313 | 0.00094 | 433 | 59 | 426 | 10 | 272 | 7 |
| TW34-1-4 | 1865 | 8680 | 4570 | 1.90 | 0.05160 | 0.00087 | 0.31198 | 0.00712 | 0.04277 | 0.00090 | 333 | 39 | 276 | 6 | 274 | 6 |
| TW34-1-5 | 53 | 141 | 321 | 0.44 | 0.05698 | 0.00227 | 0.30365 | 0.00634 | 0.04275 | 0.00099 | 500 | 55 | 441 | 14 | 274 | 10 |
| TW34-1-6 | 1318 | 6356 | 2550 | 2.49 | 0.05664 | 0.00188 | 0.30981 | 0.01272 | 0.04258 | 0.00114 | 476 | 42 | 297 | 10 | 273 | 7 |
| TW34-1-7 | 18 | 55 | 82 | 0.67 | 0.06014 | 0.00315 | 0.31108 | 0.00882 | 0.04321 | 0.00095 | 609 | 108 | 468 | 20 | 273 | 11 |
| TW34-1-8 | 58 | 139 | 292 | 0.48 | 0.05350 | 0.00097 | 0.31364 | 0.00868 | 0.04353 | 0.00091 | 550 | 31 | 477 | 9 | 273 | 11 |
| TW34-1-9 | 14 | 251 | 194 | 1.29 | 0.05328 | 0.00116 | 0.31125 | 0.00737 | 0.04356 | 0.00079 | 492 | 11 | 376 | 11 | 274 | 9 |
| TW34-1-10 | 20 | 105 | 113 | 0.93 | 0.05387 | 0.00103 | 0.31365 | 0.00936 | 0.04346 | 0.00093 | 437 | 30 | 341 | 8 | 273 | 11 |
| TW34-1-11 | 41 | 192 | 133 | 1.44 | 0.05034 | 0.00149 | 0.31214 | 0.00956 | 0.04336 | 0.00107 | 574 | 12 | 323 | 11 | 274 | 6 |
| TW34-1-12 | 50 | 659 | 304 | 2.17 | 0.05160 | 0.00087 | 0.31247 | 0.00965 | 0.04265 | 0.00085 | 428 | 34 | 390 | 12 | 272 | 8 |
| TW34-1-13 | 44 | 292 | 204 | 1.43 | 0.05598 | 0.00227 | 0.31569 | 0.01236 | 0.04223 | 0.00123 | 426 | 13 | 268 | 6 | 274 | 12 |
Zircon U–Pb analytical results for the diabase and sillite intrusive rocks.
FIGURE 4

Zircon U-Pb concordia diagram and weighted mean age plot of Puchang diabase and sillite.
5.2 Major element characteristics
Major and trace element data for 13 samples of the Puchang diabase and sillite are presented in Table 2. The diabase exhibits limited variation in SiO2 (46.25%–49.98%), Al2O3 (14.47%–18.90%), and TiO2 (1.51%–2.64%), with total alkalis (Na2O + K2O) ranging from 4.34 to 5.77 wt%, plotting in the gabbro–monzogabbro field on the TAS diagram (Figure 5a). The rocks show low K2O (0.89%–1.43%) and MgO (2.50%–5.68%, Mg# = 55.99–59.72), high CaO (7.41%–9.48%) and TFe2O3 (9.13–14.53 wt%, TFeO = 4.45–7.69 wt%), and TFeO/MgO ratios of 1.29–2.41, classifying them as medium-high K calc-alkaline series (Figure 5b). The sillite has SiO2 contents of 50.25%–51.09%, stable Al2O3 (14.55%–17.62%) and TiO2 (1.07%–1.22%), with total alkalis of 2.77%–3.30%, plotting in the gabbro field (Figure 5a). It is characterized by lower K2O (0.54%–0.68%), higher CaO (9.19%–10.12%) and MgO (6.19%–7.71%, Mg# = 34.0–51.6), and moderate TFe2O3 (10.78–11.12 wt%, TFeO = 5.76–8.26%), with TFeO/MgO ratios of 0.93–1.09, indicating a low-K calc-alkaline affinity (Figure 5b). Harker diagrams (Figure 6) reveal positive correlations between MgO and SiO2, CaO, and weak negative correlations between MgO and TFe2O3/TiO2/Al2O3/P2O5 for both lithologies, reflecting magmatic differentiation trends.
TABLE 2
| Sample spot no. | TW-24-1 | TW-24-2 | TW-24-3 | TW-24-4 | TW-24-5 | TW-24-6 | TW-24-7 | TW-24-8 | TW34-1 | TW34-2 | TW34-3 | TW34-4 | TW34-5 |
|---|---|---|---|---|---|---|---|---|---|---|---|---|---|
| Lithology | Diabase | Diabase | Diabase | Diabase | Diabase | Diabase | Diabase | Diabase | Silite | Silite | Silite | Silite | Silite |
| SiO2 | 48.41 | 46.25 | 47.16 | 49.98 | 49.22 | 48.44 | 47.78 | 48.72 | 50.38 | 51.05 | 50.67 | 50.25 | 51.09 |
| Al2O3 | 16.51 | 15.61 | 14.47 | 18.90 | 17.04 | 15.67 | 16.57 | 17.62 | 14.55 | 15.33 | 17.62 | 16.92 | 15.46 |
| TFe2O3 | 10.35 | 11.74 | 14.53 | 9.13 | 11.08 | 12.41 | 11.29 | 10.80 | 12.12 | 11.99 | 10.85 | 10.78 | 11.54 |
| MgO | 3.50 | 3.70 | 4.54 | 3.08 | 4.32 | 5.68 | 2.50 | 4.17 | 7.71 | 6.89 | 6.19 | 6.55 | 6.30 |
| CaO | 7.41 | 7.82 | 8.22 | 8.27 | 7.85 | 8.02 | 9.48 | 8.86 | 9.51 | 9.19 | 9.41 | 10.12 | 9.98 |
| K2O | 1.43 | 0.96 | 1.08 | 0.89 | 1.05 | 1.25 | 1.32 | 1.20 | 0.54 | 0.59 | 0.68 | 0.58 | 0.63 |
| Na2O | 3.28 | 4.81 | 3.85 | 3.73 | 3.35 | 3.28 | 3.23 | 3.14 | 2.23 | 2.45 | 2.62 | 2.47 | 2.42 |
| TiO2 | 1.81 | 1.93 | 2.64 | 1.51 | 1.83 | 1.71 | 1.92 | 1.74 | 1.13 | 1.20 | 1.16 | 1.07 | 1.22 |
| P2O5 | 0.75 | 0.24 | 0.31 | 0.59 | 0.63 | 0.29 | 0.73 | 0.58 | 0.11 | 0.12 | 0.10 | 0.10 | 0.13 |
| MnO | 0.19 | 0.18 | 0.20 | 0.17 | 0.16 | 0.16 | 0.21 | 0.17 | 0.15 | 0.15 | 0.14 | 0.13 | 0.15 |
| FeO | 6.47 | 6.31 | 7.41 | 4.45 | 5.58 | 7.69 | 6.02 | 5.36 | 8.26 | 7.49 | 5.76 | 6.18 | 6.84 |
| Loss | 1.95 | 2.33 | 1.59 | 1.90 | 2.08 | 1.70 | 2.20 | 1.52 | 1.92 | 1.46 | 2.04 | 1.31 | 1.56 |
| La | 57.00 | 15.70 | 17.60 | 38.50 | 42.60 | 22.50 | 52.90 | 44.00 | 9.48 | 9.26 | 9.76 | 8.97 | 22.10 |
| Ce | 106.00 | 32.80 | 36.40 | 74.40 | 84.20 | 45.30 | 90.10 | 82.20 | 17.00 | 17.30 | 17.40 | 16.30 | 40.40 |
| Pr | 13.80 | 4.62 | 5.00 | 9.64 | 11.00 | 6.13 | 13.40 | 11.30 | 2.44 | 2.39 | 2.52 | 2.32 | 5.76 |
| Nd | 54.80 | 20.20 | 20.70 | 38.20 | 43.80 | 25.30 | 53.90 | 45.20 | 10.80 | 11.20 | 11.20 | 10.50 | 24.60 |
| Sm | 9.68 | 4.68 | 4.47 | 6.73 | 7.90 | 5.36 | 9.37 | 7.79 | 2.98 | 2.99 | 2.75 | 2.64 | 5.19 |
| Eu | 3.10 | 1.70 | 1.66 | 2.07 | 2.50 | 1.72 | 3.17 | 2.63 | 1.09 | 1.07 | 1.04 | 1.02 | 2.21 |
| Gd | 9.05 | 4.44 | 4.21 | 5.79 | 6.94 | 5.22 | 8.54 | 7.48 | 3.28 | 3.35 | 3.03 | 3.30 | 5.30 |
| Tb | 1.19 | 0.78 | 0.68 | 0.88 | 1.04 | 0.86 | 1.23 | 0.98 | 0.57 | 0.62 | 0.56 | 0.56 | 0.81 |
| Dy | 6.30 | 4.57 | 3.84 | 4.52 | 5.50 | 4.73 | 7.01 | 5.75 | 4.08 | 3.90 | 3.62 | 3.47 | 4.71 |
| Ho | 1.30 | 0.90 | 0.70 | 0.86 | 1.09 | 0.91 | 1.41 | 1.11 | 0.83 | 0.89 | 0.79 | 0.77 | 1.01 |
| Er | 3.42 | 2.34 | 1.89 | 2.22 | 2.79 | 2.46 | 3.60 | 3.17 | 2.40 | 2.33 | 2.05 | 2.20 | 2.48 |
| Tm | 0.52 | 0.40 | 0.32 | 0.38 | 0.46 | 0.40 | 0.54 | 0.45 | 0.35 | 0.36 | 0.32 | 0.30 | 0.37 |
| Yb | 2.96 | 2.44 | 2.04 | 2.15 | 2.70 | 2.34 | 3.22 | 2.70 | 2.15 | 2.30 | 2.00 | 2.04 | 2.20 |
| Lu | 0.50 | 0.35 | 0.28 | 0.33 | 0.39 | 0.32 | 0.52 | 0.45 | 0.37 | 0.41 | 0.32 | 0.33 | 0.34 |
| Y | 32.30 | 22.00 | 18.30 | 22.40 | 27.90 | 23.70 | 33.60 | 28.20 | 21.50 | 21.40 | 19.40 | 19.50 | 23.20 |
| Rb | 22.25 | 26.30 | 16.38 | 19.60 | 19.57 | 33.58 | 18.82 | 21.10 | 16.51 | 15.65 | 17.80 | 16.13 | 10.94 |
| Th | 8.25 | 3.20 | 3.68 | 4.89 | 5.19 | 3.22 | 3.64 | 2.98 | 1.30 | 1.68 | 1.66 | 1.40 | 2.00 |
| Ta | 1.88 | 1.30 | 1.68 | 2.08 | 1.81 | 1.25 | 2.18 | 1.87 | 0.48 | 0.58 | 0.65 | 0.53 | 1.54 |
| Nb | 37.21 | 18.36 | 24.22 | 33.43 | 32.24 | 19.36 | 28.66 | 23.01 | 7.90 | 7.60 | 8.38 | 7.12 | 16.67 |
| U | 1.11 | 0.54 | 0.55 | 0.81 | 0.83 | 0.49 | 0.78 | 0.71 | 0.21 | 0.26 | 0.19 | 0.23 | 0.46 |
| Sr | 635 | 624 | 359 | 747 | 675 | 533 | 583 | 680 | 231 | 213 | 283 | 283 | 531 |
| P | 3273 | 1047 | 1353 | 2575 | 2749 | 1266 | 3186 | 2531 | 480 | 524 | 436 | 419 | 1309 |
| Nd | 54.80 | 20.20 | 20.70 | 38.20 | 43.80 | 25.30 | 53.90 | 45.20 | 10.80 | 11.20 | 11.20 | 10.50 | 24.60 |
| Zr | 331.00 | 106.00 | 132.00 | 288.00 | 262.00 | 146.00 | 299.00 | 256.00 | 84.22 | 83.94 | 89.77 | 82.91 | 131.00 |
| Hf | 6.42 | 2.64 | 3.40 | 5.86 | 5.38 | 3.63 | 6.50 | 5.47 | 2.69 | 2.61 | 2.62 | 2.47 | 3.52 |
| Sm | 9.68 | 4.68 | 4.47 | 6.73 | 7.90 | 5.36 | 9.37 | 7.79 | 2.98 | 2.99 | 2.75 | 2.64 | 5.19 |
| Ti | 10847 | 11566 | 15822 | 9049 | 10967 | 10248 | 11507 | 10428 | 6772 | 7192 | 6952 | 6413 | 13844 |
| Y | 32.30 | 22.00 | 18.30 | 22.40 | 27.90 | 23.70 | 33.60 | 28.20 | 21.50 | 21.40 | 19.40 | 19.50 | 23.20 |
| Yb | 2.90 | 1.60 | 2.10 | 2.50 | 2.60 | 2.00 | 3.20 | 2.80 | 2.10 | 2.60 | 2.10 | 2.00 | 2.10 |
| Lu | 0.50 | 0.35 | 0.28 | 0.33 | 0.39 | 0.32 | 0.52 | 0.45 | 0.37 | 0.41 | 0.32 | 0.33 | 0.34 |
| Cr | 8.29 | 22.30 | 40.63 | 7.66 | 5.30 | 6.94 | 9.36 | 11.36 | 7.63 | 5.44 | 15.63 | 3.63 | 16.33 |
| Ni | 50.5 | 50.10 | 56.90 | 6.55 | 17.00 | 40.96 | 23.10 | 24.10 | 23.12 | 16.77 | 32.22 | 15.23 | 43.40 |
Analysis Results of Major Elements (%), Trace and Rare Earth Elements (×10⁻⁶) for Puchang Diabase and Silite.
FIGURE 5
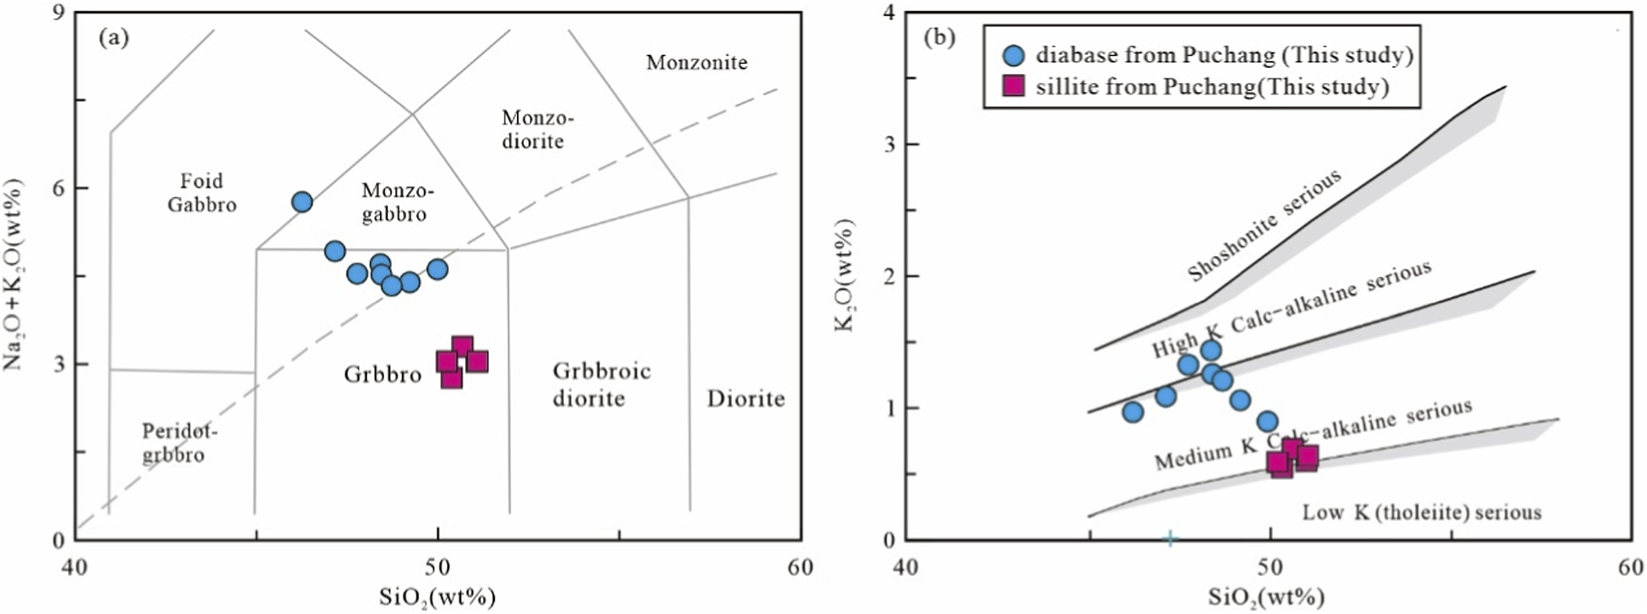
SiO2-ALK Diagram (a), (Middlemost, 1994) and SiO2-K2O Diagram (b), after (Rickwood, 1989).
FIGURE 6

Bivariate Diagrams (a–f) of MgO vs. Major Elements for Puchang Diabase and Sillite.
5.3 Rare earth and trace element characteristics
The diabase exhibits high total REE contents (95.92–269.62 × 10⁻⁶), with chondrite-normalized patterns (Figure 7a) showing LREE enrichment [(La/Yb)n = 4.62–13.81, (La/Sm)n = 2.17–3.80], slightly gentle-sloping HREE depletion [(Gd/Yb)n = 1.51–2.53], and weak positive Eu anomalies (δEu = 0.98–1.15). Primitive mantle-normalized spidergrams (Figure 7b) reveal prominent negative anomalies in Nb, Ta, Ti, and Y, alongside positive anomalies in Th, Sr, and Zr. The sillite has lower total REE (54.72–117.48 × 10⁻⁶, mean = 69.15 × 10⁻⁶), with chondrite-normalized plots (Figure 7c) showing weaker LREE/HREE fractionation [(La/Yb)n = 2.88–7.21, (La/Sm)n = 2.00–2.75], OIB-like patterns, and weak positive Eu anomalies (δEu = 1.00–1.28). Its primitive mantle-normalized spidergram (Figure 7d) indicates enrichment in incompatible elements (Rb, Th), depletion in high-field-strength elements (Nb, Ta), and positive Sr anomalies, reflecting subduction-related magmatism with crustal contamination.
FIGURE 7

REE Patterns and Trace Element Spider Diagrams (a–d) of Puchang Diabase and Sillite [OIB data after (Sun et al., 1989)].
5.4 Hf isotope characteristics
The Lu-Hf isotopic compositions of zircons are shown in Table 3. Zircons from the Puchang diabase and sillite display similar Hf isotopic compositions. The initial 176Hf/177Hf ratios range from 0.282513 to 0.282560 and 0.282529 to 0.282636, respectively, with corresponding εHf(t) values ranging from −2.52 to −0.45 and −1.23 to +2.47 (Figure 7a). These Hf isotopic characteristics are consistent with those of the previously studied Puchang complex (Figure 7a).
TABLE 3
| Sample spot no. | Age (Ma) | 176Yb/177Hf | 176Lu/177Hf | 176Hf/177Hf | 2σ | 176Hf/177Hfi | εHf(t) | T2DM (Ma) | 2σ |
|---|---|---|---|---|---|---|---|---|---|
| Diabase from Puchang area, sample TW24-1 | |||||||||
| TW24-1-1 | 271 | 0.012857 | 0.000447 | 0.282515 | 0.000014 | 0.28252 | 0.8 | 1013 | 0.37 |
| TW24-1-2 | 275 | 0.037992 | 0.001339 | 0.282541 | 0.000015 | 0.28254 | -1.5 | 1001 | 0.38 |
| TW24-1-3 | 272 | 0.010314 | 0.000368 | 0.282546 | 0.000015 | 0.28255 | 1.2 | 968 | 0.38 |
| TW24-1-4 | 274 | 0.026727 | 0.000988 | 0.282528 | 0.000012 | 0.28253 | -1.1 | 1010 | 0.43 |
| TW24-1-5 | 274 | 0.013717 | 0.000527 | 0.282537 | 0.000012 | 0.28254 | -1.5 | 985 | 0.35 |
| TW24-1-6 | 273 | 0.0115 | 0.000388 | 0.282534 | 0.000017 | 0.28254 | -1.8 | 986 | 0.35 |
| TW24-1-7 | 273 | 0.00808 | 0.000338 | 0.282513 | 0.000013 | 0.28252 | -2.4 | 1013 | 0.37 |
| TW24-1-8 | 273 | 0.014361 | 0.000524 | 0.282513 | 0.000014 | 0.28252 | 0.4 | 1018 | 0.36 |
| TW24-1-9 | 274 | 0.013861 | 0.000473 | 0.282537 | 0.000014 | 0.28254 | -1.5 | 983 | 0.34 |
| TW24-1-10 | 273 | 0.009562 | 0.000352 | 0.282539 | 0.000008 | 0.28255 | -1.4 | 977 | 0.36 |
| TW24-1-11 | 274 | 0.008448 | 0.000342 | 0.28256 | 0.000013 | 0.28257 | -0.8 | 948 | 0.47 |
| TW24-1-12 | 272 | 0.019534 | 0.000702 | 0.282538 | 0.000012 | 0.28254 | -0.5 | 989 | 0.46 |
| TW24-1-13 | 274 | 0.007202 | 0.000281 | 0.282545 | 0.000008 | 0.28255 | -1.1 | 968 | 0.49 |
| Silite from Puchang area, sample TW24-1 | |||||||||
| TW34–1-1 | 275 | 0.015579 | 0.000574 | 0.282599 | 0.000015 | 0.28262 | 1.2 | 950 | 0.32 |
| TW34–1-2 | 275 | 0.03825 | 0.001382 | 0.282529 | 0.000014 | 0.28254 | -1.1 | 1067 | 0.35 |
| TW34–1-3 | 275 | 0.009993 | 0.000404 | 0.282544 | 0.000013 | 0.28256 | -0.8 | 1022 | 0.47 |
| TW34–1-4 | 273 | 0.009913 | 0.000403 | 0.282596 | 0.000015 | 0.28261 | -1.2 | 950 | 0.43 |
| TW34–1-5 | 269 | 0.010593 | 0.000421 | 0.282564 | 0.000014 | 0.28258 | -0.1 | 995 | 0.39 |
| TW34–1-6 | 274 | 0.014611 | 0.000564 | 0.282588 | 0.000015 | 0.28261 | -0.9 | 965 | 0.3 |
| TW34–1-7 | 272 | 0.02542 | 0.001002 | 0.282565 | 0.000016 | 0.28258 | -0.3 | 1007 | 0.34 |
| TW34–1-8 | 274 | 0.01906 | 0.000737 | 0.282557 | 0.000013 | 0.28257 | 0.4 | 1012 | 0.47 |
| TW34–1-9 | 275 | 0.027687 | 0.001111 | 0.282636 | 0.000015 | 0.28265 | -2.5 | 909 | 0.41 |
| TW34–1-10 | 274 | 0.014395 | 0.000576 | 0.282571 | 0.000016 | 0.28259 | -0.2 | 990 | 0.35 |
| TW34–1-11 | 268 | 0.017216 | 0.000703 | 0.282572 | 0.000015 | 0.28259 | 0.2 | 993 | 0.42 |
| TW34–1-12 | 274 | 0.010152 | 0.000412 | 0.282533 | 0.000016 | 0.28255 | -1.2 | 1041 | 0.42 |
| TW34–1-13 | 273 | 0.017594 | 0.000675 | 0.282591 | 0.000017 | 0.28261 | -0.9 | 963 | 0.36 |
Hf isotopic compositions for zircons from Puchang Diabase and Sillite.
5.5 Sr-Nd isotope characteristics
The Sr-Nd isotope ratios are listed in Table 4. The initial (87Sr/86Sr)ᵢ ratios of diabase and sillite range from 0.70464 to 0.70582 and 0.70432 to 0.70491, respectively, with εNd(t) values ranging from 0.97 to 2.51 and 0.85 to 2.77. These data mainly fall within the evolution range of OIB (Figure 8b). Compared with other rocks in the TLIP, the Puchang diabase and sillite share similar Sr-Nd isotopic characteristics with the previously studied Puchang Complex and Wajilitag Complex. In contrast, they exhibit lower (87Sr/86Sr)ᵢ values and higher εNd(t) values than the Permian flood basalts in the TLIP (Figure 8b).
TABLE 4
| Sample no. | Lithology | Sample type | Rb (ug/g) | Sr (ug/g) | 87Rb/86Sr | 87Sr/86Sr | 2σ | (87Sr/ 86Sr)i | Sm (ug/g) | Nd (ug/g) | 147Sm/144Nd | 143Nd/144Nd | 2σ | εNd(t) |
|---|---|---|---|---|---|---|---|---|---|---|---|---|---|---|
| Diabase from Puchang area | ||||||||||||||
| TW24-1 | Diabase | Whole Rock | 14.321 | 80.58 | 0.1584 | 0.70771 | 17 | 0.70451 | 1.254 | 6.555 | 0.1649 | 0.516491 | 8 | 0.97 |
| TW24-2 | Diabase | Whole Rock | 14.321 | 80.58 | 0.0295 | 0.70648 | 9 | 0.70512 | 1.372 | 4.213 | 0.1961 | 0.516626 | 5 | 0.2 |
| TW24-3 | Diabase | Whole Rock | 12.667 | 236.8 | 0.0234 | 0.70667 | 9 | 0.70464 | 2.094 | 6.125 | 0.2017 | 0.516581 | 4 | 0.52 |
| TW24-4 | Diabase | Whole Rock | 15.933 | 526.9 | 0.0341 | 0.70673 | 10 | 0.70522 | 2.251 | 7.769 | 0.1519 | 0.516486 | 7 | 1.33 |
| Silite from Puchang area | ||||||||||||||
| TW-34-1 | Sillite | Whole Rock | 14.605 | 479.8 | 0.0287 | 0.70771 | 15 | 0.70431 | 1.164 | 5.163 | 0.1337 | 0.516429 | 11 | 0.85 |
| TW-34-2 | Sillite | Whole Rock | 15.338 | 602.6 | 0.0252 | 0.70662 | 8 | 0.70495 | 1.444 | 6.832 | 0.1574 | 0.516498 | 9 | 0.37 |
| TW-34-3 | Sillite | Whole Rock | 14.339 | 738.2 | 0.019 | 0.70643 | 10 | 0.70484 | 1.152 | 3.514 | 0.1192 | 0.516501 | 7 | 1.57 |
Sr-Nd isotopic compositions for Whole Rocks from Puchang Diabase and Sillite.
FIGURE 8

Diagrams (a) of εHf(t) vs. T(Ma) and Diagrams (b) of (87Sr/86Sr)ᵢ vs. εNd(t) after (Zhang et al., 2016). Data sources: DM, MORB, and OIB (Zindler and Hart, 1986); Kimberlitic rocks (Zhang et al., 2013); early Permian basalts (Zhou et al., 2009; Tian et al., 2010; Zhang et al., 2010; Yu et al., 2011; Li et al., 2012; Zhang et al., 2012); Fields for northern Tarim basement (Long et al., 2011); Wajilitag Complex and Puchang Complex (Zhang et al., 2016; Kong et al., 2021; Zhu et al., 2021).
6 Discussion
6.1 Magmatic evolution processes
The diabase and sillite samples show only minor chloritization with no other late-stage alteration minerals, supported by low and constant loss on ignition (LOI) values in major element analyses (Table 2), indicating minimal weathering. Transition elements (Ti, Ni, V), REEs, and high-field-strength elements (HFSEs: Nb, Ta, Zr, Y) exhibit low mobility (Polat et al., 2003), while elements like Rb, Ba, Cs, Yb, Hf, and Sr show strong correlations with Zr. Ce anomalies range from 0.83 to 1.02, and Sr content displays no significant negative correlation with LOI (Figure 9a), confirming negligible influence from metamorphism or alteration (Polat et al., 2003). Thus, this paper will also utilize these elements with poor mobility to carry out petrogenetic analysis and source region exploration.
FIGURE 9

LOI-Sr diagram (a) and Yb-Tb/Yb diagram (b) of Puchang diabase and sillite after (Dilek and Furnes, 2011).
Unlike the oceanic lithosphere, the continental lithosphere features a thick lithospheric mantle and crust. During the ascent and emplacement (or eruption) of mantle-derived magmas, these magmas undergo assimilation and contamination with continental lithospheric materials (Mcbirney and Creaser, 2003; Zhang et al., 2006; Namur et al., 2010). The diabase and sillite display variable Nb/U ratios of 32.41–44.04 and 29.23–44.11, respectively, which are close to the Nb/U ratio of oceanic basalt (47 ± 7), but significantly higher than that of continental crust (Hofmann et al., 1986). The primitive mantle and continental crust exhibit distinct trace element ratios. The diabase and sillite have Nb/Ta ratios of 12.30–19.79 and 10.82–16.46, respectively, and Zr/Hf ratios of 31.31–37.22 and 38.82–51.56, respectively, which lie between those of the primitive mantle (Nb/Ta = 17.7, Zr/Hf = 37) and continental crust (Nb/Ta = 11, Zr/Hf = 33) but are closer to the primitive mantle values (Sun et al., 1989). This indicates that crustal material contamination may have occurred during the magmatic evolution process. Additionally, some samples of diabase and sillite show slightly enriched Hf isotope compositions, and their two-stage model ages are relatively old, which can also be interpreted as the effect of crustal contamination. However, no positive correlation between (87Sr/86Sr)i ratio and MgO caused by continental crustal contamination is observed in the Puchang diabase and sillite. Moreover, the two types of samples show relatively consistent Sr-Nd-Hf isotopic characteristics (Figure 8), implying that crustal contamination during magma formation was not significant (Valley et al., 2005; Hawkesworth and Kemp, 2006; Kemp et al., 2006). Collectively, these lines of evidence suggest that the magmas of the Puchang diabase and sillite might have undergone some degree of crustal contamination during their ascent, though such contamination was not pronounced.
After magma formation, fractional crystallization typically occurs during its upward migration, leading to significant changes in certain elements. In the major element Harker diagrams (Figure 6), the negative correlations between TFe2O3, TiO2, and MgO indicate fractional crystallization of Fe-Ti oxides, while the positive correlation between CaO and MgO suggests clinopyroxene crystallization, consistent with the abundant pyroxene observed in petrography. The positive correlation between Al2O3 and MgO, together with the absence of obvious Eu anomalies (δEu = 0.99–1.27), suggests that plagioclase did not undergo fractional crystallization. Additionally, the Yb-Tb/Yb diagram (Figure 9b) also reveals a fractional crystallization trend.
Petrographic and whole-rock geochemical studies indicate that the Puchang diabase and sillite likely underwent fractional crystallization of Fe-Ti oxides and pyroxenes, as well as minor crustal contamination during their formation, while post-magmatic alteration was negligible. Consequently, the geochemical signatures of these samples closely approximate those of primitive magmas, enabling the reflection of mantle source characteristics and partial melting conditions.
6.2 Mantle source region
Both diabase and sillite are characterized by enrichment in Fe and Ti. Their evolutionary trends are evident in major element Harker diagrams (Figure 6). Trace element normalized patterns show similar distribution modes for both rocks (Figure 7), and their Sr-Nd-Hf isotopic characteristics are consistent in the (87Sr/86Sr)i-εNd(t) diagram (Figure 8). These observations suggest that diabase and sillite might have formed from fractional crystallization of the same parental magma.
It is generally accepted that basaltic magmas are derived from partial melting of mantle peridotite (Hirose and Kushiro, 1993; Walter, 2003), Due to the heterogeneity of the mantle, which contains different mantle end-members, partial melting of these distinct end-members can influence the chemical compositions of basaltic magmas (Falloon et al., 1988). During the melting process, incompatible components preferentially enter the magma, such as large ion lithophile elements, high field strength elements, and light rare earth elements, while compatible elements are basically independent of the degree of partial melting and can reflect the properties of the source region. Therefore, selecting elements with different compatibility can help determine the magma source region and the degree of partial melting. Simulation using the incompatible element Sm and the highly compatible element Yb can be used to identify the mantle source region. In the Sm-Sm/Yb and La/Sm-Sm/Yb diagrams (Figure 10), diabase and sillite mainly fall within the partial melting range of spinel-garnet lherzolite, suggesting that their source region may be a garnet-spinel lherzolite mantle source region.
FIGURE 10

Sm-Sm/Yb diagram (a) and La/Sm-Sm/Yb diagram (b), after (Aldanmaz et al., 2000).
The Puchang diabase and sillite display trace element partitioning patterns similar to those of OIB and depleted Sr-Nd-Hf isotopic characteristics. It is generally considered that Fe-Ti oxide-bearing intrusions with OIB-like features in the Emeishan Large Igneous Province (ELIP) may originate from the melting of slightly enriched asthenosphere (Zhou et al., 2005; Zhang et al., 2009; Bai et al., 2012). However, it is noteworthy that OIB-like features cannot be used as evidence for the asthenospheric mantle origin of the source region, because for some mafic-ultramafic rocks, the interaction between the depleted mantle source region and the enriched components emplaced in the late stage can also yield isotopic characteristics similar to those of OIB (LE Roex et al., 2003). Fortunately, in the northwestern TLIP, available kimberlitic rocks and their mantle xenoliths can represent the continental lithospheric mantle, as kimberlitic rocks are considered to originate from lithospheric mantle modified by ancient subducted materials. The samples in this study show consistent Sr-Nd-Hf isotopic trends with the Puchang complex and kimberlitic rocks, suggesting that the basaltic parental magma might have originated from the enriched lithospheric mantle rather than the convective asthenosphere or deep mantle plumes. Additionally, previous studies have indicated the presence of a strong and thick (approximately 140 km) modern lithosphere beneath the Tarim Craton (Neil and Houseman, 1997; Liu et al., 2004). Since no obvious magmatic events have been observed in the study area since the Permian, except for the intrusion of the Puchang complex, the northern Tarim Craton might not have experienced significant lithospheric thinning after the Early Permian. Therefore, the lithosphere could have been as thick as 140 km during the Permian period. A thick lithosphere (>130 km) may hinder the upwelling of mantle plumes, prevent their decompression melting, and restrict melting to the asthenosphere mantle (Turner et al., 1996; Storey et al., 1997; Jourdan et al., 2007; Foley, 2008). The long duration of magmatism in Tarim is also consistent with the time intervals of basaltic rocks in some continental large igneous provinces (such as the Paraná-Etendeka large igneous province and the Kerguelen Plateau). In these large igneous provinces, melting of thick lithospheric mantle (>100 km) occurred, and no melting took place in the underlying mantle plumes (Kent et al., 1992; White and McKenzie, 1995; Turner et al., 1996; Rao and Lehmann, 2011). Therefore, a reasonable interpretation is that for the magmatic system, the mantle plume most likely contributed heat but did not contribute significant melt. In addition, the northern margin of the Tarim Craton experienced subduction of oceanic lithosphere during the Neoproterozoic and Middle Paleozoic. It is generally considered that metasomatized lithospheric mantle with extremely high contents of Th, U, Rb, Sr, and LREE would promote enrichment of Sr-Nd isotopes (Mckenzie, 1989; Thompson and Gibson, 1994). However, the Nd and Hf isotopes of the intrusive rocks are depleted relative to most present-day terrestrial reservoirs, and the Paleozoic subduction process cannot account for these features. Arc-related magmatism occurred along the northern margin of the craton from the Early Silurian to the Late Permian, which is believed to have formed during the southward subduction of the Tianshan Ocean beneath the northern margin of the Tarim Craton (Ge et al., 2012; Huang et al., 2013). Thus, the lithospheric mantle beneath the Tarim Craton was metasomatized by slab-derived fluids/melts during the Middle Paleozoic subduction, thereby modifying the ancient lithospheric mantle (Wei et al., 2014).
To sum up, the primary magmas of the Puchang diabase and sillite can be regarded as the products of low-degree partial melting of metasomatized continental lithospheric mantle.
6.3 Tectonic setting
Based on the new chronological and geochemical data of this study, combined with the mantle plume-lithosphere interaction model proposed by previous studies, the evolutionary model of the TLIP can be summarized as follows: During the Early to Middle Paleozoic, there are abundant arc magmatic rocks that occur in the Korla area, the Tarim Craton, which is located in the south of the proposed South Tianshan Ocean (Figure 11a). These arc magmas are considered to be the products of the southward subduction of the South Tianshan Ocean (Ge et al., 2012). The subduction-derived components from the South Tianshan Ocean metasomatized the asthenospheric and lithospheric mantle. At approximately 300 Ma, a mantle plume reached the base of the thick Tarim lithosphere, inducing low-degree partial melting of fusible components in the lithospheric mantle to form kimberlitic rocks (Figure 11b). From 292 to 287 Ma, intense interaction between the lithosphere and mantle plume triggered large-scale melting of the enriched ancient lithospheric mantle, leading to the emplacement of massive flood basalts. Subsequently (283–274 Ma), thermal erosion by the mantle plume caused partial thinning of the Tarim lithosphere, and partial melting of the relatively depleted lithospheric mantle formed mafic-ultramafic complexes. The diabase and sillite in the study area, and regional dikes were formed during 273–272 Ma (Figure 11c). By 270 Ma and later, the ascending mantle plume underwent decompression melting, and the intense interaction between the lithosphere and mantle plume finally formed late-stage intrusive rocks and alkaline-rich rocks (Figure 11d). This evolutionary process reveals that the thermal perturbation of the mantle plume and the material properties of the lithosphere jointly controlled the spatiotemporal differentiation of magmatism in the TLIP.
FIGURE 11

Tectonic evolution model of the Tarim large igneous province (a–d) after (Ge et al., 2012; Zhang et al., 2016).
7 Conclusion
Zircon U-Pb dating of diabase and sillite yields weighted mean ages of 273 ± 3 Ma and 272 ± 2 Ma, respectively, indicating their emplacement during the Early Permian.
The source regions of diabase and sillite are metasomatized continental lithospheric mantle, possibly a garnet-spinel lherzolite assemblage. The magmas originated from low-degree partial melting of the lithospheric mantle, followed by fractional crystallization and crustal contamination during magmatic evolution.
Combining with the mantle plume-lithosphere interaction model proposed by predecessors, the diabase and sillite in this study might have formed in the late stage (290–270 Ma) of large-scale melting of the lithospheric mantle triggered by the upwelling of the mantle plume.
Statements
Data availability statement
The original contributions presented in the study are included in the article/supplementary material, further inquiries can be directed to the corresponding author.
Author contributions
DH: Writing – original draft. YL: Writing – review and editing. QZ: Writing – review and editing. HL: Writing – review and editing.
Funding
The author(s) declared that financial support was received for this work and/or its publication. Self-funded Exploration Project of Xinjiang Geological Bureau: Metallogeny and Prospecting Target Optimization of Strategic Mineral Resources in Kezilesu Kirgiz Autonomous Prefecture, Xinjiang (Project No.: XGMB202363).
Conflict of interest
The author(s) declared that this work was conducted in the absence of any commercial or financial relationships that could be construed as a potential conflict of interest.
Generative AI statement
The author(s) declared that generative AI was not used in the creation of this manuscript.
Any alternative text (alt text) provided alongside figures in this article has been generated by Frontiers with the support of artificial intelligence and reasonable efforts have been made to ensure accuracy, including review by the authors wherever possible. If you identify any issues, please contact us.
Publisher’s note
All claims expressed in this article are solely those of the authors and do not necessarily represent those of their affiliated organizations, or those of the publisher, the editors and the reviewers. Any product that may be evaluated in this article, or claim that may be made by its manufacturer, is not guaranteed or endorsed by the publisher.
References
1
Aldanmaz E. Pearce J. A. Thirlwall M. F. Mitchell J. G. (2000). Petrogenetic evolution of late Cenozoic, post-collision volcanism in western Anatolia, Turkey. J. Volcanol. Geotherm. Res.102 (1), 67–95. 10.1016/S0377-0273(00)00182-7
2
Andersen T. (2002). Correction of common lead in U–Pb analyses that do not report 204Pb. Chem. Geol.192 (1), 59–79. 10.1016/S0009-2541(02)00195-X
3
Bai Z. Zhong H. Naldrett A. J. Zhu W. Xu G. (2012). Whole-rock and mineral composition constraints on the genesis of the giant hongge Fe-Ti-V oxide deposit in the emeishan large igneous province, southwest China. Econ. Geol. Geol.107 (3), 507–524. 10.2113/econgeo.107.3.507
4
Bryan S. E. Ernst R. E. (2008). Revised definition of large igneous provinces (LIPs). Earth-Sci. Rev.86 (1), 175–202. 10.1016/j.earscirev.2007.08.008
5
Campbell I. H. (2007). Testing the plume theory. Chem. Geol.241 (3), 153–176. 10.1016/j.chemgeo.2007.01.024
6
Campbell I. H. Griffiths R. W. (1990). Implications of mantle plume structure for the evolution of flood basalts. Earth Planet. Sci. Lett.99 (1), 79–93. 10.1016/0012-821X(90)90072-6
7
Cao J. Wang C. Y. Xing C. Xu Y. (2014). Origin of the early Permian wajilitag igneous complex and associated Fe–Ti oxide mineralization in the tarim large igneous province, NW China. J. Asian Earth Sci.84, 51–68. 10.1016/j.jseaes.2013.09.014
8
Cheng Z. Zhang Z. Santosh M. Hou T. Zhang D. (2014). Carbonate- and silicate-rich globules in the kimberlitic rocks of northwestern tarim large igneous province, NW China: evidence for carbonated mantle source. J. Asian Earth Sci.95, 114–135. 10.1016/j.jseaes.2014.04.018
9
Cheng Z. Zhang Z. Hou T. Santosh M. Zhang D. Ke S. (2015). Petrogenesis of nephelinites from the tarim large igneous province, NW China: implications for mantle source characteristics and plume–lithosphere interaction. Lithos220-223, 164–178. 10.1016/j.lithos.2015.02.002
10
Cheng Z. Zhang Z. Hou T. Santosh M. Chen L. Ke S. et al (2017). Decoupling of Mg–C and Sr–Nd–O isotopes traces the role of recycled carbon in magnesiocarbonatites from the tarim Large Igneous province. Geochim. Cosmochim. Acta202, 159–178. 10.1016/j.gca.2016.12.036
11
Cheng Z. Zhang Z. Xie Q. Hou T. Ke S. (2018). Subducted slab-plume interaction traced by magnesium isotopes in the northern margin of the tarim large igneous province. Earth Planet. Sci. Lett.489, 100–110. 10.1016/j.epsl.2018.02.039
12
Dilek Y. Furnes H. (2011). Ophiolite genesis and global tectonics: geochemical and tectonic fingerprinting of ancient oceanic lithosphere. Geol. Soc. Am. Bull.123, 387–411. 10.1130/B30446.1
13
Falloon T. Green D. Hatton C. Harris K. L. (1988). Anhydrous partial melting of a fertile and depleted peridotite from 2 to 30 kb and application to basalt petrogenesis. J. Petrol.29, 1257–1282. 10.1093/petrology/29.6.1257
14
Foley S. (2008). Rejuvenation and erosion of the cratonic lithosphere. Nat. Geosci. - Nat. Geosci.1, 503–510. 10.1038/ngeo261
15
Gao S. Rudnick R. L. Yuan H. Liu X. Liu Y. Xu W. et al (2004). Recycling lower continental crust in the north China craton. Nature432 (7019), 892–897. 10.1038/nature03162
16
Ge R. Zhu W. Wu H. Zheng B. Zhu X. He J. (2012). The Paleozoic northern margin of the tarim craton: passive or active?Lithos142-143, 1–15. 10.1016/j.lithos.2012.02.010
17
Han B. He G. Wang X. Guo Z. (2011). Late Carboniferous collision between the tarim and kazakhstan–yili terranes in the Western segment of the south tian Shan orogen, central Asia, and implications for the northern Xinjiang, western China. Earth-Sci. Rev.109 (3), 74–93. 10.1016/j.earscirev.2011.09.001
18
Hawkesworth C. J. Kemp A. I. S. (2006). Using hafnium and oxygen isotopes in zircons to unravel the record of crustal evolution. Chem. Geol.226 (3), 144–162. 10.1016/j.chemgeo.2005.09.018
19
Hirose K. Kushiro I. (1993). Partial melting of dry peridotites at high pressures: determination of compositions of melts segregated from peridotite using aggregates of diamond. Earth Planet. Sci. Lett.114 (4), 477–489. 10.1016/0012-821X(93)90077-M
20
Hofmann A. W. Jochum K. P. Seufert M. White W. M. (1986). Nb and Pb in oceanic basalts: new constraints on mantle evolution. Earth Planet. Sci. Lett.79 (1), 33–45. 10.1016/0012-821X(86)90038-5
21
Hoskin P. W. O. Schaltegger U. (2003). The composition of zircon and igneous and metamorphic petrogenesis. Rev. Mineralogy Geochem. Mineralogy Geochem.53 (1), 27–62. 10.2113/0530027
22
Hu Z. Liu Y. Gao S. Liu W. Zhang W. Tong X. et al (2012). Improved in situ Hf isotope ratio analysis of zircon using newly designed X skimmer cone and jet sample cone in combination with the addition of nitrogen by laser ablation multiple collector ICP-MS. J. Anal. At. Spectrom.27 (9), 1391–1399. 10.1039/c2ja30078h
23
Huang H. Zhang Z. Santosh M. Zhang D. Zhao Z. Liu J. (2013). Early Paleozoic tectonic evolution of the south tianshan collisional belt: evidence from geochemistry and zircon U-Pb geochronology of the tie’reke monzonite pluton, northwest China. J. Geol.121 (4), 401–424. 10.1086/670653
24
Jin S. Zhang Z. Cheng Z. Xie Q. Fei X. Santosh M. et al (2019). Compositions of olivine from the wajilitag mafic-ultramafic intrusion of the Permian tarim large igneous province, NW China: insights into recycled pyroxenite in a peridotite mantle source. J. Asian Earth Sci.171, 9–19. 10.1016/j.jseaes.2018.11.023
25
Jin S. Wang Z. Li H. Liu L. (2025). Decarbonated eclogite in the mantle sources of the wajilitag mafic-ultramafic intrusion, Permian tarim Large Igneous province, NW China: evidence from Zn isotopes. J. Asian Earth Sci.291, 106710. 10.1016/j.jseaes.2025.106710
26
Jourdan F. Bertrand H. Schärer U. Blichert-Toft J. Féraud G. Kampunzu A. (2007). Major and trace element and Sr, Nd, Hf, and Pb isotope compositions of the karoo large igneous province, botswana-zimbabwe: lithosphere vs mantle plume contribution. J. Petrol.48, 1043–1077. 10.1093/petrology/egm010
27
Ju W. Hou G. (2014). Late Permian to Triassic intraplate orogeny of the southern tianshan and adjacent regions, NW China. Geosci. Front.5 (1), 83–93. 10.1016/j.gsf.2013.03.001
28
Kemp A. I. S. Hawkesworth C. J. Paterson B. A. Kinny P. D. (2006). Episodic growth of the gondwana supercontinent from hafnium and oxygen isotopes in zircon. Nature439 (7076), 580–583. 10.1038/nature04505
29
Kent R. W. Storey M. Saunders A. D. (1992). Large igneous provinces: sites of plume impact or plume incubation?Geology20 (10), 891–894. 10.1130/0091-7613(1992)020<0891:LIPSOP>2.3.CO;2
30
Kong W. Zhang Z. Cheng Z. Liu B. Santosh M. Wei B. et al (2021). Mantle source of tephritic porphyry in the tarim large igneous province constrained from Mg, Zn, Sr, and Nd isotope systematics: implications for deep carbon cycling. GSA Bull.134 (1-2), 487–500. 10.1130/B35902.1
31
LE Roex A. P. Bell D. R. Davis P. (2003). Petrogenesis of group I kimberlites from kimberley, South Africa: evidence from bulk-rock geochemistry. J. PetrologyJournal Petrology44 (12), 2261–2286. 10.1093/petrology/egg077
32
Li Z. Chen H. Song B. Li Y. Yang S. Yu X. (2011). Temporal evolution of the Permian large igneous province in tarim basin in northwestern China. J. Asian Earth Sci.42 (5), 917–927. 10.1016/j.jseaes.2011.05.009
33
Li Y. Li Z. Chen H. Yang S. Yu X. (2012). Mineral characteristics and metallogenesis of the wajilitag layered mafic–ultramafic intrusion and associated fe–ti–v oxide deposit in the tarim large igneous province, northwest China. J. Asian Earth Sci.49, 161–174. 10.1016/j.jseaes.2011.11.026
34
Li C. Zhang Z. Wang C. Cheng Z. Gao D. (2025). Tracking crystal-melt segregation and accumulation in mushy reservoirs: implication for silicic magma formation in tarim large igneous province. Lithos508-509, 108099. 10.1016/j.lithos.2025.108099
35
Lin J. Liu Y. Yang Y. Hu Z. (2016). Calibration and correction of LA-ICP-MS and LA-MC-ICP-MS analyses for element contents and isotopic ratios. Solid Earth Sci.1 (1), 5–27. 10.1016/j.sesci.2016.04.002
36
Liu S. Wang L. Li C. Li H. Han Y. Jia C. et al (2004). Thermal-rheological structure of lithosphere beneath the northern flank of tarim basin, western China: implications for geodynamics. Sci. China Ser. D Earth Sci.47 (7), 659–672. 10.1360/03yd0471
37
Liu Y. S. Hu Z. C. Gao S. Günther D. Xu J. Gao C. G. et al (2008). In situ analysis of major and trace elements of anhydrous minerals by LA-ICP-MS without applying an internal standard. Chem. Geol.257 (1-2), 34–43. 10.1016/j.chemgeo.2008.08.004
38
Long X. Yuan C. Sun M. Kröner A. Zhao G. Wilde S. et al (2011). Reworking of the tarim craton by underplating of mantle plume-derived magmas: evidence from Neoproterozoic granitoids in the kuluketage area, NW China. Precambrian Res.187 (1), 1–14. 10.1016/j.precamres.2011.02.001
39
Mcbirney A. Creaser R. (2003). The skaergaard layered series, part VII: sr and Nd isotopes. J. Petrol.44, 757–771. 10.1093/petrology/44.4.757
40
Mckenzie D. (1989). Some remarks on the movement of small melt fractions in the mantle. Earth Planet. Sci. Lett.95 (1), 53–72. 10.1016/0012-821X(89)90167-2
41
Middlemost E. A. K. (1994). Naming materials in the magma/igneous rock system. Earth-Sci. Rev.37 (3), 215–224. 10.1016/0012-8252(94)90029-9
42
Namur O. Charlier B. Toplis M. J. Higgins M. D. Liégeois J. Vander Auwera J. (2010). Crystallization sequence and magma chamber processes in the ferrobasaltic Sept iles layered intrusion, Canada. J. Petrol.51 (6), 1203–1236. 10.1093/petrology/egq016
43
Neil E. A. Houseman G. A. (1997). Geodynamics of the tarim Basin and the Tian Shan in central Asia. Tectonics16 (4), 571–584. 10.1029/97TC01413
44
Pirajno F. Seltmann R. Yang Y. (2011). A review of mineral systems and associated tectonic settings of northern Xinjiang, NW China. Geosci. Front.2 (2), 157–185. 10.1016/j.gsf.2011.03.006
45
Polat A. Hofmann A. W. Münker C. Regelous M. Appel P. W. U. (2003). Contrasting geochemical patterns in the 3.7–3.8 Ga pillow basalt cores and rims, isua greenstone belt, southwest Greenland: implications for postmagmatic alteration processes. Geochim. Cosmochim. Acta67 (3), 441–457. 10.1016/S0016-7037(02)01094-3
46
Rao N. V. C. Lehmann B. (2011). Kimberlites, flood basalts and mantle plumes: new insights from the deccan large igneous province. Earth-Sci. Rev.107 (3), 315–324. 10.1016/j.earscirev.2011.04.003
47
Rickwood P. C. (1989). Boundary lines within petrologic diagrams which use oxides of major and minor elements. Lithos22 (4), 247–263. 10.1016/0024-4937(89)90028-5
48
Storey M. Mahoney J. J. Saunders A. D. (1997). Cretaceous basalts in Madagascar and the transition between plume and Continental lithosphere mantle SourcesLarge igneous provinces: Continental, Oceanic, and planetary flood volcanism, 95–122.
49
Su Y. Zheng J. P. Liang L. Dai H. Zhao J. Chen M. et al (2017). Derivation of A1-type granites by partial melting of newly underplated rocks related with the tarim mantle plume. Geol. Mag.156, 1–21. 10.1017/S0016756817000838
50
Sun S. S. Mcdonough W. F. Sounders A. D. Norry M. J. (1989). Magmatism in the ocean basins, 42. London, Special Publication: Geological Society, 313.
51
Thompson R. N. Gibson S. A. (1994). Magmatic expression of lithospheric thinning across continental rifts. Tectonophysics233 (1), 41–68. 10.1016/0040-1951(94)90219-4
52
Tian W. Campbell I. H. Allen C. M. Guan P. Pan W. Chen M. et al (2010). The tarim picrite–basalt–rhyolite suite, a Permian flood basalt from northwest China with contrasting rhyolites produced by fractional crystallization and anatexis. Contrib. Mineral. Petrol.160 (3), 407–425. 10.1007/s00410-009-0485-3
53
Turner S. Hawkesworth C. Gallagher K. Stewart K. Peate D. Mantovani M. (1996). Mantle plumes, flood basalts, and thermal models for melt generation beneath continents: assessment of a conductive heating model and application to the Paraná. J. Geophys. Res. Solid Earth101 (B5), 11503–11518. 10.1029/96JB00430
54
Valley J. W. Lackey J. S. Cavosie A. J. Clechenko C. C. Spicuzza M. J. Basei M. A. S. et al (2005). 4.4 billion years of crustal maturation: oxygen isotope ratios of magmatic zircon. Contrib. Mineral. Petrol.150 (6), 561–580. 10.1007/s00410-005-0025-8
55
Vermeesch P. (2018). IsoplotR: a free and open toolbox for geochronology. Geosci. Front.9 (5), 1479–1493. 10.1016/j.gsf.2018.04.001
56
Walter M. (2003). Melt extraction and compositional variability in mantle lithosphere. Treatise Geochem.2, 363–394. 10.1016/B0-08-043751-6/02008-9
57
Wei X. Xu Y. Feng Y. Zhao J. (2014). Plume-lithosphere interaction in the generation of the tarim large igneous province, NW China: geochronological and geochemical constraints. Am. J. Sci.314, 314–356. 10.2475/01.2014.09
58
Wei X. Xu Y. He B. Zhang L. Xia X. Shi X. (2019). Zircon U-Pb age and Hf-O isotope insights into genesis of Permian tarim felsic rocks, NW China: implications for crustal melting in response to a mantle plume. Gondwana Res.76, 290–302. 10.1016/j.gr.2019.06.015
59
White R. S. Mckenzie D. (1995). Mantle plumes and flood basalts. J. Geophys. Res. Solid Earth100 (B9), 17543–17585. 10.1029/95JB01585
60
Xia L. Xu X. Li X. Ma Z. Xia Z. (2012). Reassessment of petrogenesis of carboniferous–early Permian rift-related volcanic rocks in the Chinese tianshan and its neighboring areas. Geosci. Front.3 (4), 445–471. 10.1016/j.gsf.2011.12.011
61
Xu Y. Wei X. Luo Z. Liu H. Cao J. (2014). The early Permian tarim large igneous province: main characteristics and a plume incubation model. Lithos204, 20–35. 10.1016/j.lithos.2014.02.015
62
Yang S. Li Z. Chen H. Santosh M. Dong C. Yu X. (2007). Permian bimodal dyke of tarim basin, NW China: geochemical characteristics and tectonic implications. Gondwana Res.12 (1), 113–120. 10.1016/j.gr.2006.10.018
63
Yu X. Yang S. Chen H. Chen Z. Li Z. Batt G. E. et al (2011). Permian flood basalts from the tarim basin, northwest China: SHRIMP zircon U–Pb dating and geochemical characteristics. Gondwana Res.20 (2), 485–497. 10.1016/j.gr.2010.11.009
64
Zhang Z. Wang F. S. Zhao L. Ai Y. Yang T. Z. (2006). Geochemistry of picritic and associated basalt flows of the Western emeishan flood basalt province, China: evidence for a plume-head origin. Acta Petrol. Sin.22, 1538–1552. 10.1093/petrology/egl034
65
Zhang C. Li X. Li Z. Ye H. Li C. (2008). A Permian layered intrusive complex in the Western tarim block, Northwestern China: product of a Ca. 275-Ma mantle plume?J. Geol. J. Geol.116 (3), 269–287. 10.1086/587726
66
Zhang Z. Mao J. Saunders A. D. Ai Y. Li Y. Zhao L. (2009). Petrogenetic modeling of three mafic–ultramafic layered intrusions in the Emeishan large igneous province, SW China, based on isotopic and bulk chemical constraints. Lithos113 (3), 369–392. 10.1016/j.lithos.2009.04.023
67
Zhang C. Xu Y. Li Z. Wang H. Ye H. (2010). Diverse Permian magmatism in the Tarim block, NW China: genetically linked to the Permian Tarim mantle plume?Lithos119 (3), 537–552. 10.1016/j.lithos.2010.08.007
68
Zhang D. Zhou T. Yuan F. Jowitt S. M. Fan Y. Liu S. (2012). Source, evolution and emplacement of Permian Tarim basalts: evidence from U–Pb dating, Sr–Nd–Pb–Hf isotope systematics and whole rock geochemistry of basalts from the keping area, Xinjiang uygur autonomous region, northwest China. J. Asian Earth Sci.49, 175–190. 10.1016/j.jseaes.2011.10.018
69
Zhang D. Zhang Z. Santosh M. Cheng Z. He H. Kang J. (2013). Perovskite and baddeleyite from kimberlitic intrusions in the Tarim large igneous province signal the onset of an end-carboniferous mantle plume. Earth Planet. Sci. Lett.361, 238–248. 10.1016/j.epsl.2012.10.034
70
Zhang D. Zhang Z. Huang H. Encarnación J. Zhou N. Ding X. (2014). Platinum-group elemental and Re–Os isotopic geochemistry of the Wajilitag and puchang Fe–Ti–V oxide deposits, northwestern tarim large igneous Province. Ore Geol. Rev.57, 589–601. 10.1016/j.oregeorev.2013.08.004
71
Zhang D. Zhang Z. Mao J. Huang H. Cheng Z. (2016). Zircon U–Pb ages and Hf–O isotopic signatures of the Wajilitag and Puchang Fe–Ti oxide–bearing intrusive complexes: constraints on their source characteristics and temporal–spatial evolution of the Tarim large igneous province. Gondwana Res.37, 71–85. 10.1016/j.gr.2016.05.011
72
Zhang W. Hu Z. Spectroscopy A. (2020). Estimation of isotopic reference values for pure materials and geological reference materials. At. Spectrosc.41, 93–102. 10.46770/as.2020.03.001
73
Zhou M. Robinson P. T. Lesher C. M. Keays R. R. Zhang C. Malpas J. (2005). Geochemistry, petrogenesis and metallogenesis of the Panzhihua Gabbroic layered intrusion and associated fe–ti–v oxide deposits, Sichuan Province, SW China. J. PetrologyJournal Petrology46 (11), 2253–2280. 10.1093/petrology/egi054
74
Zhou M. Zhao J. Jiang C. Gao J. Wang W. Yang S. (2009). OIB-like, heterogeneous mantle sources of Permian basaltic magmatism in the western Tarim basin, NW China: implications for a possible Permian large igneous province. Lithos113 (3), 583–594. 10.1016/j.lithos.2009.06.027
75
Zhou J. Huang Z. Zhou M. Zhu X. Muchez P. (2014). Zinc, sulfur and lead isotopic variations in carbonate-hosted Pb–Zn sulfide deposits, southwest China. Ore Geol. Rev.58, 41–54. 10.1016/j.oregeorev.2013.10.009
76
Zhu S. Huang X. Yang F. He P. (2021). Petrology and geochemistry of early Permian mafic–ultramafic rocks in the Wajilitag area of the southwestern Tarim large igneous province: insights into Fe-rich magma of mantle plume activity. Lithos398-399, 106355. 10.1016/j.lithos.2021.106355
77
Zindler A. Hart S. (1986). Chemical geodynamics. Annu. Rev. Earth Planet. Sci.14 (14), 493–571. 10.1146/annurev.ea.14.050186.002425
78
Zou S. Li Z. Song B. Ernst R. E. Li Y. Ren Z. et al (2015). Zircon U–Pb dating, geochemistry and Sr–Nd–Pb–Hf isotopes of the Wajilitag alkali mafic dikes, and associated diorite and syenitic rocks: implications for magmatic evolution of the Tarim large igneous province. Lithos212-215, 428–442. 10.1016/j.lithos.2014.09.005
Summary
Keywords
Tarim large igneous province, mafic dikes, zircon U-Pb dating, Sr-Nd-Hf isotopes, magmatic source region
Citation
Hu D, Li Y, Zhang Q and Li H (2026) Zircon U-Pb dating, geochemistry, and Sr-Nd-Hf isotopes of the Puchang mafic dikes: implications for magmatic evolution of the Tarim large igneous province. Front. Earth Sci. 13:1727055. doi: 10.3389/feart.2025.1727055
Received
17 October 2025
Revised
17 November 2025
Accepted
12 December 2025
Published
09 January 2026
Volume
13 - 2025
Edited by
Hui Yang, China University of Mining and Technology, China
Reviewed by
Abulimiti Aibai, Chinese Academy of Sciences (CAS), China
Xiaohui Sun, Chang’an University, China
Updates
Copyright
© 2026 Hu, Li, Zhang and Li.
This is an open-access article distributed under the terms of the Creative Commons Attribution License (CC BY). The use, distribution or reproduction in other forums is permitted, provided the original author(s) and the copyright owner(s) are credited and that the original publication in this journal is cited, in accordance with accepted academic practice. No use, distribution or reproduction is permitted which does not comply with these terms.
*Correspondence: Qiang Zhang, wbailin@126.com
Disclaimer
All claims expressed in this article are solely those of the authors and do not necessarily represent those of their affiliated organizations, or those of the publisher, the editors and the reviewers. Any product that may be evaluated in this article or claim that may be made by its manufacturer is not guaranteed or endorsed by the publisher.