Abstract
The volume of mineral resources big data is rapidly increasing due to geological exploration and mining activities. Such data are characterized by multi-source heterogeneity, complex structures, and unclear interrelationships. Knowledge Graph (KG), with its powerful capabilities in knowledge structuring, semantic association, and intelligent reasoning, is being increasingly applied in the field of mineral resources, highlighting its growing importance. This paper focuses on methodological innovations for the rapid and efficient construction of KG in the mineral resources domain. Taking strategically significant hydrothermal tungsten deposits as the research subject, and addressing the limitations of traditional KG construction methods in terms of efficiency, automation, and processing massive unstructured text, we introduce large language model (LLM) technology to develop a rapid KG construction framework characterized by “LLM-driven approach guided by mineral resources knowledge.” A case study of the Dajishan Tungsten Mine KG was conducted, and the TOPSIS method was employed to deeply explore its prospecting indicators. By integrating direct prospecting indicators, potential prospecting indicators, and auxiliary prospecting information, a prospecting model for hydrothermal tungsten deposits in the Nanling region was established, providing valuable references for mineral exploration. Furthermore, a knowledge base constructed based on this KG demonstrates significant improvements in various capabilities, particularly in deep reasoning, compared to traditional knowledge bases. The research shows that the KG, developed through the integration of LLM technology, not only greatly enhances the speed and scale of integrating key information but also enables in-depth mining of prospecting information, demonstrating strong application potential.
1 Introduction
Tungsten (W), niobium (Nb), and tantalum (Ta) are rare metals characterized by high melting and boiling points. Their exceptional properties, including high-temperature resistance, corrosion resistance, high strength, and hardness, make them indispensable strategic key materials widely used in aerospace, electronics, chemicals, cemented carbides, and the nuclear industry. Global focus on tungsten, niobium, and tantalum resources is increasing. Major world powers, including China, the United States, the European Union, Russia, and Japan, have listed these metals in their key mineral catalogues, strengthening geological prospecting, exploration evaluation, and improving the comprehensive utilization level of these resources (Chen et al., 2025; Chen, 2021; Chen, 2024). The Dajishan Tungsten Deposit is a famous super-large tungsten polymetallic deposit in southern Jiangxi Province, China, hosting quartz-vein-type wolframite ore bodies and granite-hosted tantalum-niobium-tungsten ore bodies. Quartz-vein wolframite is characterized by high ore grade, relatively simple mineral composition, and low beneficiation cost. Since the late 19th century, major global tungsten producers have primarily mined quartz-vein-type wolframite, which supplied 70%–80% of the world’s tungsten throughout the 20th century. Since the 21st century, advancements in exploration and mineral processing technologies, alongside the overexploitation of wolframite, have shifted focus towards scheelite. Nevertheless, quartz-vein-type wolframite deposits remain a cornerstone of the current tungsten supply. As a typical hydrothermal quartz-vein-type wolframite deposit in South China, the study of the Dajishan Tungsten Deposit holds significant theoretical and practical importance. The research outcomes can provide crucial theoretical support and exploration model references for deep and concealed ore-body exploration, regional mineral resource potential assessment, and prospecting breakthroughs in similar metallogenic belts (Figure 1).
FIGURE 1

Regional geological simplified map of Dajishan mining area (after Zhang, 2012).
Extensive research has been conducted on the Dajishan Tungsten Deposit’s geological characteristics, ore-forming fluid evolution, and diagenetic-mineralization ages. Initial studies date back to the 1960s, with Jiang Qijie and colleagues conducting pioneering work on metallogenic characteristics and vein features. Subsequent contributions include: Zhang on the geological and petrochemical characteristics of the granitic pluton (Zhang, 1974; Zhang, 1975; Zhang, 1981); Lu on rock formation and mineralization temperatures (Lu, 1974); Liu Zhiqing et al. on the metallogenic structure, identifying the trapezoidal structure of ore-bearing fissures; (Zhang, 1974) with comprehensive discussions on geological conditions, deposit characteristics, genesis, and diagenetic-mineralization models; Teng Jiande on the vertical zoning model of mineralization (Teng, 1990); Zhuang Longchi on stable isotope geochemistry (Zhuang, 1991); Kong Zhaoqing on the ore-controlling effects of granite and the diagenetic-mineralization evolution (Kong, 1982); Zhang Guoxin et al. on stable isotope geochemical characteristics across different metallogenic stages (Zhang and Xie, 1997); Que Meideng and Liu Weiming proposing a magmatic liquid separation metallogenic model (Liu and Zhong, 1996; Que and Xia, 1988); Yang on peripheral granite weathering crust-type rare earth deposits (Yang, 1999); Hua Renmin comparing geochemical characteristics of granites in Piaotang and Dajishan (Hua, 2003); Cao Zhongqing proposing the ‘Five Floors + Basement’ prospecting model (Cao, 2004); Jiang Guohao, Qiu Jiansheng, and Zhang Wenlan studying the metallogenic age (Jiang, 2004; Qiu, 2004; Zhang, 2006); Shi Nianghua providing a preliminary analysis of the deep metallogenic potential in the northern ore zone; and Xi Binbin et al. conducting detailed studies on ore-forming fluids (Xi, 2008). The numerous academic papers, monographs, and research reports generated by these scholars have laid a solid foundation for this study.
The advent of the big data era has propelled the digitization of geological literature, leading to the creation of specialized databases (Zhou, 2017). The KG, a structured semantic knowledge base for describing concepts, entities, events, and their relationships in the physical world, has been widely applied in mineral resources big data (Ma, 2022). Its powerful capabilities in structured knowledge representation and intelligent reasoning make it an efficient tool for intelligent geological entity association, target prediction, production supervision, and supply chain traceability (Chen et al., 2020; Chen, 2021; Qian et al., 2023). Traditional KG construction methods, however, suffer from several drawbacks. Their core relies on training neural network models for natural language processing (NLP), often requiring specialized models for different knowledge extraction tasks. This approach is highly dependent on domain experts for ontology design, necessitates manual rule formulation for knowledge fusion, and requires model retraining and fine-tuning for updates, preventing real-time dynamic updates and resulting in high overall construction costs. Therefore, addressing the low automation, high cost, and poor effectiveness of traditional KG construction methods holds significant research value and practical importance. Current application research of KG in the mineral resources field is gradually increasing. This includes: (1) field review studies identifying core challenges like the lack of ontology standardization and outlining future directions such as mining policy KG (Hofer et al., 2024b; Zhou, 2021); (2) using KG to analyze journals and articles to identify research trends, high-frequency keywords, and technology hotspot migration paths (Liu et al., 2025; Nong et al., 2024); (3) constructing KG at multiple scales—from minerals to metallogenic belts to mines. At the mineral level, KG of mineral attributes-genesis-distribution support resource potential assessment and prospecting prediction (Feng, 2025; Peng and Lin, 2024; Sun, 2021; Zhang, 2023). At the metallogenic belt level, integrating structural evolution, magmatic activity, and spatiotemporal deposit data into regional metallogenic KG assists in delineating prospecting targets (Liu et al., 2022; Zhang, 2024). At the mine level, integrating geology, mining, and environmental data into mine lifecycle KG promotes intelligent decision-making, safety management, and prospecting for similar deposits in the same area (Li, 2024; Pei et al., 2022). (4) Enhancing KG construction methodology by adopting advanced techniques like multi-modal fusion and graph neural network optimization to improve model performance (Feng et al., 2024; Knollmeyer et al., 2025; Roll et al., 2025). Most current research constructs KG using neural networks and Transformer models, which require iterative training, high computational cost, and massive data samples, resulting in low construction efficiency. Furthermore, these KG are often static, with high reconstruction costs and lacking dynamic update capabilities and timeliness.
The LLM is an artificial intelligence system based on deep learning (de Mello Koch et al., 2016; Yang et al., 2024). Trained on massive text data, it learns the patterns, grammar, and knowledge of human language to understand, generate, and process natural language. Its evolution has progressed from statistical methods to neural networks, to the ‘pre-training + fine-tuning’ paradigm under the Transformer architecture, and finally into the era of large-scale models and emergent intelligence. The primary advantage of LLM is their capacity to absorb massive data during training. This makes LLM highly valuable for traditional industries like mineral resources, which rely heavily on historical experience and vast datasets. Many scholars have utilized LLM for research and applications in the mineral resources field: (1) using LLM to extract information from massive geological texts for knowledge fusion and reasoning: Wang Yan et al. proposed a BERT-based nested named entity recognition model for complex geological data, while Oliver Raymond et al. enhanced the accuracy of LLM-based information extraction from geological literature; (2) applying LLM for mineral resource prediction and evaluation: Wang employed BERT to identify prospecting indicators of porphyry copper deposits (Wang, 2024), Ding Ke et al. utilized deep learning for resource prediction in the East Kunlun–West Qinling metallogenic belt, and Chen Guoxiong et al. applied machine learning to reveal metallogenic patterns and predict spatiotemporal distribution of porphyry deposits; (3) exploring multimodal understanding capabilities of LLM: Dylan Mikesell et al. processed seismic waveform data, gravity anomaly maps, and geological descriptions using LLM, and Zhou Bo et al. applied LLM to analyze remote sensing imagery and geological maps; (4) constructing mineral resource knowledge bases with LLM: Zhang Liang et al. developed an intelligent question-answering and knowledge management system for mines, and Perez et al. trained a specialized model for mining economics. Through these researches and applications, LLM performance has been significantly enhanced. Utilizing LLMs for KG construction can solve the high cost and low efficiency problems inherent in traditional methods.
This study focuses on using LLMs for the rapid construction of KGs in the mineral resources field, establishing a high-performance knowledge base for relevant geological data, and broadening the application scope of KG. Through the improvement of traditional KG construction methodologies, the efficiency of KG development has been significantly enhanced. The workflow is as follows: Firstly, an LLM is used to perform knowledge extraction, knowledge fusion, and knowledge storage on pre-processed literature and data related to the Dajishan Tungsten Deposit, constructing a KG for the mineral resources domain. Secondly, a GraphRAG workflow is implemented by leveraging the constructed KG. The interconnected nature of the graph provides the LLM with complex relational information, enabling more sophisticated reasoning. Thirdly, node and relationship information is extracted from the KG to identify prospecting indicators and develop a prospecting model for the Dajishan deposit. Section 2 outlines the methodology and data. Sections 3–5 detail the constructed KG, the derived prospecting indicators, and the knowledge base, respectively. Finally, Sections 6 and 7 present the discussion and conclusions.
2 Methods and data
2.1 Running environment establishment
Prior to initiating graph construction, the model runtime environment must be established. The primary steps involve creating a virtual environment, installing required dependencies, initializing the project, specifying model operational parameters, and optimizing prompts.
The implementation of GraphRAG relies on numerous Python libraries and models of specific versions. To ensure reproducibility and avoid version conflicts, a virtual environment was created using Conda, guaranteeing system stability and security. Essential environment dependencies were installed within this virtual environment, including but not limited to: graphrag = 0.3.0 for knowledge extraction, graph construction, and graph-enhanced retrieval-augmented generation; tiktoken = 0.7.0 for text tokenization and counting; pydantic = 2.8.2 for data validation and settings management; aiohttp = 3.10.3 and asyncio = 3.4.3 as performance enhancement engines; fastapi = 0.112.0 and uvicorn = 0.30.6 for providing application interfaces; and neo4j = 5.28.2 as the graph database. The aforementioned items constitute the core environmental dependencies essential for building the GraphRAG project. A substantial number of additional supporting and general-purpose dependencies used in this study are not exhaustively listed here to maintain focus. The initial GraphRAG project structure was automatically established by leveraging the index module within the graphrag package. Furthermore, a YAML file was employed for parameter configuration to achieve a separation between configuration and code, thereby enhancing the project’s maintainability, reproducibility, and security. This YAML file defines all specific parameters and settings for the entire project. The main parameter configurations are as follows: Before KG construction, the types of entities to be extracted must be predefined. This study predefines entity types into seven categories: mineral, rock, element, age, chemistry, deposit, and structure. Entity types are predefined based on the research field and objectives of this study. If other research fields are involved, they can be adjusted or customized as required. For model selection in KG construction, given that the majority of raw training data is in Chinese, the Qwen series was prioritized for its robust Chinese comprehension capabilities. Considering hardware constraints while pursuing optimal performance and response efficiency, the Qwen-plus model was selected as the conversational model. This model supports a maximum input length of 130,000 tokens, with performance metrics of 15,000 Requests Per Minute (RPM) and 5,000,000 Tokens Per Minute (TPM). It undertakes core tasks in the KG pipeline, including natural language understanding, text generation, knowledge extraction, reasoning, and validation. Meanwhile, the text-embedding-v3 model was adopted as the embedding model, featuring a maximum input length of 8,192 tokens, 1,800 RPM, and 1,200,000 TPM. Its primary function is converting discrete symbols into real-valued vectors, thereby facilitating semantic understanding, similarity computation, and knowledge fusion during the KG construction process. Comprehensive details regarding the models, parameters, scales, and configurations utilized in the extraction process are not provided in an exhaustive list here. To better guide and constrain the LLM, prompts are necessary to provide specific instructions, define task objectives and output specifications, and control the model’s behavior during the process. This study utilizes the prompt_tune module within the graphrag package to automatically generate and customize model prompts for the GraphRAG project.
2.2 LLM-powered knowledge graph construction
The core of constructing the KG using LLM lies in the fact that after training on massive amounts of data, the model internally forms an implicit, parameterized “knowledge base.” The process of building the KG involves converting such implicit, unstructured knowledge into explicit, structured knowledge—specifically, the triples that constitute the KG. The KG construction pipeline is generally divided into four stages: knowledge extraction, knowledge fusion, knowledge storage, and knowledge reasoning (Figure 2). The LLM plays a pivotal role in every step of this construction process, significantly enhancing the efficiency of KG development.
FIGURE 2

Knowledge graph construction framework diagram.
Knowledge extraction involves extracting structured knowledge elements—including entities, relations, and attributes—from the preprocessed dataset. Entity recognition, which identifies specific types of objects mentioned in the text, constitutes the fundamental task of knowledge extraction. By utilizing automatically generated or customized Prompt prompts, entities, relations, and entity triples are directly extracted from the text without constraining relation types. This approach enables batch processing of massive text data and better handles complex linguistic phenomena.
Knowledge fusion refers to the integration, disambiguation, and association of knowledge extracted from different sources to form a unified, consistent, and high-quality knowledge base. The LLM is used to assess entities based on their contextual descriptions, source credibility, and contextual consistency.
Knowledge storage involves persisting the fused structured knowledge into a database for efficient querying and reasoning. The Neo4j graph database, optimized for storing and querying graph-structured data, was selected as the storage database.
Knowledge reasoning is the process of inferring novel, implicit knowledge from existing information within the KG. By employing the LLM, new triples are generated to complete the graph by adding missing commonsense and implicit connections. These inferred triples are subsequently integrated into the KG following rule-based or manual verification.
2.3 Knowledge graph node evaluation based on the TOPSIS method
The TOPSIS algorithm ranks alternatives by constructing a decision matrix, identifying the ideal best and worst solutions, and calculating the relative closeness of each evaluation object to these ideal solutions, thereby selecting the optimal scheme. This study employs the TOPSIS algorithm, treating each node in the KG as a decision alternative. Metrics for measuring node centrality—namely, degree centrality, closeness centrality, betweenness centrality, and eigenvector centrality—along with metrics for assessing node influence—PageRank and Katz centrality, are selected to construct the decision matrix. The distances and relative closeness of each alternative to the ideal best and worst solutions are computed to determine the ranking of association tightness among nodes in the KG, consequently establishing the ranking of potential relevance between nodes and mineral prospecting.
2.3.1 Calculating indicator weights
The entropy weight method is used to calculate the weight of each indicator, and the data are weighted accordingly. The entropy weight method utilizes entropy to judge the degree of dispersion of an indicator; the greater the dispersion of an indicator, the greater its impact on the comprehensive evaluation.
2.3.2 Constructing the decision matrix
Assuming the total number of nodes in the network is n, there are n decision alternatives. The number of node importance evaluation indicators is m, and the indicator value for each node in the network is , ; . The initial decision matrix X is constructed as follows (Equation 1):
The indicator values in the decision matrix are normalized to obtain , calculated as follows (Equation 2):
The normalized matrix is as follows (Equation 3):
2.3.3 Determining the ideal best and worst solutions
The ideal best solution represents the combination of the maximum values for each indicator, while the ideal worst solution represents the combination of the minimum values. Let the optimal value for each column (benefit-oriented indicator) be , and the worst value for each column (cost-oriented indicator) be , then (Equations 4, 5):
Calculating the Distance of Each Alternative to the Ideal Best and Worst Solutions, and , as follows (Equations 6, 7):
Calculating the Relative Closeness of Each Alternative to the Ideal Best and Worst Solutions, as follows (Equation 8):
2.4 Knowledge base capability evaluation methods
You may insert up to 5 heading levels into your manuscript as can be seen in “Styles” tab of this template. These formatting styles are meant as a guide, as long as the heading levels are clear, Frontiers style will be applied during typesetting.
The dialogue model of the GraphRAG workflow was compared with that of a traditional RAG dialogue model. To balance domain expertise and operational feasibility, an evaluation scheme incorporating a manually curated dataset and quantifiable metrics was adopted.
First, a question set was developed covering sub-domains such as metallogenic geological background, mineralization mechanisms, and deposit types and characteristics. This set included questions stratified by difficulty and type (factual, analytical, advisory), and was reviewed by geological experts for accuracy of questions and answers. For other fields, question sets should be formulated based on specific requirements.
Second, representative evaluation metrics were computed, including the proportion of exact matches, precision, recall, and F1-score.
Precision refers to the proportion of correct answers among those provided by the model, measuring the quality of the model’s responses (Equation 9). Recall refers to the proportion of samples that should have been answered for which the model actually provided a response, measuring the breadth of knowledge covered by the model (Equation 10). The F1-score is the harmonic mean of precision and recall, a common metric for comprehensively balancing the two; a higher value indicates better performance (Equation 11).
Precision:
Recall:
F1-score:
TP is the number of samples correctly identified by the model, PP is the number of samples partially correctly identified, FP is the number of samples incorrectly identified, FN is the number of samples not identified by the model, and w is the weight coefficient for correct portions within partially correct samples.
Third, manual evaluation was conducted on the logical consistency, domain terminology accuracy, and correctness in answering complex questions.
2.5 Data sources
The training data used in this study were sourced from the CNKI and Web of Science databases. Research literature related to the geological background, mineralogy, geochemistry, and mineralization of the Dajishan tungsten deposit was retrieved. The search timeframe was limited from 2000 to 2025. Only documents whose main content was in PDF format were retained, and literature with fewer than 5 pages was excluded to ensure the inclusion of standard research papers. For other fields, appropriate training data should be selected based on specific requirements. Through this retrieval and screening process, over 100 relevant documents were obtained as raw data. The main text information was extracted and underwent preliminary processing for KG construction.
3 The KG of the Dajishan tungsten mine
Preparatory work for graph construction was completed by setting up the model runtime environment. The workflow for constructing the graph index using LLM is as follows: The index module of the graphrag package was called to parse parameters and coordinate the KG construction pipeline; the openai package handled entity extraction, relation extraction, summary generation, and vector representation; packages including pickle, tiktoken, numpy, and aiohttp provided auxiliary support. The implemented KG index construction workflow included: text chunking, entity extraction, disambiguation, and merging → building the graph skeleton, extracting relations, forming the knowledge network → discovering communities, generating summaries → establishing traceability links, and saving results. The constructed KG was saved locally in Parquet format. As this format is unsuitable for complex queries and visualization, pandas and neo4j were used to transfer and reconstruct the graph into Neo4j, enabling visualization and complex querying of the Dajishan tungsten deposit KG.
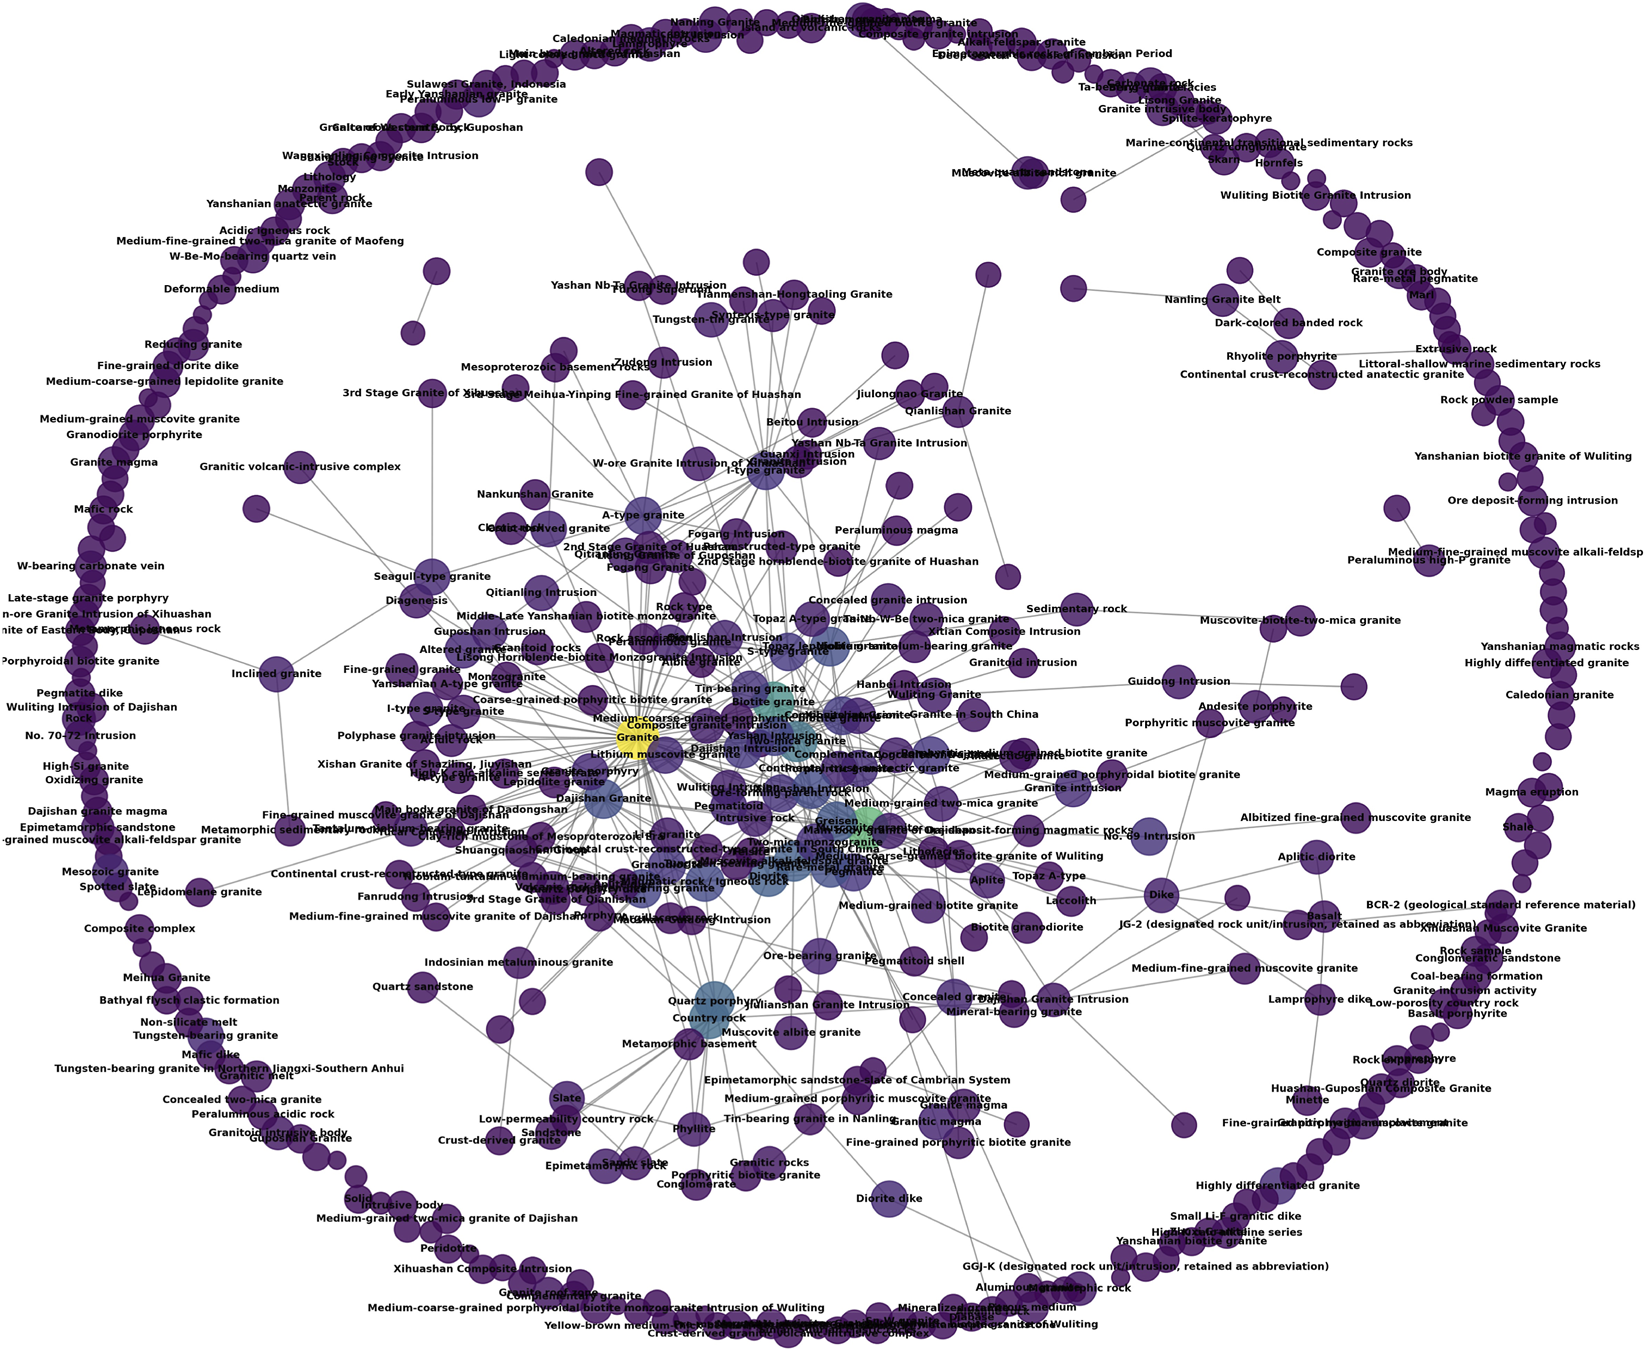
The KG for the Dajishan tungsten deposit constructed by the LLM is shown in the figure. Seven predefined entity types formed the extraction core: Mineral, Rock, Element, Chemical, Age, Deposit, and Structure. Extraction was not strictly limited to these types; during processing, the model also extracted other identified entities. The final KG comprises 16,359 nodes, including: 465 Mineral nodes, 641 Rock nodes, 299 Element nodes, 1,878 Chemical nodes, 393 Age nodes, 1,230 Deposit nodes, and 3,500 Structure nodes. Other automatically generated nodes (Chunk, Community, Document) are stored as covariates. A total of 149,337 relations were constructed. The entity-to-relation ratio of approximately 1:9.13 indicates that knowledge forms a highly structured organic whole rather than isolated points. To achieve the visualization of key nodes, nodes in the top 20% of degree centrality were selected from seven focused entity categories—mineral, rock, element, chemical, age, deposit, and structure—for display, as shown in Figure 3. In the figure, red nodes represent mineral entities, blue nodes represent rock entities, green nodes represent element entities, gray nodes represent structural entities, purple nodes represent age entities, yellow nodes represent chemical entities, and cyan nodes represent deposit entities. For quality assurance, random sampling of 200 “entity-relation-entity” triples was manually verified, confirming 95.5% factual accuracy. Errors primarily originated from ambiguous expressions in early literature and have been corrected through subsequent processing.
FIGURE 3

Knowledge graph of Dajishan tungsten mine.
4 Identification of prospecting indicators
To deeply explore the prospecting indicators of the Dajishan Tungsten Deposit and provide information for hydrothermal tungsten deposit prospecting, this study employs a KG constructed using a LLM to evaluate nodes from six predefined entity types: minerals, rocks, elements, geological ages, deposits, and structures. For each node, we calculated multiple centrality metrics: degree, closeness, betweenness, and eigenvector centrality to measure structural importance; and PageRank and Katz centrality to assess influence propagation. A decision matrix was established using the TOPSIS method, with criterion weights determined by the entropy method based on data variability. The relative closeness of each node to the ideal best and worst solutions was computed to identify entities potentially linked to prospecting (Table 1). Among these entity types, Mineral, Rock, and Element entities represent the direct physical objects detected and observed in prospecting work, establishing a direct relationship with mineralization. In contrast, Age, Deposit, and Structure entities represent process elements or controlling factors of mineralization, providing an indirect theoretical framework guiding prospecting. This study focuses specifically on the three entity types directly related to prospecting: Mineral, Rock, and Element. The identified prospecting indicators are categorized into directly related indicators and potential indicators. Nodes ranking highest via the TOPSIS model within each entity type are classified as directly related prospecting indicators, while those ranking slightly lower are considered potential indicators. Detailed analysis of these potential prospecting indicators can maximize the advantages of applying LLM in the mineral resources field, enabling the in-depth discovery of significant prospecting indicators that are often difficult to identify or are commonly overlooked through traditional geological research alone. The calculation results are presented in the table below.
TABLE 1
| Direct indicator | Potential indicator | ||||
|---|---|---|---|---|---|
| Mineral | Rock | Element | Mineral | Rock | Element |
| Wolframite | Granite | Tungsten (W) | Microlite | Metasandstone | Copper (Cu) |
| Mica | Muscovite granite | Tin (Sn) | Calcite | Slate | Gold (Au) |
| Scheelite | Biotite granite | Niobium (Nb) | Apatite | Phyllite | Hafnium (Hf) |
| Topaz | Two-mica granite | Tantalum (Ta) | Monazite | Sandy slate | Cesium (Cs) |
| Molybdenite | Quartz porphyry | REE | Tourmaline | Aplite | Thorium (Th) |
| Zircon | Moscovite granite | Beryllium (Be) | Amphibole | Lamprophyre | Lead (Pb) |
| Fluorite | Diorite | Fluorine (F) | Arsenopyrite | Andesite porphyry | Silver (Ag) |
| Bismuthinite | Greisen | Molybdenum (Mo) | Garnet | Clastic rock | Zirconium (Zr) |
| Cassiterite | Topaz-lepidolite granite | Lithium (Li) | Rutile | Basalt | Phosphorus (P) |
| Beryl | Pegmatite | Bismuth (Bi) | Chlorite | Conglomerate | Strontium (Sr) |
Table of mineral exploration indicators.
4.1 Mineral indicators
The KG of mineral entities is presented in Figure 4. The node colors correspond to the degree in descending order, ranging from yellow, green, blue to purple.
FIGURE 4

Knowledge graph of mineral node.
The mineral indicators directly related to prospecting include: wolframite, mica, scheelite, topaz, molybdenite, zircon, fluorite, bismuthinite, cassiterite, and beryl. Among these, wolframite, scheelite, and cassiterite are core indicator minerals directly associated with tungsten enrichment. Wolframite is the primary host mineral of tungsten in the Dajishan Tungsten Deposit, representing the most direct prospecting indicator. Cassiterite, a high-temperature characteristic mineral paragenetic with tungsten mineralization, indicates highly evolved ore-forming fluids. Fluorite and topaz are key volatile minerals that indicate the characteristics of the ore-forming fluids. They often co-occur with wolframite in quartz veins and, together with minerals like quartz and muscovite, form characteristic alteration assemblages, serving as indicators of granite-related tungsten alteration. The combined presence of these four minerals helps pinpoint the location of ore-bearing quartz veins. Molybdenite and bismuthinite are metallic minerals frequently associated with wolframite, used to identify the mineralization center and zoning. Beryl indicates highly differentiated granite and beryllium mineralization.
The mineral indicators potentially related to prospecting include: microlite, calcite, apatite, monazite, tourmaline, hornblende, arsenopyrite, garnet, rutile, and chlorite. Among these, microlite, monazite, apatite, and rutile are rare metal paragenetic minerals or accessory minerals that collectively provide deep insights into the parent rock properties and metallogenic potential. Microlite is a primary tantalum mineral, while rutile is a primary titanium mineral that can undergo isomorphic substitution for niobium and tantalum at high temperatures; both can indicate Ta-Nb mineralization. Monazite, a primary light rare earth element (LREE) mineral, indicates REE enrichment. Apatite, a common accessory mineral, effectively traces the source and nature of fluids through its composition. Tourmaline, chlorite, garnet, and calcite collectively indicate hydrothermal fluid activity and its interaction with wall rocks. Tourmalinization and chloritization are important types of hydrothermal alteration. Garnet is a diagnostic mineral of skarnization. Calcite typically forms in the late hydrothermal stage, marking the cessation of ore-forming hydrothermal activity. Arsenopyrite serves as an indicator mineral for sulfides.
4.2 Rock indicators
The KG of rock entities is presented in Figure 5. The node colors correspond to the degree in descending order, ranging from yellow, green, blue to purple.
FIGURE 5
Knowledge graph of rock node.
The rock indicators directly related to prospecting include: various granitoids, quartz porphyry, diorite, greisen, and pegmatite. Among these, various types of granite, particularly highly fractionated granites, serve as the parent rock for the Dajishan Tungsten Deposit, which provide ore-forming materials and volatiles such as tungsten, tin, fluorine, and lithium. Among them, topaz-lepidolite granite directly indicates the mineralization center. Greisen, a proximal alteration rock formed from granite through hydrothermal alteration, is a direct product of ore-forming fluid activity; these two rock types are directly related to mineralization. Pegmatite represents the product of the early volatile enrichment stage. Diorite and quartz porphyry are potential host rocks, where ore-forming fluids migrated through their fractures and precipitated to form ore.
The rock indicators potentially related to prospecting include: metasandstone, slate, phyllite, sandy slate, aplite, lamprophyre, andesite porphyrite, clastic rocks, basalt, and conglomerate. Metasandstone, slate, phyllite, and sandy slate are important host rocks. They are prone to develop fractures under tectonic stress but do not react intensely with ore-forming fluids, providing favorable mechanical space for mineral vein precipitation. Aplite, lamprophyre, andesite porphyrite, clastic rocks, basalt, and conglomerate represent background rocks of magmatic activity, collectively describing the regional magmatic-tectonic setting. Aplite represents the rapidly chilled margin of granitic magma, indicating the presence of a granite pluton. Mafic to intermediate dykes such as lamprophyre, andesite porphyrite, and basalt may indicate deep-seated faults. Clastic rocks and conglomerate typically serve as sedimentary cover.
4.3 Element indicators
The KG of element entities is presented in Figure 6. The node colors correspond to the degree in descending order, ranging from yellow, green, blue to purple.
FIGURE 6

Knowledge graph of element node.
The element indicators directly related to prospecting include: tungsten (W), tin (Sn), niobium (Nb), tantalum (Ta), rare earth elements (REEs), beryllium (Be), fluorine (F), molybdenum (Mo), lithium (Li), and bismuth (Bi). Among these, W, Sn, and F are the core ore-forming elements. Tungsten is the primary ore-forming element, enriched in the forms of (Mn,Fe)WO4 (wolframite) and CaWO4 (scheelite). Tin co-enriches with tungsten in highly fractionated granites, with cassiterite paragenetic with wolframite. Fluorine is a key mineralizer that reduces tungsten solubility to promote precipitation, hosted in minerals such as fluorite, topaz, and lepidolite. In prospecting, both W and Sn serve as direct signals, while F anomalies are used to delineate prospective areas. Lithium, Be, and REEs are key indicators for assessing the degree of granite fractionation and evolution. Lithium enriches in the late magmatic stage, occurring as lepidolite, indicating highly evolved fluids; Li concentrations >200 ppm in the rock mass suggest the presence of concealed ore bodies at depth. Beryllium, associated as beryl, is controlled by F-rich fluids alongside tungsten. Molybdenum, Bi, Ta, and Nb are paragenetic metallic elements: Mo and Bi occur as molybdenite and bismuthinite, respectively, paragenetic with wolframite; Ta and Nb are hosted in minerals such as tantalite and microlite, associated with late-stage granites.
The element indicators potentially related to prospecting include: copper (Cu), gold (Au), hafnium (Hf), cesium (Cs), thorium (Th), lead (Pb), silver (Ag), zirconium (Zr), phosphorus (P), and strontium (Sr). Among these, Cs, Hf, Zr, and Th indicate highly fractionated granites. Copper, Au, Pb, and Ag are potential associated elements, representing possible intermediate to low-temperature paragenetic mineralization. Phosphorus and Sr are genetic indicator elements, used to infer the nature of the parent rock and mineralization processes.
4.4 Other prospecting indicators
The three entity types—Age, Deposit, and Structure—reveal the formation mechanisms, spatiotemporal patterns, and distribution controls of the deposit, constituting a theoretical framework that indirectly guides prospecting. The results of prospecting indicator mining for these three entity types are as follows (Table 2):
TABLE 2
| Entity type | Indicators |
|---|---|
| Age | Yanshanian, Indosinian, Cambrian, Devonian, Caledonian, Sinian |
| Deposit | W-Sn deposit, quartz-vein type W deposit, piaotang W deposit, Nb-Ta deposit, Xihuashan W deposit |
| Structure | Fault, conjugate shear joint, Filling structure, Ore-hosting fracture |
Table of other mineral exploration indicators.
Metallogenic epochs related to prospecting include the Yanshanian, Indosinian, Cambrian, Devonian, Caledonian, and Sinian periods. In chronological order, the Sinian period formed the W- and Sn-enriched basement strata; the Cambrian basement underwent metamorphism; the Caledonian tectonic events enabled initial W enrichment through metamorphic hydrothermal processes; the Devonian provided brittle sedimentary cover rocks; the Indosinian movement created pathways for ore-forming fluid migration; and the Yanshanian period represents the main metallogenic epoch of the Dajishan Tungsten Deposit. Deposit types associated with prospecting include W-Sn deposits, quartz-vein-type tungsten deposits, the Piaotang Tungsten Deposit, Nb-Ta deposits, and the Xihuashan Tungsten Deposit. The Dajishan Tungsten Deposit itself is a quartz-vein-type deposit, with Ta-Nb mineralization developed at the top of the granite intrusion vertically. Both the Piaotang and Xihuashan deposits are typical tungsten deposits of the same type in this region. Geological structures relevant to prospecting comprise faults, conjugate shear joints, infill structures, and ore-hosting fractures. Ore-hosting fractures served as the mineralization space in the Dajishan Tungsten Deposit, controlled by conjugate shear joints to form dense fracture networks. Infill structures represent the mineralization mechanism, while faults acted as deep conduits for ore-forming fluids.
4.5 Integrated prospecting model
By synthesizing all extracted prospecting indicators and leveraging the theoretical framework of indirect indicators, an integrated prospecting model for hydrothermal tungsten deposits in the Nanling Region can be preliminarily established through analysis of direct indicators (Figure 7). In terms of mineral assemblages, wolframite and scheelite serve as direct prospecting indicators. The combination of lepidolite, topaz, and fluorite indicates greisenization alteration and a fluorine-rich environment, representing a key proximal indicator to the orebody. Paragenetic minerals such as cassiterite, beryl, and molybdenite signify a high-temperature W-Sn-Mo-Bi-Be metallogenic system. Accessory minerals like microlite indicate significant Ta-Nb enrichment. Additionally, microlite serves as a critical indicator for tantalum mineralization and is key to identifying super-large deposits. Tourmaline and garnet also represent important alteration minerals. Regarding rock indicators, emphasis should be placed on highly fractionated granitic bodies such as topaz-lepidolite granite and contact zones rich in topaz- and fluorite-bearing greisen, which constitute the two most significant mineralization markers. Beyond these, attention should be given to contact zones within Cambrian–Devonian low-grade metamorphic rocks. In geochemical exploration, W-Sn-Mo-Bi anomalies are used to delineate mineralization centers, Nb-Ta-Li-Be anomalies to identify concealed highly fractionated plutons, and F anomalies to outline fluid migration pathways. Additionally, Cu-Pb-Zn-Ag anomalies indicate mineralization tails or associated mineralization. This prospecting model integrates geological research with the LLM-driven methodology, synthesizing all direct, indirect, and potential prospecting indicators to effectively guide ore deposit targeting and evaluation.
FIGURE 7

Comprehensive exploration model for the Daijishan tungsten deposit.
5 Knowledge base capability comparison
The knowledge base (KB) constructed using the KG employs triples to build a structured semantic network, storing knowledge in an explicit, discrete graph structure that follows graph topology and supports multi-hop path traversal. Traditional Retrieval-Augmented Generation (RAG), based on connectionism, utilizes dense vector embeddings for knowledge storage, uses documents or chunks as retrieval units, and employs similarity matching for retrieval. To investigate the performance differences between the KB built via the KG and the traditional RAG-based KB, this study conducted Q&A tests on both systems using a manually curated question set covering multiple domains, question types, and difficulty levels. Responses from both KBs were tallied, calculating the proportion of exact matches, precision, recall, F1-score, and conducting manual evaluation of logical consistency, domain terminology accuracy, and correctness in answering complex questions.
The question set consisted of 50 questions, stratified into Basic, Intermediate, and Advanced levels, corresponding to the cognitive levels of factual recall, analytical reasoning, and comprehensive advisory, respectively. Basic questions required precise retrieval of single data points or definitions; analytical reasoning questions required explaining mechanisms and comparing differences; comprehensive advisory questions required designing solutions and constructing models. Question domains were divided into Metallogenic Geological Background, Metallogenic Processes, and Deposit Types & Characteristics. Examples from the question set include:
Metallogenic Geological Background Domain:
Basic: In which tectonic belt is the Dajishan tungsten deposit located?
Intermediate: Analyze the controlling effect of the Nanling metallogenic belt on the formation of the Dajishan tungsten deposit;
Advanced: Based on the regional geodynamic background, argue for the deep prospecting potential of Dajishan.
Metallogenic Processes:
Basic: What are the common alteration types in the mineralization-alteration zone?
Intermediate: Why is wolframite dominant over scheelite at Dajishan?
Advanced: Propose geochemical methods for discriminating multi-stage mineralization superposition.
Deposit Types & Characteristics:
Basic: What is the main industrial type of the Dajishan deposit?
Intermediate: Analyze the applicability and limitations of the “Five-Floor Model” at Dajishan;
Advanced: What key geological constraints should be integrated when building a 3D model of the deposit?
5.1 Knowledge base capability comparison
From the test results using Traditional RAG as the knowledge base for Q&A (Table 3), its ability to answer Basic Factual, Analytical Reasoning, and Comprehensive Advisory questions differed, with the proportion of correct answers decreasing sequentially. This indicates that Traditional RAG is more adept at handling precise retrieval of single data points or definitions, where its retrieval mechanism effectively matches simple facts. Its performance is slightly worse when analyzing and processing multiple data points, reflecting its difficulty in integrating multi-source information for logical deduction. Instances of “No Answer” occurred for both Basic Factual and Analytical Reasoning questions when retrieval failed to match specific locations. When facing Comprehensive Advisory questions requiring solution design and model construction, it always provided some scheme or suggestion, but the accuracy of these suggestions was insufficient.
TABLE 3
| Traditional RAG | Basic factual | Analytical reasoning | Comprehensive advisory |
|---|---|---|---|
| No answer | 3 | 3 | 0 |
| Incorrect answer | 3 | 4 | 4 |
| Partically correct | 3 | 6 | 3 |
| Correct answer | 11 | 7 | 3 |
Results of traditional RAG on question answering.
From the test results using the KG as the knowledge base for Q&A (Table 4), it showed an advantage in Analytical Reasoning tasks, demonstrating the effectiveness of structured symbolic reasoning. However, its accuracy for Basic Factual questions was not high enough, because the KG requires discretizing continuous reality into nodes and relations, a process that can lead to precision dilution. When facing Comprehensive Advisory tasks, the KG tended towards conservative answers, refusing to answer some questions.
TABLE 4
| KG | Basic factual | Analytical reasoning | Comprehensive advisory |
|---|---|---|---|
| No answer | 0 | 2 | 2 |
| Incorrect answer | 4 | 2 | 1 |
| Partically correct | 9 | 7 | 4 |
| Correct answer | 7 | 9 | 3 |
Results of KG on question answering.
The search scope for the three question levels can be divided into local matching and global search types. Basic Factual and Analytical Reasoning questions are local matching types, whose core lies in precise matching. Analytical Reasoning requires some analytical thinking after matching. Comprehensive Advisory questions are global search types, requiring association and matching across multiple modules followed by reasoning. The comparison shows that the Precision, Recall, and F1-score metrics for Traditional RAG and the KG are relatively close, but the KG scores are slightly higher in all three metrics, with respective improvements of 3.28%, 4.55%, and 4.17% (Table 5). Traditional RAG, relying on semantic similarity for precise matching, is more efficient in explicit fact queries. The KG, by leveraging topological structure to mine implicit associations, excels at logical reasoning. Among the incorrectly answered questions, Traditional RAG had a higher proportion of Incorrect Answers, reflecting its black-box retrieval drawback. The KG had a higher proportion of Partially Correct answers, reflecting its origin from static knowledge, which can lag in updates. However, constructing the KG using LLM can significantly improve construction efficiency, mitigating the challenge of updating static knowledge.
TABLE 5
| Type | Precision | Recall | F1-score |
|---|---|---|---|
| Traditional RAG | 0.61 | 0.88 | 0.72 |
| KG | 0.63 | 0.92 | 0.75 |
Comparative analysis of knowledge base capabilities.
5.2 Manual evaluation
Manual evaluation of the Q&A results from the two knowledge bases (Traditional RAG and KG) yielded the following results:
First, in terms of answering style, KG responses are highly structured: they categorize results by retrieval source, annotate entity IDs and data sources, facilitating traceability. For example: “Fine-grained muscovite granite is the main host rock for rock-type Ta-Nb-W mineralization [Data: Reports (29)].” In contrast, Traditional RAG summarizes in natural language paragraphs, lacking structured annotations. The KG explicitly displays reasoning chains, explaining causality through entity relations, e.g., “Magmatic differentiation → Fluid enrichment → Mineralization precipitation,” whereas Traditional RAG directly presents conclusions, omitting intermediate reasoning steps. Compared to Traditional RAG, KG responses use denser professional terminology, while Traditional RAG responses are more generic in expression.
Second, regarding response depth, KG responses are relatively deeper. For example, when answering the question “Relationship between Yanshanian granite and Dajishan tungsten mineralization,” the core content of the KG answer was: “1. Details of magmatic differentiation: peraluminous low phosphorus, relatively low K2O, REE fractionation curves; 2. Spatial distribution evidence: ore bodies occurring in inner and outer contact zones, ‘fan roots’ intruding granite; 3. Data support: citing entities like magma boiling, meteoric water mixing.” This reveals geochemical mechanisms and spatial ore-control patterns. In contrast, the core points of the Traditional RAG answer were: “1. Generalization of magmatic differentiation enriching ore-forming materials; 2. Emphasis on hydrothermal fluids ascending along structural fractures for mineralization.” The breadth was weaker, ignoring specific geochemical indicators during the differentiation process.
The comparison reveals that, compared to Traditional RAG, the KG as a knowledge base holds certain advantages. Its capabilities for multi-hop reasoning via graph traversal and direct querying of explicit relations between entities make it more suitable for complex reasoning, association analysis, and connecting concepts across literature and data sources. Its highly structured nature allows for precise traceability, making it more suitable for professional research scenarios, such as scientific demonstration, exploration decision-making, and genetic mechanism analysis. However, this traversal approach also results in higher response times and deployment costs compared to Traditional RAG. Therefore, for simple Q&A tasks and scenarios requiring real-time performance, Traditional RAG offers higher cost-effectiveness.
6 Discussion
During the process of constructing the KG using the LLM, multiple parameters are manually configured to optimize KG construction, with the flexibility for scenario-specific customization. These parameters include:
Main Model Configuration: Chat Model: qwen-plus; Embedding Model: text-embedding-v3; max_tokens: 8,000, the maximum tokens per request, adjustable based on the selected model; requests_per_minute: 300, the maximum API requests per minute for rate limiting to avoid exceeding API quotas, adjustable according to the API plan; max_retries: 8, the maximum number of retries upon request failure.
Parallel Processing Configuration: stagger: 0.3, the delay between initiating parallel tasks to prevent instant high concurrency; num_threads: 8, the number of parallel threads, adjustable based on CPU core count.
Embedding Model Configuration: batch_size: 16, the number of texts processed per batch, adjustable according to GPU memory (may be reduced for long texts); batch_max_tokens: 8,000, the maximum tokens per batch, aligned with the main model; concurrent_requests: 8, the number of parallel requests, set lower than the main model to reduce server load; request_timeout: 600, the timeout duration for a single embedding request (should be increased for long texts or unstable networks).
Text Chunking Configuration: size: 800, the target token count per chunk, adjustable based on the model; overlap: 150, the overlapping tokens between chunks to maintain contextual coherence, typically 10%–20% of the chunk size.
KG Construction Module Configuration: prompt: The LLM prompt, which defines task objectives, constrains output formats, and guides content direction; it can be customized or auto-generated; entity_types: [Mineral, Rock, …], the predefined list of entity types to extract; max_gleanings: 3, the maximum number of entities to extract per text chunk, controlling noise; max_cluster_size: 15, the maximum node count per graph cluster, influencing community detection granularity.
All the above configurations are set based on the hardware used in this study. Without hardware constraints, model performance could be enhanced in the following aspects:
Parallel Processing Optimization: Increase concurrent_requests to the allowed maximum of 50; Raise requests_per_minute to the premium account limit of 10,000; Boost num_threads to 32 threads; Reduce stagger to the minimum delay of 0.05; Additionally, implement hierarchical asynchronous optimization using coroutines globally.
Hardware Acceleration for Compute-Intensive Tasks: Increase batch_size to 512; Raise batch_max_tokens to 65,536; Enable CUDA acceleration, allocate sufficient memory, and preload full data into memory.
Model and Algorithm Optimization: Upgrade the model to higher-performance options such as qwen_max or gpt-4-128k; Increase max_tokens to 120,000; Optimize chunk size and overlap to maximum values of 32,000 and 3,000, respectively; Expand max_cluster_size to 100 for larger community scales; Adopt more efficient clustering algorithms such as Leiden.
Through these optimizations, both the speed and accuracy of KG construction can be significantly improved, with orders-of-magnitude enhancements in graph embedding and LLM processing. Moreover, real-time monitoring at the second level can be achieved, enabling dynamic parameter adjustments for continuous optimization. In practical applications, using the KG for the mining of mineral prospecting factors can provide valuable references for actual mineral exploration work. First, it can offer clear direct prospecting indicators without relying on expert experience. Second, and more importantly, it enables the uncovering of potential prospecting factors—specifically, potential relevant indicators that are often overlooked in traditional geological research.
7 Conclusion
This study successfully implemented the technical flow of LLM-driven KG construction through workflows such as prompt generation, entity extraction, relationship generation, knowledge fusion, and knowledge storage. Based on the resulting KG, prospecting indicators were deeply identified, enabling the development of an integrated prospecting model for hydrothermal tungsten deposits. Furthermore, a specialized KB was established using both the KG and traditional RAG approaches. The principal conclusions are as follows:
First, utilizing LLM for KG construction can significantly enhance the speed and scale of integrating critical information, deepen semantic understanding and the mining of implicit knowledge, and substantially improve the efficiency of graph development. Furthermore, it enables task-specific optimization to enhance model performance for targeted applications.
Second, KG demonstrate substantial application potential in mineral resources research. Through KG-based prospecting indicator extraction, it is possible to identify not only direct indicators but also latent indicators and auxiliary prospecting information via in-depth analysis. Synthesizing these diverse elements enables the construction of comprehensive prospecting models for similar deposit types within the region, providing valuable references for mineral exploration.
Third, the KG-based KB for the mineral resources effectively enhances analytical reasoning and relational capabilities. Compared to traditional RAG-based systems, it demonstrates measurable improvements in answer accuracy, response quality, and content depth, exhibiting superior performance in supporting scientific research and complex analytical tasks.
Statements
Data availability statement
The original contributions presented in the study are included in the article/supplementary material, further inquiries can be directed to the corresponding author.
Author contributions
YuZ: Data curation, Formal Analysis, Investigation, Methodology, Software, Validation, Visualization, Writing – original draft, Writing – review and editing. KW: Conceptualization, Data curation, Formal Analysis, Funding acquisition, Methodology, Project administration, Resources, Supervision, Visualization, Writing – original draft, Writing – review and editing. QC: Conceptualization, Funding acquisition, Methodology, Project administration, Resources, Supervision, Writing – review and editing. YaZ: Conceptualization, Funding acquisition, Methodology, Project administration, Resources, Supervision, Writing – review and editing. QG: Writing – review and editing. JX: Conceptualization, Formal Analysis, Funding acquisition, Methodology, Project administration, Resources, Writing – review and editing. XR: Conceptualization, Formal Analysis, Methodology, Project administration, Resources, Supervision, Writing – review and editing. CS: Formal Analysis, Investigation, Project administration, Supervision, Validation, Visualization, Writing – review and editing. HH: Formal Analysis, Investigation, Methodology, Software, Supervision, Validation, Visualization, Writing – review and editing.
Funding
The author(s) declared that financial support was received for this work and/or its publication. This research was funded by Major National Science and Technology Program for Deep Earth Exploration (Grant No. 2024ZD1002000), National Natural Science Foundation of China (Grant No. 4227012037), and Secondary-Level Geological Survey Project of the China Geological Survey (Grant No. DD20230040).
Acknowledgments
We are very grateful to all the editors and reviewers who have helped us to improve and publish this paper.
Conflict of interest
The author(s) declared that this work was conducted in the absence of any commercial or financial relationships that could be construed as a potential conflict of interest.
Generative AI statement
The author(s) declared that generative AI was not used in the creation of this manuscript.
Any alternative text (alt text) provided alongside figures in this article has been generated by Frontiers with the support of artificial intelligence and reasonable efforts have been made to ensure accuracy, including review by the authors wherever possible. If you identify any issues, please contact us.
Publisher’s note
All claims expressed in this article are solely those of the authors and do not necessarily represent those of their affiliated organizations, or those of the publisher, the editors and the reviewers. Any product that may be evaluated in this article, or claim that may be made by its manufacturer, is not guaranteed or endorsed by the publisher.
References
1
Cao (2004). Geological characteristics and prospecting model of the dajishan ta-nb-w deposit. Geol. Explor.40, 34–37.
2
Chen Q. (2021). Theories and methods for the criticality assessment of strategic minerals: a global and Chinese perspective. Acta Geosci. Sin.42, 137–144. 10.3975/cagsb.2020.102604
3
Chen Z. (2024). New quality productive forces and the evolving landscape of mineral resources. China Min. Mag.33, 1–8. 10.12075/j.issn.1004-4051.20240888
4
Chen X. Jia S. Xiang Y. (2020). A review: knowledge reasoning over knowledge graph. Expert Syst. Appl.141, 112948. 10.1016/j.eswa.2019.112948
5
Chen Zhang Li (2025). Theoretical and technical framework for a total mineral resources system. Acta Geosci. Sin.46, 895–900. 10.3975/cagsb.2025.030201
6
de Mello Koch R. Mathwin C. van Zyl H. J. R. (2016). Llm magnons. J. High. Energy Phys.2016, 110. 10.1007/JHEP03(2016)110
7
Feng Z. (2025). Knowledge graph-based extraction of metallogenic factors in carbonatite-hosted ree deposits. Earth Sci. Front.32, 262–279.
8
Feng Q. Zhao T. Liu C. (2024). A “pipeline”-based approach for automated construction of geoscience knowledge graphs. Minerals (Basel)14, 1296. 10.3390/min14121296
9
Hofer M. Obraczka D. Saeedi A. Köpcke H. Rahm E. (2024b). Construction of knowledge graphs: current state and challenges. Information (Basel)15, 509. 10.3390/info15080509
10
Hua Z. (2003). A comparative study of the granites and associated mineralization in the dajishan and piaotang areas, southern Jiangxi. Geol. J. China Univ.9, 609–619.
11
Jiang X. (2004). Geochronology of the Dajishan Tungsten deposit, Jiangxi province. Acta Mineral. Sin.24, 253–256.
12
Knollmeyer S. Caymazer O. Grossmann D. (2025). Document graphrag: knowledge graph enhanced retrieval augmented generation for document question answering within the manufacturing domain. Electronics (Basel)14, 2102. 10.3390/electronics14112102
13
Kong (1982). The metallogeny of the Dajishan Tungsten deposit. Geol. Explor., 27–32.
14
Li Z. (2024). Knowledge graph-based intelligent q&a for mine system operation and maintenance. Colliery Mech. Electr. Technol.45, 38–42. 10.3390/INFO15110666
15
Liu and Zhong (1996). New insights into the mineralization of the Dajishan Tungsten deposit. Mineral Resour. Geol.10, 406–411.
16
Liu C. Chen J. Li S. Qin T. (2022). Construction of conceptual prospecting model based on geological big data: a case study in Songtao-Huayuan area, Hunan province. Minerals (Basel)12, 669. 10.3390/min12060669
17
Liu R. Cai P. Chen X. (2025). Knowledge structure and frontier evolution of research on nickel deposits. Minerals (Basel)15, 464. 10.3390/min15050464
18
Lu Z. (1974). Temperatures of rock-forming and mineralization processes in a mining district, south China. Geochimica3, 145–156.
19
Ma X. (2022). Knowledge graph construction and application in geosciences: a review. Comput. Geosci.161, 105082. 10.1016/j.cageo.2022.105082
20
Nong K. Chen S. Ren Z. Zeng M. (2024). Analysis of glauconite research trends based on citespace knowledge graph. Minerals (Basel)14, 1260. 10.3390/min14121260
21
Pei Y. Chai S. Li X. Samuel J. Ma C. Chen H. et al (2022). Construction and application of a knowledge graph for gold deposits in the jiapigou gold metallogenic belt, Jilin province, China. Minerals (Basel)12, 1173. 10.3390/min12091173
22
Peng and Lin (2024). Knowledge graph analysis of metallogeny in lithium deposits. China Min. Mag.33, 228–235. 10.12075/j.issn.1004-4051.20241424
23
Qian K. Belyi A. Wu F. Khorshidi S. Nikfarjam A. Khot R. et al (2023). Open domain knowledge extraction for knowledge graphs.
24
Qiu Z. (2004). Zircon u-pb dating of the wuliting pluton in the Dajishan area, south Jiangxi, and new insights into its relationship with tungsten mineralization. Geol. Rev.50, 125–133.
25
Que and Xia (1988). Enrichment characteristics and mineralization mechanisms of the Dajishan Tungsten deposit, Jiangxi: a preliminary discussion. Earth Sci., 177–185.
26
Roll D. S. Kurt Z. Li Y. Woo W. L. (2025). Augmenting orbital debris identification with neo4j-enabled graph-based retrieval-augmented generation for multimodal large language models. Sensors (Basel)25, 3352. 10.3390/s25113352
27
Sun (2021). Knowledge graph construction and system development for the lithium industry. Beijing: China University of Geosciences. 10.27493/d.cnki.gzdzy.2021.000728
28
Teng (1990). Vertical zoning of mineralization in the Dajishan mining area. Min. Geol.11, 13–24.
29
Wang (2024). Llm-based intelligent identification of prospecting indicators for porphyry copper deposits. Changchun: Jilin University. 10.27162/d.cnki.gjlin.2024.003726
30
Xi Z. (2008). Characteristics of ore-forming fluid evolution in the Dajishan Tungsten deposit, Quannan county, Jiangxi province. Acta Geol. Sin.82, 956–966.
31
Yang Z. (1999). Ree geochemistry of the granite weathering crust-type ree deposit in the dajishan area, Jiangxi province. Chin. Rare Earths20, 1–5.
32
Yang J. Jin H. Tang R. Han X. Feng Q. Jiang H. et al (2024). Harnessing the power of llms in practice: a survey on chatgpt and beyond. Acm Trans. Knowl. Discov. Data18, 1–32. 10.1145/3649506
33
Zhang (1974). A ta-nb-w-be mineralized granite (from a specific location). Geochimica3, 249–257.
34
Zhang (1975). Petrochemical characteristics of a ta-nb-w-be mineralized granite. Geochimica4, 135–146.
35
Zhang Z. (1981). Spatiotemporal variations in wolframite composition from an ore field, central Jiangxi. Geol. Rev., 193–198. 10.16509/j.georeview.1981.03.001
36
Zhang H. (2006). Geochronology of the granite and tungsten mineralization in the Dajishan area, southern Jiangxi. Acta Geol. Sin.80, 956–962.
37
Zhang Z. (2023). An ontology-based method for constructing a gold deposit knowledge graph. J. Geo-Information Sci.25, 1269–1281. 10.12082/dqxxkx.2023.210772
38
Zhang Z. (2024). Intelligent applications of the prospecting knowledge graph: a case study of porphyry copper deposits in the Qin-Hang metallogenic belt. Earth Sci. Front.31, 7–15. 10.13745/j.esf.sf.2024.5.2
39
Zhang S. M. (2012). Mineralogy and deposit characteristics of the Dajishan tungsten deposit, Jiangxi Province. Beijing: China University of Geosciences (Beijing).
40
Zhang and Xie (1997). Stable isotope geochemistry of different mineralizing stages in the dajishan tungsten deposit, Jiangxi province. Acta Geosci. Sin.18, 197–199.
41
Zhou Z. (2017). Advances in big data and intelligent modeling for mineral deposits. Bull. Mineral. Petrol. Geochem.36, 327–331. 10.3969/j.issn.1007-2802.2017.02.016
42
Zhou Z. (2021). Construction and potential applications of a knowledge graph for porphyry copper deposits in the Qin-Hang metallogenic belt. Earth Sci. Front.28, 67–75. 10.13745/j.esf.sf.2021.1.2
43
Zhuang Z. (1991). Spatiotemporal variations in wolframite composition from an ore field, central Jiangxi. Geol. Rev.12.
Summary
Keywords
large language model, knowledge graph, mineral resources, prospecting indicators, knowledge base, hydrothermal tungsten deposit
Citation
Zhao Y, Wang K, Chen Q, Zhang Y, Guan Q, Xing J, Ren X, Shang C and He H (2025) LLM-driven rapid construction of knowledge graph for mineral resources: a case study of the Dajishan hydrothermal tungsten deposit. Front. Earth Sci. 13:1738096. doi: 10.3389/feart.2025.1738096
Received
03 November 2025
Revised
17 November 2025
Accepted
30 November 2025
Published
18 December 2025
Volume
13 - 2025
Edited by
Yongzhang Zhou, Sun Yat-sen University, China
Reviewed by
Junjun Cao, Central China Normal University, China
Shao Liuguo, Central South University, China
Updates
Copyright
© 2025 Zhao, Wang, Chen, Zhang, Guan, Xing, Ren, Shang and He.
This is an open-access article distributed under the terms of the Creative Commons Attribution License (CC BY). The use, distribution or reproduction in other forums is permitted, provided the original author(s) and the copyright owner(s) are credited and that the original publication in this journal is cited, in accordance with accepted academic practice. No use, distribution or reproduction is permitted which does not comply with these terms.
*Correspondence: Kun Wang, wkun1111@126.com
Disclaimer
All claims expressed in this article are solely those of the authors and do not necessarily represent those of their affiliated organizations, or those of the publisher, the editors and the reviewers. Any product that may be evaluated in this article or claim that may be made by its manufacturer is not guaranteed or endorsed by the publisher.