Abstract
This study presents an integrated automated monitoring system for foundation pits based on fiber Bragg grating (FBG) technology. The system enables real-time measurement of diaphragm wall horizontal displacement, internal forces in supports, differential settlement of concrete struts, soil heave at the excavation base, and lateral earth pressure, facilitating comprehensive evaluation of deformation and safety. The field results indicate that the data from the automatic fiber inclinometer aligns with measurements from the manual inclinometer, with a difference not exceeding 5 mm, confirming the reliability of this method. Concrete struts exhibit a transition of internal forces from compression to tension with staged excavation sequence. Differential settlement near the central column pile amounts to approximately 20 mm, highlighting the need for focused control. Soil heave at the excavation base shows a persistent increase down to 50 m depth, indicating that monitoring depth requires further extension. Lateral earth pressure outside the pit initially decreases and then rebounds with depth, exhibiting a significant coupling effect with retaining structure deformation. The FBG-based system effectively overcomes the temporal and spatial limitations of conventional monitoring techniques and offers a novel approach for automated foundation pit monitoring. Future research will aim to expand monitoring depth and integrate intelligent early warning algorithms to enhance risk management.
1 Introduction
Fiber Bragg Grating (FBG) sensing technology is an advanced monitoring approach that utilizes wavelength-division multiplexing (WDM) and the shift in Bragg wavelength generated during light transmission through fiber optics. It enables quasi-distributed, high-density real-time measurements of strain (Francesco and Joan, 2021; Aldo et al., 2021), temperature, or vibration (Cao et al., 2019; Yan et al., 2015; Yao et al., 2022; Zhu et al., 2022) along the fiber sensor array. FBG technology offers notable advantages such as resistance to electromagnetic interference (Meng et al., 2021), corrosion resistance (Cheng et al., 2022), high sensitivity, long-distance signal transmission, and the potential for permanent field installation (Wang et al., 2017). These characteristics overcome the limitations of traditional point sensors (e.g., vibrating wire sensors, inclinometer) in terms of cabling complexity, signal stability, and real-time data acquisition (Zhu et al., 2017). In foundation pit engineering, the application of FBG sensor arrays facilitates comprehensive sensing of deformation and stress in protective structures (e.g., diaphragm walls, support systems), providing high-precision, high spatiotemporal resolution data for pit stability assessment. This transition from discrete, manual point-based monitoring to multiplexed automation plays a crucial role in enhancing the safety warning capabilities for deep foundation pit construction.
Currently, both domestic and international foundation pit monitoring primarily rely on traditional discrete sensors such as electrical inclinometers, multipoint displacement meters, and strain gauges. These methods typically involve manual point-by-point data retrieval or semi-automated systems, which have limited deployment density and fail to continuously reflect the deformation distribution of the pit sidewalls with depth. Additionally, these systems tend to have longer monitoring cycles (Nicard et al., 2025). In recent years, some studies have attempted to apply optical fiber sensing technology for monitoring soil settlement, foundation pit support structures, and tunnel lining deformations. During slurry grouting and excavation, FBG-based in-place inclinometers and strain strings have been used to monitor the strain-temperature time series of the bored pile walls, from which lateral displacement gradients can be estimated (Hong et al., 2025; Zhang et al., 2024; Rui et al., 2021). Despite significant progress in FBG applications for excavation pits, existing research remains fragmented. Most current studies focus on the encapsulation feasibility of specific sensors or monitoring individual structural components such as pile foundations or diaphragm walls. However, three critical research gaps persist: First, global integration remains elusive, with few systems capable of simultaneously capturing the complex coupling between wall deformation, internal support forces, and soil heave within a unified FBG network. Second, data processing lacks sufficient intelligence, as most applications still rely on manual post-processing, lacking integrated platforms for real-time noise reduction and automatic conversion. Third, existing solutions often fail to bridge the gap between raw sensing data and decision-making for early warning. Therefore, there is an urgent need for an integrated, intelligent FBG monitoring platform that enables seamless transition from multi-source data acquisition to real-time safety assessment.
This study, based on fiber Bragg grating (FBG) sensing technology, developed an integrated foundation pit automation monitoring system. It realizes comprehensive, real-time monitoring capabilities for key parameters such as horizontal displacement of the diaphragm wall, deep soil deformation within the pit, settlement of the superstructure, and lateral earth pressure. The system deploys series of FBG sensors to collect real-time data on strain, temperature, and other parameters at various monitoring points of the foundation pit. Using high-precision algorithms (e.g., wavelength-to-displacement conversion), the system processes the data and continuously evaluates the deformation state and safety of the pit, providing new ideas and methods for the intelligent and automated development of foundation pit engineering.
2 Methodology
2.1 Principle of FBG
Fiber Bragg grating (FBG) is a passive optical device, which essentially involves the inscription of a refractive index modulation structure with a spatial periodic phase in the core of the optical fiber (Bashan et al., 2021), as shown in Figure 1. This structure imposes periodic disturbances on the transmitted optical signal. Light waves propagate in the FBG core via total internal reflection. The core and cladding materials of the widely used single-mode fiber are pure silica (SiO2), and the coating layer is typically made of polymer materials such as acrylate or polyimide to enhance flexibility and mechanical strength. The filtering function of the FBG is based on its “narrow-band filter” characteristic: while the light wave is unaffected during transmission through the uniform fiber core, it experiences significant changes in the transmission behavior (such as reflection) when passing through the FBG region due to the periodic refractive index variations. Based on this physical mechanism, FBGs can be used for detecting physical quantities such as temperature and stress in the environment (Hill et al., 2008).
FIGURE 1

Schematic diagram of the FBG principle.
Optical fiber is a very special medium. When light waves propagate within the fiber, they interact with the waveguide structure of the fiber, effectively confining the light waves within the core, thus enabling light transmission (Werner et al., 2021). During optical fiber transmission, light waves can be coupled into the core mode, or they can also be coupled into the modes of both the cladding and the core. Therefore, the center wavelength of the FBG reflection can be expressed by Equation 1 as:
The grating period is denoted as Ʌ, and the effective refractive index of the FBG is represented by neff.
When an FBG (Fiber Bragg Grating) is subjected to temperature and strain, two fundamental physical quantities, its internal structure undergoes changes, leading to variations in the effective refractive index and the grating period of the fiber. This, in turn, causes a shift in the center wavelength of the FBG.
2.2 Principle of FBG temperature sensing
The shift in the center wavelength of the FBG due to temperature is primarily caused by the thermo-optic effect and the thermal expansion effect of the fiber (Chakraborty and Tomlinson, 2003). Assuming a uniform pressure field and constant axial stress field (Marcelo et al., 1999), when only affected by temperature, the thermos-optic effect causes a change in the effective refractive index neff within the FBG, while the thermal expansion effect leads to elongation of the grating region, resulting in a change in the grating period Λ, which can be expressed by Equation 2:
Where ξ represents the thermo-optic coefficient of the fiber, and α denotes the thermal expansion coefficient of the fiber material.
Considering only the temperature effect on the center wavelength of the FBG (Zeng et al., 2014), the shift in the center wavelength of the FBG, ΔλBc can be expressed by Equation 3:
Where KT is the temperature coefficient, which is related not only to the temperature change but also to the manufacturing process and material composition of the fiber. λB is the original center wavelength of the FBG, and ΔλBc is the center wavelength shift of the FBG considering only the temperature effect. From Equation 3, it can be seen that if the temperature change ΔT is small, and if the temperature coefficient KT is treated as a constant, the center wavelength shift ΔλBc exhibits a linear relationship with the temperature change ΔT.
2.3 Principle of FBG strain sensing
When the FBG is subjected to uniform axial strain, the grating period of the FBG changes with the axial stress. Due to the photoelastic effect of the FBG, the effective refractive index of the FBG also changes with the axial stress. The shift in the center wavelength of the FBG, ΔλB can be expressed by Equation 4:
Where ΔΛ represents the change in the grating period of the fiber, and Δneff denotes the change in the effective refractive index of the fiber.
Assuming p11 and p12 are the matrix coefficients of the material’s photoelastic effect, ν is the Poisson’s ratio of the fiber, and εz is the axial strain of the FBG, the change in the effective refractive index of the fiber, Δneff can be expressed by Equation 5:
Substituting Equation 5 into Equation 4, the shift in the center wavelength of the FBG, ΔλB can be expressed by Equation 6:
Where Kε is the strain sensitivity coefficient of the FBG center wavelength, pe is the effective photoelastic coefficient of the fiber (Marcelo et al., 1999). For ordinary silica fibers, pe is typically taken as 0.22. The value of Kε is related to the fiber material characteristics, and for an FBG with a center wavelength of 1,550 nm, the strain sensitivity coefficient is typically taken as 1.2 p.m./με.
3 Monitoring scheme
3.1 Project overview
An automated fiber optic monitoring system was implemented in an urban rail transit excavation project. The main structure of the foundation pit adopts a two-level underground cast-in-place reinforced concrete box-type frame with a single-column double-span configuration, and partial sections employ a double-column triple-span design. The structure measures 507.82 m in length and 19.6 m in internal width. At the center of the station platform, the top slab is covered by approximately 4.759 m of overburden. The excavation depth of the standard section of the foundation pit is 18.163 m, while the western end pit reaches 19.98 m and the eastern end pit extends to 20.224 m. The excavation was carried out using the open-cut method. The retaining structure consists of 800 mm thick diaphragm walls, joined using cruciform steel plates and interlocking joints, with a wall length of approximately 34 m. Five levels of support were installed along the excavation depth; the first level comprises reinforced concrete struts, and the remaining levels use steel pipe struts.
The monitoring system, based on fiber Bragg grating (FBG) sensing technology, provided real-time measurements of the following parameters: deep horizontal displacement of diaphragm walls, differential settlement of mixed struts, heave of the soil within the excavation, internal forces in both concrete and steel struts, and earth pressure around the perimeter of the excavation.
3.2 Monitoring equipment
This system employs wireless optical fiber grating demodulators (WDM) and cabinet-mounted dense distribution optical fiber grating demodulators (TDM) developed by Suzhou Nanzee Sensing Technology Co., Ltd. Both devices operate within a temperature range of −20 °C–40 °C. Their fully sealed, self-cooling structural design ensures waterproof and dustproof performance for field applications. Specific parameters are detailed in Table 1.
TABLE 1
| Name | Application | Parameters |
|---|---|---|
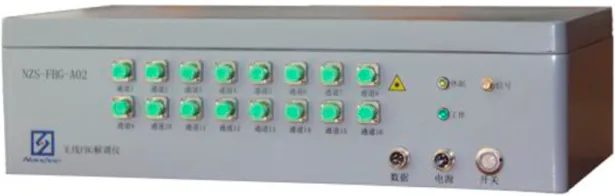
Wireless fiber bragg grating demodulator |
Sensor data acquisition based on wavelength division multiplexing technology | Wavelength resolution: 1 p.m. Wavelength repeatability: ±3 p.m. Demodulation rate: 1 Hz |
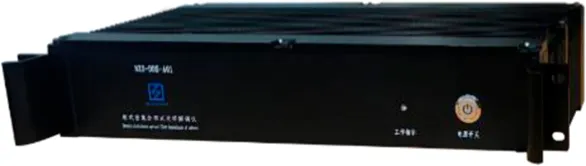
Cabinet-mounted high-density fiber bragg grating demodulator |
Sensor optical cable data acquisition based on time division multiplexing technology | Wavelength resolution: 1 p.m. Wavelength repeatability: ±5 p.m. Demodulation rate: 0.1 Hz |
Performance parameters of fiber bragg grating demodulator.
3.3 Monitoring content
The primary monitoring targets of the foundation pit include the support system, the surrounding geotechnical system, and the adjacent environment. Monitoring of the support system mainly covers the deep horizontal displacement of retaining walls (or piles), internal forces in struts, internal force and vertical displacement of central columns, internal forces in anchors and soil nails, as well as deformation and internal force of ring beams. The geotechnical system monitoring includes earth and water pressure around the pit, groundwater level, soil heave within the excavation, and horizontal displacement and settlement of the soil outside the pit. Environmental monitoring focuses on the deformation of adjacent buildings, structures, and underground utilities. The automated fiber Bragg grating (FBG)-based monitoring system is capable of covering nearly all key parameters of foundation pit monitoring, as illustrated in Figure 2.
FIGURE 2

Schematic diagram of foundation pit monitoring.
3.4 Automated monitoring framework
The automated fiber Bragg grating (FBG) monitoring system primarily consists of four functional layers: the sensing layer, acquisition layer, transmission layer, and application layer, as illustrated in Figure 3. The sensing layer comprises fiber optic sensors and sensing cables, which capture multiple physical parameters such as deformation, pressure, and temperature. The acquisition layer consists of FBG demodulators that collect measurement data from the sensors. The transmission layer refers to the means by which the demodulated data are transmitted, which can be either wired or wireless. The application layer includes the data visualization and early warning system, serving as the final interface for presenting monitoring results.
FIGURE 3

Architecture of the automated monitoring system.
3.5 On-site implementation
As illustrated in Figure 4, multiple fiber optic sensing schemes were implemented to monitor key structural components within the foundation pit. Figure 4a shows the monitoring setup for horizontal displacement of the diaphragm wall. High-strength, internally fixed strain-sensing cables were installed along the reinforcement cage of the diaphragm wall, with a sensor spacing of 1 m. The cables form a U-shaped configuration covering both the soil-facing and excavation-facing sides. To ensure accuracy, fiber Bragg grating (FBG)-based inclinometers were deployed in parallel to provide tilt correction. Figure 4b presents the displacement monitoring configuration for the central column pile. Three hydrostatic level sensors were installed at the top of the pile and at both ends of the adjacent mixed struts to measure the relative displacement of the column pile with respect to the reference points. Figure 4c shows the axial force monitoring scheme for steel struts. FBG surface strain gauges were welded at the 1/3-length section of the steel strut and distributed at four positions: top, bottom, left, and right. Figure 4d illustrates the internal force monitoring of concrete struts. At the 1/3-length section of the strut, FBG rebar strain gauges were welded at four locations—top, bottom, left, and right—and embedded within the concrete along with the rebar cage during casting.
FIGURE 4

Schematic diagram of support structure monitoring scheme. (a) Fiber layout on diaphragm wall; (b) Installation of hydrostatic level sensors; (c) Deployment of FBG strain gauges; (d) Deployment of FBG rebar stress sensors.
As shown in Figure 5, fiber optic sensing techniques were also applied to monitor the geotechnical system. Figure 5a illustrates the setup for layered monitoring of soil heave at the base of the excavation. Low-modulus, externally fixed strain-sensing cables were installed horizontally through boreholes along the cross-section of the foundation pit. These cables enabled stratified detection of upward soil deformation. Figure 5b shows the deployment of six fiber Bragg grating (FBG) earth pressure cells along the depth of a borehole outside the excavation. These sensors were used to monitor the lateral earth pressure exerted by the surrounding soil mass.
FIGURE 5

Schematic diagram of soil and water system monitoring scheme. (a) Borehole fiber optic cable installation; (b) Soil pressure sensor deployment.
4 Results
4.1 Horizontal displacement of the diaphragm wall
Figure 6a presents the horizontal displacement results of the diaphragm wall, obtained from fiber optic strain monitoring data corrected using FBG-based inclinometer measurements. Figure 6b shows the results obtained from manual inclinometer readings. It can be observed that both methods yield highly consistent displacement trends and magnitudes.
FIGURE 6

Results of horizontal displacement monitoring (October–December). (a) Fiber optic strain monitoring results; (b) Inclinometer monitoring results.
By extracting the maximum horizontal displacement from each monitoring cycle, a time-history comparison curve was generated, as shown in Figure 7. The results indicate that the measurement values from the automatic fiber optic inclinometer and the traditional manual inclinometer exhibit an error margin not exceeding 5 mm, demonstrating good consistency between the two instruments.
FIGURE 7

Comparison of maximum horizontal displacement (October–December).
4.2 Internal forces in struts
Figure 8 shows the time-history curves of internal forces in two concrete struts, obtained using fiber Bragg grating (FBG) rebar strain gauges. ZL1 and ZL2 represent the mixed struts at Sections 1 and 2, respectively. Figure 9 presents the axial force time histories of steel struts measured by FBG surface strain gauges. GZ1-2 to GZ1-5 denote steel struts at Section 1 on levels 2 through 5.
FIGURE 8

Monitoring results of concrete strut axial force.
FIGURE 9

Monitoring results of steel strut axial force.
In the early stages of excavation, the concrete struts exhibited compressive behavior. As the lower-level steel struts began to bear load, the compressive force on the concrete struts gradually decreased and eventually transitioned into tensile force. With continued excavation, the tensile force increased steadily, reaching a maximum axial force of nearly 5,000 kN. Analysis of the axial force variations in steel struts from levels 2 to 5 reveals that the second-level steel struts remained relatively stable during excavation. In contrast, the axial forces in levels 3 to 5 increased progressively after installation. Once the next lower-level steel strut was loaded, the axial forces in the upper-level struts gradually stabilized. Both concrete and steel strut internal forces exhibited fluctuations due to temperature effects. Continuous automated data acquisition enabled clear capture of the internal force variations in the support system and elucidated the interaction patterns among structural components.
4.3 Differential settlement of concrete struts
Figure 10 presents the differential settlement distribution of the ZL1 concrete strut, monitored by fiber Bragg grating (FBG) hydrostatic level sensors. Position two corresponds to the central column pile in the middle of the mixed strut, while positions one and three are located on either side of the strut. It is evident that the heave at the central column pile (position 2) is greater than that at the side positions (1 and 3).
FIGURE 10

Differential settlement monitoring results of concrete struts.
The displacement at point 2 was subtracted by the average displacement of points 1 and 3, and the results are shown in Figure 11. The central column pile exhibited a relative displacement of nearly 20 mm compared to the two side positions. The “unloading rebound” effect caused by excavation is strongest at the center of the pit bottom, while the edges near the diaphragm walls experience smaller rebound due to friction and stiffness constraints imposed by the walls. Due to temperature effects on the hydrostatic level sensor tubing, displacement measurements at all points showed fluctuations.
FIGURE 11

Relative displacement of measurement point 2.
4.4 Soil heave at the excavation base
Figure 12 shows the strain distribution data obtained from low-modulus externally fixed strain-sensing cables. Figure 13 presents the soil heave at the excavation base, calculated by integrating the strain data. Specifically, panels (a) and (c) correspond to locations approximately one-third of the distance from the diaphragm wall, while panel (b) represents a position near the central column pile.
FIGURE 12

Strain distribution obtained from fiber optic cables. (a) Approximately one-third of the way up the diaphragm wall; (b) Near the midpoint of the column pile; (c) Approximately one-third of the way up the diaphragm wall.
FIGURE 13

Distribution of soil heave at the excavation base. (a) Approximately one-third of the way up the diaphragm wall; (b) Near the midpoint of the column pile; (c) Approximately one-third of the way up the diaphragm wall.
It can be observed that the strain-sensing cables clearly captured the deformation distribution of the soil strata. The soil deformation on both sides primarily occurred within the depth range of 30–40 m, while deformation in the central soil mass mainly occurred between 25 and 35 m. The soil heave in the middle of the excavation was significantly greater than that on the sides. Furthermore, strain increases were still detected below 50 m depth, indicating that the monitored boreholes for soil heave at the excavation base have not yet reached a stable stratum. This implies that traditional “above-pit-bottom monitoring” cannot capture potential deep-seated overall stability risks. Therefore, FBG’s high-density layered monitoring can precisely pinpoint depth zones with significant rebound deformation, providing empirical evidence for the depth design of pull-out-resistant piles and the scope of pit-bottom reinforcement.
The observed soil heave distribution follows the principles of classical unloading theory (Cheng et al., 2024). According to the unloading-rebound mechanism in soil mechanics, the excavation of soil leads to a significant decrease in vertical overburden pressure, causing the underlying strata to experience elastic and plastic rebound (Ye et al., 2022). Quantitatively, the measured heave profile (Figure 13) shows a typical exponential or hyperbolic decay with depth, which aligns with theoretical predictions for deep excavations where the “influence zone” of unloading typically extends 2–3 times the excavation depth. Specifically, the maximum heave occurring near the center of the excavation base validates the theoretical assumption that boundary constraints from diaphragm walls restrict rebound near the edges, while the unconstrained center experiences peak vertical strain (Ashis and Tetsuya, 2025).
According to excavation deformation theory for foundation pits, as the soil mass within the station excavation is unloaded, the earth pressure inside the pit continuously decreases. Under the action of this internal-external pressure differential, the station foundation pit and surrounding soil will experience varying degrees of deformation, primarily manifested as deep horizontal displacement of the retaining structures, surface settlement around the site, and soil heave at the excavation base. These three deformation phenomena constitute an interconnected system, as illustrated in Figure 14.
FIGURE 14

Schematic diagram of station foundation pit deformation.
4.5 Lateral earth pressure
Figure 15 shows the distribution of lateral earth pressure outside the foundation pit. Sensors one to six are positioned at depths of 2 m, 8 m, 14 m, 20 m, 26 m, and 32 m, respectively. As the excavation progresses, the earth pressure exhibits a gradual increasing trend. Among them, sensor 4, located at 20 m depth, recorded the highest earth pressure, which corresponds closely to the location of maximum diaphragm wall deformation.
FIGURE 15

Distribution of lateral earth pressure.
The six curves in the figure correspond to the time-history evolution of lateral earth pressure outside the foundation pit at depths ranging from 2 m (TYL2-1) to 32 m (TYL2-6). It can be seen that the shallowest layer (2 m depth) exhibits the smallest earth pressure, fluctuating slightly between −0.005 MPa and +0.005 MPa. As the burial depth increases, the earth pressure first decreases and then rebounds. At 14 m depth (TYL2-3), the maximum negative pressure of approximately −0.045 MPa is observed, after which the pressure gradually stabilizes. The earth pressure variation trends at depths between 20 m and 32 m are similar to those at 14 m but with slightly smaller magnitudes. Overall, during the winter months (November to December 2019), the earth pressure reached its peak negative values, followed by a gradual rebound during spring and summer. The deeper the depth, the more pronounced the negative pressure and the smaller the rebound amplitude, reflecting the combined effects of excavation-induced lateral unloading decreasing with depth and seasonal soil stress adjustments.
5 Discussion
Fiber Bragg gratings exhibit high consistency compared to traditional monitoring methods, yet subtle differences persist due to variations in measurement resolution. For instance, conventional inclinometers provide discrete point data (typically spaced at 0.5-m intervals), whereas fiber Bragg gratings deliver quasi-continuous strain distribution curves. Furthermore, the installation method of fiber optic sensing cables (direct burial or attachment to reinforcing bars) ensures better coupling with the structure, whereas manual inclinometer probe measurements rely on the fit between the probe and the inclinometer sleeve.
Systematic errors in FBG monitoring primarily stem from temperature-strain cross-sensitivity. Although temperature compensation is applied using FBG thermometers, rapid temperature fluctuations during concrete hydration or seasonal variations may still induce minor wavelength drift.
High-density monitoring data indicates that conventional monitoring intervals may overlook critical peak internal forces during rapid excavation phases. For instance, the 20-mm differential settlement detected in this study provided early warning of potential structural fatigue in concrete supports. This demonstrates that automated monitoring is not merely a convenience but an essential tool for identifying transient risks during complex urban excavation processes.
6 Conclusion
This study applies fiber Bragg grating (FBG) technology to foundation pit monitoring by developing an integrated automated monitoring system. The system continuously monitors key parameters including diaphragm wall horizontal displacement, internal forces in supports, differential settlement of concrete struts, soil heave at the excavation base, and lateral earth pressure, enabling comprehensive assessment of pit deformation and safety. The main conclusions are as follows:
An end-to-end monitoring platform was successfully established, integrating four functional layers from sensing to application. It overcomes the temporal and spatial limitations of traditional sensors, enabling real-time, 24/7 data acquisition for multi-parameter assessment.
Comparison with traditional manual methods demonstrates that FBG-based inclinometers provide high-precision horizontal displacement data, with the benefit of capturing quasi-continuous deformation profiles that reveal structural behavior more accurately than discrete point sensors.
The settlement increment at the central column pile is approximately 20 mm greater than at the side positions, indicating that differential settlement of concrete struts is primarily concentrated at the column pile and highlighting the need for focused local settlement control.
Soil heave at the excavation base is significantly greater at the central position than at the sides, with strain continuously increasing down to 50 m depth, suggesting that the current monitoring boreholes have not yet reached stable strata. Future monitoring should extend to greater depths to accurately capture the heave’s final state.
Lateral earth pressure outside the pit decreases and then rebounds with increasing excavation depth, with the negative pressure peak at 20 m corresponding to the location of maximum diaphragm wall deformation, indicating a significant coupling effect between lateral unloading and retaining structure deformation.
The FBG system enables integrated monitoring of the “wall-strut-pile-soil” system, eliminating the previous isolation of individual monitoring data points and allowing for a comprehensive assessment of the overall stability of the excavation pit.
Statements
Data availability statement
The original contributions presented in the study are included in the article/Supplementary Material, further inquiries can be directed to the corresponding author.
Author contributions
ZW: Conceptualization, Methodology, Writing – original draft, Writing – review and editing. CS: Formal Analysis, Writing – original draft, Writing – review and editing. GoY: Writing – review and editing. HW: Resources, Writing – review and editing. GiY: Conceptualization, Funding acquisition, Investigation, Supervision, Writing – review and editing.
Funding
The author(s) declared that financial support was not received for this work and/or its publication.
Conflict of interest
Authors ZW and GoY were employed by China Energy Group Xinjiang Kaidu River Basin Hydropower Development Corporation Limited. Authors CS and GiY were employed by Power China Guiyang Engineering Corporation Limited. Author HW was employed by Suzhou Nanzee Sensing Technology Corporation Limited.
Generative AI statement
The author(s) declared that generative AI was not used in the creation of this manuscript.
Any alternative text (alt text) provided alongside figures in this article has been generated by Frontiers with the support of artificial intelligence and reasonable efforts have been made to ensure accuracy, including review by the authors wherever possible. If you identify any issues, please contact us.
Publisher’s note
All claims expressed in this article are solely those of the authors and do not necessarily represent those of their affiliated organizations, or those of the publisher, the editors and the reviewers. Any product that may be evaluated in this article, or claim that may be made by its manufacturer, is not guaranteed or endorsed by the publisher.
Supplementary material
The Supplementary Material for this article can be found online at: https://www.frontiersin.org/articles/10.3389/feart.2026.1766390/full#supplementary-material
References
1
Aldo M. Luigi Z. Agnese C. Catalano E. Zeni G. Damiano E. et al (2021). Distributed optical fiber sensor applications in geotechnical monitoring. Sensors21 (22), 7514. 10.3390/S21227514
2
Ashis A. Tetsuya K. (2025). Advances in fibre-optic-based slope reinforcement monitoring: a review. J. Rock Mech. Geotechnical Eng.17 (2), 1263–1284. 10.1016/j.jrmge.2024.03.022
3
Bashan G. Diamandi H. London Y. Sharma K. Shemer K. Zehavi E. et al (2021). Forward stimulated brillouin scattering and opto-mechanical non-reciprocity in standard polarization maintaining fibres. Light Sci. and Appl.10 (1), 119–131. 10.1038/S41377-021-00557-Y
4
Cao D. Shi B. Zhu H. Wei G. Bektursen H. Sun M. (2019). A field study on the application of distributed temperature sensing technology in thermal response tests for borehole heat exchangers. Bull. Eng. Geol. Environ.78 (6), 3901–3915. 10.1007/s10064-018-1407-2
5
Chakraborty S. Tomlinson G. (2003). An initial experimental investigation into the change in magnetic induction of a Terfenol-D rod due to external stress. Smart Materials&Structures12 (5), 763–774. 10.1088/0964-1726/12/5/013
6
Cheng G. Xu W. Shi B. Wu J. Sun B. Zhu H. (2022). Experimental study on the deformation and failure mechanism of overburden rock during coal mining using a comprehensive intelligent sensing method. J. Rock Mech. Geotechnical Eng.14 (5), 1626–1641. 10.1016/J.JRMGE
7
Cheng H. Chen H. Zhang S. Jia H. (2024). Investigations into ground surface settlement characteristics of excavation under dewatering and excavating conditions using the response surface experimental design method. Bull. Geol. Sci. Technol.43 (05), 181–196. 10.19509/j.cnki.dzkq.tb20230294
8
Francesco B. Joan R. C. (2021). A review of recent distributed optical fiber sensors applications for civil engineering structural health monitoring. Sensors21 (5), 1818. 10.3390/S21051818
9
Hill K. Fujii Y. Johnson D. Kawasaki B. S. (2008). Photosensitivity in optical fiber waveguides: application to reflection filter fabrication. Appl. Phys. Lett.32 (10), 647–649. 10.1063/1.89881
10
Hong C. Xu C. Chen W. Liu J. Tan J. (2025). Monitoring excavation-induced deformation of a secant pile wall using distributed fiber optic sensors. Sensors25 (1), 254. 10.3390/S25010254
11
Marcelo J. Ralph C. Alison B. (1999). Coupled structural-magnetic strain model for magnetostrictive transducers. Smart Struct. Mater.3668, 405–416. 10.1117/12.350719
12
Meng F. Piao C. Shi B. Sasaoka T. Shimada H. (2021). Calculation model of overburden subsidence in mined-out area based on brillouin optical time-domain reflectometer technology. Int. J. Rock Mech. Min. Sci.138, 104620, 138. 10.1016/J.IJRMMS
13
Nicard C. Rébillat M. Devos O. El May M. Letellier F. Dubent S. et al (2025). In-situ monitoring of µm-sized electrochemically generated corrosion pits using lamb waves managed by a sparse array of piezoelectric transducers. Ultrasonics147, 107527. 10.1016/J.ULTRAS
14
Rui Y. Battista D. Kechavarzi C. Xu X. Yin M. (2021). Distributed fiber optic monitoring of a CFA pile with a central reinforcement bar bundle. Front. Struct. Civ. Eng.15 (1), 1–10. 10.1007/S11709-020-0581-Z
15
Wang X. Shi B. Wei G. Chen S. (2017). An energy demodulation based fiber optic sensing system for landslide early-warning. Appl. Sci.7, 699. 10.3390/app7070699
16
Werner J. Belz M. Klein K. Sun T. Grattan K. (2021). Fiber optic sensor designs and luminescence-based methods for the detection of oxygen and pH measurement. Measurement178 (08), 589–602. 10.1016/J.MEASUREMENT
17
Yan J. Shi B. Zhu H. Wang B. J. Wei G. Q. Cao D. F. (2015). A quantitative monitoring technology for seepage in slopes using DTS. Eng. Geol.186, 100–104. 10.1016/j.enggeo.2015.01.001
18
Yao J. Shi B. Liu J. Sun M. Fang K. Yao J. et al (2022). Improvement and performance evaluation of a dual-probe heat pulse distributed temperature sensing method used for soil moisture estimation. Sensors22 (19), 7592. 10.3390/S22197592
19
Ye X. Zhu H. Wang J. Zhang Q. Shi B. Schenato L. et al (2022). Subsurface multi-physical monitoring of a reservoir landslide with the fiber-optic nerve system. Geophys. Res. Lett.49 (11), e2022GL098211. 10.1029/2022GL098211
20
Zeng C. Liang S. Sun Y. Su Y. (2014). Discrete dynamics analysis for nonlinear collocated multivariable mass-damper-spring intelligent mechanical vibration systems. J. Vibroengineering16 (2), 633–644.
21
Zhang X. Zhu H. Jiang X. Broere W. (2024). Distributed fiber optic sensors for tunnel monitoring: a state-of-the-art review. J. Rock Mech. Geotechnical Eng.16 (9), 3841–3863. 10.1016/j.jrmge.2024.01.008
22
Zhu H. Shi B. Zhang C. (2017). FBG-based monitoring of geohazards: current status and trends. Sensors17 (3), 452. 10.3390/s17030452
23
Zhu H. Liu W. Wang T. Su J. W. Shi B. (2022). Distributed acoustic sensing for monitoring linear infrastructures: current status and trends. Sensors22 (19), 7550. 10.3390/S22197550
Summary
Keywords
automated monitoring, deep excavation, fiber bragg grating (FBG), foundation pit, optical fiber sensor
Citation
Wei Z, Sun C, Yang G, Wang H and Yang G (2026) Automated monitoring of deep excavations using fiber bragg grating technology. Front. Earth Sci. 14:1766390. doi: 10.3389/feart.2026.1766390
Received
12 December 2025
Revised
29 December 2025
Accepted
02 January 2026
Published
05 February 2026
Volume
14 - 2026
Edited by
Faming Huang, Nanchang University, China
Reviewed by
Dao-Yuan Tan, Nanjing University, China
Xiao Ye, Nanjing University of Information Science and Technology, China
Updates
Copyright
© 2026 Wei, Sun, Yang, Wang and Yang.
This is an open-access article distributed under the terms of the Creative Commons Attribution License (CC BY). The use, distribution or reproduction in other forums is permitted, provided the original author(s) and the copyright owner(s) are credited and that the original publication in this journal is cited, in accordance with accepted academic practice. No use, distribution or reproduction is permitted which does not comply with these terms.
*Correspondence: Chuansheng Sun, 362861621@qq.com
Disclaimer
All claims expressed in this article are solely those of the authors and do not necessarily represent those of their affiliated organizations, or those of the publisher, the editors and the reviewers. Any product that may be evaluated in this article or claim that may be made by its manufacturer is not guaranteed or endorsed by the publisher.