 Juan S. Thomas
 Sara Gamboa
 Manuel Hernández Fernández
 Oscar Murillo
 Jonathan S. Pelegrin
- 1Grupo de Investigación en Ecología y Conservación de la Biodiversidad (EcoBio), Equipo de Paleobiología, Ecología y Evolución (PaleoEco), Facultades de Ciencias Básicas y Educación, Universidad Santiago de Cali, Cali, Colombia
- 2MAPAS Lab, Centro de Investigación Mariña, Universidade de Vigo, Vigo, Spain
- 3Departamento de Geodinámica, Estratigrafía y Paleontología, Facultad de Ciencias Geológicas, Universidad Complutense de Madrid, Madrid, Spain
- 4Departamento de Cambio Medioambiental, Instituto de Geociencias (UCM, CSIC), Madrid, Spain
- 5Grupo de Investigación en Ecología Animal, Departamento de Biología, Facultad de Ciencias Naturales y Exactas, Universidad del Valle, Cali, Colombia
The resource-use hypothesis proposed by Elisabeth S. Vrba suggests that lineages display varying tendencies toward generalism or specialization in biome occupancy, with a tendency towards the accumulation of specialists due to their higher rate of speciation through vicariance. It also posits differences in biome occupancy patterns driven by the environmental characteristics of biomes, with a higher presence of biome specialist species in biomes that are placed in the extremes of the global climatic gradients. Here, we tested this hypothesis in turtles, a very ancient and morphologically stable lineage, representing a remarkable diversity with 357 species, many of which are threatened with extinction. We analyzed the resource-use hypothesis in a phylogenetic context within the Testudines lineage. For this purpose, a presence/absence matrix was compiled for all species across all 10 terrestrial biomes. Their distribution across biomes was contrasted with 10,000 Monte Carlo simulations. The relationship between diversification rates and both the biomic specialization index and the biomes occupied by specialists species was evaluated. The results demonstrate strong consistency with Vrba`s hypothesis, revealing a higher number of biome specialist species than expected by chance, with a significant accumulation of species in tropical ecosystems. These trends also were observed for ecological groups (terrestrial and freshwater species). In addition, higher diversification rates were observed for biome specialist species, although the particular biome occupied did not significantly influence their diversification rates.
Introduction
Historically, the distribution and climatic conditions of the biomes have undergone constant change, resulting in significant alterations to the geographic distribution of species (Hernández Fernández and Vrba, 2005b; Moreno Bofarull et al., 2008; Landis et al., 2021). These distributions are closely linked to climate, as well as to large-scale historical and macroevolutionary dynamics (Wiens and Donoghue, 2004; Jetz and Fine, 2012; Gamboa et al., 2024). Climatic changes influence the expansion and retraction of biomes, determining the emergence or modification of ecological and geographic barriers (Werneck, 2011; Scheffers et al., 2016).
Several works have pointed out how historical climatic changes affecting biome dynamics have been a determining factor in the configuration of large-scale biodiversity (Vrba, 1992; Moreno Bofarull et al., 2008; Cantalapiedra et al., 2011; Gamboa et al., 2022; Hernández Fernández et al., 2022; Pelegrin et al., 2023). In this context, the resource use hypothesis (RUH) (Vrba, 1987, 1992) is an important approach for analyzing the relationship between climate and macroevolutionary history. Vrba’s work emphasizes the significance of biomes and their dynamics, particularly fragmentation, in the processes of speciation and extinction within lineages. According to this hypothesis, large-scale environmental changes lead to changes in the geographic distribution of biomes, along with fragmentation events that drive species diversification through vicariance. This phenomenon is particularly pronounced in species specialized to specific biomes, due to their narrow ecological ranges and specialized adaptations. In contrast, species with generalist biome preferences may experience less pronounced effects due to their ecological flexibility and broader distributions (Vrba, 1987, 1992). On the other hand, the RUH predicts that biomes at the extremes of the climatic gradient (with extreme values for temperature and rainfall) are more susceptible to the impacts of global climate changes (Vrba, 1992; Hernández Fernández and Vrba, 2005b). Such biomes are: evergreen equatorial rainforest (hot and humid), subtropical desert (hot and dry), steppe (cold and dry), and tundra (extremely cold and relatively humid). According to their dynamics, we expected that these biomes host a statistically outstanding presence of specialist species resulting from vicariance and speciation events.
The RUH has provided valuable insights into the understanding of the distribution of current biotic diversity across space and time by relating differential speciation and occupation of biomes. Different studies consistently support this hypothesis, which has been primarily evaluated in terrestrial mammals (Hernández Fernández and Vrba, 2005b; Moreno Bofarull et al., 2008; Cantalapiedra et al., 2011; Menéndez et al., 2021; Hernández Fernández et al., 2022), birds (Pelegrin, 2016) and butterflies (Gamboa et al., 2022). Assessing whether this hypothesis is corroborated by additional groups of animals is important for understanding large-scale evolutionary dynamics. This is relevant not only for the study of lineages’ evolutionary history, but also because it has implications for the potential prediction of future species conservation outcomes in the face of current climatic change, providing crucial information for the development of biodiversity conservation plans. Rooting biodiversity conservation on evolutionary dynamics and lineage history will allow to preserve species’ evolution and future diversification dynamics with minimal disruption.
Testudines represent a diverse group of vertebrates characterized by the evolution of a protective shell, largely based on the modification of their ribs (Bergmann and Irschick, 2012). This ancient lineage has its origin in the Lower Jurassic, while earlier stem groups within Testudinata date back to the Upper Triassic, and has a relatively well-known paleontological record (Selvatti et al., 2023). Their diversity is near 357 species (Rhodin et al., 2021) and has achieved a successful ecological presence, colonizing many continental and marine habitats (Stanford et al., 2020). Turtles’ distribution spans across all continents except Antarctica, and they occupy all terrestrial biomes except taiga and tundra (Bonin et al., 2006; Rhodin et al., 2021), showing notable adaptability to varied climatic conditions through the evolution of different strategies that allow them to deal with climatic seasonality (Ultsch, 2006). As ectothermic organisms, turtles are closely linked to the abiotic conditions of their environments (Labra et al., 2008; Dayananda et al., 2021). Therefore, these organisms are particularly vulnerable to climatic changes (Poloczanska et al., 2009; Waterson et al., 2016; Butler, 2019; Patrício et al., 2021). All exposed traits pinpoint to turtles as an interesting model for testing macroevolutionary processes as the ones depicted in the RUH. Nevertheless, it is not known yet whether their unique attributes might shape biome occupancy trends that deviate from observed trends in other animal taxa. Also, recent comprehensive phylogenetic analyses have shed light on the evolutionary relationships among turtle species (Thomson et al., 2021), which provides a robust framework for assessing the resource-use hypothesis.
Thus, our aim was to test the resource-use hypothesis in turtles through the evaluation of their biome occupancy patterns under a phylogenetic frame. We tested two predictions of the resource-use hypothesis for all testudine species: 1. Given that clades of biome specialist species are generally affected by a high incidence of vicariance and speciation, we should expect to find more biome specialists than would occur by chance; 2. biomes located at the extremes of the global climatic gradient, should have undergone a high degree of fragmentation due to historical climatic changes. Therefore, we should expect a higher proportion of specialist species in those biomes. Our findings provide insights into the history of the different turtle lineages, their diversification processes, and the influence of biomes climatic history in their evolution.
Materials and methods
Bioclimatic characterization of the species
In order to evaluate (Vrba, 1987, 1992) resource-use hypothesis in modern Testudines, our study was conducted on a global scale. Based on the time-calibrated phylogeny of Thomson et al. (2021) and geographic distribution data from Bonin et al. (2006) and Rhodin et al. (2021), supplemented by information from scientific literature for specific species (Fritz et al., 2008; Van Dijk and Rhodin, 2010; Thomson et al., 2011; Singkily et al., 2018; Caramaschi, 2021). We determined the biomes inhabited by each species, based on Walter (1970) biome classification, modified by Hernández Fernández (2001) (Figure 1).
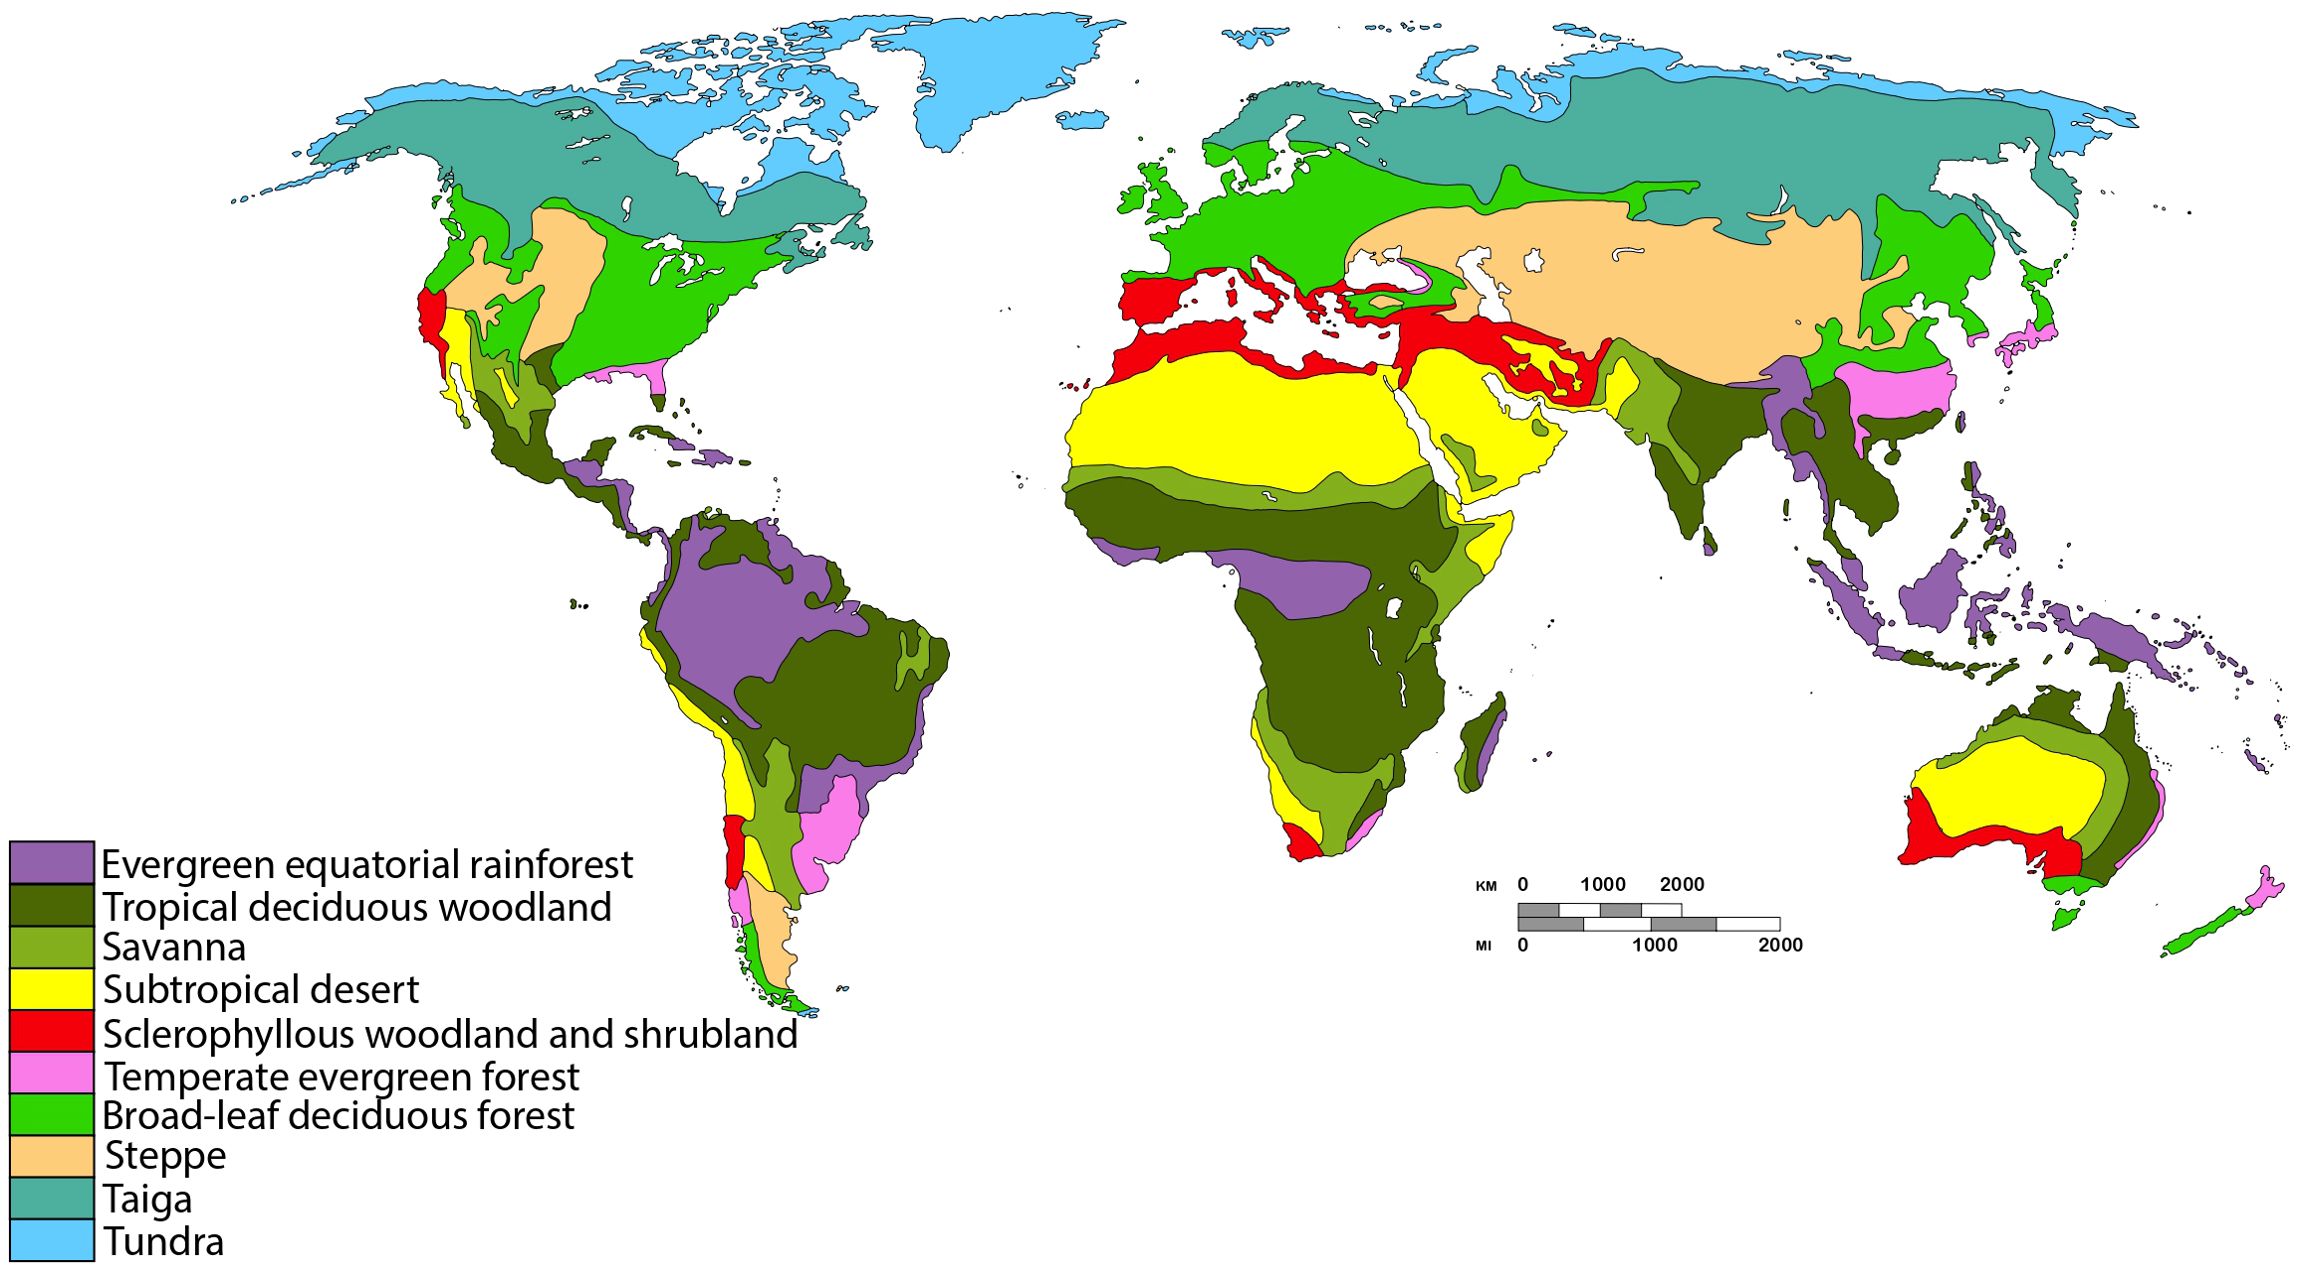
Figure 1. Classification of biomes and global distribution of vegetation types (modified from (Hernández Fernández et al., 2022).
Following Hernández Fernández (2001) a biome was considered occupied by a species if it represented 15% or more of the species’ geographic range. In addition, due to the existence of species with extensive ranges, a biome was also considered occupied if the species inhabited 50% or more of a particular climatic domain, defined as a contiguous terrestrial area consisting of a single biome. Marine species were assessed based on the biomes associated with their primary breeding areas. These criteria allow us to represent the species’ adaptive capacities while maintaining their climatic specificity and facilitate comparison with previous works that used the same methodology (Hernández Fernández and Vrba, 2005a; Moreno Bofarull et al., 2008; Cantalapiedra et al., 2011; Gómez Cano et al., 2013; Menéndez et al., 2021; Gamboa et al., 2022; Hernández Fernández et al., 2022; Pelegrin et al., 2023).
We calculated the Biomic Specialization Index (BSI) for each species (Hernández Fernández and Vrba, 2005b), which represents the number of biomes occupied by the species. Once calculated, it allows the classification of species into three categories (Hernández Fernández and Vrba, 2005b): biome specialists, occupying a single biome (BSI = 1), moderate generalists (BSI between 2 and 4), and extreme generalists (BSI ≥ 5).
Monte Carlo simulations and analysis
The biome occupancy data for all species, based on the taxonomy of Rhodin et al. (2021), were compiled into a matrix representing the presence (1) or absence (0) of each species in each of the 10 terrestrial biomes. Subsequently, 10,000 Monte Carlo simulations (Gotelli, 2000) were conducted to test for significant differences in the observed patterns of biome occupation compared to a random distribution of the species (Hernández Fernández and Vrba, 2005b; Hernández Fernández et al., 2022). Because the specific ecological characteristics of each biome affect species richness, there is no reason to consider the same number of species for all biomes in the null model (Jetz and Fine, 2012). The randomization was performed by randomly placing species in the biomes but limiting the species richness of the biomes according to the observed values. The significance (p-value) of the observed trends was assessed by comparing observed and simulated values (Hernández Fernández and Vrba, 2005b).
Given that families are significant evolutionary units (lineages) (Humphreys and Barraclough, 2014), Monte Carlo analyzes were conducted not only for all Testudines but also independently for their families. In order to ensure the robustness of the statistical analyses, only families with a minimum of 10 species were included. Specifically, seven families were analyzed (Chelidae, Geoemydidae, Emydidae, Kinosternidae, Pelomedusidae, Testudinidae, and Trionychidae), which represent half of the extant turtle families and 92% of all species.
Finally, to determine whether the observed pattern was reflected in species ecology, we conducted independent Monte Carlo analyses for terrestrial and freshwater species, excluding marine species due to their representation being fewer than 10. All analyses were conducted using the R software (R Core Team, 2024).
Species-specific diversification rates
The relationship between diversification rate (DR) and the biome specialization, represented by the number of biomes inhabited by a species and the specific biome occupied (in the case of biomic specialist species), was assessed. Diversification rates for each species were calculated using the evol.distinct function of the R picante package (Kembel et al., 2010) based on the phylogeny from Thomson et al. (2021), which includes all 14 living families, 90 of the 92 living genera (98%), and 279 of the 357 living species (78%) of species in the group. This function estimates DR values by considering the number of splits and internodal distances of branches from each species or tip to the root of the tree, giving greater weight to more recent branches and splits (Jetz et al., 2012). Thus, to evaluate the statistical significance of the relationship between diversification rates and the number of biomes occupied by species, we employed a phylogenetic generalized least squares (PGLS) approach using the R nlme package (Pinheiro et al., 2023) under a Brownian evolution model (Freckleton and Harvey, 2006). This method accounts for the expected covariance of data, incorporating phylogenetic relationships among species (Mundry, 2014).
Given that many of the traits influencing species’ capability to inhabit different biomes are related to its anatomy, physiology or behavior, all of which are heritable traits (Cava et al., 2019), it is crucial to incorporate a phylogenetic perspective in statistical analyses. This approach allows to differentiate signals of evolutionary processes from potential phylogenetic conservatism (Gamboa et al., 2022; Pelegrin et al., 2023). In order to ascertain whether biome specialist species exhibit notable differences in diversification rates contingent on their occupation of disparate biomes, we conducted a phylogenetic analysis of variance (phyANOVA) to test for significant differences in DR among groups of specialist species adapted to different biomes using a Brownian motion model of evolution (Freckleton and Harvey, 2006). This analysis was performed using the R packages phytools (Revell, 2012) and geiger (function aov.phylo; Pennell et al., 2014).
Results
Biomic occupancy of Testudines
Our findings indicate that turtles are present in eight of the ten terrestrial biomes, with the highest levels of occupancy observed in five of these (BSI= 5). The frequency distribution of BSI exhibited a pronounced rightward skew (Figure 2), with a relatively low mean BSI (BSI = 1.56). In total, 205 species (57.7%) are confined to a single biome, while 113 species (31.9%) are distributed across two biomes. Furthermore, only 1.4% of Testudines (five species) can be classified as extreme biome generalists (Supplementary Table S1).
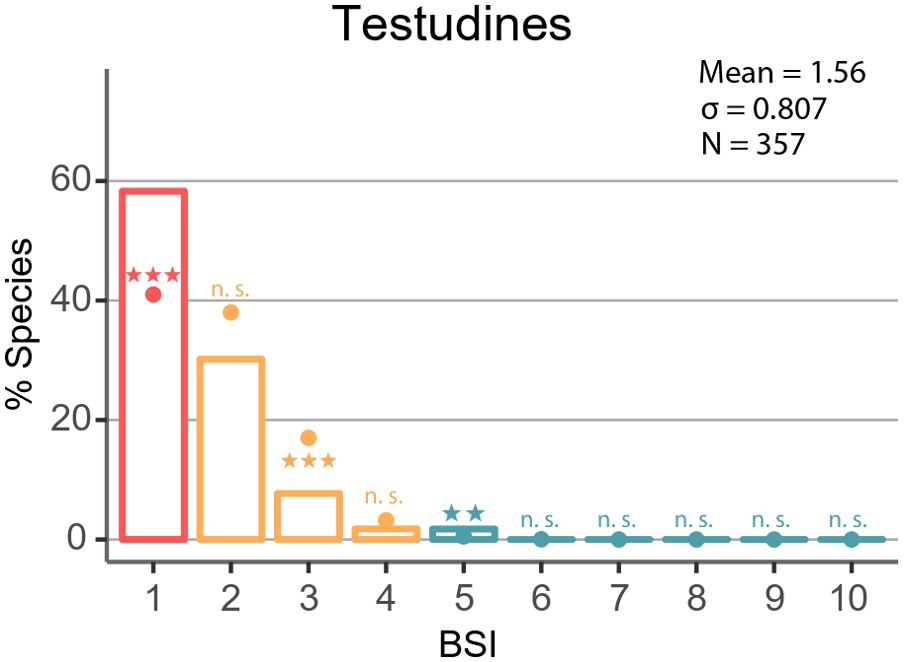
Figure 2. Biome specialization among Testudines. Observed (bars) and simulated (dots) frequency distribution of the biome specialization index (BSI) in Testudines. Symbols above or below the dots indicate whether observed results are significantly higher (above) or lower (bellow) than expected by chance with: ***p <.001; **.01 > p >.001; *.05 > p >.01; n.s., not significant. Complete data associated with this analysis are shown in Supplementary Table S1. The symbol (*) refers to the stars located on each of the bars, positioned above or below the point indicating the simulated distribution of biome specialization.
Monte Carlo simulations for all species revealed a significantly higher proportion of biome specialist species than expected by chance. In contrast, the number of moderate biome generalist species was lower or not significantly different than expected from the simulations. Among extreme biome generalists, species with a BSI=5 were found in a higher number than anticipated from the simulations, while species with BSI=6 and above were not observed or found in the simulations (Supplementary Table S1; Figure 2). In the same way, the Monte Carlo simulations by ecological groups showed the same trends for terrestrial and freshwater turtles as previously observed (Supplementary Tables S4, S5), with a greater accumulation of specialists than expected by chance for both groups.
On the other hand, the distribution of species across biomes reveals the Tropical deciduous woodland as the richest biome, with 221 species, followed by the evergreen equatorial rainforest with 112 species. The remaining biomes exhibited less than 59 species, with the steppe recording the lowest number at just 10 species. It is noteworthy that neither the taiga nor the tundra biomes were home to any species (Supplementary Table S3). We found that this distribution closely resembles that of biome specialist species, with a notable concentration of species in the Tropical deciduous woodland, followed by the Evergreen equatorial rainforest. The only distinction is the absence of biome specialists in the Steppe (Figure 3, Supplementary Table S1). On the other hand, terrestrial species exhibited a notably high occupation in the subtropical desert and sclerophyllous woodland and shrubland, comparable to their presence in evergreen equatorial rainforest and savanna (Supplementary Table S6). In contrast, freshwater species exhibited the same trend as observed in previous analyses, with a higher accumulation of specialist in tropical biomes (Supplementary Table S7).
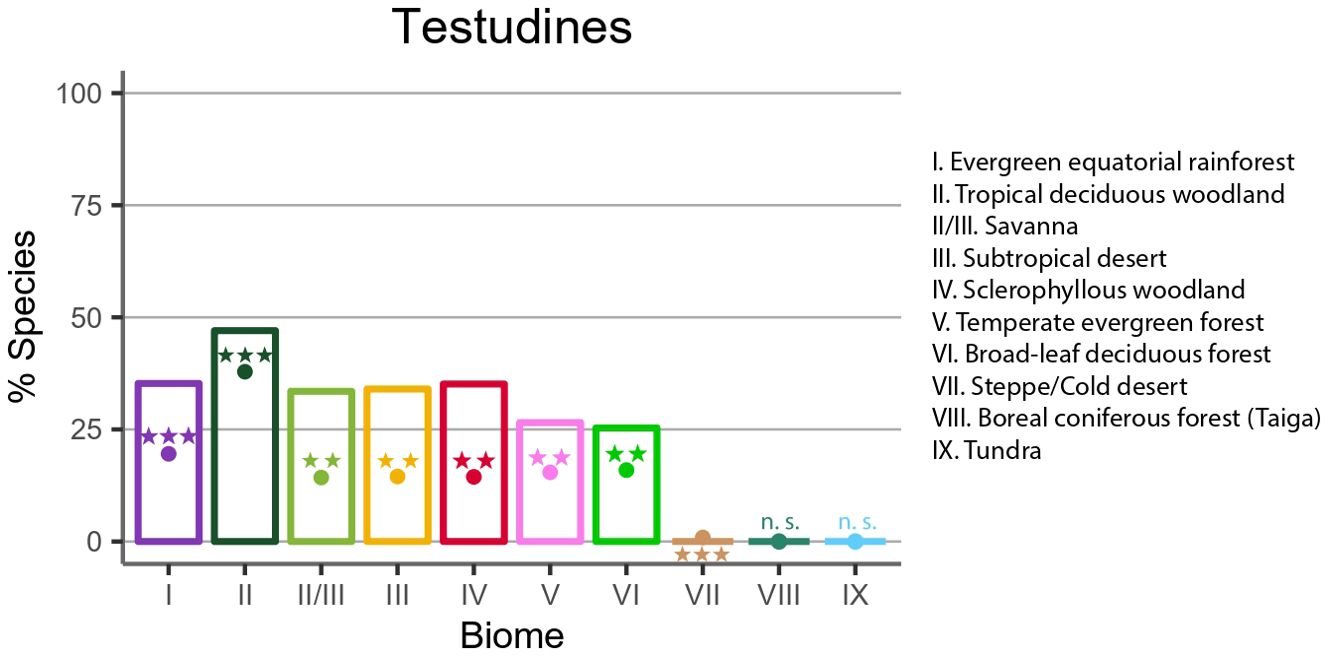
Figure 3. Percentage of Biome specialists distribution across biomes. Observed (bars) and simulated (dots) percentage of specialist species in each biome in Testudines (colors as in Figure 1). Symbols above or below the dots indicate whether observed results are significantly higher (above) or lower (bellow) than expected by chance with: ***p <.001; **.01 > p >.001; *.05 > p >.01; n.s., not significant. Complete data associated with this analysis are shown in Supplementary Table S3. The symbol (*) refers to the stars located on each of the bars, positioned above or below the point indicating the simulated distribution of biome specialization.
Biome specialization across clades
Regarding the Monte Carlo simulations per family, six of the evaluated families (Chelidae, Geoemydidae, Emydidae, Kinosternidae, Pelomedusidae, Testudinidae) showed the expected pattern according to the resource-use hypothesis. However, the family Trionychidae showed an unexpected distribution, characterized by a significantly higher percentage of species than expected with BSI=2 and fewer biome specialist species than expected based on the Monte Carlo simulations (Figure 4). Extreme generalist species were found among most of these families, although their occurrence was higher than expected by chance only in two families (Geoemydidae, Pelomedusidae). Additionally, we found that in all biomes, except for the subtropical desert, the broadleaf deciduous forest and steppe, the number of specialist species was higher than expected by chance according to Monte Carlo simulations (Figure 3; Supplementary Table S3).
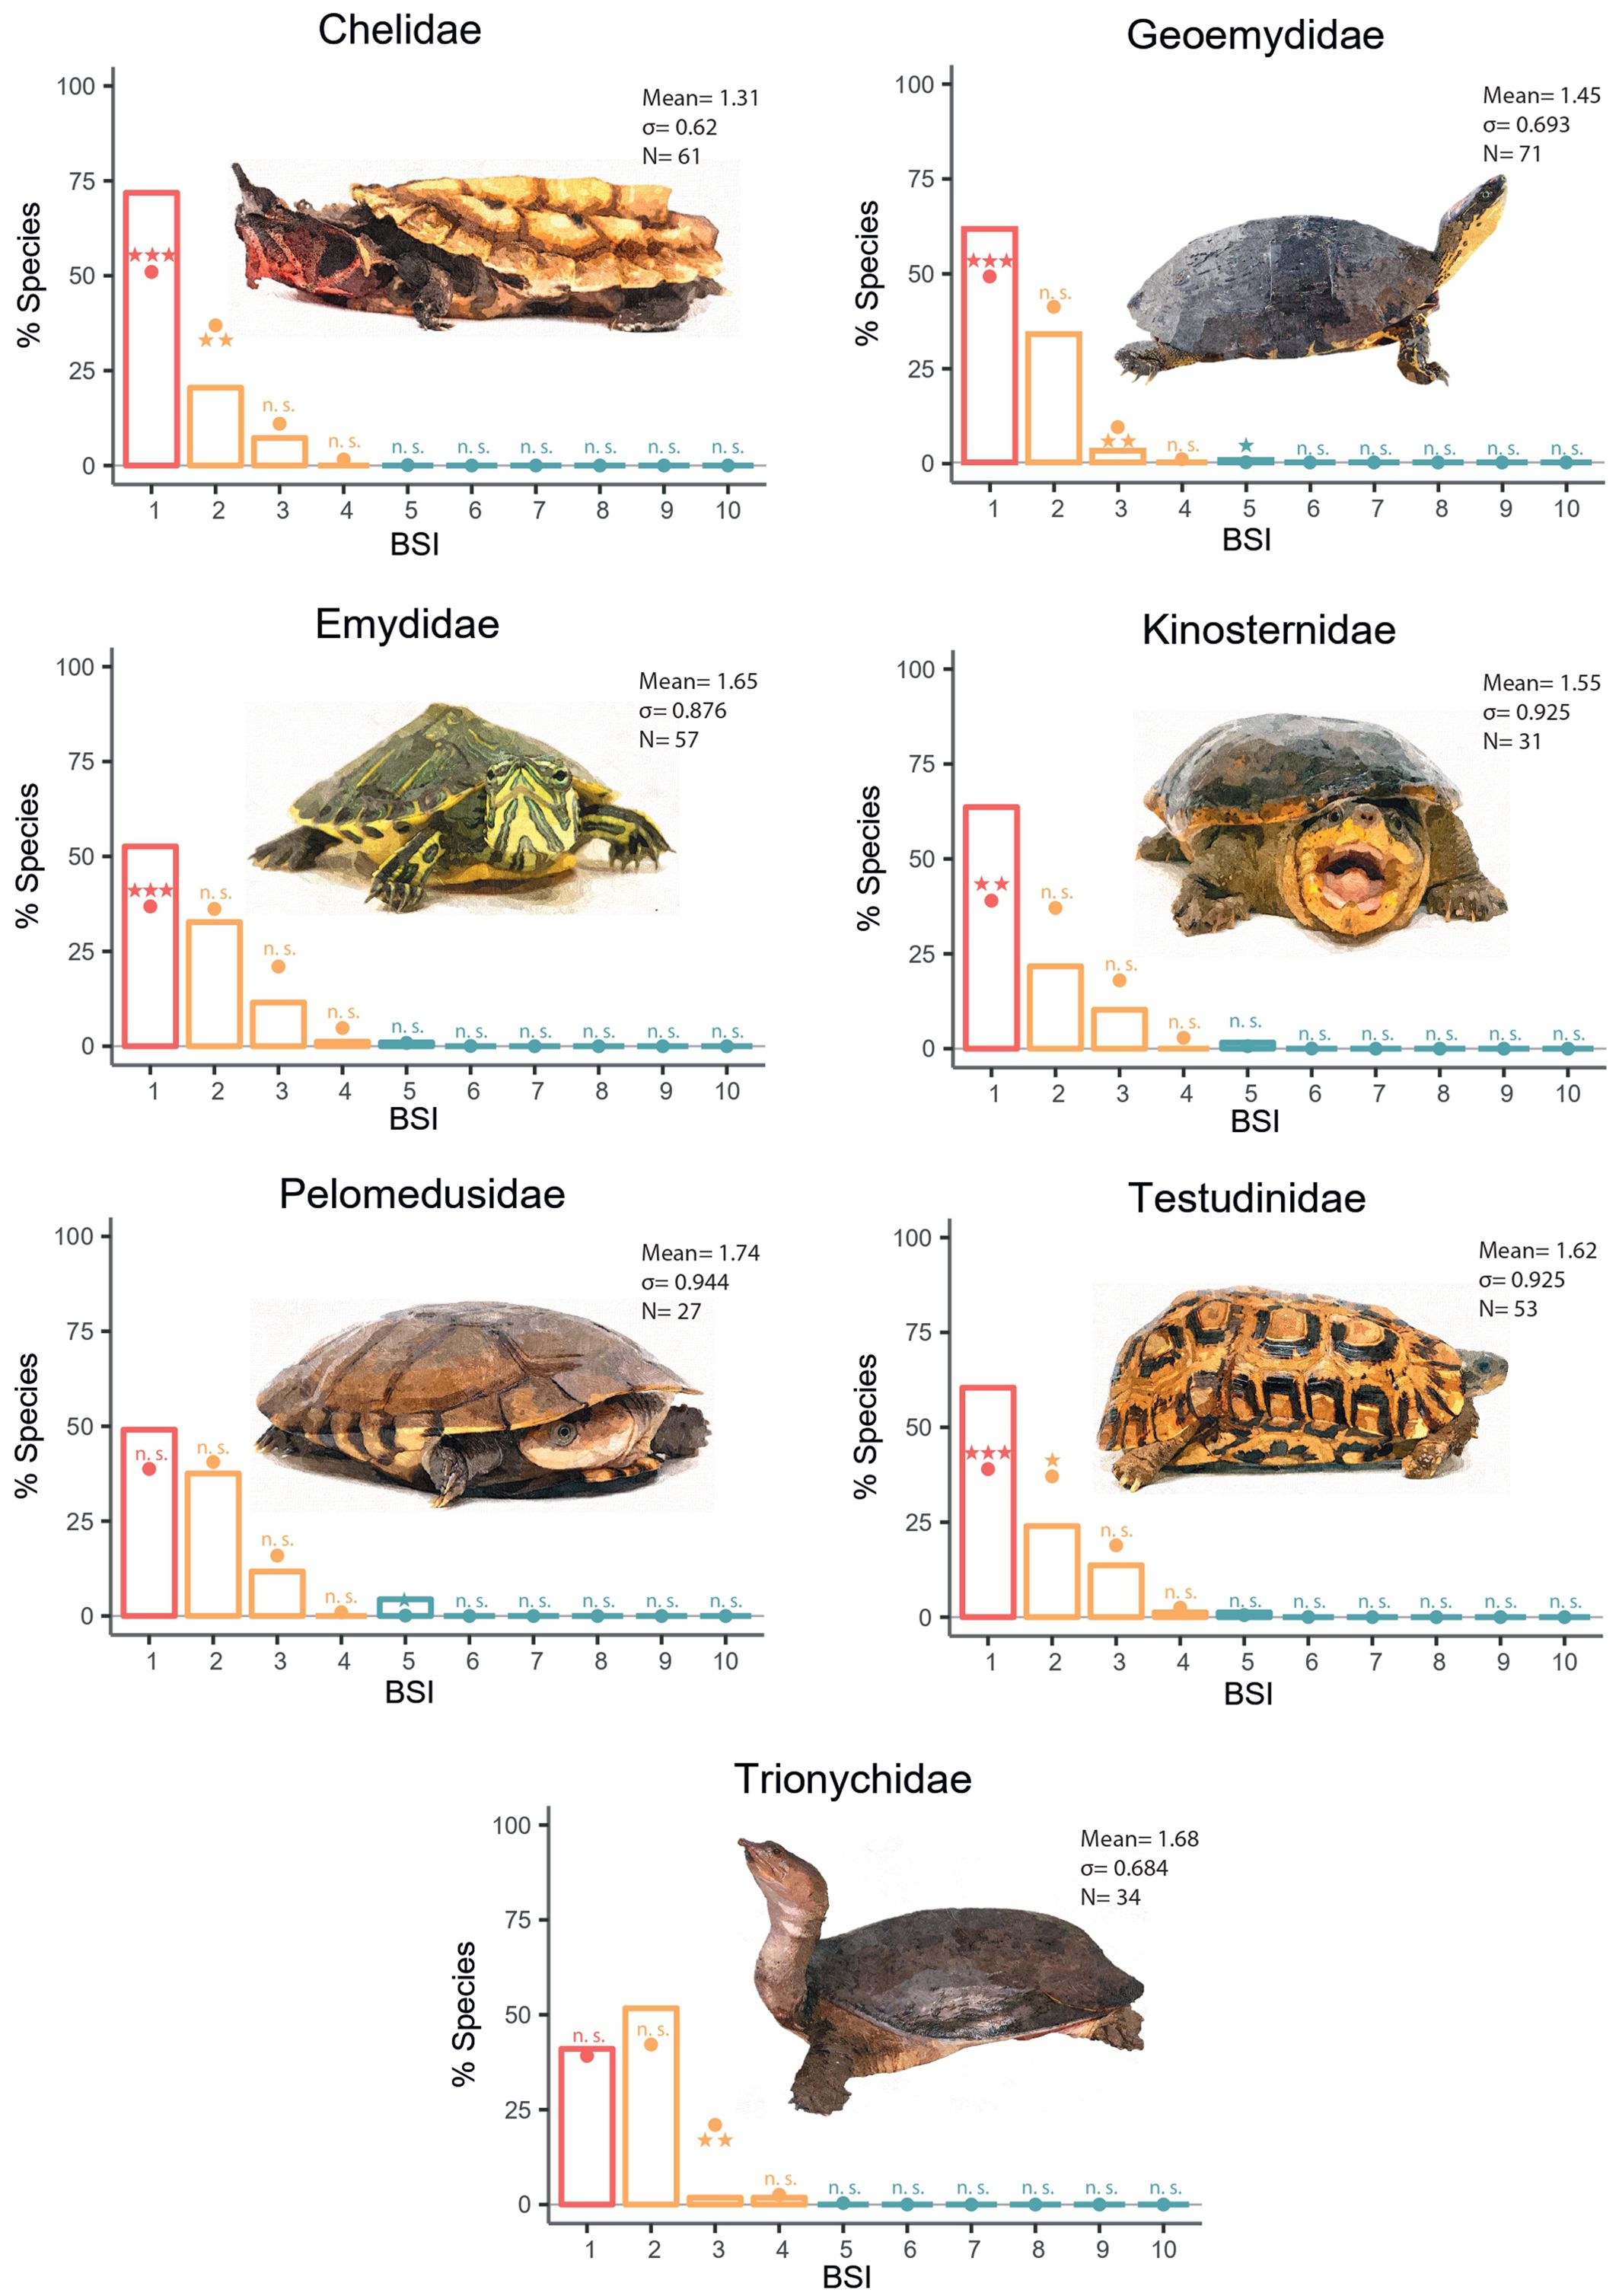
Figure 4. Biome specialization among selected Testudines families. Observed (bars) and simulated (dots) frequency distribution of the biome specialization index (BSI) in the families. Symbols above or below the dots indicate whether observed results are significantly higher (above) or lower (bellow) than expected by chance with: ***p <.001; **.01 > p >.001; *.05 > p >.01; n.s., not significant. Complete data associated with these analyses are shown in Supplementary Table S2.
Species-specific diversification rates
Among families, Emydidae exhibited the highest diversification rate. Conversely, Platysternidae and Carettochelyidae showed the lowest rates (Figure 5). Upon calculating the diversification rates for all species in the phylogeny, the information was grouped based on their Biome Specialization Index (BSI). Biome specialists showed significantly higher diversification rates compared to moderate and extreme generalists (Figure 6, Table 1). The phylogenetic generalized least squares (PGLS) test showed that there is a strong correlation between DR and BSI (p = 0.014, r2 adjusted = 0.886) (Supplementary Table S9). Moreover, an increase in the standard error is observed as the BSI increases, due to the greater variability and sensitivity to fluctuations when working with smaller data sets (Camacho-Sandoval, 2007).
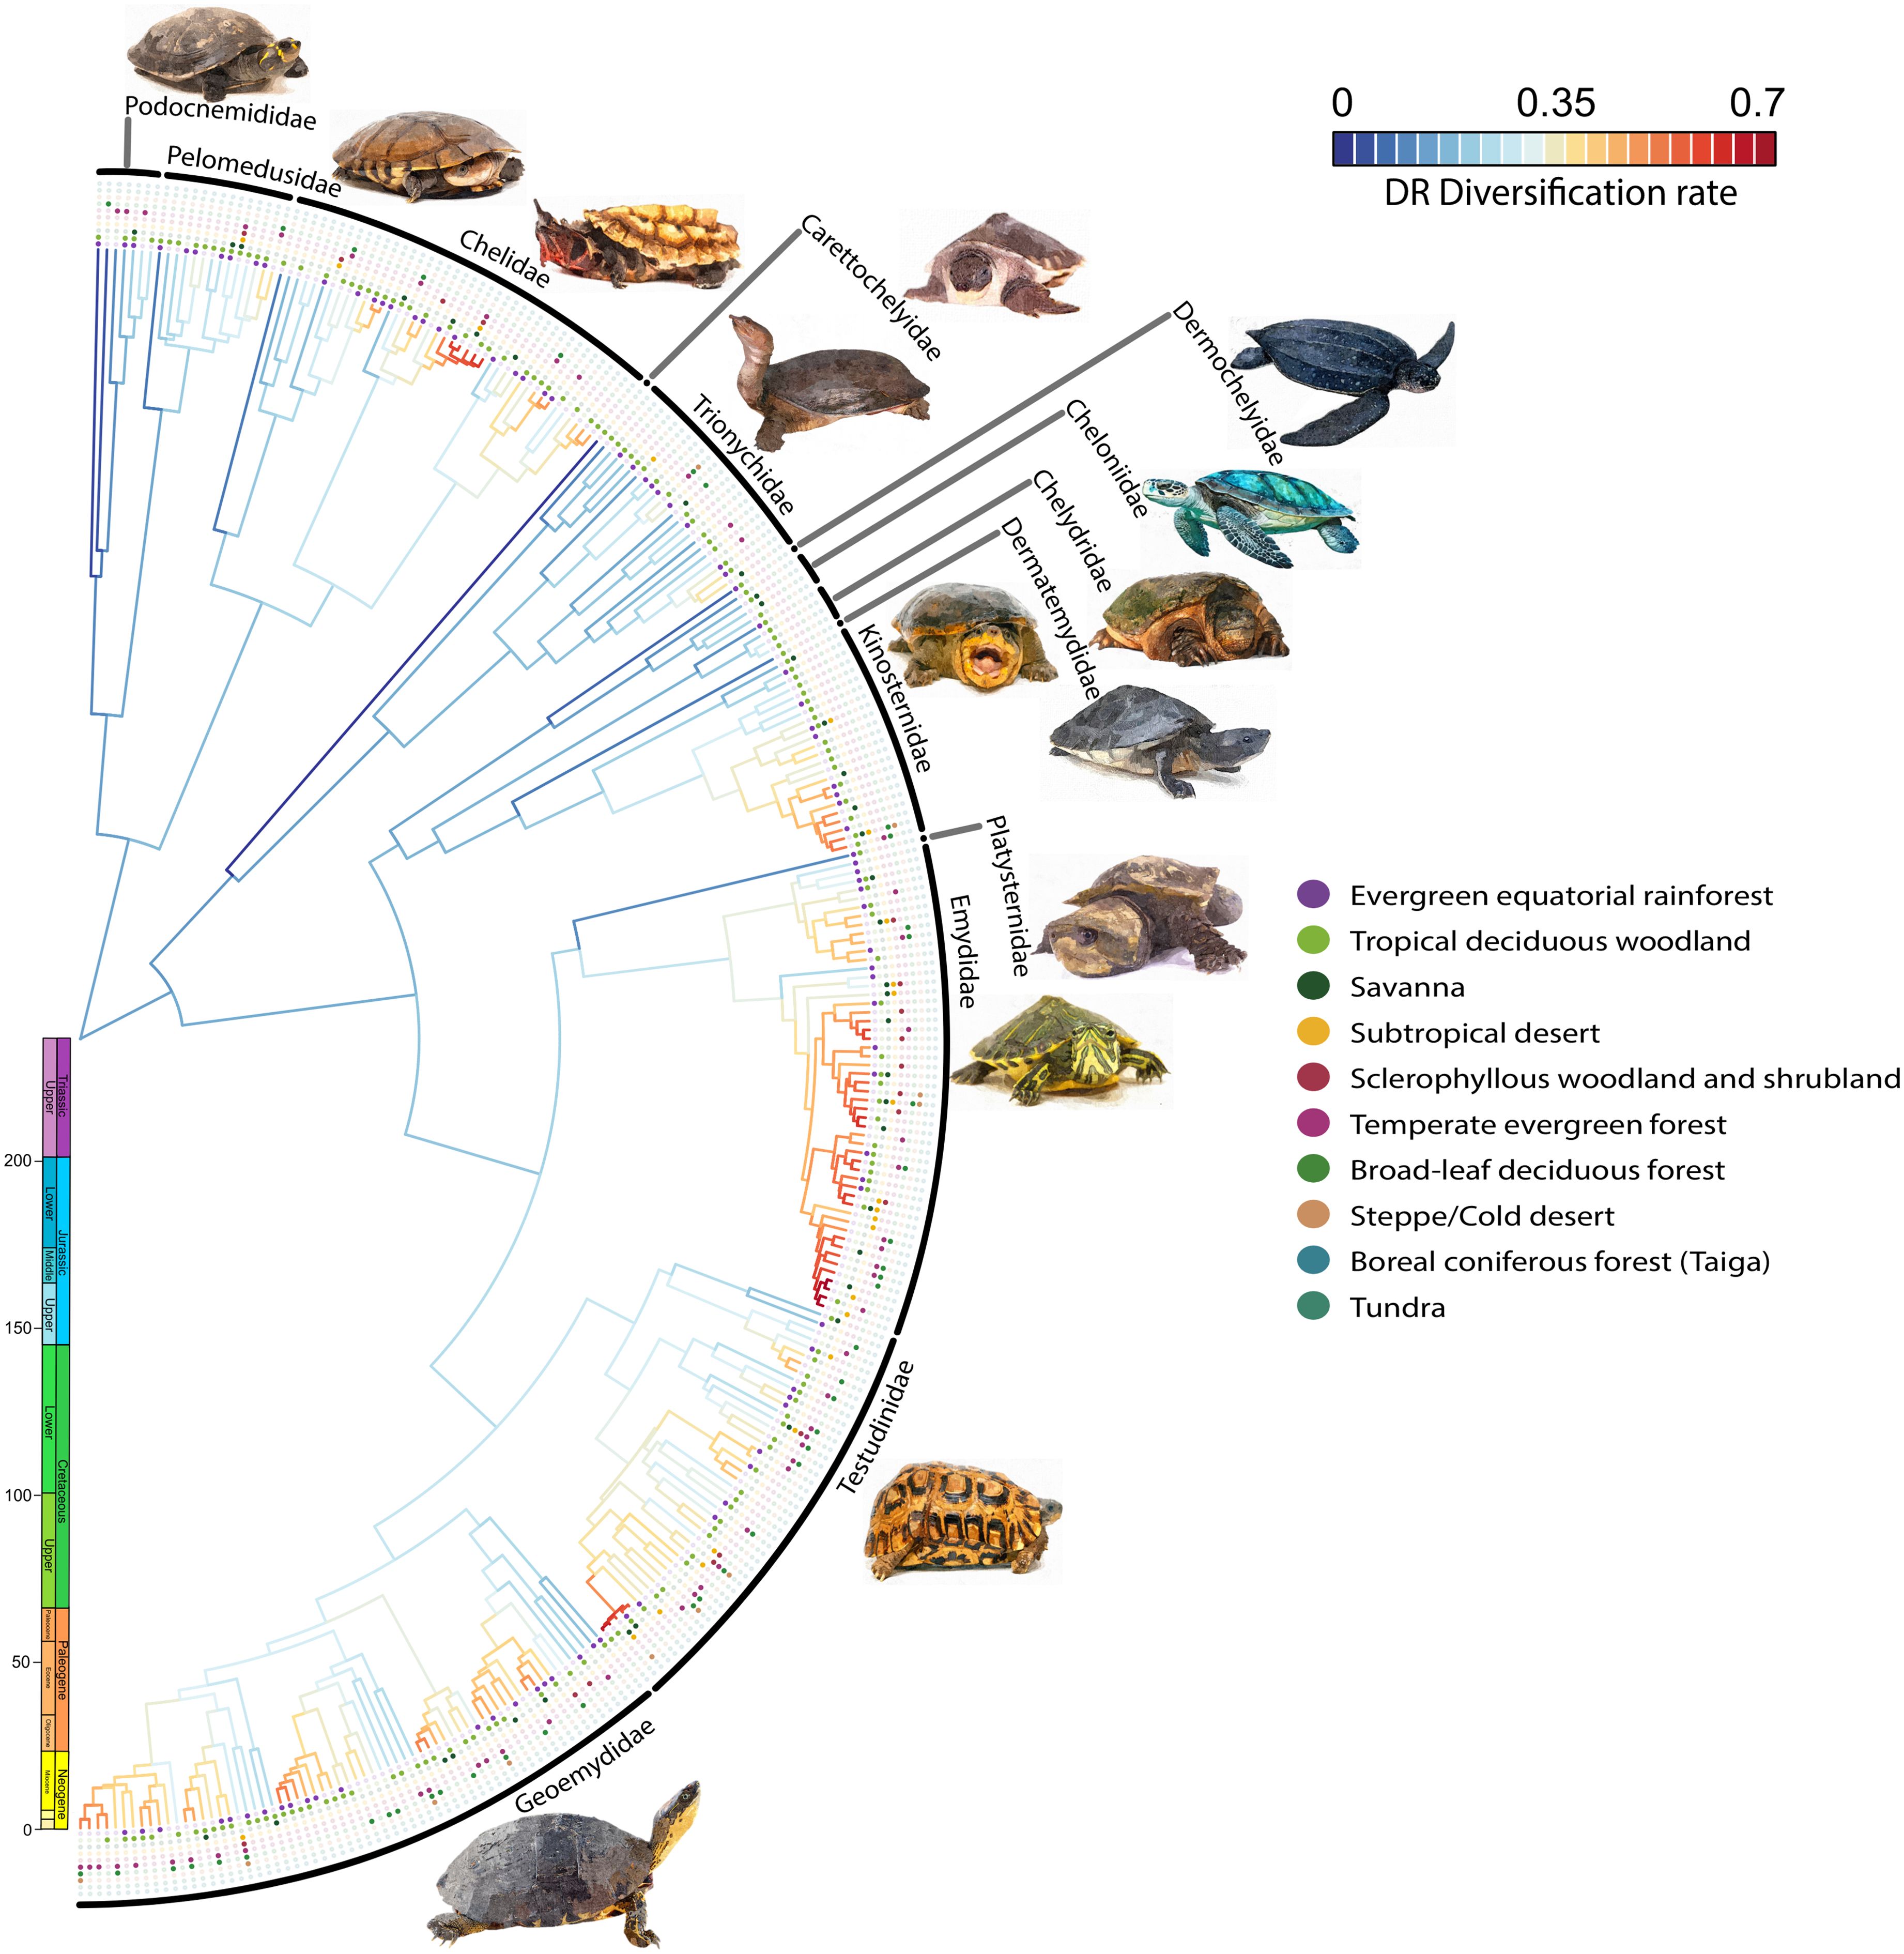
Figure 5. Diversification rate (DR) estimations for Testudines as inferred using the DR metric (Jetz et al., 2012) and the (Thomson et al., 2021) phylogeny. Dots indicate the presence (full) or absence (void) of each species in the considered biomes.
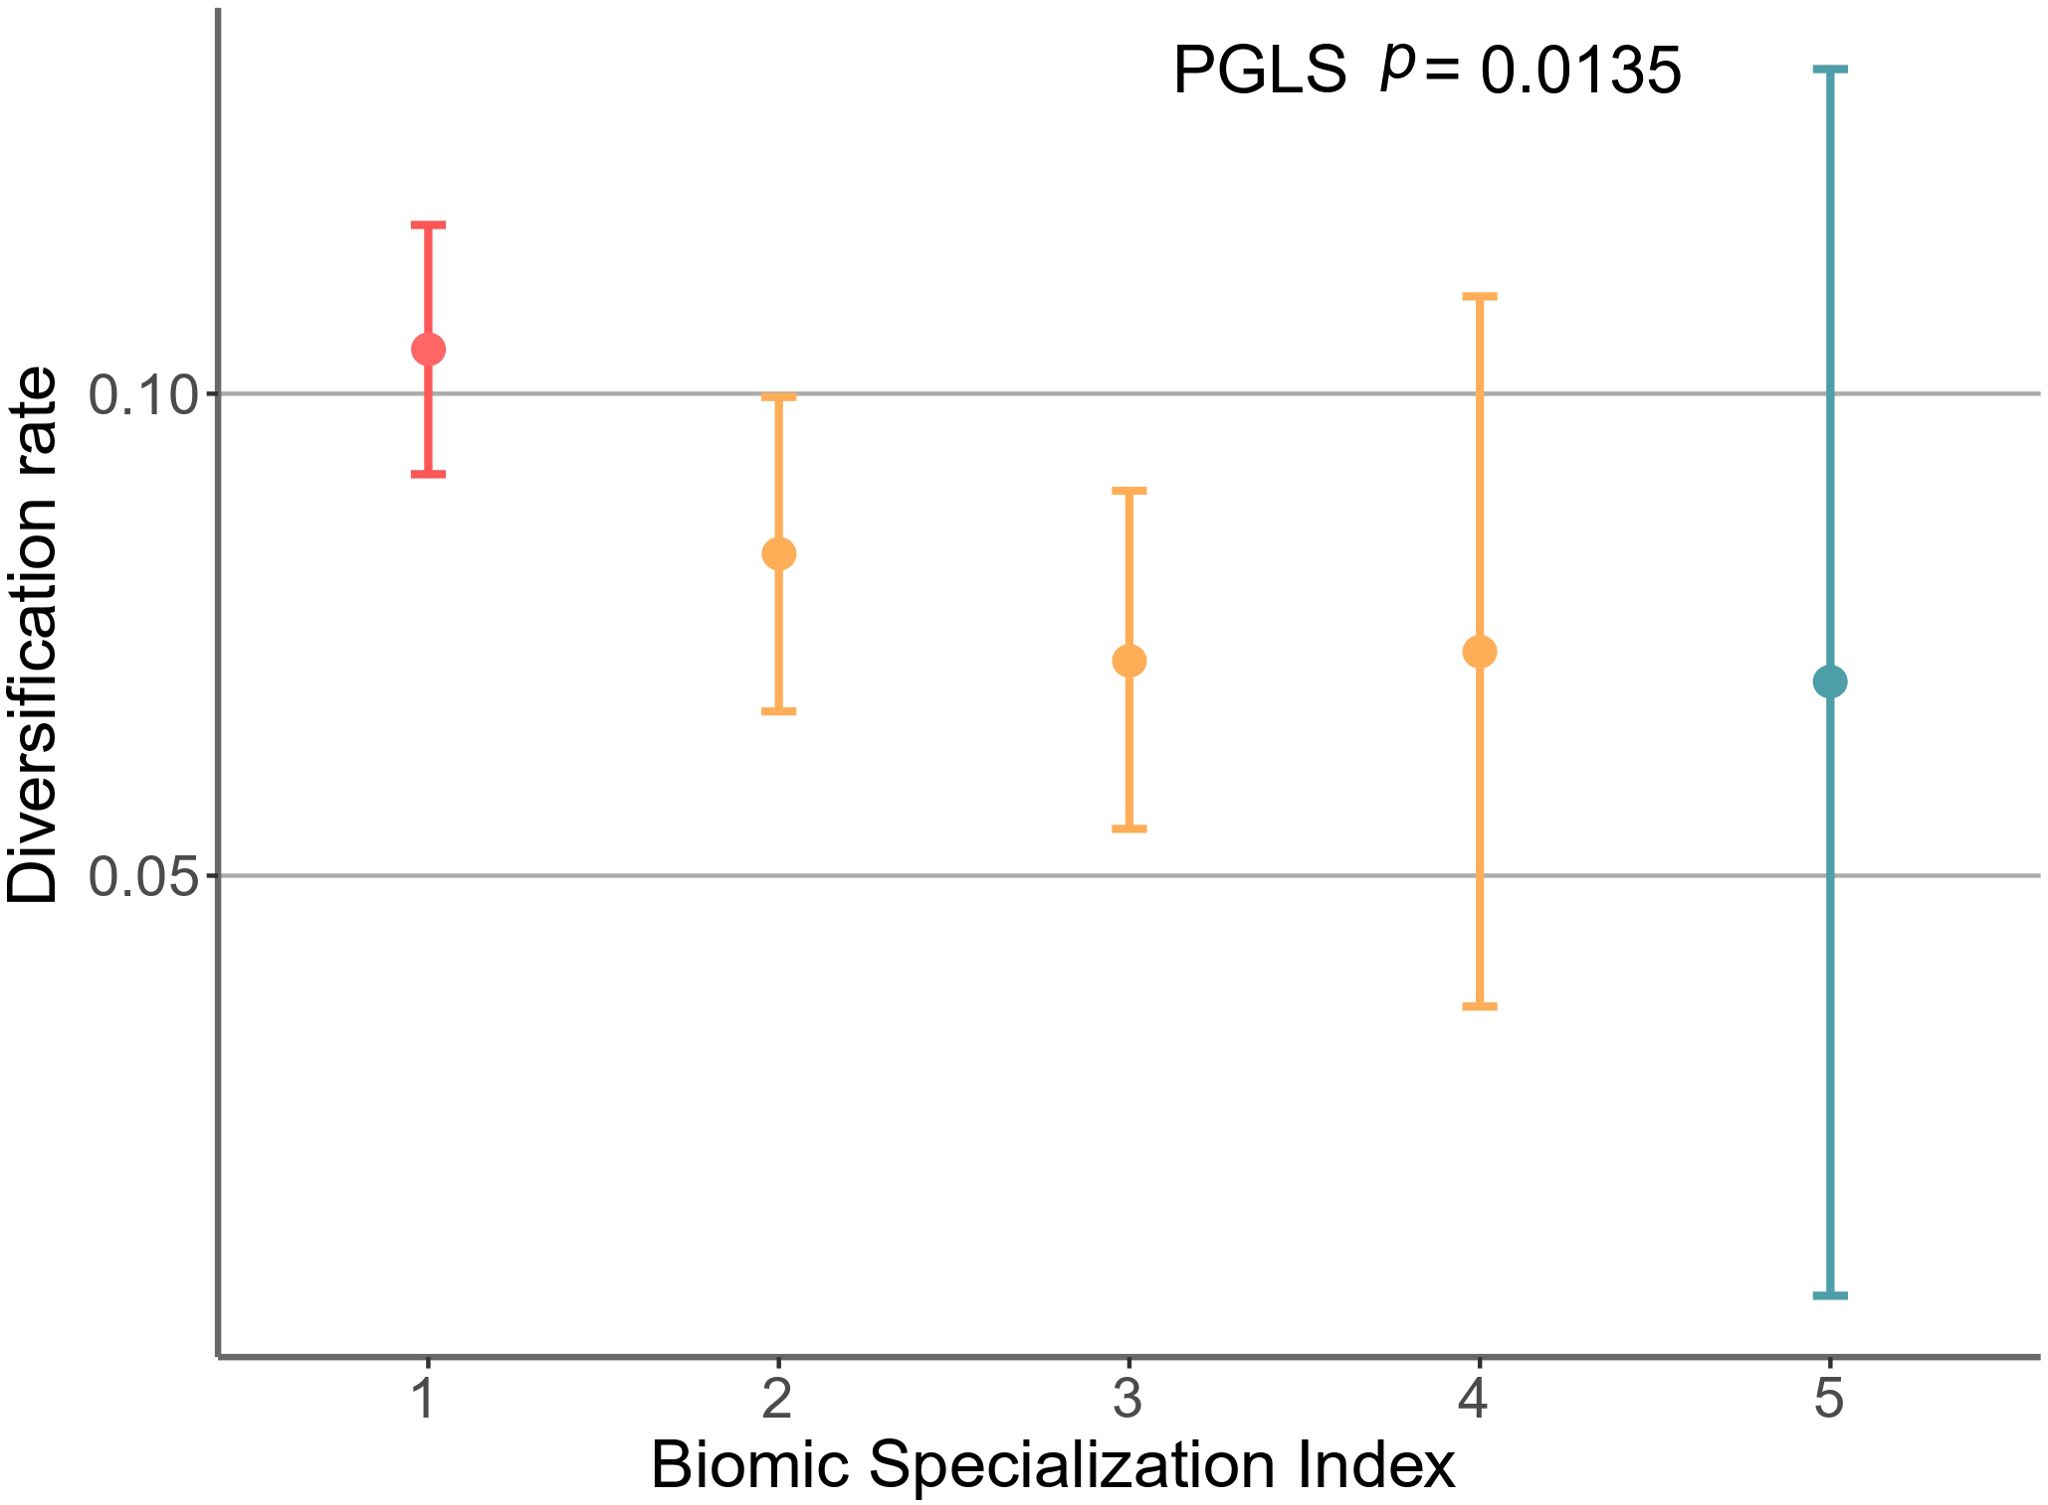
Figure 6. Mean (95% confidence interval) diversification rates (DR metric; (Jetz et al., 2012) by species according to their biome specialization index (BSI) for all Testudines present in the phylogeny.
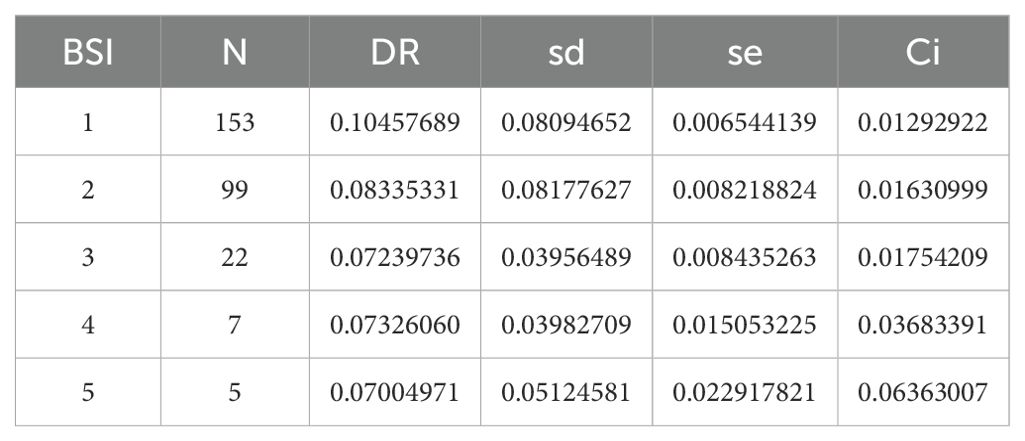
Table 1. Summary table of the number of species for each BSI with their respective diversification rates, where N is the number of species, DR the diversification rate, sd the standard deviation, se the standard error and Ci the 95% confidence interval.
Despite the higher diversification rate for biome specialist species, their DR values were not significantly affected by the particular biome inhabited by these species; no significant differences were found between the DR of the biome specialist species with respect to the biomes they inhabit (phylANOVA p = 0.760; Supplementary Table S10), supporting the observations in Figure 7, where the boxplots indicate a clear overlap between them.
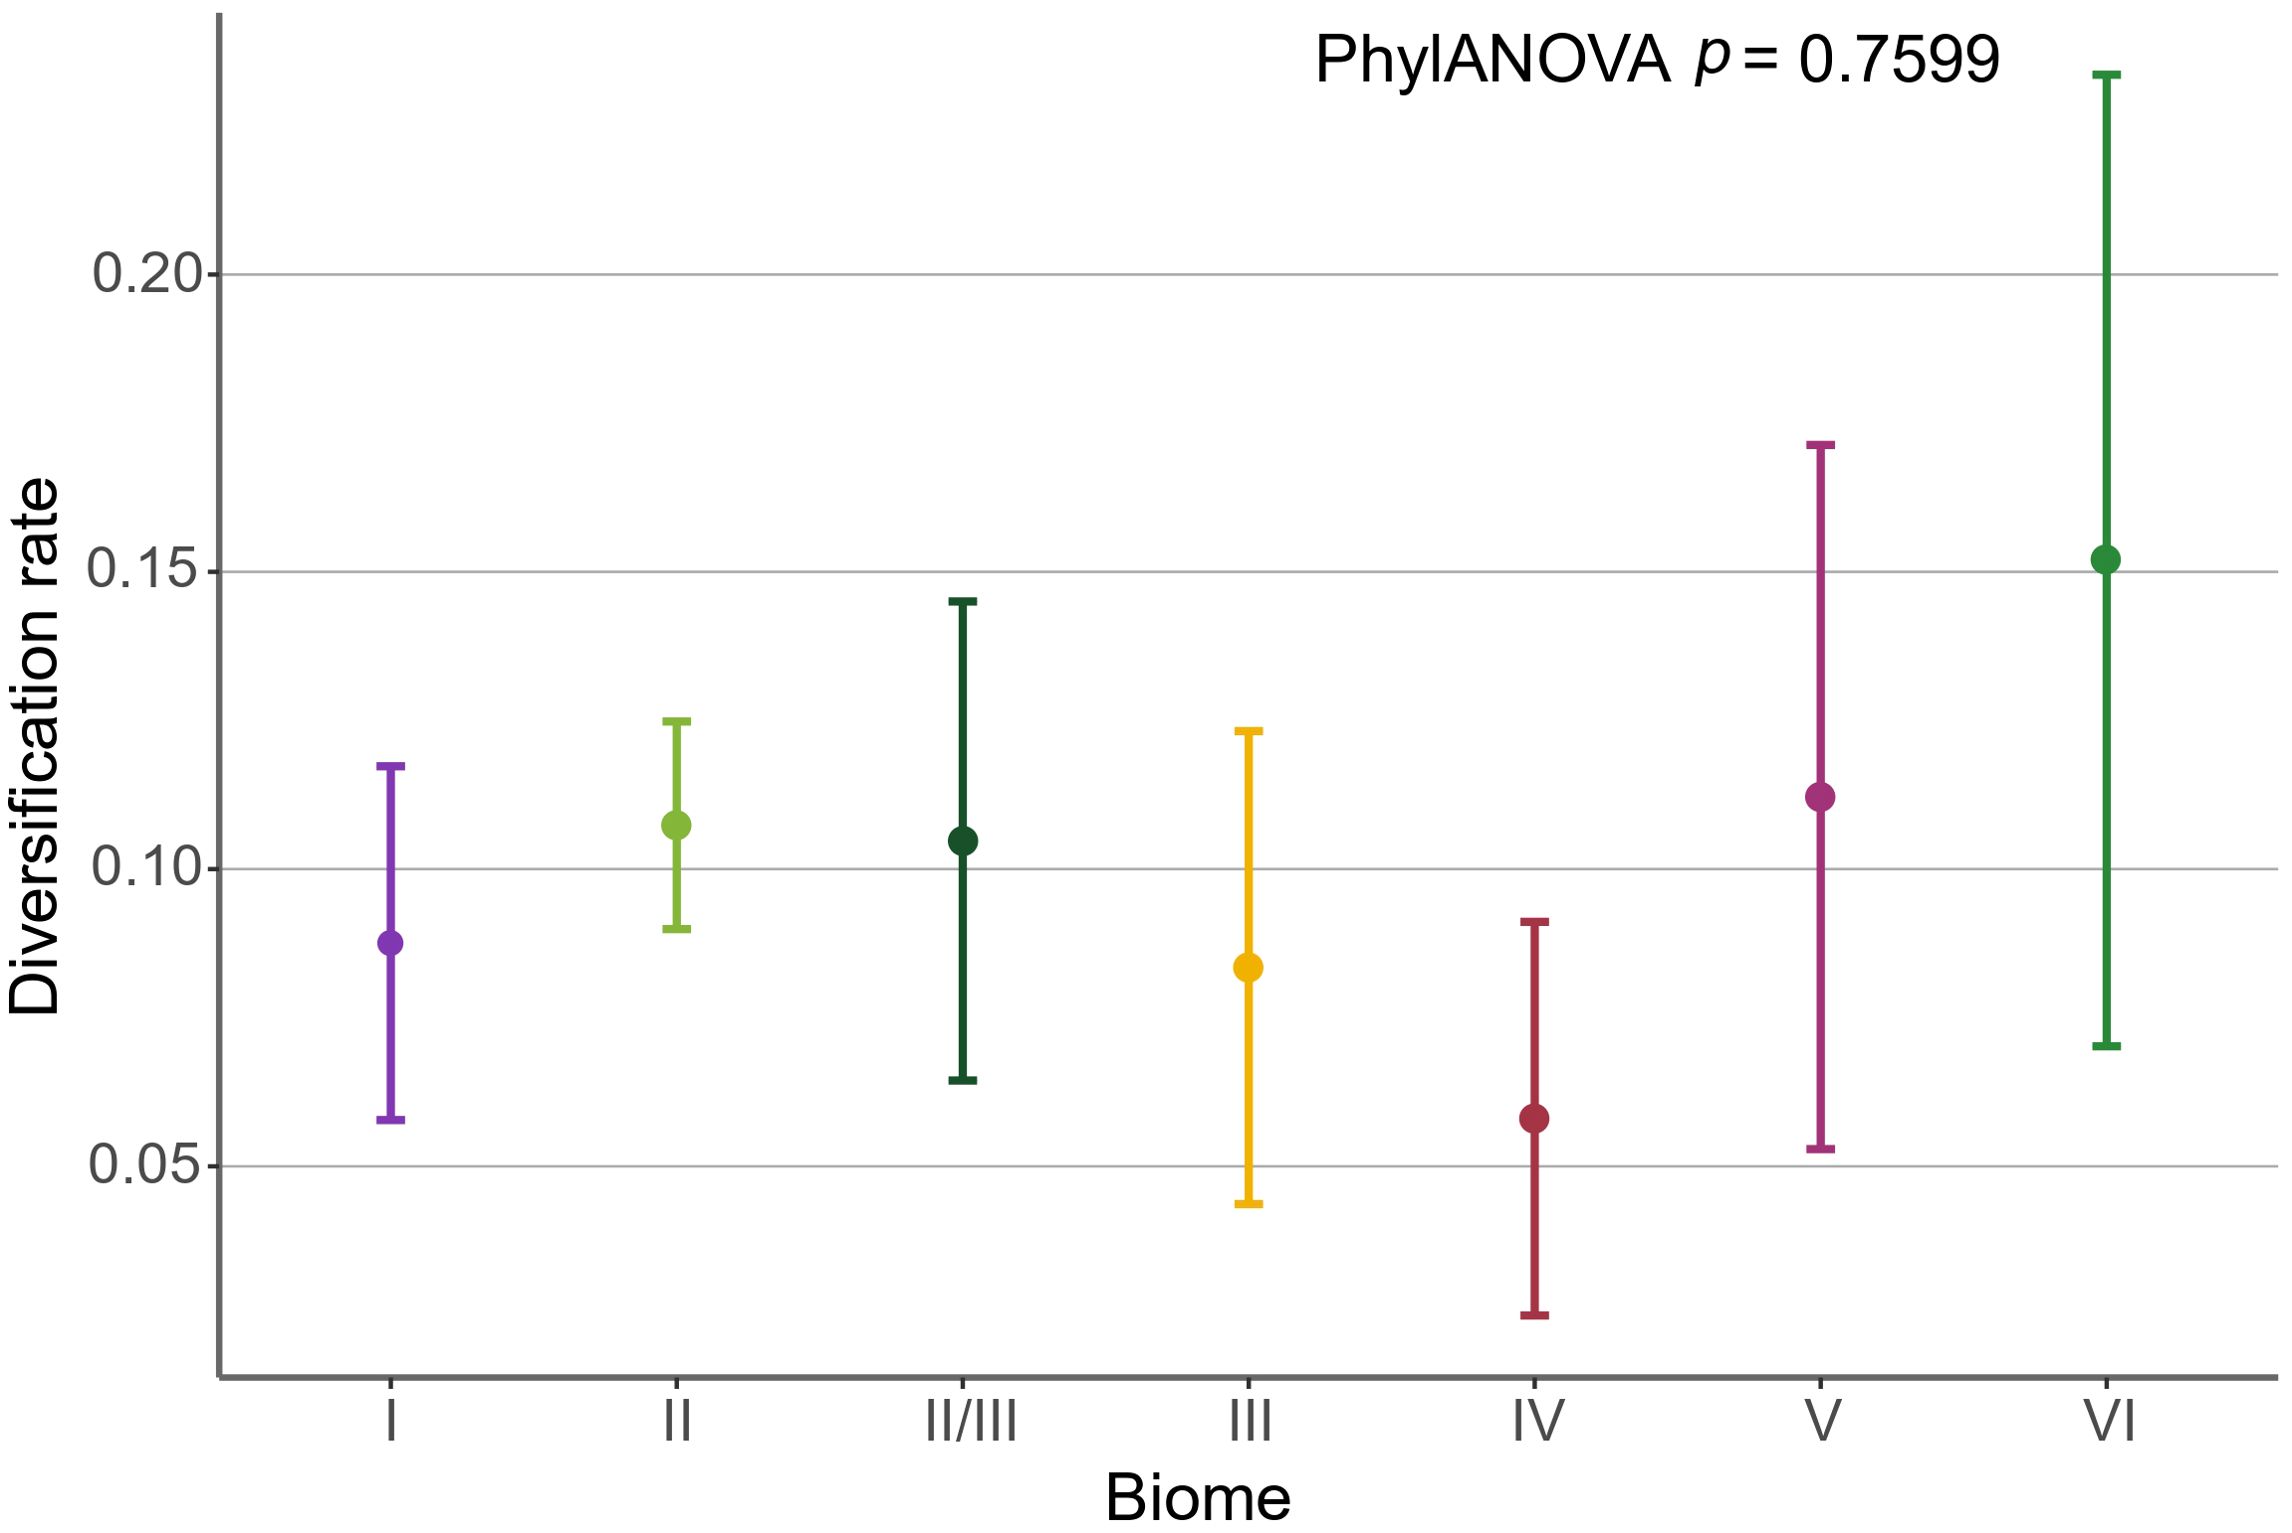
Figure 7. Mean (95% confidence interval) diversification rates estimated for biomic specialist species (BSI = 1) present in the Testudines phylogeny, divided as a function of the biome they inhabit (colors as in Figure 1); Steppe, Taiga and Tundra are not included due to the absence of specialist species in these biomes. Significance levels (p) are provided for phylogenetic generalized least squares and phylogenetic ANOVA analyses of DRs for BSI and biome, respectively.
Discussion
Diversification and accumulation of biome specialists
Reptiles are ectotherms, known for a clear tendency towards endemism due to their low metabolic rate, which reduces their food requirements and decreases their activity levels, thereby diminishing their need for movement compared to endotherms (Hayden Bofill and Blom, 2024). Thus, due to metabolic temperature dependence, the diversification of biome specialist species should be more pronounced than in endotherms (Machac et al., 2012). The Monte Carlo simulations confirmed a tendency towards the overrepresentation of biome-specialist species, in accordance with the initial premise of the resource use hypothesis (Supplementary Table S1; Figure 2). This trend was also consistent across most families, except for Trionychidae, which, instead of biome specialists, showed a significant accumulation of species inhabiting two biomes (Figure 4). Essentially, while these families are phylogenetically distinct lineages, they share closely related morphologies derived from a conservative body plan, which could constrain the range of traits or adaptations to inhabit biomes with varying characteristics (Hu et al., 2019), being cold and aridity the main characteristics that seem to have limited them. These findings are in line with studies conducted in taxa such as mammals (Hernández Fernández and Vrba, 2005b; Moreno Bofarull et al., 2008; Cantalapiedra et al., 2011; Menéndez et al., 2021; Hernández Fernández et al., 2022) or butterflies (Gamboa et al., 2022). This indicates that historical climate changes are still a more relevant factor in the diversification processes observed in animal taxa than the presence of diverse thermoregulation mechanisms or patterns of geographical dispersal (Rolland et al., 2018; Pie et al., 2021). Ultimately this could mean that biomic specialization within a lineage is an intrinsic phenomenon associated to the geographical dynamics of the evolutionary process itself (Vrba, 1980; Gómez Cano et al., 2013), expressed across lineages independently of their morphological or phylogenetic characteristics, as is the case with niche conservatism or extinction events (Raup, 1994; Ferrière et al., 2004).
Although turtles are highly influenced by environmental temperature for their activity and survival, and depend on a certain degree of humidity for their integument (Labra et al., 2008), some species can inhabit up to five biomes (Figure 2). This underscores the capacity of turtles to develop strategies or adaptations that have enabled them to thrive in a relatively broad range of environmental conditions. Nevertheless, this discovery represents a level of biome generalism much lower than that observed in butterflies (Gamboa et al., 2022), mammals (Hernández Fernández et al., 2022) or birds (Pelegrin et al., 2023), groups that include species inhabiting up to eight or even more biomes (e.g., Papilio polyxenes, Lasiurus cinereus or Falco peregrinus). Such difference possibly is related to diverse morphophysiological constraints associated with their limited morphological diversity, which is attributed mainly to the presence of the carapace (Claude et al., 2003). This result is not surprising given that these ectothermic organisms struggle to maintain an adequate body temperature in cold climates solely through behavioral thermoregulation. Turtles particularly lack a thick layer of fat or other insulation like plumage or fur found in birds and mammals respectively (Terrien et al., 2011). This absence of insulation significantly hinders their adaptation to cold biomes, such as the Taiga and Tundra, where they are notably absent.
Thomson et al. (2021) found a low net diversification rate from the emergence of the lineage up to the Eocene, suggesting a higher prevalence of generalist species before this period due to their lower tendency to diversify. This trend changed during the Eocene Climatic Optimum when global temperatures rose and altered the distribution of biomes, with tropical biomes expanding worldwide (Jaramillo, 2020). This new biome configuration benefited turtles, increasing the diversification of biome-specialist species and resulting in an adaptive radiation of the group during this period.
On the contrary, it is intriguing that despite the occurrence of moderate biome generalist species being lower than expected by chance, as posited by the resource-use hypothesis, the presence of species with a Biome Specialization Index (BSI) of 5 exceeded simulations for five out of seven families (Figure 4). This finding could mean that the occupation of five different biomes reflects possibly an upper limit considering some colonization events from ancestral tropical biomes towards subtropical ones. Due to niche conservatism, the physiological and adaptive constraints made possible biome colonization in some preferential directions according to environmental gradients of rainfall or temperature (Pelegrin et al., 2023); for instance, biome colonization processes from subtropical desert to steppe (aridity gradient) or tropical deciduous woodland to evergreen rainforest (humidity). For this reason, biome colonization events in cold environments (such as taiga and tundra) were not possible.
Among all turtles, the family Trionychidae is a notable exception, since it exhibits a higher accumulation of species with BSI=2, along with a lower incidence of biome specialist species than expected by chance. This particularity may be attributed to the specific ecophysiology of this family. Almost all its species dive to the bottoms of rivers and lakes, where they camouflage using their flat, smooth shells (which vary in color according to the substrate in their habitat) while waiting for hunting their prey (Ferri and Soccini, 2019). The intimate connection with aquatic ecosystems entails the requirement for adaptations that enable the species to withstand more extreme temperature fluctuations (Chessman, 2020). These thermal tolerance adaptations should be reflected in other freshwater families. For example, this could explain the high adaptability of Emydidae to temperate biomes. However, the unique BSI distribution of Trionychidae compared to other freshwater families might be attributed to their great adaptation to aquatic life, which makes them highly skilled swimmers, as evidenced by their broad, webbed feet, or their bimodal respiration and even living in areas near to the coastline (Wang et al., 1989; Ferri and Soccini, 2019). However, these adaptations significantly limit their ability to thrive outside water (in comparison to other freshwater turtle families), largely confining them to the aquatic environments they inhabit. Considering that their primary habitats are tropical dry forests and tropical rainforests, biomes that are ecologically and geographically intertwined, often sharing borders, it is both common and expected that the water bodies these turtles occupy extend across both biomes, thus explaining their BSI distribution.
Distribution of specialist species across biomes
We observed a high level of specialization across biomes, with five of them having more specialists than would be expected by chance (Figure 3). This has been documented in small mammals, which exhibit rapid specialization due to high reproductive rates, limited dispersal capabilities, and shorter generation times (Moreno Bofarull et al., 2008; Hernández Fernández et al., 2022). Turtles have long generation times (McGaugh, 2012) requiring a long time for the offspring to reach sexual maturity (between 5 and 50 years depending on the species), as well as a significant longevity of adult individuals (Shine and Iverson, 1995). But exhibit very variable reproductive rates across species, with some Testudinidae females producing less than 10 eggs (Epperson and Heise, 2003), and sea species with more than 40 offspring, typically around 90, and sometimes up to 200 each year (Hirth, 1980). Additionally, despite the average home range for turtles is larger than in small mammals, ranging from approximately 23 ha in terrestrial species to 32 ha in freshwater species (Slavenko et al., 2016), compared to 400-600 m2 for rodents (Ostfeld, 1985; Ssuuna et al., 2023) and an average of 3 ha for lagomorphs (Hulbert et al., 1996), it is much smaller than the home ranges of large mammals, which can easily exceed 400 hectares and even reach over 30,000 hectares in some felids (Lindstedt et al., 1986). These small home ranges can explain the higher generation of biome specialists among turtles. Since species with small territories can maintain genetically viable populations in limited areas, they are able to survive in small biome fragments, promoting speciation processes in vicariant populations of biome specialist species (Moreno Bofarull et al., 2008; Sonne et al., 2016). Additionally, lower activity and energy requirements of ectotherms lead to high rates of endemism (Hayden Bofill and Blom, 2024), which is similarly linked to greater diversification of biome specialists.
The low proportion of specialist species in the subtropical desert and the steppe suggests that the conditions in these biomes are very challenging for the survival and diversification of turtles. In the subtropical desert, this is associated with high temperatures and low humidity, coupled with significant temperature variation between day and night. These extreme conditions are particularly difficult for ectotherms, whose survival and biological activity heavily depend on environmental temperatures, especially affecting juvenile organisms and thereby population stability (Griffis-Kyle, 2016). On the other hand, very low winter temperatures characterize the steppe, a feature it shares with taiga and tundra, posing a significant barrier to the survival and diversification of turtles in these biomes.
The absence of species in the taiga and tundra biomes is noteworthy. The potential for turtle colonization is constrained by their limited ability to withstand desiccation and low temperatures for long time periods. Turtle species from temperate zones spend the winter hibernating in underground shelters (Ultsch, 2006), while freshwater species often prefer to hibernate at the bottom of lakes, ponds, and even streams (Ultsch, 2006), as seen in species from the family Emydidae (Cadi et al., 2004). Some, like Chelydra serpentina, hibernate in shallow bodies of water, enabling them to reach the water surface by extending their necks (Meeks and Ultsch, 1990). Additionally, these species have developed two main adaptations to survive low temperatures and extend their range into colder areas. Freeze tolerance protects them at temperatures as low as approximately 4°C, while supercooling allows some species to survive temperatures down to -12°C (Costanzo et al., 1995). However, the latter strategy is susceptible to ice nucleation, leading to rapid and uncontrolled tissue freezing upon contact with environmental ice, which is often lethal (Costanzo et al., 2008). This increases mortality and impacts their ability to maintain stable populations in environments with long and very cold winters, such as tundra, taiga and the most continentalized areas of the steppe biome. In addition to temperature, many habitats for turtles in these cold biomes (especially for freshwater species) present hypoxic or anoxic conditions due to surface soil and water freezing, restricting the places where they can hibernate and thereby limiting their distribution (Ultsch, 2006). Juveniles are particularly vulnerable to these conditions, which can significantly affect population recruitment and limit the range expansion of species into colder biomes (Costanzo et al., 2008).
Finally, when examining the biome distribution of specialists by ecological group (Supplementary Tables S6, S7), we observe a greater concentration of terrestrial species in biomes such as the subtropical desert and sclerophyllous woodland and shrubland. These are relatively young biomes, both more recent than the group’s adaptive radiation during the Eocene (Buerki et al., 2012; Guerrero et al., 2013). In contrast, freshwater species were more closely associated with tropical biomes, which are ancestral ecosystems that experienced significant expansion during the Eocene. This could suggest that terrestrial turtles may possess greater adaptive capacity than their freshwater counterparts, or that colonization processes into new biomes occur more rapidly in species adapted to terrestrial environments.
Diversification across biomes
We found no significant relationship among the DR exhibited by the specialist inhabiting different biomes (Figure 7; Supplementary Table S10). This is partly due to the high variability in data from temperate biomes, especially in temperate evergreen forests and broad-leaf deciduous forests. The lower number of specialist species in these biomes (Supplementary Table S8) increases variability and sensitivity to fluctuations (Camacho-Sandoval, 2007). In combination with the fact that low morphological variability within the group could limits the range of adaptations that can be developed to thrive and diversify in a biome (Bergmann and Irschick, 2012; Belmaker and Jetz, 2015). This constraint hinders strategies involving significant movements, such as migrations (with the exception of marine species) (Southwood and Avens, 2010), or adaptations associated with environmental temperature insulation, among others. This suggests that the strategies or adaptations developed by turtles to cope with different environmental conditions across biomes may be similar or closely related, producing the observed patterns.
On the other hand, the evergreen equatorial rainforest and the tropical deciduous woodland exhibited a considerably low diversification rate given their high accumulation of specialist species (Figure 7; Supplementary Table S3). These biomes provide ideal conditions for the diversification of reptiles in general due to their high temperatures, which accelerate metabolic rates and all associated processes (Head et al., 2009; Machac et al., 2012; Cadena, 2014; Jaramillo, 2020). Additionally, these are ancient biomes, with the evergreen equatorial rainforest appearing during the Late Cretaceous and the tropical deciduous woodland during the Early Eocene (Jaramillo et al., 2010; Jaramillo and Cárdenas, 2013; Carvalho et al., 2021). The high number of species present in these biomes today likely reflects significant historical diversification of specialists and possibly their climate niche conservatism associated with tropical forested biomes (Pelegrin et al., 2023). However, as species accumulate and niches become saturated, diversification has decreased. This explains why diversification rates are similar to, or in some cases lower than, those in areas with less favorable conditions but also lower species saturation. On the other hand, temperate biomes are relatively more recent. The youngest colonized biome is the sclerophyllous woodland and shrubland, which dates back to the Plio-Pleistocene (Buerki et al., 2012). This is followed by the taiga, originating in the late Miocene (DeVore and Pigg, 2013), and the steppe, which dates to the early Miocene (Wang, 2004). In other words, these biomes emerged after the major adaptive radiation event experienced by turtles during the Eocene (Jaramillo, 2020; Thomson et al., 2021). This, along with the saturation of previously mentioned tropical biomes and the reduction in diversification rates within the group after this period, may provide an additional explanation as to why no significant differences were found in the diversification rate (DR) of turtles across the various biomes they inhabit.
Diversification vs. BSI
The PGLS test revealed a significant negative correlation between DR and BSI, indicating that species with lower BSIs tend to have higher DRs (Supplementary Table S9; Figure 6), which aligns with the resource use hypothesis and is consistent with previous studies conducted on other vertebrate and insect groups (Pelegrin, 2016; Gamboa et al., 2022; Hernández Fernández et al., 2022). Finally, it is important to consider that due to the focus of this study, our results are restricted to phylogenetic data and do not incorporate fossil evidence. As a result, we do not delve into extinction events or their impact on the evolutionary history of turtles.
In conclusion, this study provides compelling evidence that the macroevolutionary trends of turtles align with the primary tenets of the resource use hypothesis. Particularly, the greater diversification and accumulation of biome specialist species within the lineage. However, they exhibit peculiarities that have diverged from previous studies in other groups. They did not show distinguishable diversification rates among biomes, nor did they demonstrate greater species accumulation in climatically extreme biomes. This might be associated with higher levels of biome conservatism associated to their small home ranges, ectothermy and low morphological variability, with the ecophysiological limitations of this group for the survival to freezing temperatures, or a combination of both factors. Ultimately, some lineages have demonstrated a remarkable ability to adapt and diversify in biomes with highly variable climatic conditions. These insights shed light on the complex interplay between turtles and their environment, highlighting the importance of considering both historical and ecological factors in understanding their evolutionary history.
Data availability statement
The raw data supporting the conclusions of this article will be made available by the authors, without undue reservation.
Author contributions
JT: Conceptualization, Data curation, Formal analysis, Investigation, Methodology, Project administration, Software, Validation, Visualization, Writing – original draft, Writing – review & editing. SG: Formal analysis, Methodology, Software, Writing – review & editing. MH: Writing – review & editing. JP: Writing – review & editing, Conceptualization, Formal analysis, Investigation, Methodology, Project administration, Software, Writing – original draft. OM: Writing – review & editing.
Funding
The author(s) declare financial support was received for the research, authorship, and/or publication of this article. This work is a collaborative contribution by the Research Group on Ecology and Biodiversity Conservation (ECOBIO) and their research team in Paleobiology, Ecology and Evolution (PaleoEco). This research has been funded by Dirección General de Investigaciones of Universidad Santiago de Cali under call No. DGI-01-2025 and project 313- 6211223588 and call No. DGI-09-2024 from the Dirección General de Investigaciones of Universidad Santiago de Cali. The Palaeoclimatology, Macroecology and Macroevolution of Vertebrates (PMMV) research team from the Universidad Complutense de Madrid as a part of the research group UCM 910607 on Evolution of Cenozoic Mammals and Continental Paleoenvironments (partially funded by projects PID2020-116220GB-I00 and PID2022-138275NB-I00 from the Spanish Ministry of Science, Innovation and Universities), and the MAPAS Lab project from the Universidad de Vigo (funded by the ERC grant agreement 947921 from the European Research Council under the European Union’s Horizon 2020 research and innovation programme).
Acknowledgments
We thank the reviewers for the provided comments and suggestions, which allowed us to improve our work.
Conflict of interest
The authors declare that the research was conducted in the absence of any commercial or financial relationships that could be construed as a potential conflict of interest.
The author(s) declared that they were an editorial board member of Frontiers, at the time of submission. This had no impact on the peer review process and the final decision.
Correction note
A correction has been made to this article. Details can be found at: 10.3389/fevo.2025.1654762.
Publisher’s note
All claims expressed in this article are solely those of the authors and do not necessarily represent those of their affiliated organizations, or those of the publisher, the editors and the reviewers. Any product that may be evaluated in this article, or claim that may be made by its manufacturer, is not guaranteed or endorsed by the publisher.
Supplementary material
The Supplementary Material for this article can be found online at: https://www.frontiersin.org/articles/10.3389/fevo.2024.1474500/full#supplementary-material
References
Belmaker J. and Jetz W. (2015). Relative roles of ecological and energetic constraints, diversification rates and region history on global species richness gradients. Ecol. Lett. 18, 563–571. doi: 10.1111/ele.12438
Bergmann P. J. and Irschick D. J. (2012). Vertebral evolution and the diversification of squamate reptiles. Evolution 66, 1044–1058. doi: 10.1111/j.1558-5646.2011.01491.x
Bonin F., Dupré A., and Devaux B. (2006).Tortugas del Mundo. In: Lynx Nature Books. Available online at: https://www.lynxeds.com/es/producto/tortugas-del-mundo/ (Accessed 7 March 2024).
Buerki S., Jose S., Yadav S. R., Goldblatt P., Manning J. C., and Forest F. (2012). Contrasting biogeographic and diversification patterns in two mediterranean-type ecosystems. PloS One 7, 1–11. doi: 10.1371/journal.pone.0039377
Butler C. J. (2019). A review of the effects of climate change on chelonians. Diversity 11, 138. doi: 10.3390/d11080138
Cadena E. A. (2014). The fossil record of turtles in Colombia; a review of the discoveries, research and future challenges. Acta Biol. Colombiana 19, 333–339. doi: 10.15446/abc.v19n3.42223
Cadi A., Nemoz M., Thienpont S., Joly P., Cadi A., Nemoz M., et al. (2004). Home range, movements, and habitat use of the European pond turtle (Emys orbicularis) in the Rhone-Alpes region, France. Biologia 59, 89–94.
Camacho-Sandoval J. (2007). Investigación, poblaciones y muestra. Acta Médica Costarricense 49, 11–12.
Cantalapiedra J. L., Hernández Fernández M., and Morales J. (2011). Biomic specialization and speciation rates in ruminants (Cetartiodactyla, mammalia): A test of the resource-use hypothesis at the global scale. PloS One 6, 1–10. doi: 10.1371/journal.pone.0028749
Caramaschi U. (2021). Podocnemis unifilis Troschel 1848 (Testudines, Podocnemididae) – distribution extension and new state record in Brazil. Herpetol. Bras. 9, 140–145.
Carvalho M. R., Jaramillo C., de la Parra F., Caballero-Rodríguez D., Herrera F., Wing S., et al. (2021). Extinction at the end-Cretaceous and the origin of modern Neotropical rainforests. Science 372, 63–68. doi: 10.1126/science.abf1969
Cava J. A., Perlut N. G., and Travis S. E. (2019). Heritability and evolvability of morphological traits of Savannah sparrows (Passerculus sandwichensis) breeding in agricultural grasslands. PloS One 14, 1–10. doi: 10.1371/journal.pone.0210472
Chessman B. C. (2020). Behavioural thermoregulation by Australian freshwater turtles: interspecific differences and implications for responses to climate change. Aust. J. Zool. 67, 94–105. doi: 10.1071/ZO20004
Claude J., Paradis E., Tong H., and Auffray J.-C. (2003). A geometric morphometric assessment of the effects of environment and cladogenesis on the evolution of the turtle shell. Biol. J. Linn. Soc. 79, 485–501. doi: 10.1046/j.1095-8312.2003.00198.x
Costanzo J. P., Iverson J. B., Wright M. F., and Lee R. E. Jr. (1995). Cold hardiness and overwintering strategies of hatchlings in an assemblage of northern turtles. Ecology 76, 1772–1785. doi: 10.2307/1940709
Costanzo J. P., Lee R. E. Jr., and Ultsch G. R. (2008). Physiological ecology of overwintering in hatchling turtles. J. Exp. Zool. Part A: Ecol. Genet. Physiol. 309A, 297–379. doi: 10.1002/jez.460
Dayananda B., Bezeng S. B., Karunarathna S., and Jeffree R. A. (2021). Climate change impacts on tropical reptiles: likely effects and future research needs based on Sri Lankan perspectives. Front. Ecol. Evol. 9. doi: 10.3389/fevo.2021.688723
DeVore M. L. and Pigg K. B. (2013). Paleobotanical evidence for the origins of temperate hardwoods. Int. J. Plant Sci. 174, 592–601. doi: 10.1086/668687
Epperson D. M. and Heise C. D. (2003). Nesting and hatchling ecology of gopher tortoises (Gopherus polyphemus) in Southern Mississippi. J. Herpetol. 37, 315–324. doi: 10.1670/0022-1511(2003)037[0315:NAHEOG]2.0.CO;2
Ferrière R., Dieckmann U., and Couvet D. (Eds.) (2004). Evolutionary Conservation Biology (Cambridge: Cambridge University Press). doi: 10.1017/CBO9780511542022
Freckleton R. P. and Harvey P. H. (2006). Detecting non-brownian trait evolution in adaptive radiations. PloS Biol. 4, 2104–2111. doi: 10.1371/journal.pbio.0040373
Fritz U., Guicking D., Auer M., Sommer R. S., Wink M., and Hundsdörfer A. K. (2008). Diversity of the Southeast Asian leaf turtle genus Cyclemys: how many leaves on its tree of life? Zool. Scripta 37, 367–390. doi: 10.1111/j.1463-6409.2008.00332.x
Gamboa S., Condamine F. L., Cantalapiedra J. L., Varela S., Pelegrín J. S., Menéndez I., et al. (2022). A phylogenetic study to assess the link between biome specialization and diversification in swallowtail butterflies. Global Change Biol. 28, 5901–5913. doi: 10.1111/gcb.16344
Gamboa S., Galván S., and Varela S. (2024). Vrba was right: Historical climate fragmentation, and not current climate, explains mammal biogeography. Global Change Biol. 30, 1–10. doi: 10.1111/gcb.17339
Gómez Cano A. R., Hernández Fernández M., and Álvarez-Sierra M.Á. (2013). Dietary ecology of Murinae (Muridae, Rodentia): A geometric morphometric approach. PloS One 8, 1–7. doi: 10.1371/journal.pone.0079080
Gotelli N. J. (2000). Null model analysis of species co-occurrence patterns. Ecology 81, 2606–2621. doi: 10.1890/0012-9658(2000)081[2606:NMAOSC]2.0.CO;2
Griffis-Kyle K. L. (2016). Physiology and ecology to inform climate adaptation strategies for desert amphibians. Herpetol. Conserv. Biol., 563–582. Available at: https://www.semanticscholar.org/paper/Physiology-and-Ecology-to-Inform-Climate-Adaptation-Griffis%E2%80%90Kyle/19ecfa4ca2799b578728ceea2e557ca1377ddf02citing-papers.
Guerrero P. C., Rosas M., Arroyo M. T. K., and Wiens J. J. (2013). Evolutionary lag times and recent origin of the biota of an ancient desert (Atacama–Sechura). Proc. Natl. Acad. Sci. 110, 11469–11474. doi: 10.1073/pnas.1308721110
Hayden Bofill S. I. and Blom M. P. K. (2024). Climate change from an ectotherm perspective: evolutionary consequences and demographic change in amphibian and reptilian populations. Biodivers. Conserv. 33, 905–927. doi: 10.1007/s10531-023-02772-y
Head J. J., Bloch J. I., Hastings A. K., Bourque J. R., Cadena E. A., Herrera F. A., et al. (2009). Giant boid snake from the Palaeocene neotropics reveals hotter past equatorial temperatures. Nature 457, 715–717. doi: 10.1038/nature07671
Hernández Fernández M. (2001). Bioclimatic discriminant capacity of terrestrial mammal faunas. Global Ecol. Biogeogr. 10, 189–204. doi: 10.1046/j.1466-822x.2001.00218.x
Hernández Fernández M., Pelegrin J. S., Gómez Cano A. R., García Yelo B. A., Moreno-Bofarull A., Sánchez-Fontela N., et al. (2022). Macroevolution and climate changes: a global multi-family test supports the resource-use hypothesis in terrestrial mammals. Historical Biol. 34, 1471–1479. doi: 10.1080/08912963.2022.2042807
Hernández Fernández M. and Vrba E. S. (2005a). A complete estimate of the phylogenetic relationships in Ruminantia: a dated species-level supertree of the extant ruminants. Biol. Rev. 80, 269–230. doi: 10.1017/S1464793104006670
Hernández Fernández M. and Vrba E. S. (2005b). Macroevolutionary processes and biomic specialization: testing the resource-use hypothesis. Evol. Ecol. 19, 199–219. doi: 10.1007/s10682-004-8152-7
Hirth H. F. (1980). Some aspects of the nesting behavior and reproductive biology of sea turtles. Am. Zool. 20, 507–523. doi: 10.1093/icb/20.3.507
Hu C.-C., Wu Y.-Q., Ma L., Chen Y.-J., and Ji X. (2019). Genetic and morphological divergence among three closely related Phrynocephalus species (Agamidae). BMC Evol. Biol. 19, 1–15. doi: 10.1186/s12862-019-1443-y
Hulbert I. A. R., Iason G. R., Elston D. A., and Racey P. A. (1996). Home-Range Sizes in a Stratified Upland Landscape of Two Lagomorphs with Different Feeding Strategies. J. Appl. Ecol. 33 (6), 1479–1488. doi: 10.2307/2404786
Humphreys A. M. and Barraclough T. G. (2014). The evolutionary reality of higher taxa in mammals. Proc. R. Soc. B: Biol. Sci. 281, 1–10. doi: 10.1098/rspb.2013.2750
Jaramillo C. (2020). “140 Million Years of Tropical Biome Evolution,” in THE GEOLOGY OF COLOMBIA /. Servicio Geológico Colombiano (SGC). Ed. Bogotá D. C. (Servicio Geológico Colombiano (SGC, Colombia), 209–236.
Jaramillo C. and Cárdenas A. (2013). Global warming and neotropical rainforests: A historical perspective. Annu. Rev. Earth Planet. Sci. 41, 741–766. doi: 10.1146/annurev-earth-042711-105403
Jaramillo C., Ochoa D., Contreras L., Pagani M., Carvajal-Ortiz H., Pratt L. M., et al. (2010). Effects of rapid global warming at the Paleocene-Eocene boundary on neotropical vegetation. Science 330, 957–961. doi: 10.1126/science.1193833
Jetz W. and Fine P. V. A. (2012). Global gradients in vertebrate diversity predicted by historical area-productivity dynamics and contemporary environment. PloS Biol. 10, 1–11. doi: 10.1371/journal.pbio.1001292
Jetz W., Thomas G. H., Joy J. B., Hartmann K., and Mooers A. O. (2012). The global diversity of birds in space and time. Nature 491, 444–448. doi: 10.1038/nature11631
Kembel S. W., Cowan P. D., Helmus M. R., Cornwell W. K., Morlon H., Ackerly D. D., et al. (2010). Picante: R tools for integrating phylogenies and ecology. Bioinformatics 26, 1463–1464. doi: 10.1093/bioinformatics/btq166
Labra A., Vidal M., Solís R., and Penna M. (2008). Ecofisiología de anfibios y reptiles. Herpetol. Chile, 483–516.
Landis M., Edwards E. J., and Donoghue M. J. (2021). Modeling phylogenetic biome shifts on a planet with a past. System. Biol. 70, 86–107. doi: 10.1093/sysbio/syaa045
Lindstedt S. L., Miller B. J., and Buskirk S. W. (1986). Home range, time, and body size in mammals. Ecology 67, 413–418. doi: 10.2307/1938584
Machac A., Zrzavý J., Smrckova J., and Storch D. (2012). Temperature dependence of evolutionary diversification: differences between two contrasting model taxa support the metabolic theory of ecology. J. Evol. Biol. 25, 2449–2456. doi: 10.1111/jeb.12019
McGaugh S. E. (2012). Comparative population genetics of aquatic turtles in the desert. Conserv. Genet. 13, 1561–1576. doi: 10.1007/s10592-012-0403-5
Meeks R. L. and Ultsch G. R. (1990). Overwintering behavior of snapping turtles. Copeia 1990, 880–884. doi: 10.2307/1446460
Menéndez I., Gómez Cano A. R., Cantalapiedra J. L., Peláez-Campomanes P., Álvarez-Sierra M.Á., and Hernández Fernández M. (2021). A multi-layered approach to the diversification of squirrels. Mammal Rev. 51, 66–81. doi: 10.1111/mam.12215
Moreno Bofarull A., Royo A. A., Fernández M. H., Ortiz-Jaureguizar E., and Morales J. (2008). Influence of continental history on the ecological specialization and macroevolutionary processes in the mammalian assemblage of South America: Differences between small and large mammals. BMC Evol. Biol. 8, 97–115. doi: 10.1186/1471-2148-8-97
Mundry R. (2014). “Statistical Issues and Assumptions of Phylogenetic Generalized Least Squares,” in Modern Phylogenetic Comparative Methods and Their Application in Evolutionary Biology: Concepts and Practice. Ed. Garamszegi L. Z. (Springer, Berlin, Heidelberg), 131–153. doi: 10.1007/978-3-662-43550-2_6
Ostfeld R. S. (1985). Limiting resources and territoriality in microtine rodents. Am. Nat. 126, 1–15. doi: 10.1086/284391
Patrício A. R., Hawkes L. A., Monsinjon J. R., Godley B. J., and Fuentes M. M. P. B. (2021). Climate change and marine turtles: recent advances and future directions. Endangered Species Res. 44, 363–395. doi: 10.3354/esr01110
Pelegrin J. S. (2016). Paleobiogeografía, cambios climáticos globales y macroevolución en aves no paseriformes: patrones de radiación, dispersión y adaptación durante el Cenozoico (Universidad Complutense de Madrid). Available online at: https://dialnet.unirioja.es/servlet/tesis?codigo=126696 (Accessed 7 March 2024).
Pelegrin J. S., Cantalapiedra J. L., Gamboa S., Menéndez I., and Hernández Fernández M. (2023). Phylogenetic biome conservatism as a key concept for an integrative understanding of evolutionary history: Galliformes and Falconiformes as study cases. Zool. J. Linn. Soc. 198, 47–71. doi: 10.1093/zoolinnean/zlac080
Pennell M. W., Eastman J. M., Slater G. J., Brown J. W., Uyeda J. C., FitzJohn R. G., et al. (2014). geiger v2.0: an expanded suite of methods for fitting macroevolutionary models to phylogenetic trees. Bioinformatics 30, 2216–2218. doi: 10.1093/bioinformatics/btu181
Pie M. R., Divieso R., and Caron F. S. (2021). Do geographic range sizes evolve faster in endotherms? Evol. Biol. 48, 286–292. doi: 10.1007/s11692-021-09537-x
Pinheiro J., Bates D., and R Core Team (2023). nlme: Linear and Nonlinear Mixed Effects Models’. Available online at: https://cran.r-project.org/web/packages/nlme/index.html (Accessed 25 March 2024).
Poloczanska E. S., Limpus C. J., and Hays G. C. (2009). “Vulnerability of Marine Turtles to Climate Change,” in Advances in Marine Biology (United Kingdom:Academic Press), 151–211. doi: 10.1016/S0065-2881(09)56002-6
Raup D. M. (1994). The role of extinction in evolution. Proc. Natl. Acad. Sci. 91, 6758–6763. doi: 10.1073/pnas.91.15.6758
R Core Team (2024). R: A language and environment for statistical computing (R Core Team). Available online at: https://www.r-project.org/ (Accessed 24 March 2024).
Revell L. J. (2012). phytools: an R package for phylogenetic comparative biology (and other things). Methods Ecol. Evol. 3, 217–223. doi: 10.1111/j.2041-210X.2011.00169.x
Rhodin A., Iverson J., Bour R., Fritz U., Georges A., Shaffer B., et al. (2021). Turtles of the World: Annotated Checklist and Atlas of Taxonomy, Synonymy, Distribution, and Conservation Status (9th Ed.). Available online at: https://www.revistas.usp.br/phyllo/article/view/193661 (Accessed 7 March 2024).
Rolland J., Silvestro D., Schluter D., Guisan A., Broennimann O., and Salamin N. (2018). The impact of endothermy on the climatic niche evolution and the distribution of vertebrate diversity. Nat. Ecol. Evol. 2, 459–464. doi: 10.1038/s41559-017-0451-9
Scheffers B. R., De Meester L., Bridge T. C. L., Hoffmann A. A., Pandolfi J. M., Corlett R. T., et al. (2016). The broad footprint of climate change from genes to biomes to people. Science 354, 719–730. doi: 10.1126/science.aaf7671
Selvatti A. P., Moreira F. R. R., Carvalho D. C., Prosdocimi F., Russo C. A. de M., and Junqueira A. C. M. (2023). Phylogenomics reconciles molecular data with the rich fossil record on the origin of living turtles. Mol. Phylogenet. Evol. 183, 1–12. doi: 10.1016/j.ympev.2023.107773
Shine R. and Iverson J. B. (1995). Patterns of survival, growth and maturation in turtles. Oikos 72, 343–348. doi: 10.2307/3546119
Singkily M., Eisemberg C., Horne B., Kuchling G., and Rhodin A. (2018).IUCN Red List of Threatened Species: Chelodina mccordi. In: IUCN Red List of Threatened Species. Available online at: https://www.iucnredlist.org/en (Accessed 7 April 2024).
Slavenko A., Itescu Y., Ihlow F., and Meiri S. (2016). Home is where the shell is: predicting turtle home range sizes. J. OF Anim. Ecol. 85, 106–114. doi: 10.1111/1365-2656.12446
Sonne J., Martín González A. M., Maruyama P. K., Sandel B., Vizentin-Bugoni J., Schleuning M., et al. (2016). High proportion of smaller ranged hummingbird species coincides with ecological specialization across the Americas. Proc. R. Soc. B: Biol. Sci. 283, 1–9. doi: 10.1098/rspb.2015.2512
Southwood A. and Avens L. (2010). Physiological, behavioral, and ecological aspects of migration in reptiles. J. Comp. Physiol. B 180, 1–23. doi: 10.1007/s00360-009-0415-8
Ssuuna J., Makundi R. H., Chidodo S. J., Isabirye M., Mbije N. E., and Mulungu L. S. (2023). Spatio-temporal home range of the dominant rodent species in Mabira central forest reserve, Uganda. BMC Ecol. Evol. 23, 1–8. doi: 10.1186/s12862-023-02148-4
Stanford C. B., Iverson J. B., Rhodin A. G. J., Paul van Dijk P., Mittermeier R. A., Kuchling G., et al. (2020). Turtles and tortoises are in trouble. Curr. Biol. 30, 721–735. doi: 10.1016/j.cub.2020.04.088
Terrien J., Perret M., and Aujard F. (2011). Behavioral thermoregulation in mammals: a review. Front. Bioscience-Landmark 16, 1428–1444. doi: 10.2741/3797
Thomson S., Kennett R., Tucker A., FitzSimmons N., Featherston P., Alacs E., et al. (2011). Chelodina burrungandjii Thomson, Kennett and Georges 2000 - Sanstone Snake-Necked Turtle (USA: First Chelonian Research Foundation). doi: 10.3854/crm.5
Thomson R. C., Spinks P. Q., and Shaffer H. B. (2021). A global phylogeny of turtles reveals a burst of climate-associated diversification on continental margins. Proc. Natl. Acad. Sci. 118, 1–10. doi: 10.1073/pnas.2012215118
Ultsch G. R. (2006). The ecology of overwintering among turtles: where turtles overwinter and its consequences. Biol. Rev. Cambridge Philos. Soc. 81, 339–367. doi: 10.1017/S1464793106007032
Van Dijk P. and Rhodin A. (2010). The IUCN Red List of Threatened Species Blanding’s Turtl, IUCN Red List of Threatened Species. Available online at: https://www.iucnredlist.org/en (Accessed 7 April 2024).
Vrba E. S. (1980). Evolution, species and fossils: How does life evolve? South Afr. J. Sci. 61, 61–84. doi: 10.10520/AJA00382353_1539
Vrba E. S. (1987). Ecology in relation to speciation rates: some case histories of Miocene-Recent mammal clades. Evol. Ecol. 1, 283–300. doi: 10.1007/BF02071554
Vrba E. S. (1992). Mammals as a key to evolutionary theory. J. Mammal. 73, 1–28. doi: 10.2307/1381862
Walter H. (1970). Vegetationszonen und Klima. stuttgart: Eugen Ulmer, 3rd edn (Germany: Eugen Ulmer).
Wang W. (2004). On the origin and development of Artemisia (Asteraceae) in the geological past. Bot. J. Linn. Soc. 145, 331–336. doi: 10.1111/j.1095-8339.2004.00287.x
Wang Z.-X., Sun N.-Z., and Sheng W.-F. (1989). Aquatic respiration in soft-shelled turtles, Trionyx sinensis. Comp. Biochem. Physiol. Part A: Physiol. 92, 593–598. doi: 10.1016/0300-9629(89)90371-X
Waterson A. M., Schmidt D. N., Valdes P. J., Holroyd P. A., Nicholson D. B., Farnsworth A., et al. (2016). Modelling the climatic niche of turtles: a deep-time perspective. Proc. R. Soc. B: Biol. Sci. 283, 1–9. doi: 10.1098/rspb.2016.1408
Werneck F. P. (2011). The diversification of eastern South American open vegetation biomes: Historical biogeography and perspectives. Quater. Sci. Rev. 30, 1630–1648. doi: 10.1016/j.quascirev.2011.03.009
Keywords: bioclimatology, ecological specialization, macroecology, macroevolution, resource-use hypothesis, speciation
Citation: Thomas JS, Gamboa S, Hernández Fernández M, Murillo O and Pelegrin JS (2024) Macroevolutionary processes in turtles (Testudines): a view from biomic specialization and historical climatic changes. Front. Ecol. Evol. 12:1474500. doi: 10.3389/fevo.2024.1474500
Received: 01 August 2024; Accepted: 15 November 2024;
Published: 03 December 2024; Corrected: 29 July 2025.
Edited by:
Francois Munoz, Université Claude Bernard Lyon 1, FranceReviewed by:
Francis Isselin, UMR7324 Cités, Territoires, Environnement et Sociétés (CITERES), FranceGabriel de Souza Ferreira, Senckenberg Research Centre for Human Evolution and Palaeoenvironment (S-HEP), Germany
Copyright © 2024 Thomas, Gamboa, Hernández Fernández, Murillo and Pelegrin. This is an open-access article distributed under the terms of the Creative Commons Attribution License (CC BY). The use, distribution or reproduction in other forums is permitted, provided the original author(s) and the copyright owner(s) are credited and that the original publication in this journal is cited, in accordance with accepted academic practice. No use, distribution or reproduction is permitted which does not comply with these terms.
*Correspondence: Juan S. Thomas, anVhbi50aG9tYXNAY29ycmVvdW5pdmFsbGUuZWR1LmNv; Jonathan S. Pelegrin, am9uYXRoYW4ucGVsZWdyaW4wMEB1c2MuZWR1LmNv