 Yagyanath Rimal1,2*
 Navneet Sharma1
- 1Department of Computer Science and IT, IIS Deemed to be University, Jaipur, Rajasthan, India
- 2Pokhara University, Pokhara, Nepal
This study examines the prediction accuracy of ensemble machine learning models by comparing local and global precision, recall, and accuracy for multiclass grading of engineering students. It also investigates the performance of various machine learning models in predicting the multiclass grading outcomes for these students. The primary goal is to address challenges in multiclass data preparation and evaluate the best machine learning models using both micro and macro accuracy metrics derived from baseline comparisons. The results highlight a significant comparative analysis of prediction accuracy across different algorithms, emphasizing the importance of employing multiple receiver operating characteristic curves, areas under the curves, and a one-vs-rest classification approach when target features are represented as letter grades. The algorithms examined include decision trees, K-nearest neighbors, random forests, support vector machines, XGBoost, gradient boosting, and bagging. Gradient boosting achieves the highest global accuracy for macro predictions at 67%. It is followed by random forests at 64%, bagging at 65%, K-nearest neighbors at 60%, XGBoost at 60%, decision trees at 55%, and support vector machines at 59%. When considering micro prediction accuracy at the individual student level, support vector machines, random forests, and XGBoost closely align with true student grades, with accuracies of 19, 22, and 33%, respectively, at baseline. Notably, these models accurately predict the C grade with 97% precision, whereas predicting the A grade proves more challenging, with an accuracy of only 66%. These findings are further corroborated by precision-recall error plots. The grid search for random forest algorithms achieved a score of 79% when optimally tuned; however, the training accuracy was 99%. The results have implications for both students and educational institutions, helping identify areas for improvement and recognizing high achievers, which ultimately contributes to enhanced academic outcomes for engineering students.
1 Introduction
This study discusses the importance of university education for young people and its role in national development. AI is revolutionizing pedagogy by enhancing personalized learning experiences and utilizing advanced machine learning technologies, directly addressing modern human requirements. The final grades of students are based on their previous grades and internal assessments; therefore, it is essential to examine their academic background information to predict their final grades accurately. The research focuses on the engineering students of Pokhara University at the constituent college and explores the internal and final evaluations of student grade performance using ensemble machine learning for multi-grade prediction. The study used primary data from five engineering courses, including high school education, parent education, and whether the school is private or government-run, along with independent internal evaluations targeting GPA and previous grades from all educational institutions, both public and private, to predict student grades using machine learning data from three multi-stage sampling methods.
Studies suggest that machine learning can predict student grades, but educational leaders can prevent biases by establishing ethical guidelines, ensuring diverse data, conducting bias audits, fostering AI literacy, advocating for regulatory policies, and ensuring fair AI decision-making. The researcher Deo et al. (2020) achieved a prediction accuracy of 74% using a random forest for mathematics students at an Australian regional university. Meanwhile, Alangari and Alturki (2020) employed linear regression and matrix factorization combined with fuzzy logic to predict multi-class grades, achieving the same 74% accuracy with random forest and an R2 value between 0.41 and 0.44. Cui et al. (2020) developed a student learning management system for undergraduate engineering students at a Canadian university and found that students who scored more than 70% in previous records were more likely to fail the final exam of the next semester. Therefore, the variation among models and the recommendation of the best model and optimal hyperparameters need to be analyzed by comparing the area under the curve, feature importance, and the grading of previous diplomas. It emphasizes businesses combating AI marketing deception by adhering to ethical guidelines, data organization, transparency, and regulations while addressing concerns such as monopolization, data privacy, biased curricula, and reduced competition. The study is cautious about the effectiveness of student grade prediction based on macro and micro accuracy, particularly in the context of hybrid architecture.
2 Related works
The evaluation of modern letter grading is significant for several reasons: it ensures fairness and transparency by reflecting a student’s true performance while fostering consistency in assessments. It helps educators identify student strengths and weaknesses, enabling more targeted teaching strategies. Letter grading serves as a standardized measure of achievement, indicating a student’s potential for academic and professional success. However, it raises ethical concerns about AI in business education, such as excessive automation, biases, data privacy, and academic dishonesty. To address these issues, educational institutions should integrate AI ethics into curricula, promote responsible AI usage, and cultivate ethical business leaders through critical discussions and literacy. Additionally, it provides valuable data for informed decision-making regarding academic progression, curriculum changes, or interventions for at-risk students.
As educational systems evolve, evaluating letter grading helps assess the effectiveness of new grading methods and their alignment with modern learning objectives and tools. Wang (2024) applied a hybrid optimization method to different sets to identify factors influencing education. Regression neural network models were employed to categorize grades and integrate these optimal factors, allowing for an assessment of the performance of the proposed optimization process that achieved an impressive accuracy of 99%, demonstrating its significant impact on individual education (Sixhaxa et al., 2022). Wang (2024) evaluated three methods for binary and multiclass classification by calculating the Shapley value after using metaheuristic optimization techniques using ensemble machine learning models to handle dropout students. Goran et al. (2024) employed the relief algorithm procedure of higher education to determine student dropout and academic success utilizing naïve Bayes algorithms; however, model accuracy was not compared, respectively. Kamal et al. (2022) and Keser and Aghalarova (2022) used linear regression, decision trees, and random forest to predict Moroccan students’ grades during the COVID-19 pandemic and found that random forest was the best-performing model (Arizmendi et al., 2022). Albreiki et al. (2021) achieved 97% accuracy using an ensemble model with 450 students’ samples and 10-fold cross-validation using random forest. Similarly, Alsariera et al. (2022) scored 78% accuracy with multidimensional features of student grade performance, while Bujang et al. (2021) proposed an expandable AI model to interpolate local and global scores with up to 90% accuracy using deep learning on online student datasets. Finally, Tarik et al. (2021) achieved 93% accuracy using random forest and 79% accuracy using k-nearest neighbors with student records from the Jourdan Faculty of Medicine and Pharmacy students. In a study conducted by Subahi et al. (2022) and Gamie et al. (2019), a neural network model was used to predict student scores of 1,307 undergraduate students across 137 courses, achieving an 85% accuracy rate. The authors identified course selection and failure management as important factors for both the organization and students (Adnan et al., 2022) also conducted research using logistic and naïve Bayes models for mathematics on an imbalanced dataset, achieving a 96.6% accuracy rate using support vector machine from ensemble learning, random forest, and data mining. Similarly, Alnwairan et al. (2022) used a convolutional neural network for e-learning on a massive open online course for Java, achieving an accuracy rate of 97% and a specificity score of 92%. Zhang et al. (2021) conducted research on 1,074 student records with 34 ordinal variables, using the RF model to predict grades, with an accuracy rate of 85 to 83%. Hasib et al. (2022) conducted research on 4,034 international students, using random forest (100%), decision trees (94%), and support vector machine (100%) to identify performance, including mother and father education, average incomes, and previous diploma grades. Alshmrany (2022) used a naïve Bayes algorithm on a dataset of 399 students to achieve a 72% accuracy rate. Badal and Sungkur (2023) found that the number of students whose grades declined due to their final exam performance was higher than those who improved. They used random forest methodology for both classification and regression to manage data with a 99% accuracy rate on both the test and training datasets. Features such as medium of instruction, time management, marks obtained in secondary education, parents’ education, living area, and type of school were found to be the strongest indicators for student prediction in both 12th and bachelor grades of engineering. Matar et al. (2022) studied Spanish students (n = 60) who were both asylum seekers and university students, finding that 18% declared having a university degree in communication subjects. Huynh-Cam et al. (2022) conducted research on 145 universities offering massive online courses for entrepreneur development, focusing on teaching and research quality. Motaung et al. (2022) conducted a thematic analysis of 145 student questionnaires during the COVID-19 pandemic, finding that online video conferences were important for synchronous learning. Similarly, Hita and Bermejo (2021) used a random forest model on a dataset of 1854 Turkish university students from 2019 to 2020, achieving a 70–75% accuracy rate and a confusion matrix that scored 64% for students who failed and 83% for those who scored above 77%. Finally, Guerrero et al. (2021) used demographic characteristics of variables to predict student study, achieving an accuracy rate of 75% using random forest and 50% using the Gaussian naïve algorithm. Yeung and Yau (2022) utilizing a hybrid ensemble of LightGBM and gradient boosting models was proposed, achieving an accuracy score of 96%, while a 91% accuracy was achieved in predicting mathematics course outcomes. Similarly, Yağcı (2022) conducted research on 244 upper-secondary level students in Thailand, using the XGBoosting algorithm and the gradient boosting algorithm. The cross-validation results showed that the XGBoosting algorithm performed the best. Based on the above literature, it is essential to analyze student information, including their internal marks and background information, to predict their future grades based on multi-class in the Bachelor of Engineering at a constituent college (Nuankaew and Nuankaew, 2022). AI is revolutionizing education by personalizing experiences, enhancing accessibility, and providing interactive learning. However, it may reduce hands-on experiences and problem-solving skills. Educational governance must establish ethical AI policies, comparing micro and macro accuracy across various tuning configurations to recommend the best-performing model after evaluating different recommender model outputs.
3 Data preprocessing
Data preprocessing is a crucial step in data management that involves reorganizing and preparing research data into an understandable format. The student’s primary and secondary data scores, parent education levels, and high school information were collected through a questionnaire survey and may be incomplete, inconsistent, or poorly managed regarding their values and attributes. Before deploying the model with training and testing datasets, data were aggregated, outliers were eliminated, and missing values were sometimes removed. This research included data preparation for feature engineering and target feature scatter plots to determine linear and non-linear relationships among variables. In this research, data preparation was conducted as follows:
After the data collection preprocessing, it is necessary to load the data into the Jupyter console and preprocess it. For numerical student records, median value imputation is applied along with the standard scaler. Categorical features, such as parent education and high school, are one-hot encoded using the chi-squared imputer. The target columns, which contain categorical student grades, are converted to a label-binarized format with university grades defined as classes = [‘A,’ ‘A-,’ ‘B,’ ‘B+,’ ‘B-,’ ‘C,’ ‘C+,’ ‘C-’]. Then, the data is combined with the axis set to True to create the research database. Since the student records contain numerical values with different scales uniformly distributed from −1 to 1, the data needs to be scaled for faster execution times during machine learning training and validation. The standard scaler object is used to fit and transform the data, and the target column is dropped. Finally, the data is concatenated and merged to construct the data table. The data pipeline was implemented as shown in Figure 1.
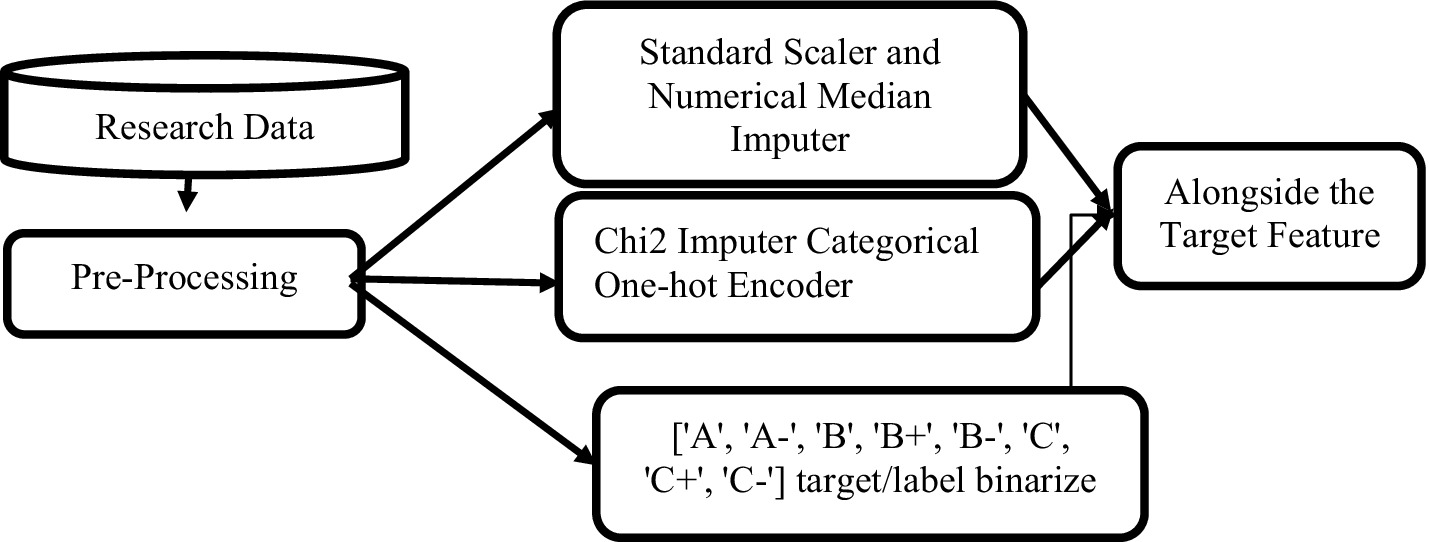
Figure 1. Data preparation flow diagram.
In machine learning, it is essential to distinguish between dependent and independent variables. The independent variables, denoted by x, are used to predict the dependent variable, denoted by y. The data is split into training and testing sets using an 80:20 ratio, and a random state of zero is used to ensure consistent results across multiple executions. Histogram plots are used to analyze the distribution of the student sample data sets for exploratory data analysis (Figure 2).
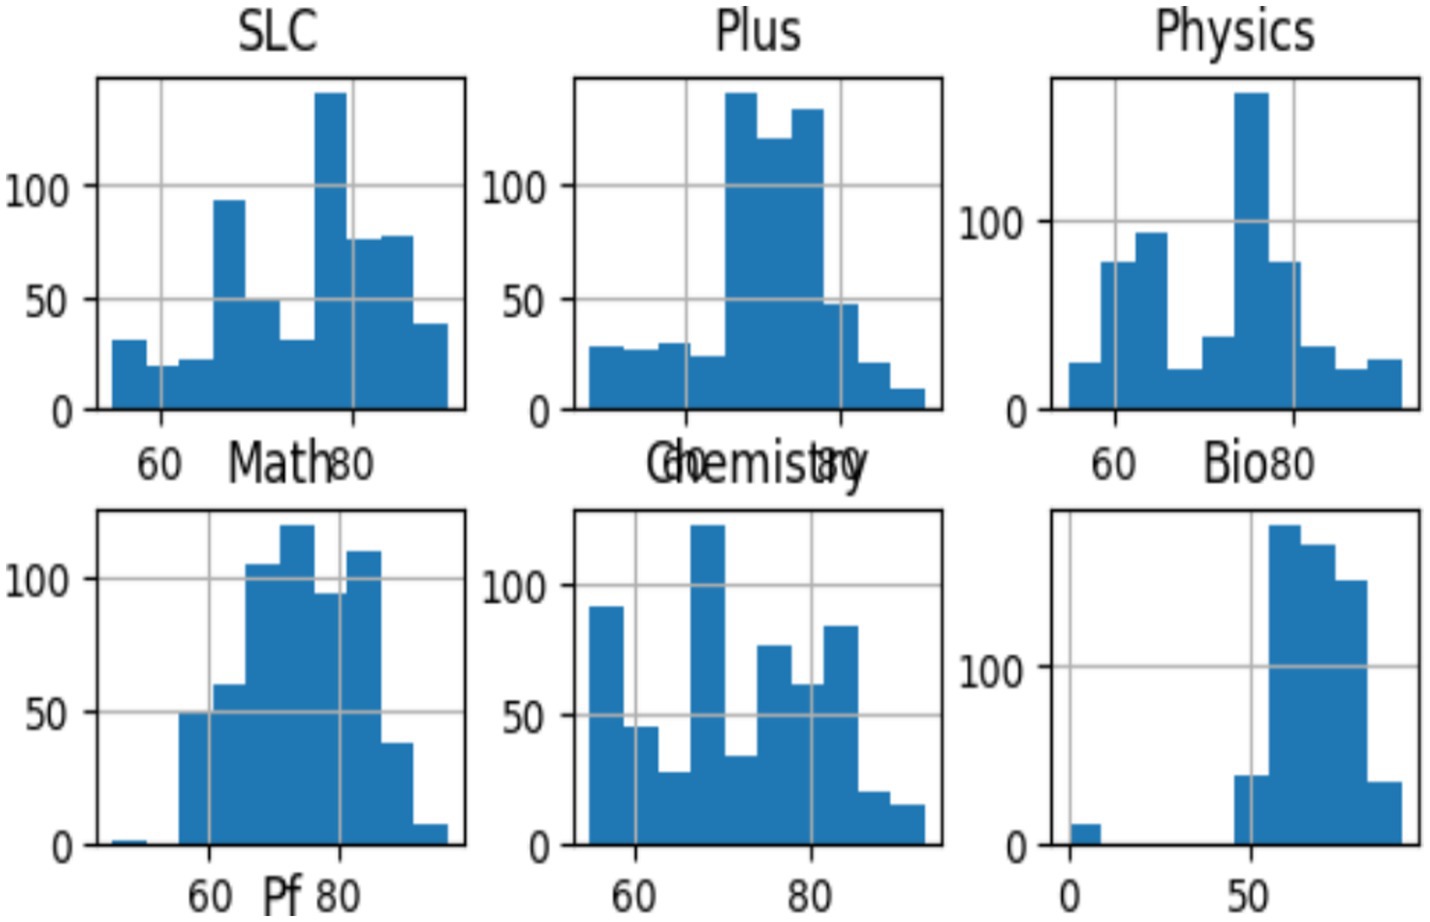
Figure 2. Histogram of student datasets.
After one-hot encoding of the categorical variables and binarizing the target variables, the resulting feature values were normalized. Duplicate columns were removed and replaced with new column names. The resulting data was then organized into a data frame. Density distribution plots were generated for each subset of data based on target values to indicate whether students received letter grades. Standard deviation sets were also calculated for independent samples.
Figure 3 shows the density plots based on target values, highlighting a significant imbalance in the variation of student grade target features.
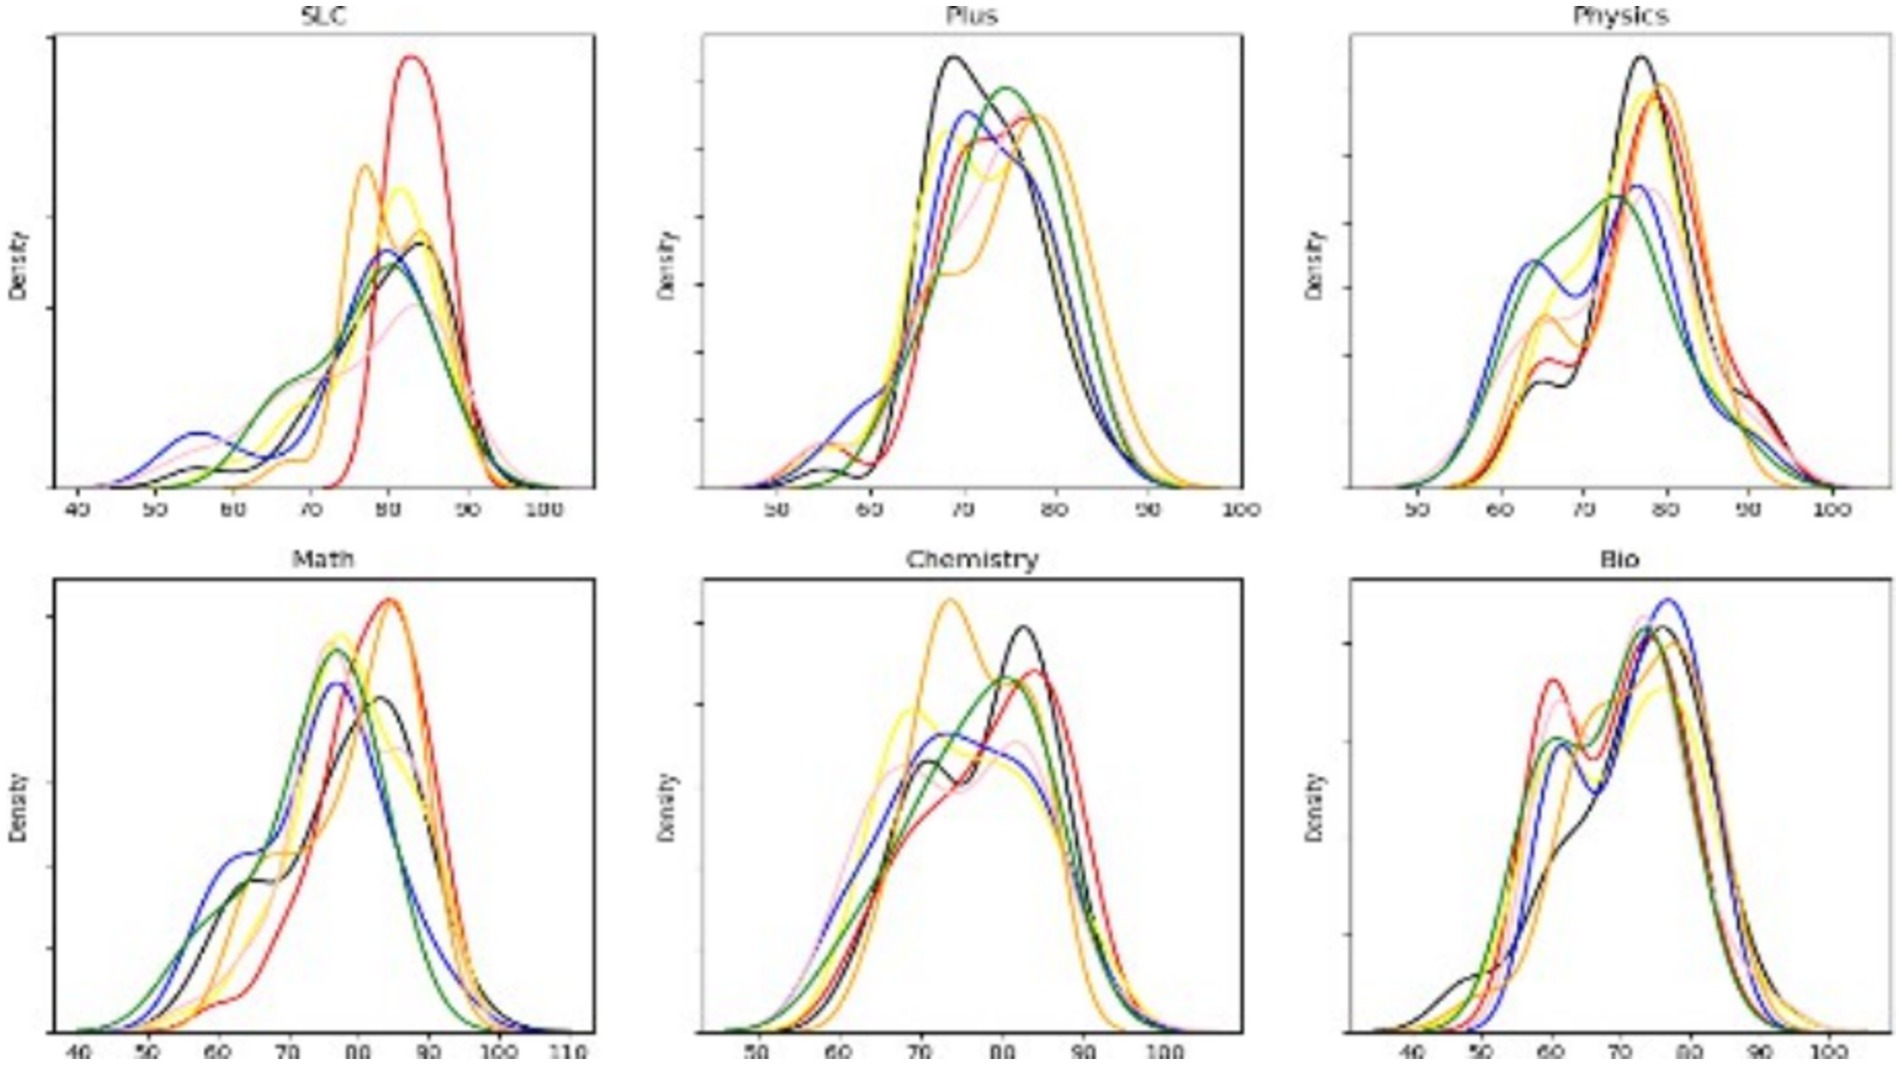
Figure 3. Density line graphs.
Figure 4 shows the classification of eight multiclass categories of student grades based on their input scores. The second heatmap (Figure 5) displays the correlation between input features and target variables associated with grades. There are 14 features, each contributing to the grades with varying degrees of significance. This indicates the need for further analysis using machine learning models. AI simulations across various disciplines provide interactive, immersive experiences that promote gamification, motivation, collaboration, and critical thinking while maintaining academic rigor. The integration of AI systems, human actors, and learning environments in education has evolved dramatically, requiring thorough analysis using diverse theoretical frameworks.
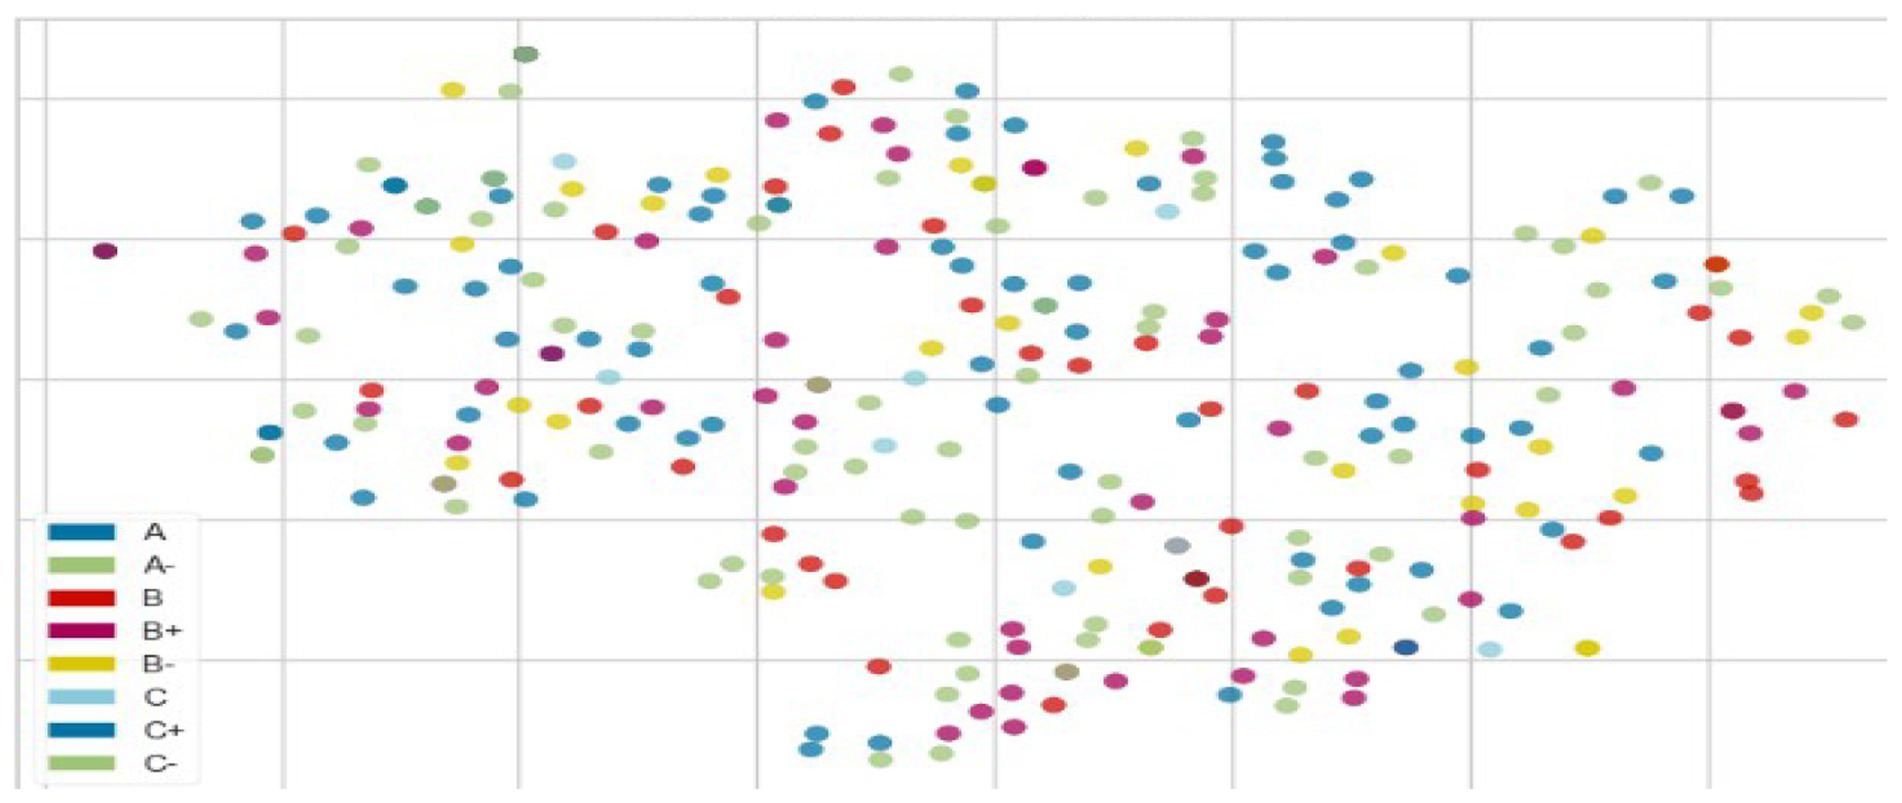
Figure 4. Grade distribution.
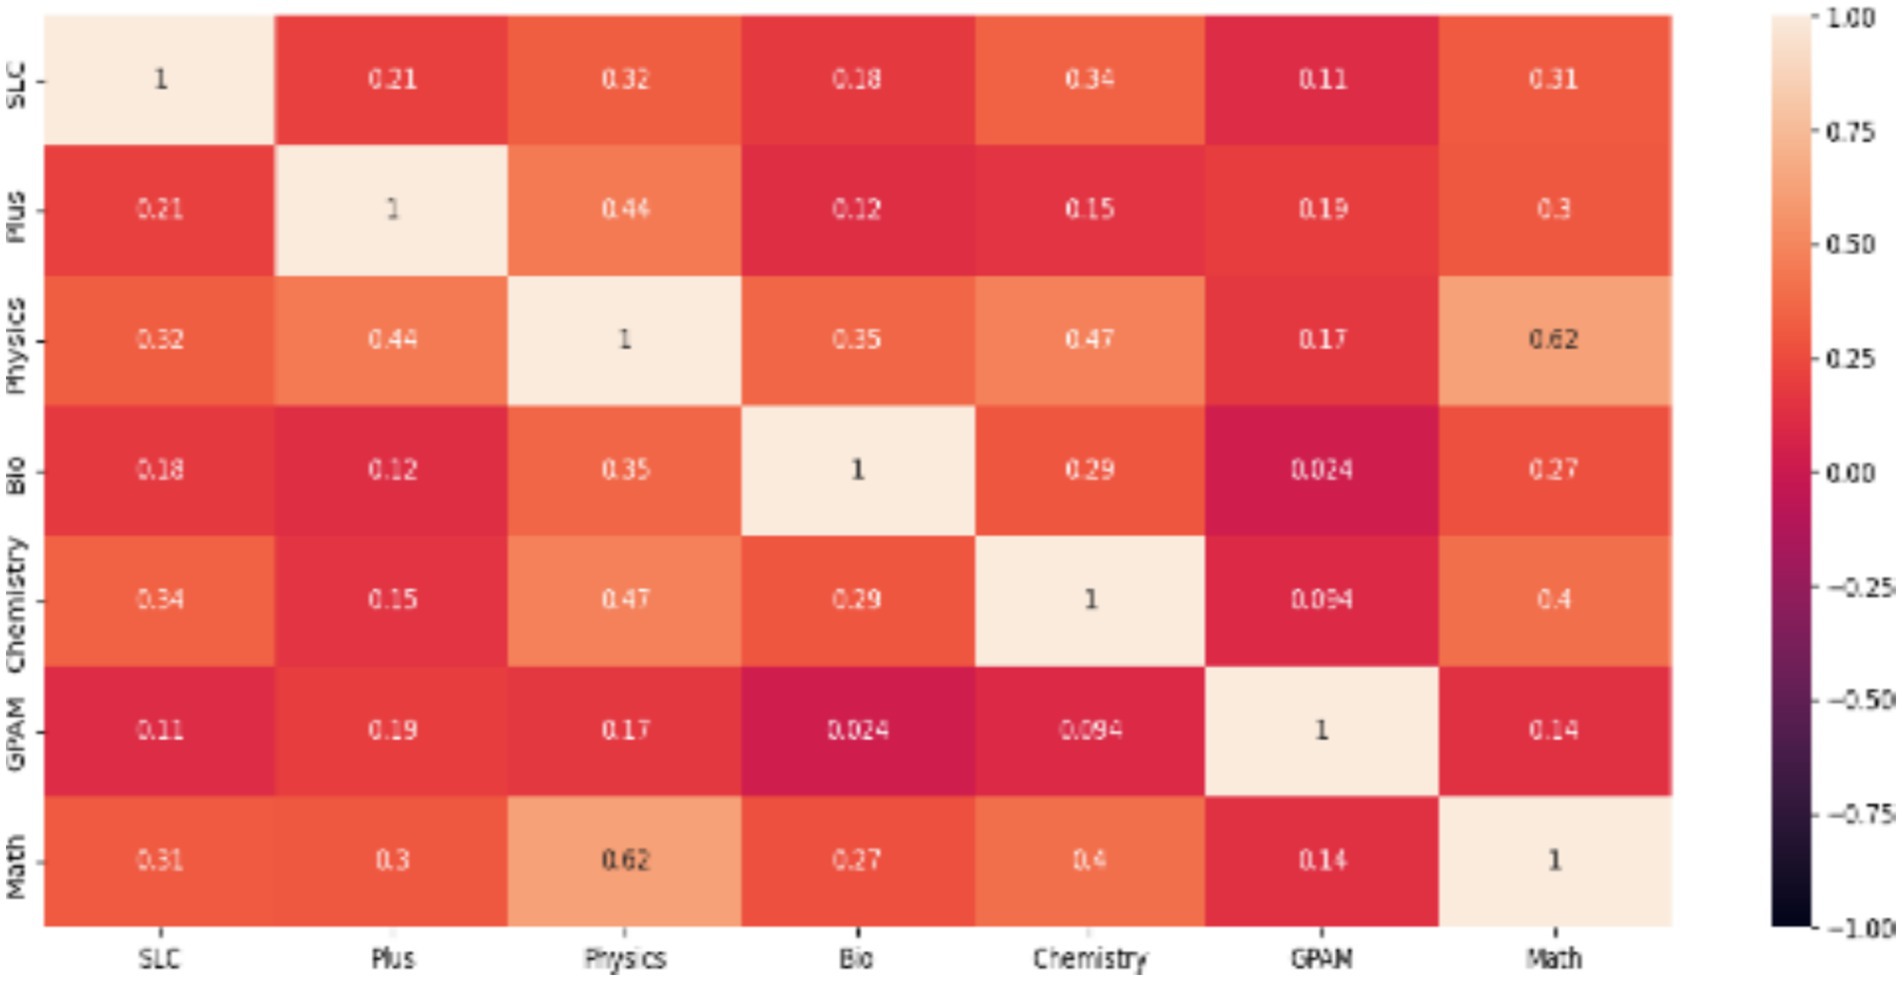
Figure 5. Correlation plot.
4 Materials and methods
In this study, the research database was divided into two parts. The first part included background information about 580 engineering students, both successful and unsuccessful, from the Bachelor’s programs in Civil, Electrical, Computer, and Software Engineering gathered through primary data collection. The final grades of each student were obtained from the examination office of Pokhara University in the 2023 final university results. For ethical reasons, student names, roll numbers, and registration details were omitted from the analysis. Only students who successfully completed their university were analyzed, and their grades were classified using multiple grading classifications. The second part of the database included the respective internal marks collected from the school, organized in row-wise data preparation using the VLOOKUP function in Excel. The null and alternative hypothesis statements assess the differences or effects occurring in the population. Modern science and engineering education must be analyzed and predicted based on previous diplomas to benefit both institutions and individuals. Therefore, to develop the most accurate model from the research data for predicting multi-class grades, the following model development process was followed.
After loading relevant libraries, such as make_classification, decision tree, AUC/ROC curve label binarization, and one-vs-rest classifiers, the machine learning model was trained using one-vs-rest classifiers and fitted with training data splits. The model was then tested in a for loop, predicting probabilities alongside the test scores.
The ROC curve for each class showed the false positive and true positive rates for both the test and predicted scores. Similarly, the macro and micro averages for each model were calculated after determining the function of each output score. The AUC, a scalar evaluation metric ranging from 0 to 1, was used to measure true positive and false positive values. The prediction-recall curve demonstrated that high recall predicts fewer positives with greater accuracy, whereas high recall predicts many positives but also increases false positives. Therefore, achieving a balanced model fit is essential, as reflected in the confusion matrix. Consequently, the model comparison and evaluation process in this research followed the architecture presented in Figure 6, after data preprocessing.
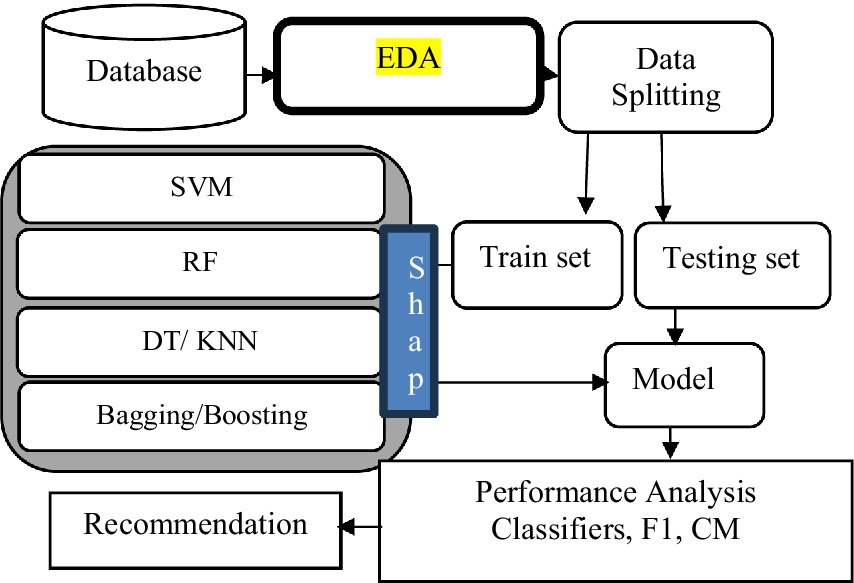
Figure 6. Model comparison process.
The baseline values, without any feature treatment from the architecture, are presented in Figure 7, with the summary accuracy displayed in Figure 8. The AUC curve indicates that decision tree classifiers achieved 55%, random forest classifiers 64%, support vector machines 59%, AdaBoosting 57%, XGBoosting 60%, logistic regression 65%, and bagging classifiers also scored 65%. The area under the curve for multiclass classification of student grades was best predicted by the random forest, logistic, and gradient algorithms, which outperformed the decision tree and XGBoost algorithms. This was further assessed using multiple model heat maps alongside accuracy, precision, and recall plots. Cohen’s kappa and Mathew’s coefficient indicated the lowest global accuracy in multi-class grade prediction when the false positive-to-negative ratio was considered under worst conditions (Table 1).
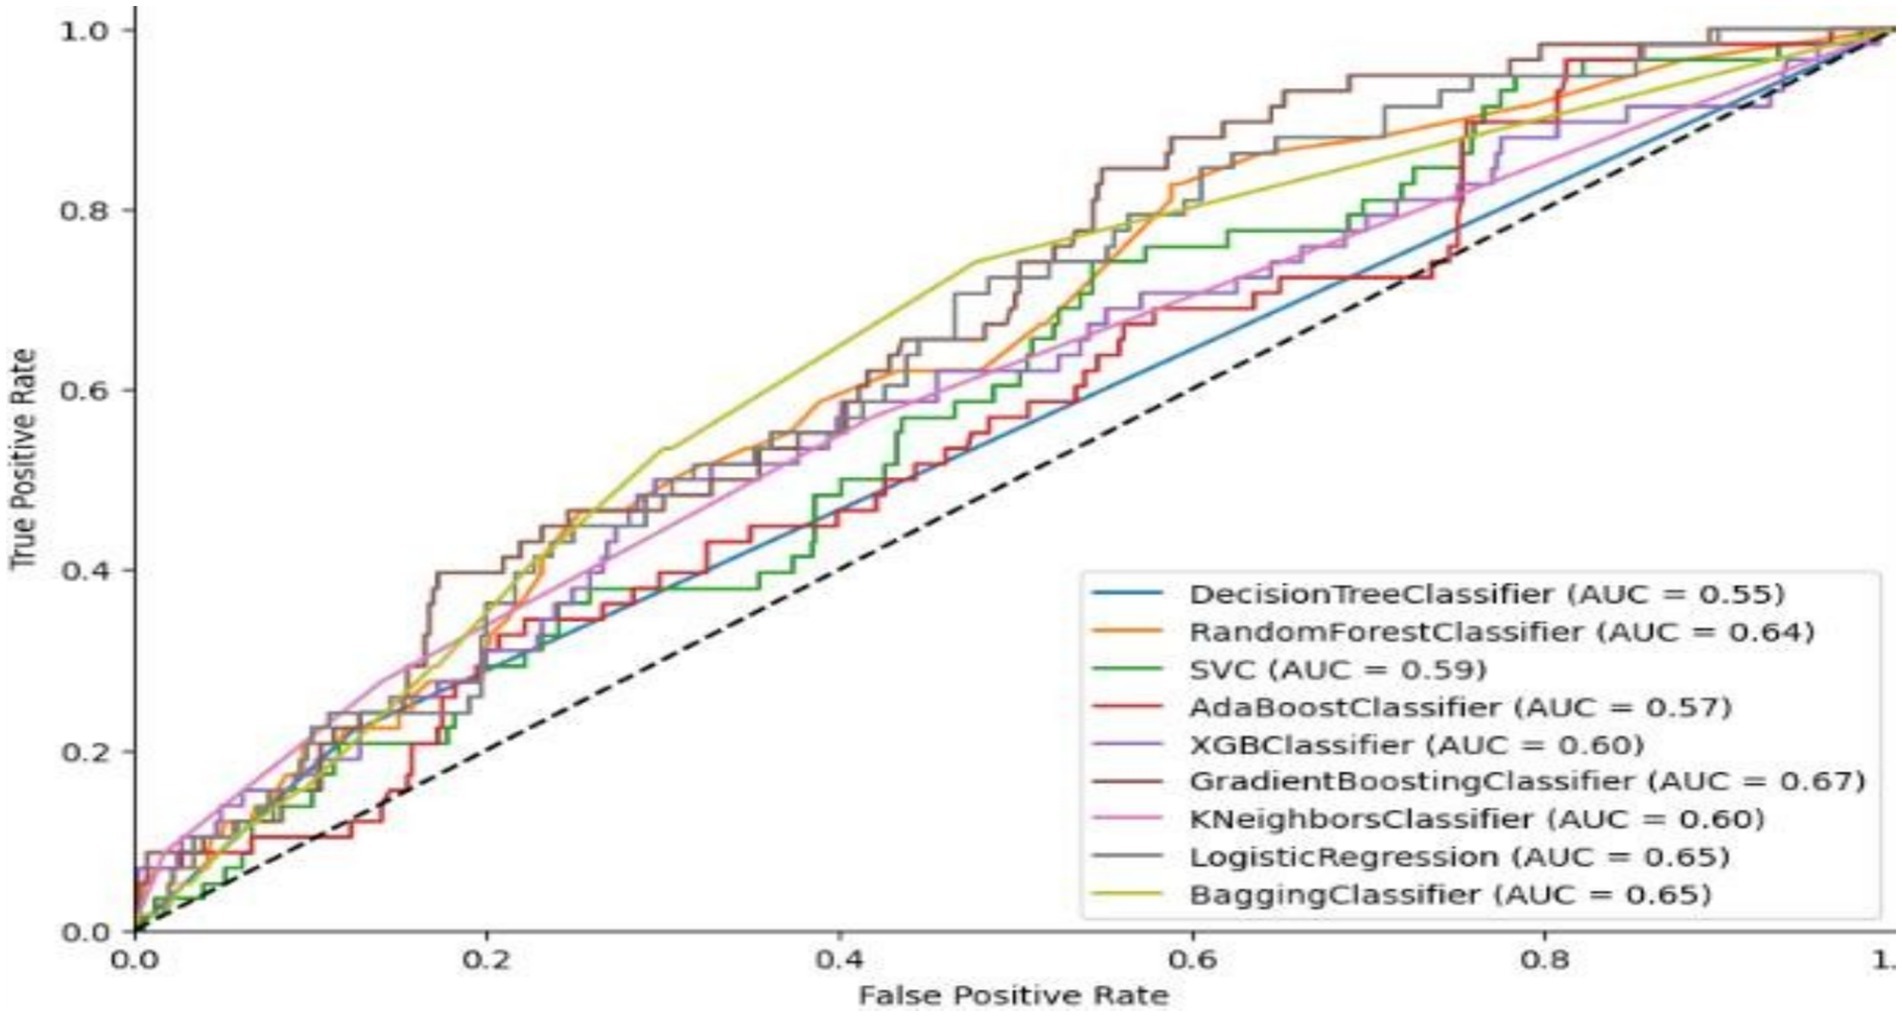
Figure 7. Ensemble AUC curve.
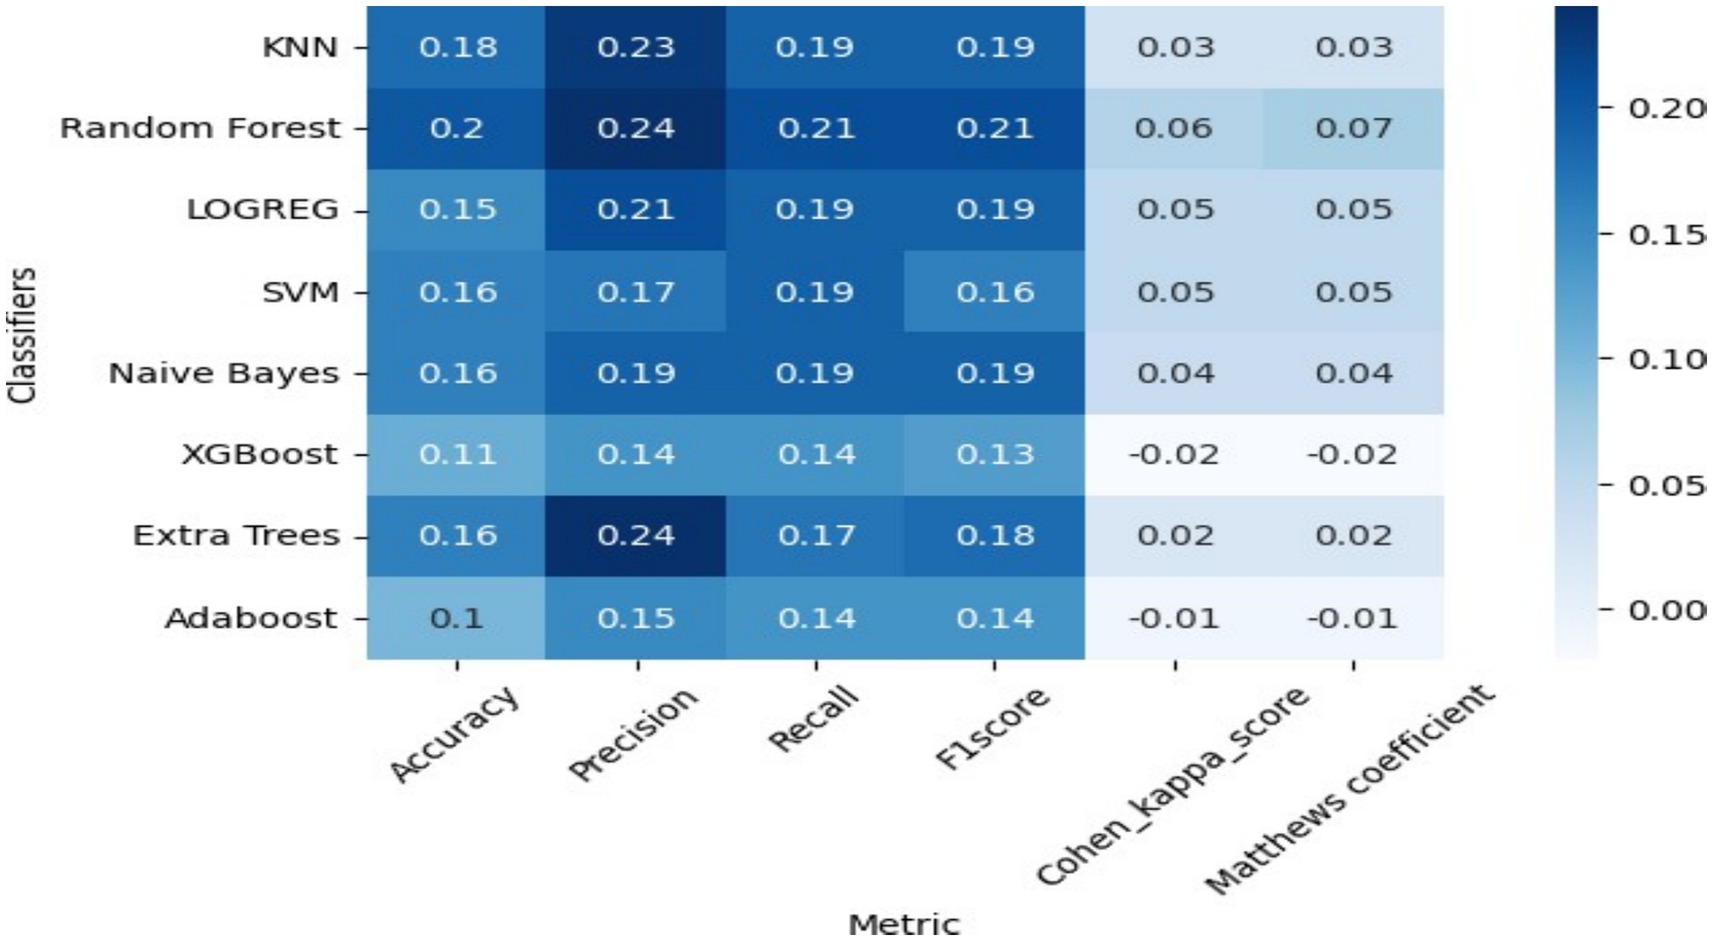
Figure 8. Ensemble heat map of precision recall.
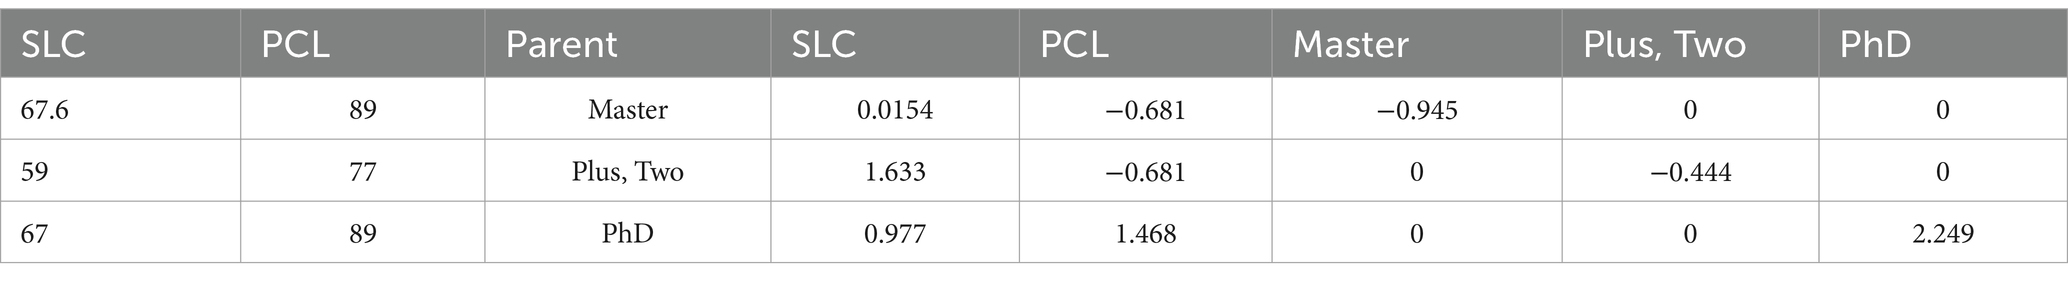
Table 1. Before and after datasets.
4.1 Support vector machine
Support vector machines used a multidimensional hyperplane after optimizing each student’s grade classification via quadratic methods to separate multiclass student grade categorizations. The hyperparameter “c” regularizes the trade-off between classification error and the kernel, which indicates higher-dimensional linear relationships among them. A support vector machine with the kernel set to linear, probability set to true, and a random state of 0 was used to classify the multiclass feature grades: A (55), A- (63), B+ (34), B (64), B- (50), C+ (43), C (46), and C- (71), respectively. Similarly, global dependency accuracy scores increased by 62%. When the Keras model was adjusted to polynomial, its accuracy score reached 22.4% in local accuracy across multiple grades, improving by 29% as the overall global accuracy of the support vector machine increased.
Based on Table 2 and the micro-AUC-ROC curve, which presents macro and micro accuracy scores, we can conclude that there is a difference in internal accuracy scores and global variation across multiple scored features.
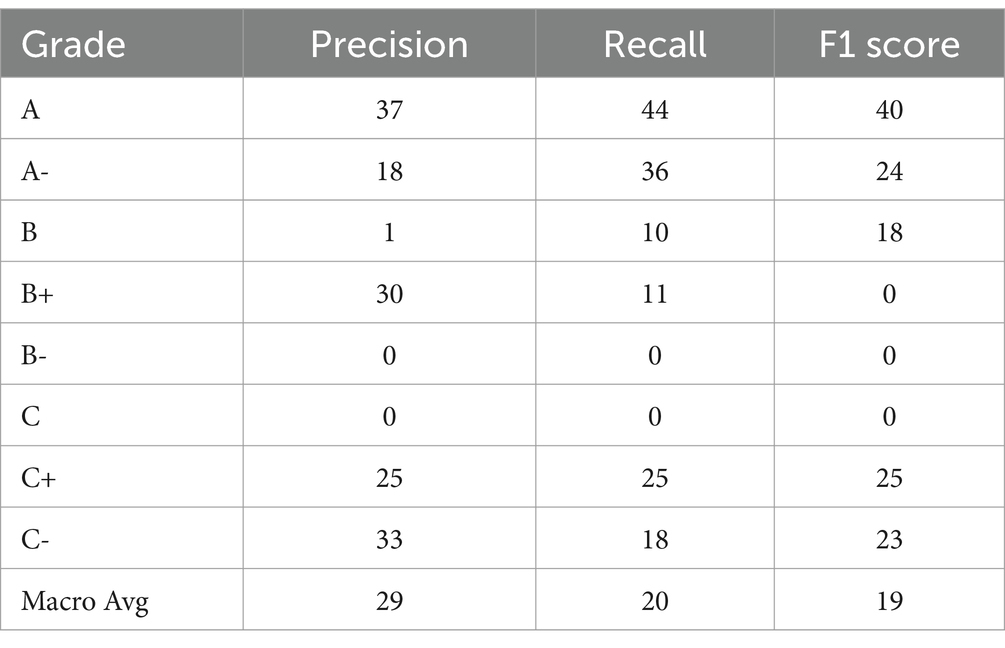
Table 2. Score for accuracy.
4.2 Random forest model
By randomly selecting subsets through column and row sampling, the random forest model aggregates data from multiple trees to classify multiclass student grades. The decision tree recursively splits the data until the final node in order to prevent overfitting. Using one-vs.-rest classifiers, the random forest model with default settings predicts multiclass student grades as follows: A (63), A- (64), B+ (59), B (59), B- (50), C+ (71), C (52), C- (59). Among these grades, B- exhibits the least accuracy, while C+ predicts the highest internal accuracy. Furthermore, the global ROC score of 64% indicates that the model performs averagely, accurately predicting over 64 true positives and true negatives (Figure 9).
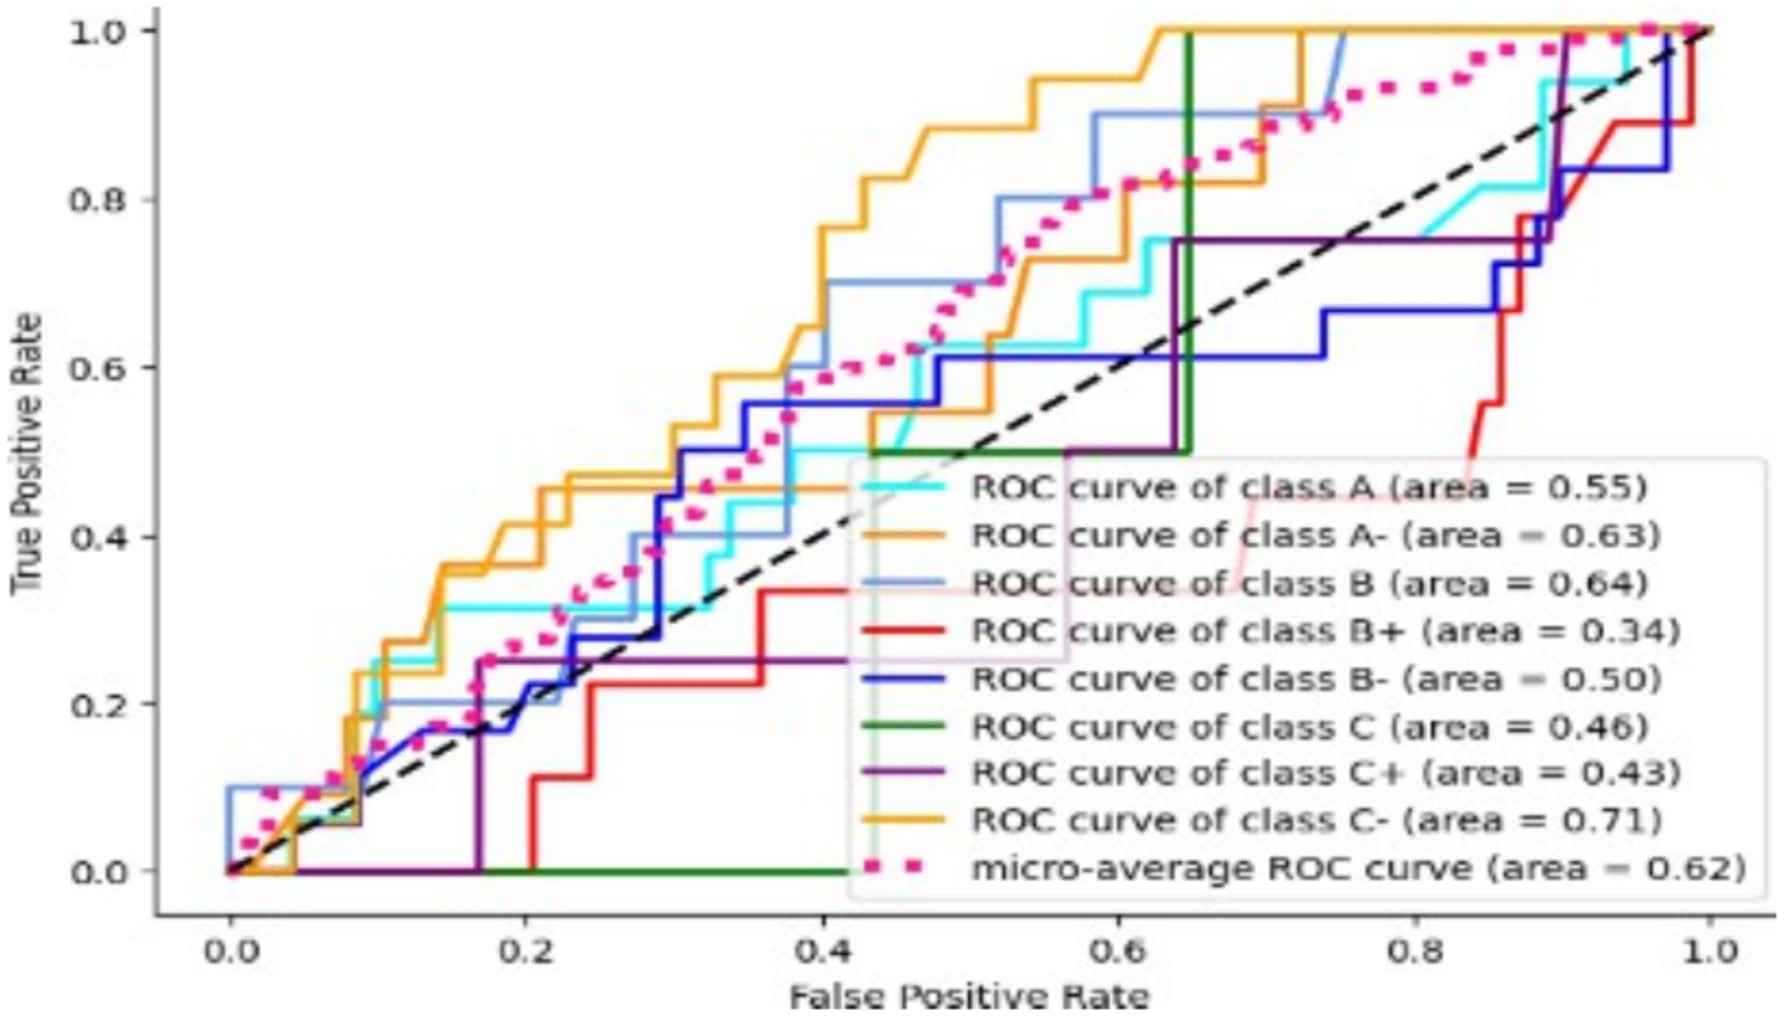
Figure 9. SVM ROC curve.
The overall model performance for local classification was found to be unsatisfactory, as indicated by a balanced accuracy score of only 0.22. Gradient Boosting, on the other hand, is an algorithm that uses sequential predictions from weak models to enhance output, optimizing errors from each weak model to the next through gradient descent. This model assumes that all input features have non-linear relationships with one another to facilitate multiclass classification tasks. The model scored A (64), A- (71), B (56), B+ (56), B- (55), C (43), C+ (76), and C- (56), as illustrated in Table 3. Among these grades, C had the lowest accuracy, while C+ exhibited the highest accuracy within the local association. The macro average global accuracy was 66. The balanced accuracy score for each grade’s prediction was 20%, as shown in Figure 10.
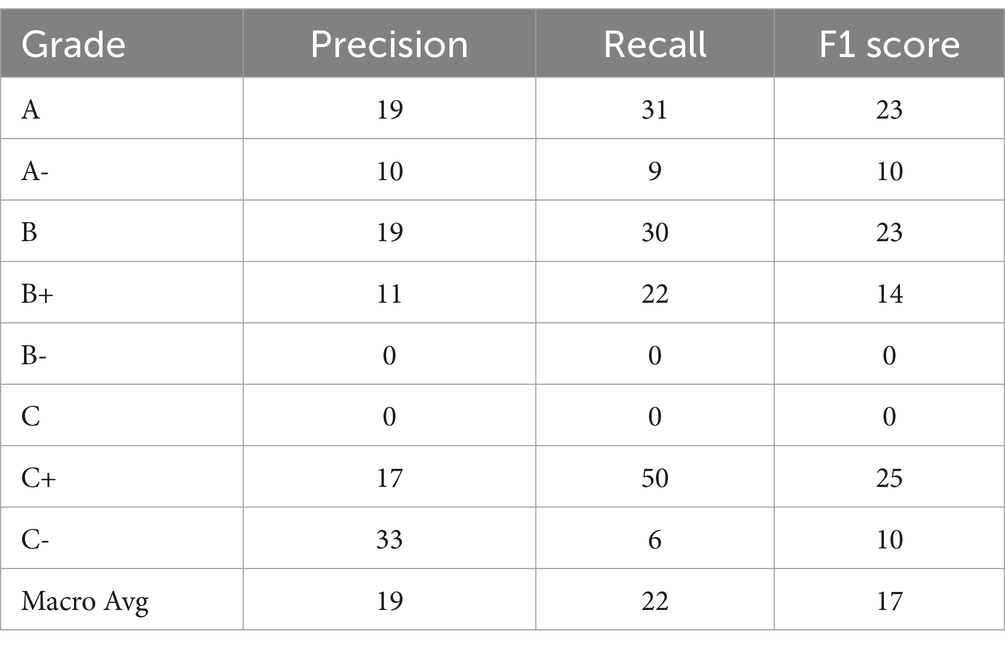
Table 3. Accuracy score.
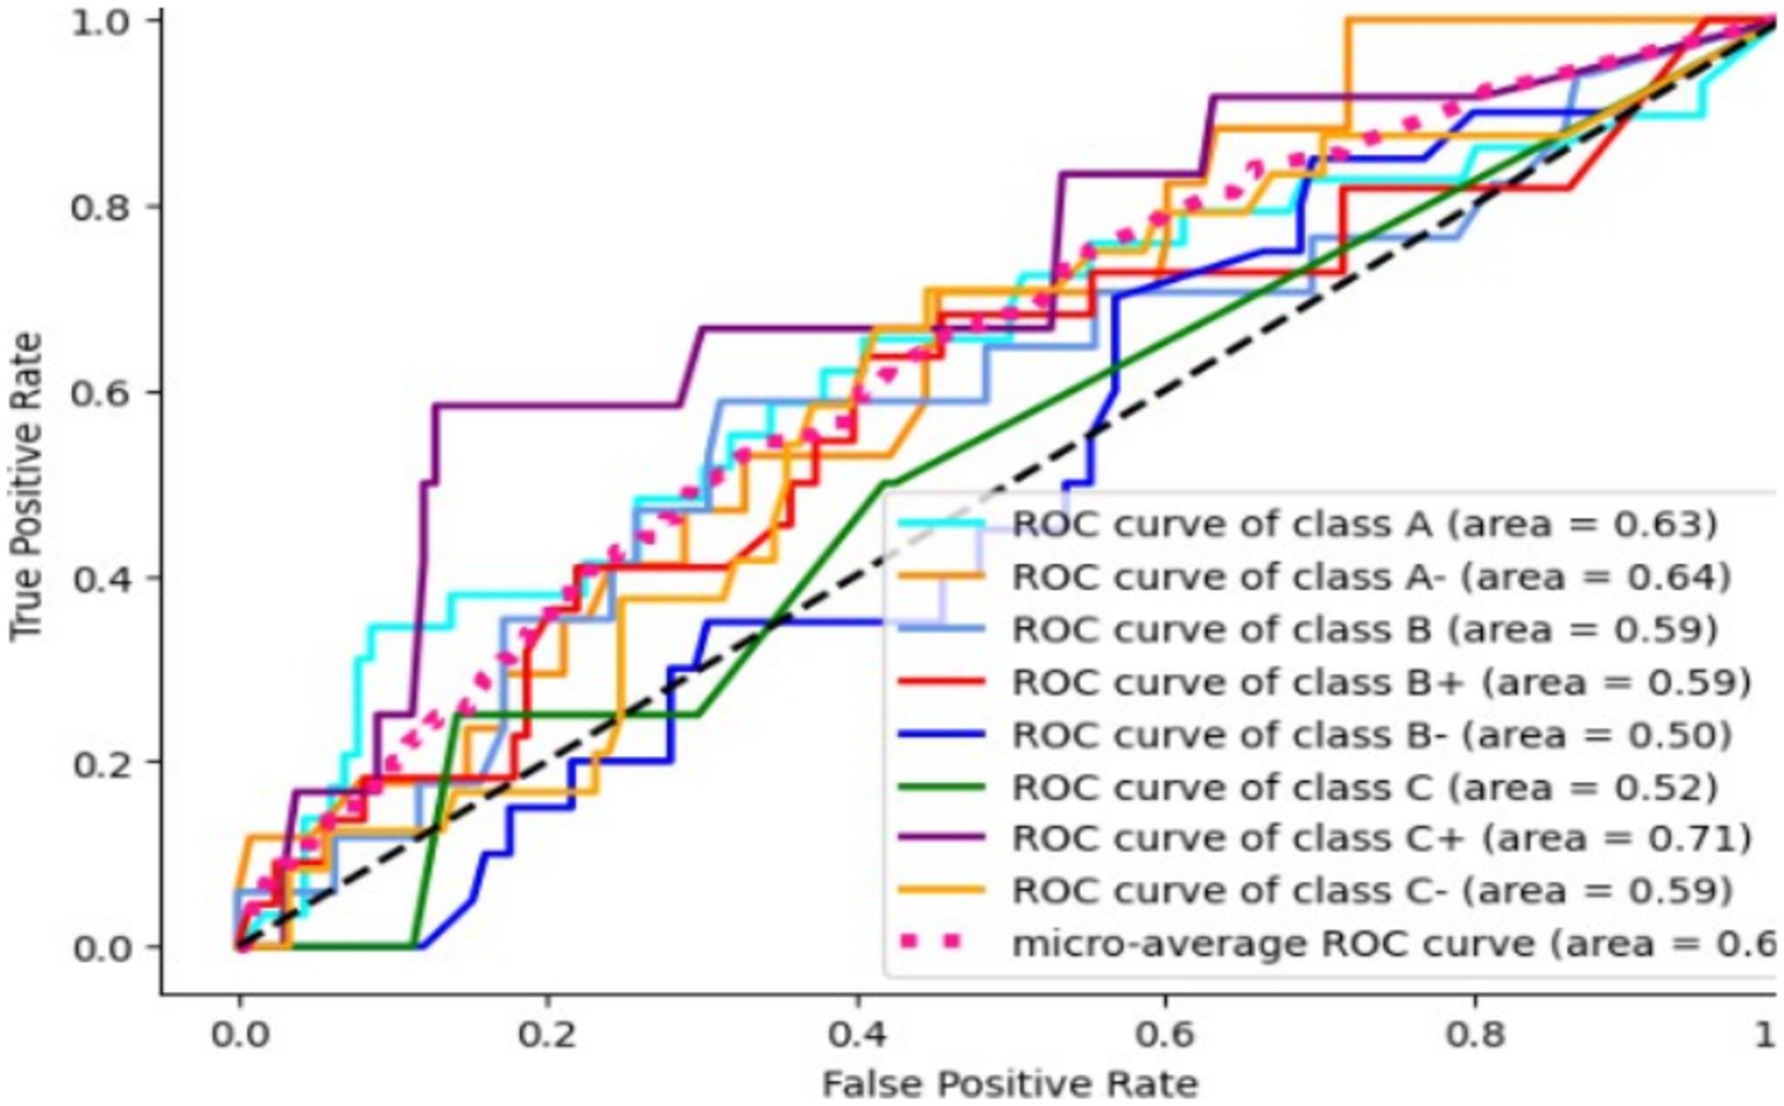
Figure 10. Random forest ROC curve.
4.3 Gradient boosting
The gradient boosting algorithm improved the output by following sequential predictions from weak models. The gradient descent optimization errors from each weak model are passed to the next model. However, this model presumed that all input features interacted as non-linearities with one another to create the best model. The student grade multi-classification received scores of A (64), A- (71), B (56), B+ (56), B- (55), C (43), C+ (76), and C- (56), as shown in Table 4. Grade C represents the lowest score, while C+ shows the highest accuracy when considering local association and macro average global accuracy, with a total of 66 global scores. Similarly, the balanced accuracy was 20% for each grade’s prediction, as demonstrated in the ROC curve in Figure 11.
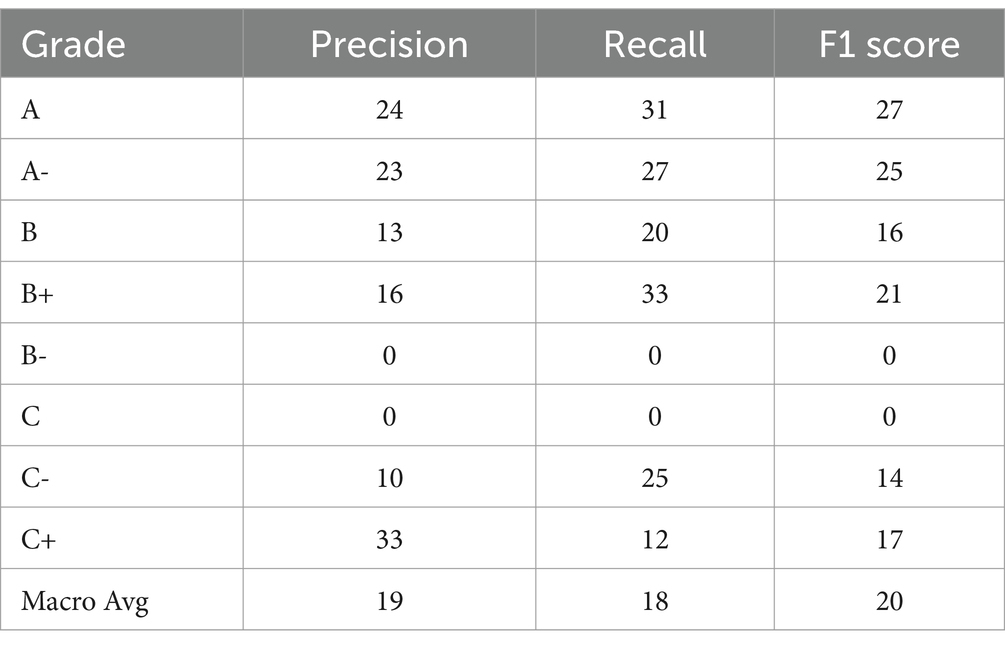
Table 4. Accuracy score.
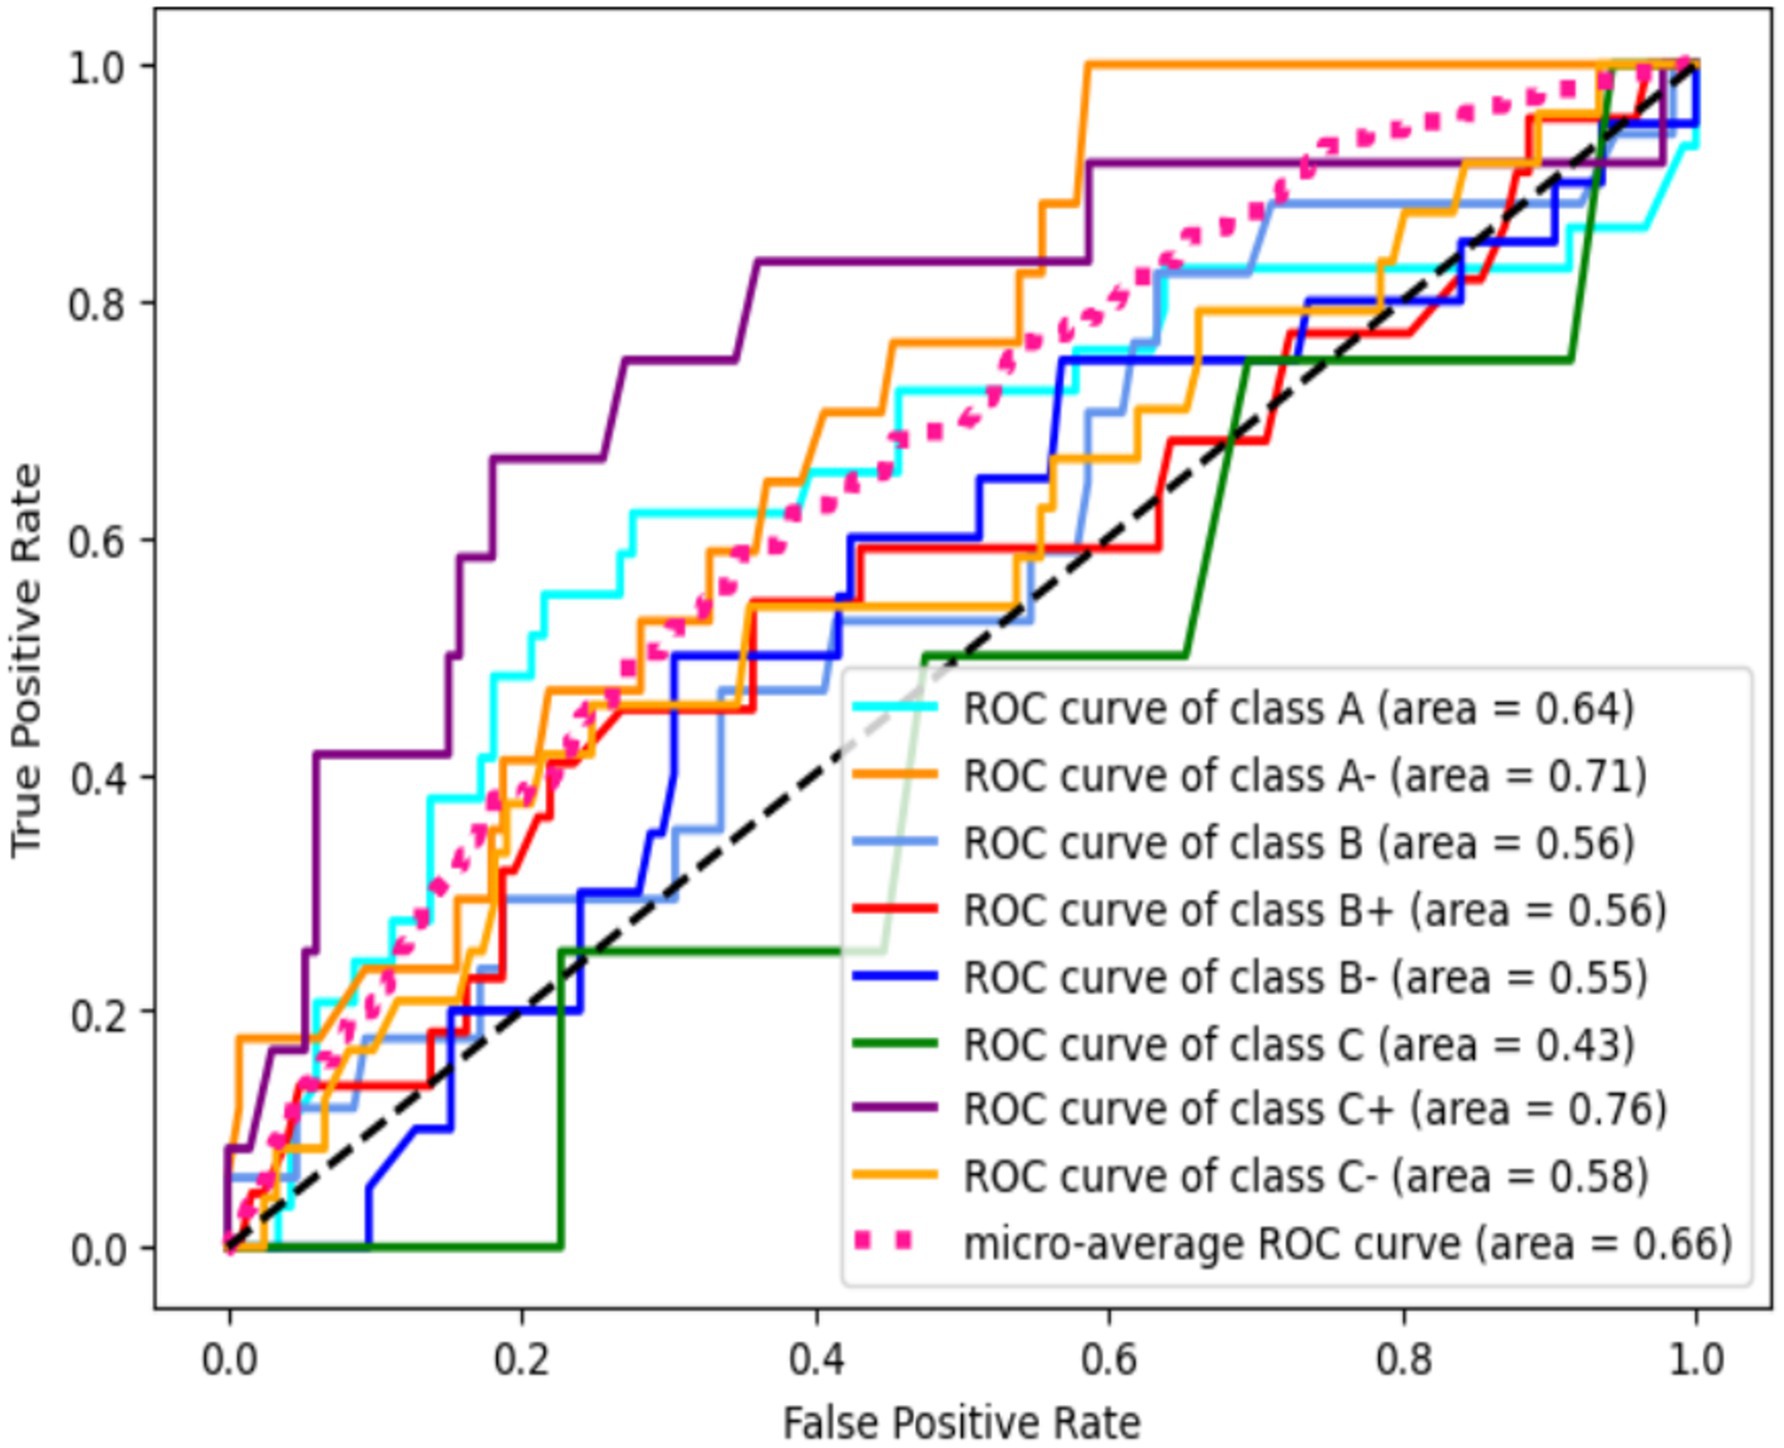
Figure 11. Gradient boosting ROC curve.
4.4 Extreme gradient boosting
The XGBoost algorithm uses various optimization techniques, including L1 and L2 regularization and pruning, to eliminate unnecessary branching while enhancing accuracy and mitigating overfitting. It utilizes k-fold cross-validation to obtain the most accurate predictions. After applying multiclass classification with the one vs. rest model, the following scores were achieved: A (61), A- (65), B (54), B+ (57), B- (52), C (48), C+ (74), and C- (61). The C+ grade was predicted with the highest accuracy, while the B grades were the least accurate. The balanced accuracy score for this model was 35% for global macro accuracy (Figures 12, 13).
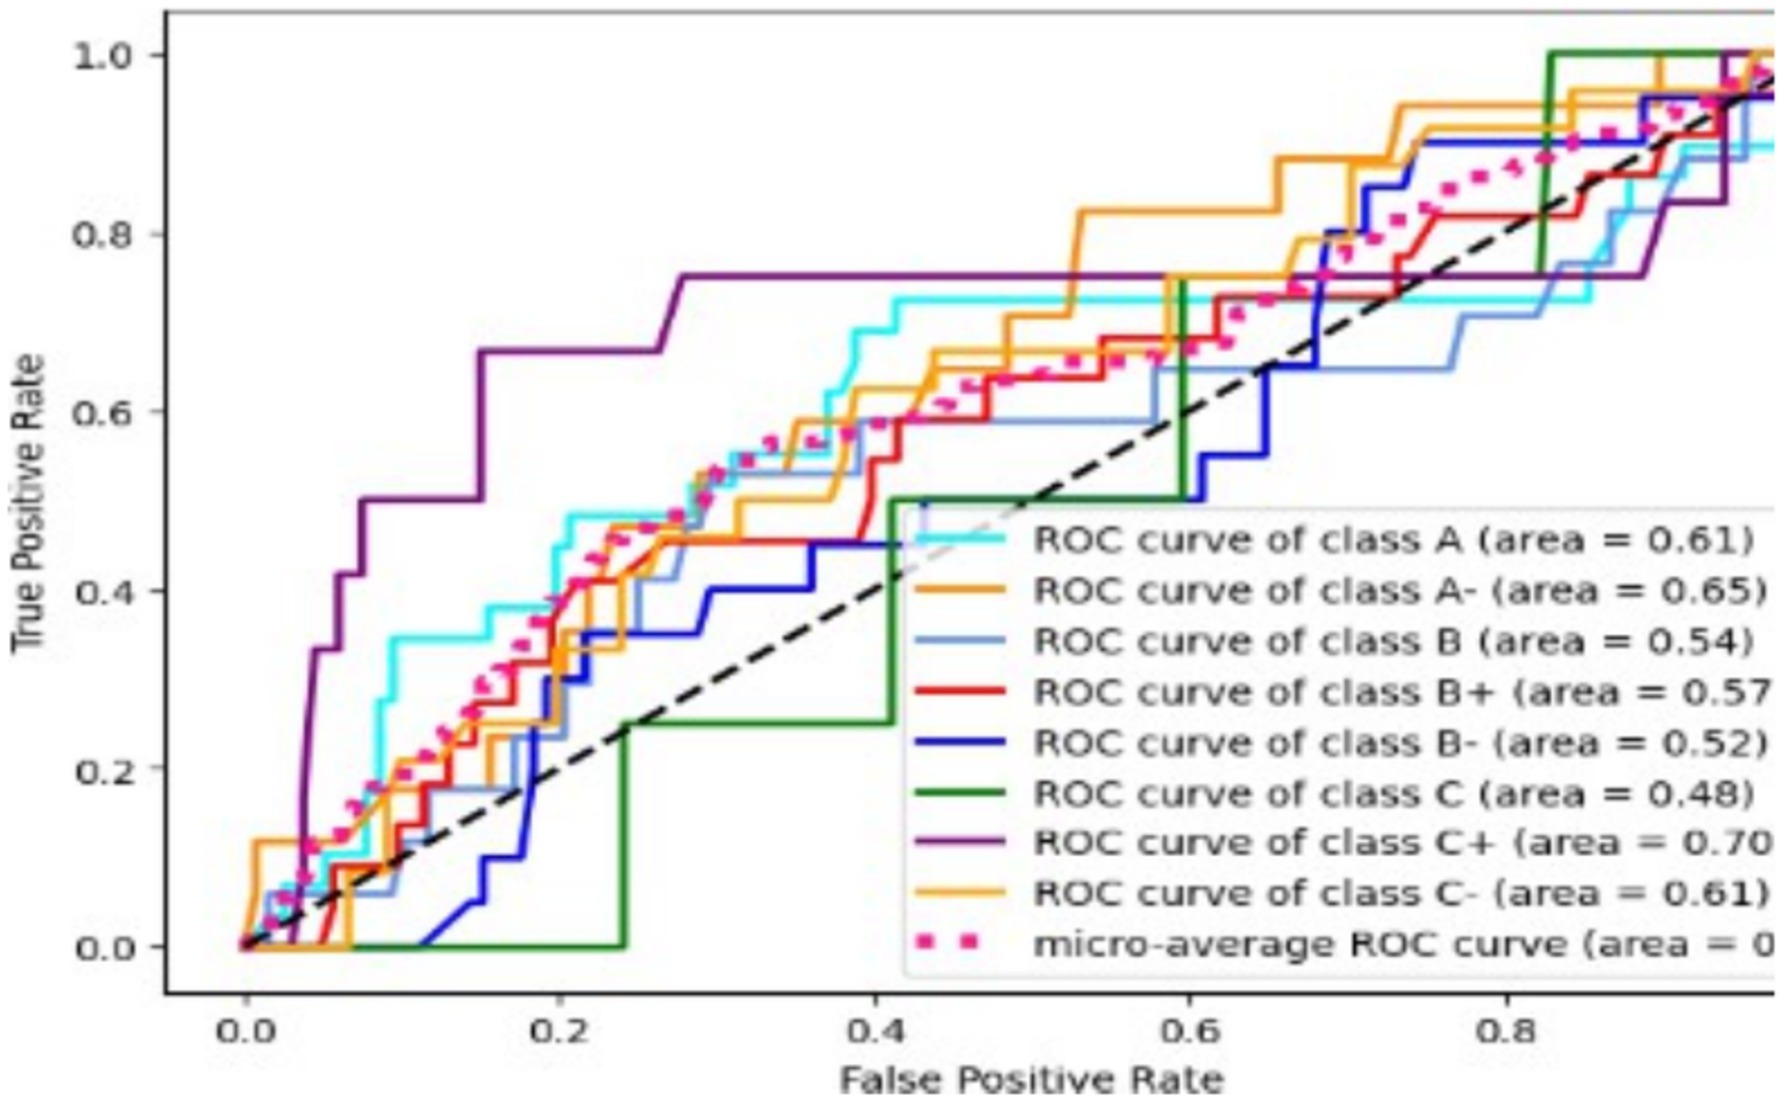
Figure 12. XGBoosting ROC curve.
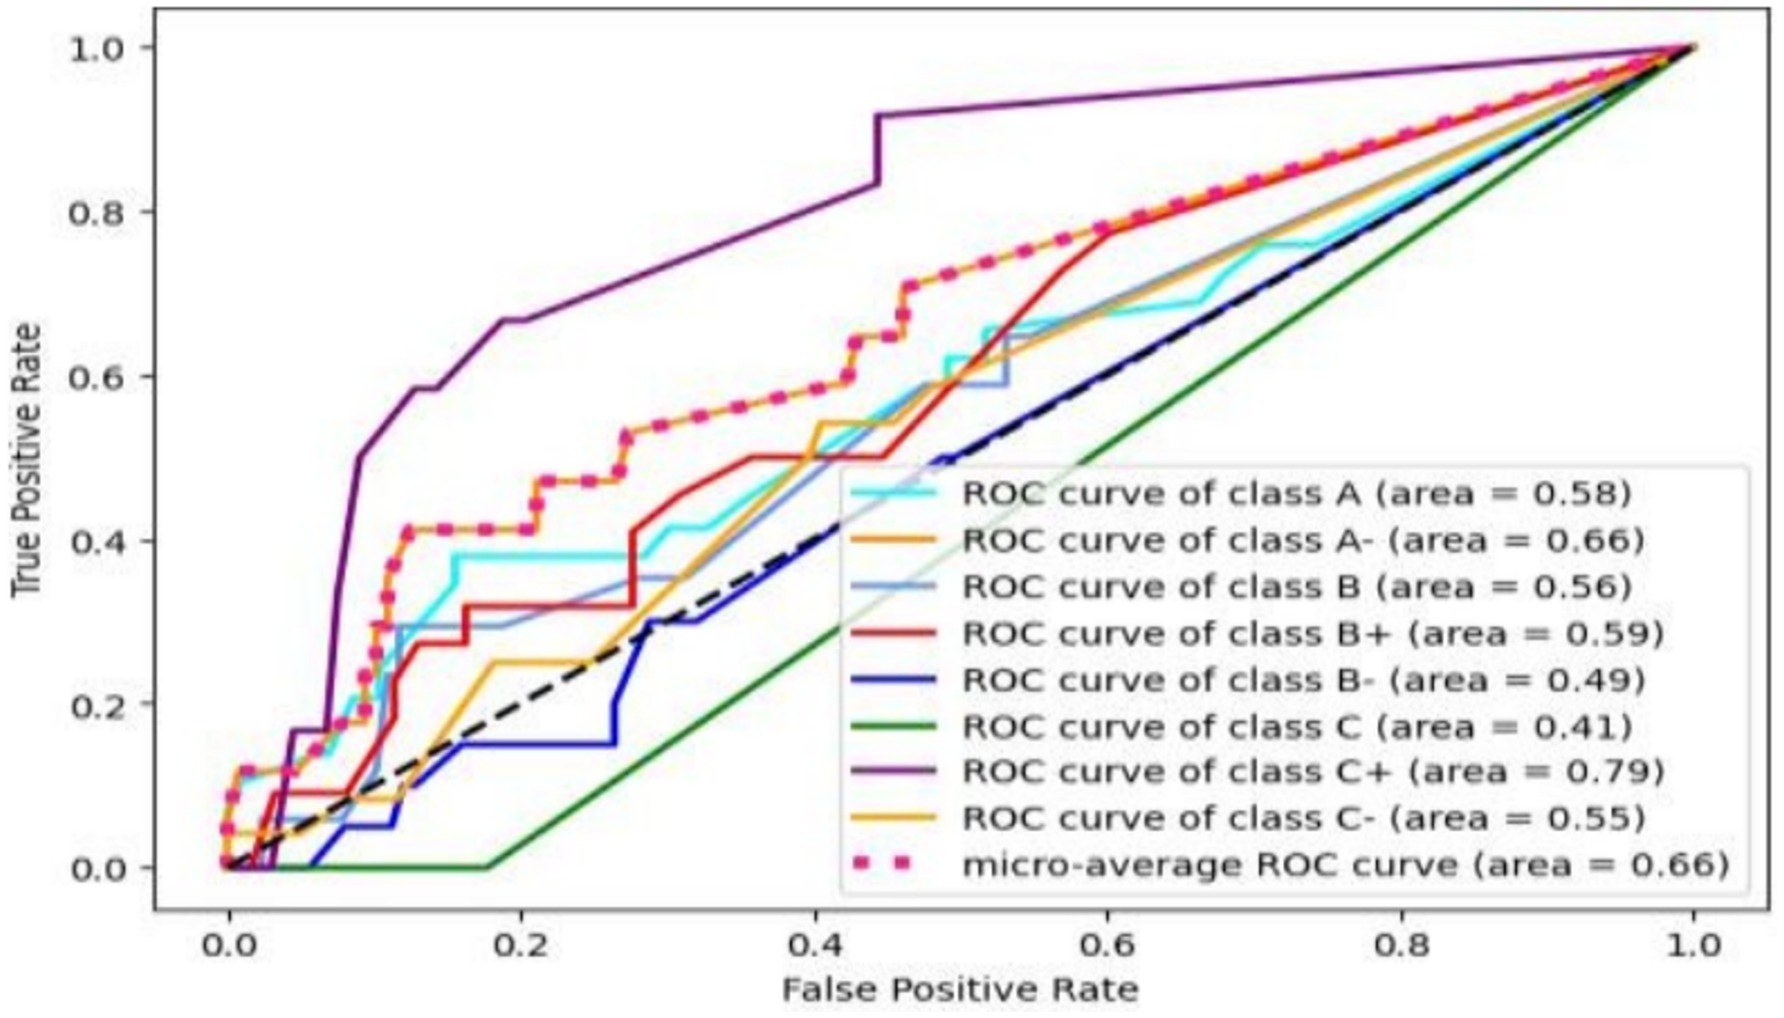
Figure 13. Bagging ROC curve.
4.5 Bagging algorithm
The bagging algorithm initially selects a random subset of the data, enabling it to achieve the highest accuracy score by using majority voting for prediction. The decision tree algorithm is then used to create multiple predictors each time. The receiver operating characteristic curve can be used to classify the multiclass student score problem, predicting scores of A (58), A- (66), B (56), B+ (59), B- (49), C+ (79), and C (55). Grade C has the least accurate prediction, while C+ has the most accurate prediction among the local predictions. The macro average achieved a 66% accuracy.
The RandomForestClassifier algorithm was used to predict multiclass grades, with estimators =100, max_depth = 10, min samples split = 10, criterion = entropy, and random state = 42. The model’s local and global accuracy scores were calculated separately, and it is recommended for multiclass grade prediction.
The multiclass classification of students’ various grades, when combined with internal true positive and false positive, predicts less accurately than false vegetative grades. However, the precision-recall and F1 scores were measured more accurately at 33% locally when the macro average used the C student grade to predict 97%, and the least A grade scored 66%, which is the best model. Similarly, when macro-averaged with global precision, accuracy is up to 33% without any errors. This model finally predicts correct predictions overall: 14 out of 73 predictions were scored correctly. The local accuracy is 0.19. Accuracy is similar per class with and without true negative concern; the sensitivity = TP/ (TP + FN) calculated globally, with TNs: 0.79% on average. The specificity = TN/ (TN + FP) global accuracy without TNs: 0.19% and global accuracy becomes 97% (Tables 5–7).
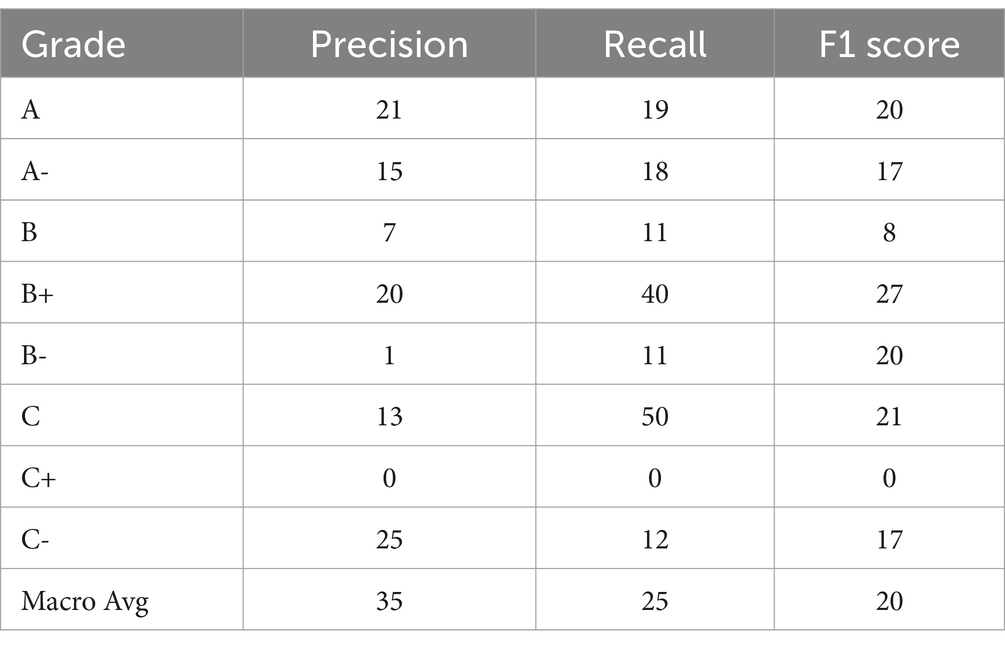
Table 5. Accuracy score.
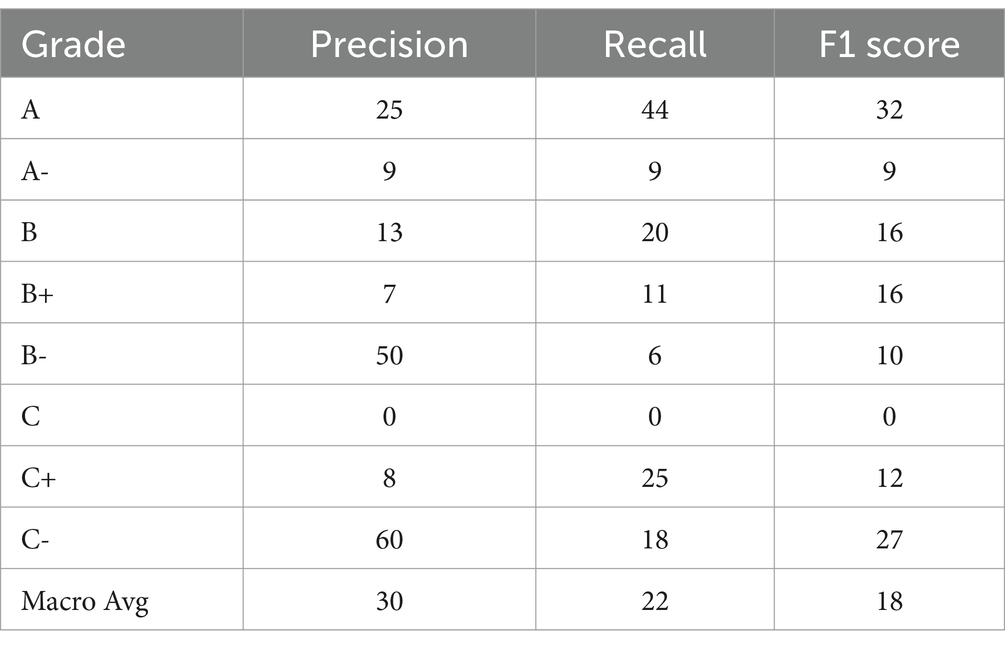
Table 6. Accuracy score.
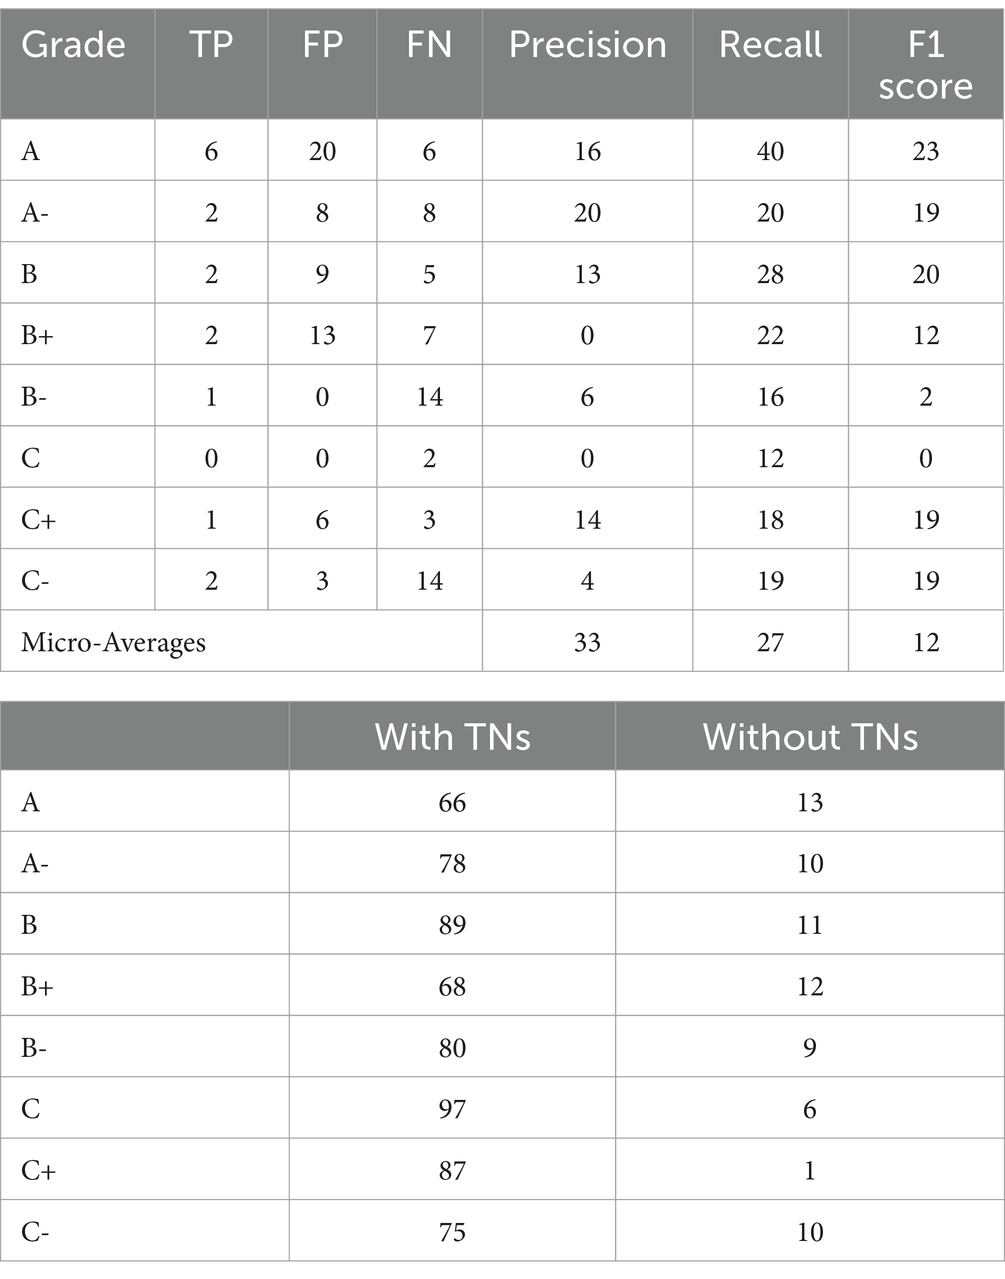
Table 7. Accuracy score.
The error bar diagram for multiclass classification predictions using the random forest, support vector, and extra tree algorithms is shown in Figure 14. The random forest and extra tree models had classification errors in all categories, while the support vector machine had no errors in grades C and C+. The grades A and A- exhibited the highest similarity among the other grades. This indicates that the classification of student grades varied significantly across different grade levels.
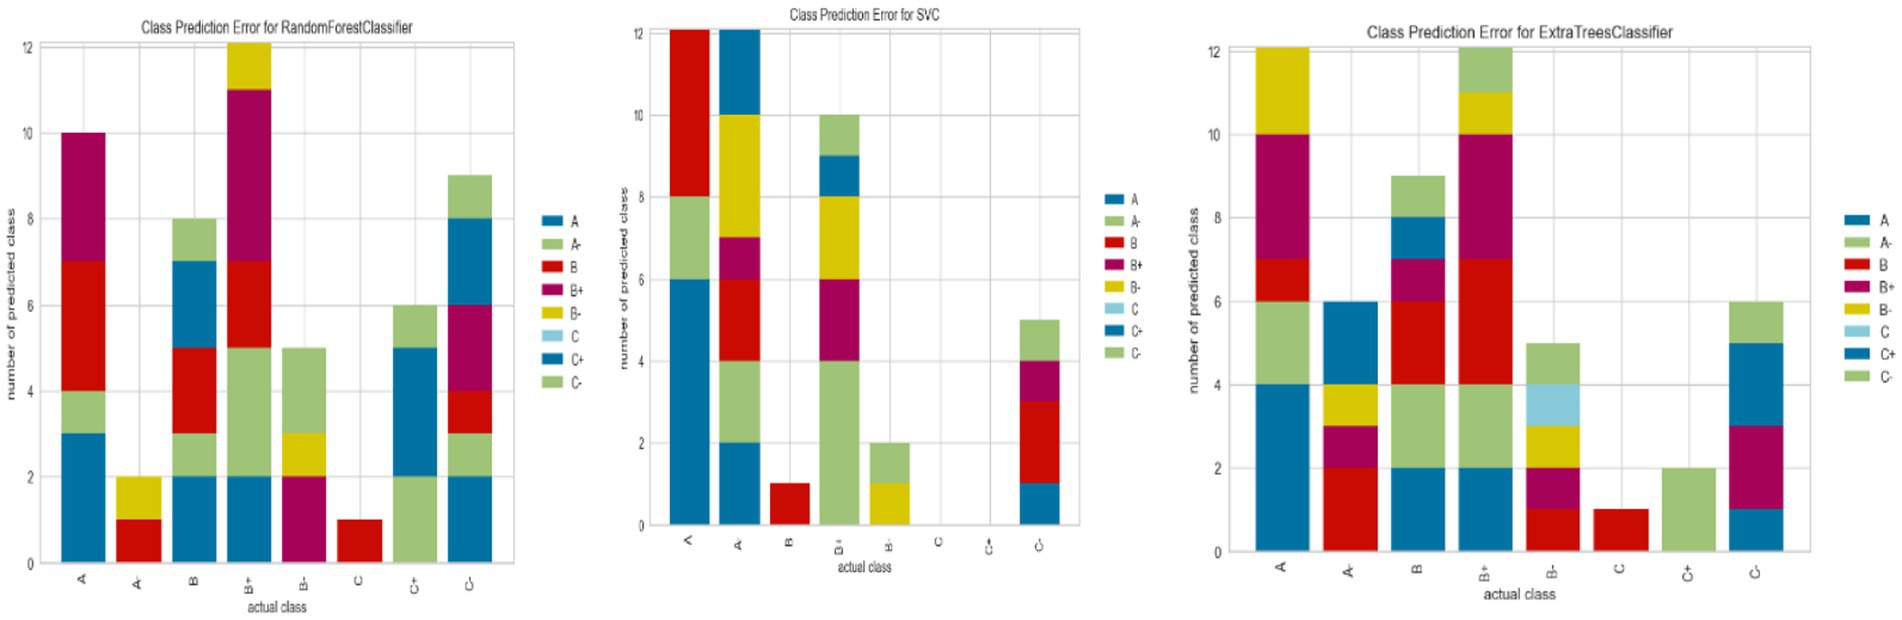
Figure 14. Accuracy error bar plots.
The random forest, bagging, decision tree, and gradient boosting models achieved 100% training accuracy, indicating overfitting, while their testing accuracy was lower, as illustrated in Table 8. In terms of execution time, the decision tree algorithm performed significantly faster, taking only 0.46 s compared to the K-Nearest Neighbors model, taking 1.56 s. Both were much quicker than the ensemble algorithms.
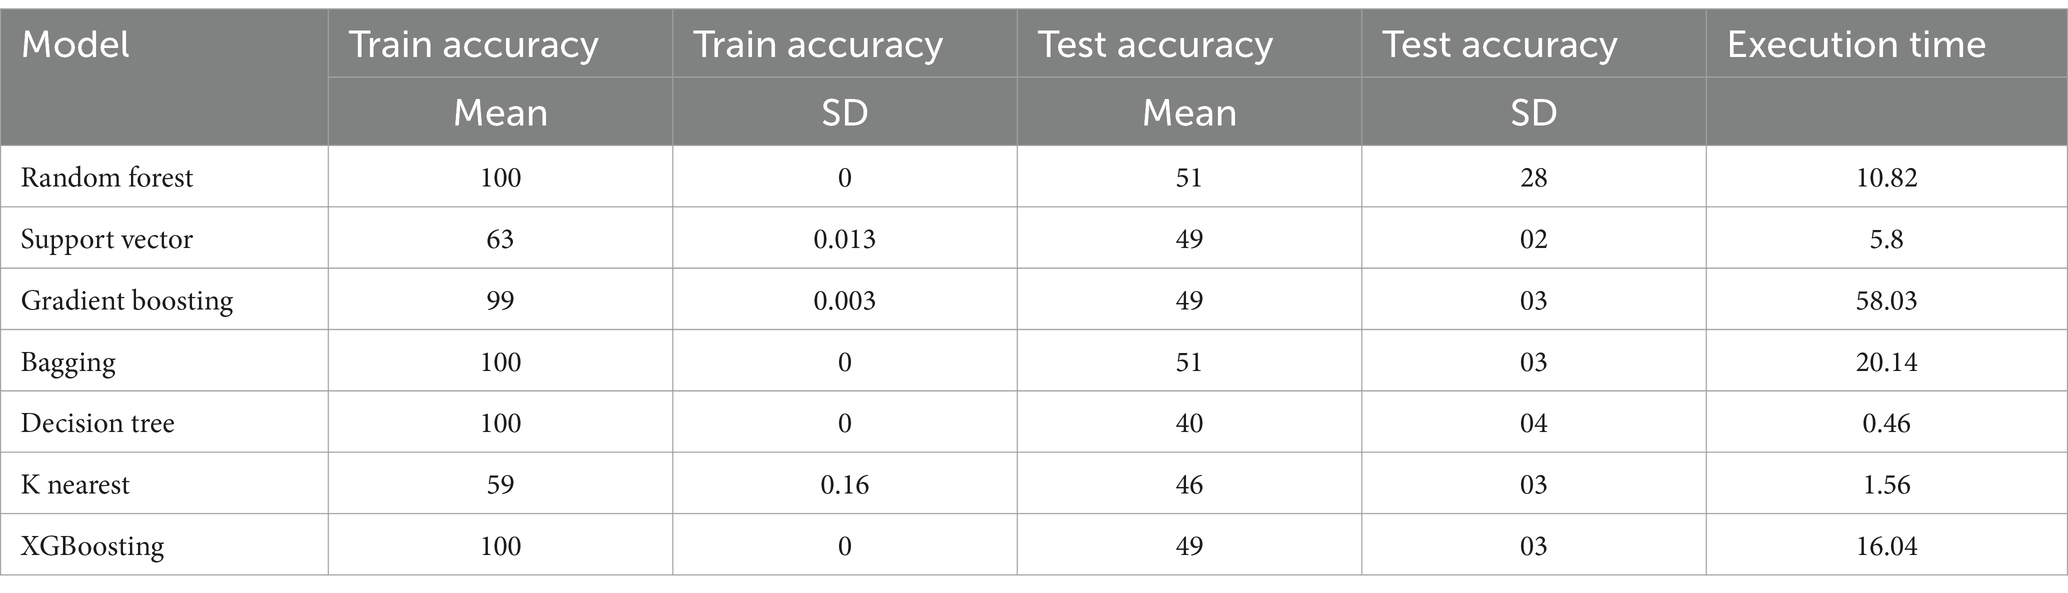
Table 8. Train test and execution time of each model.
Similarly, when the target feature is simplified to only two categories—success or failure—the GridSearchCV tested and recommended the best parameter grid. For AUC, the optimal minimum sample split was found to be 2, achieving a score of 80%. This model was well-tuned, although the training accuracy reached 89%. In terms of evaluation, the model also showed strong performance across recall, precision, and accuracy metrics. The feature importance plot above, as shown in Figure 15, indicates that high school scores in English, Math, and Physics were not found to be significant. However, the bachelor’s degree English score had the highest importance, while the high school percentage score ranked as the fourth most significant feature.
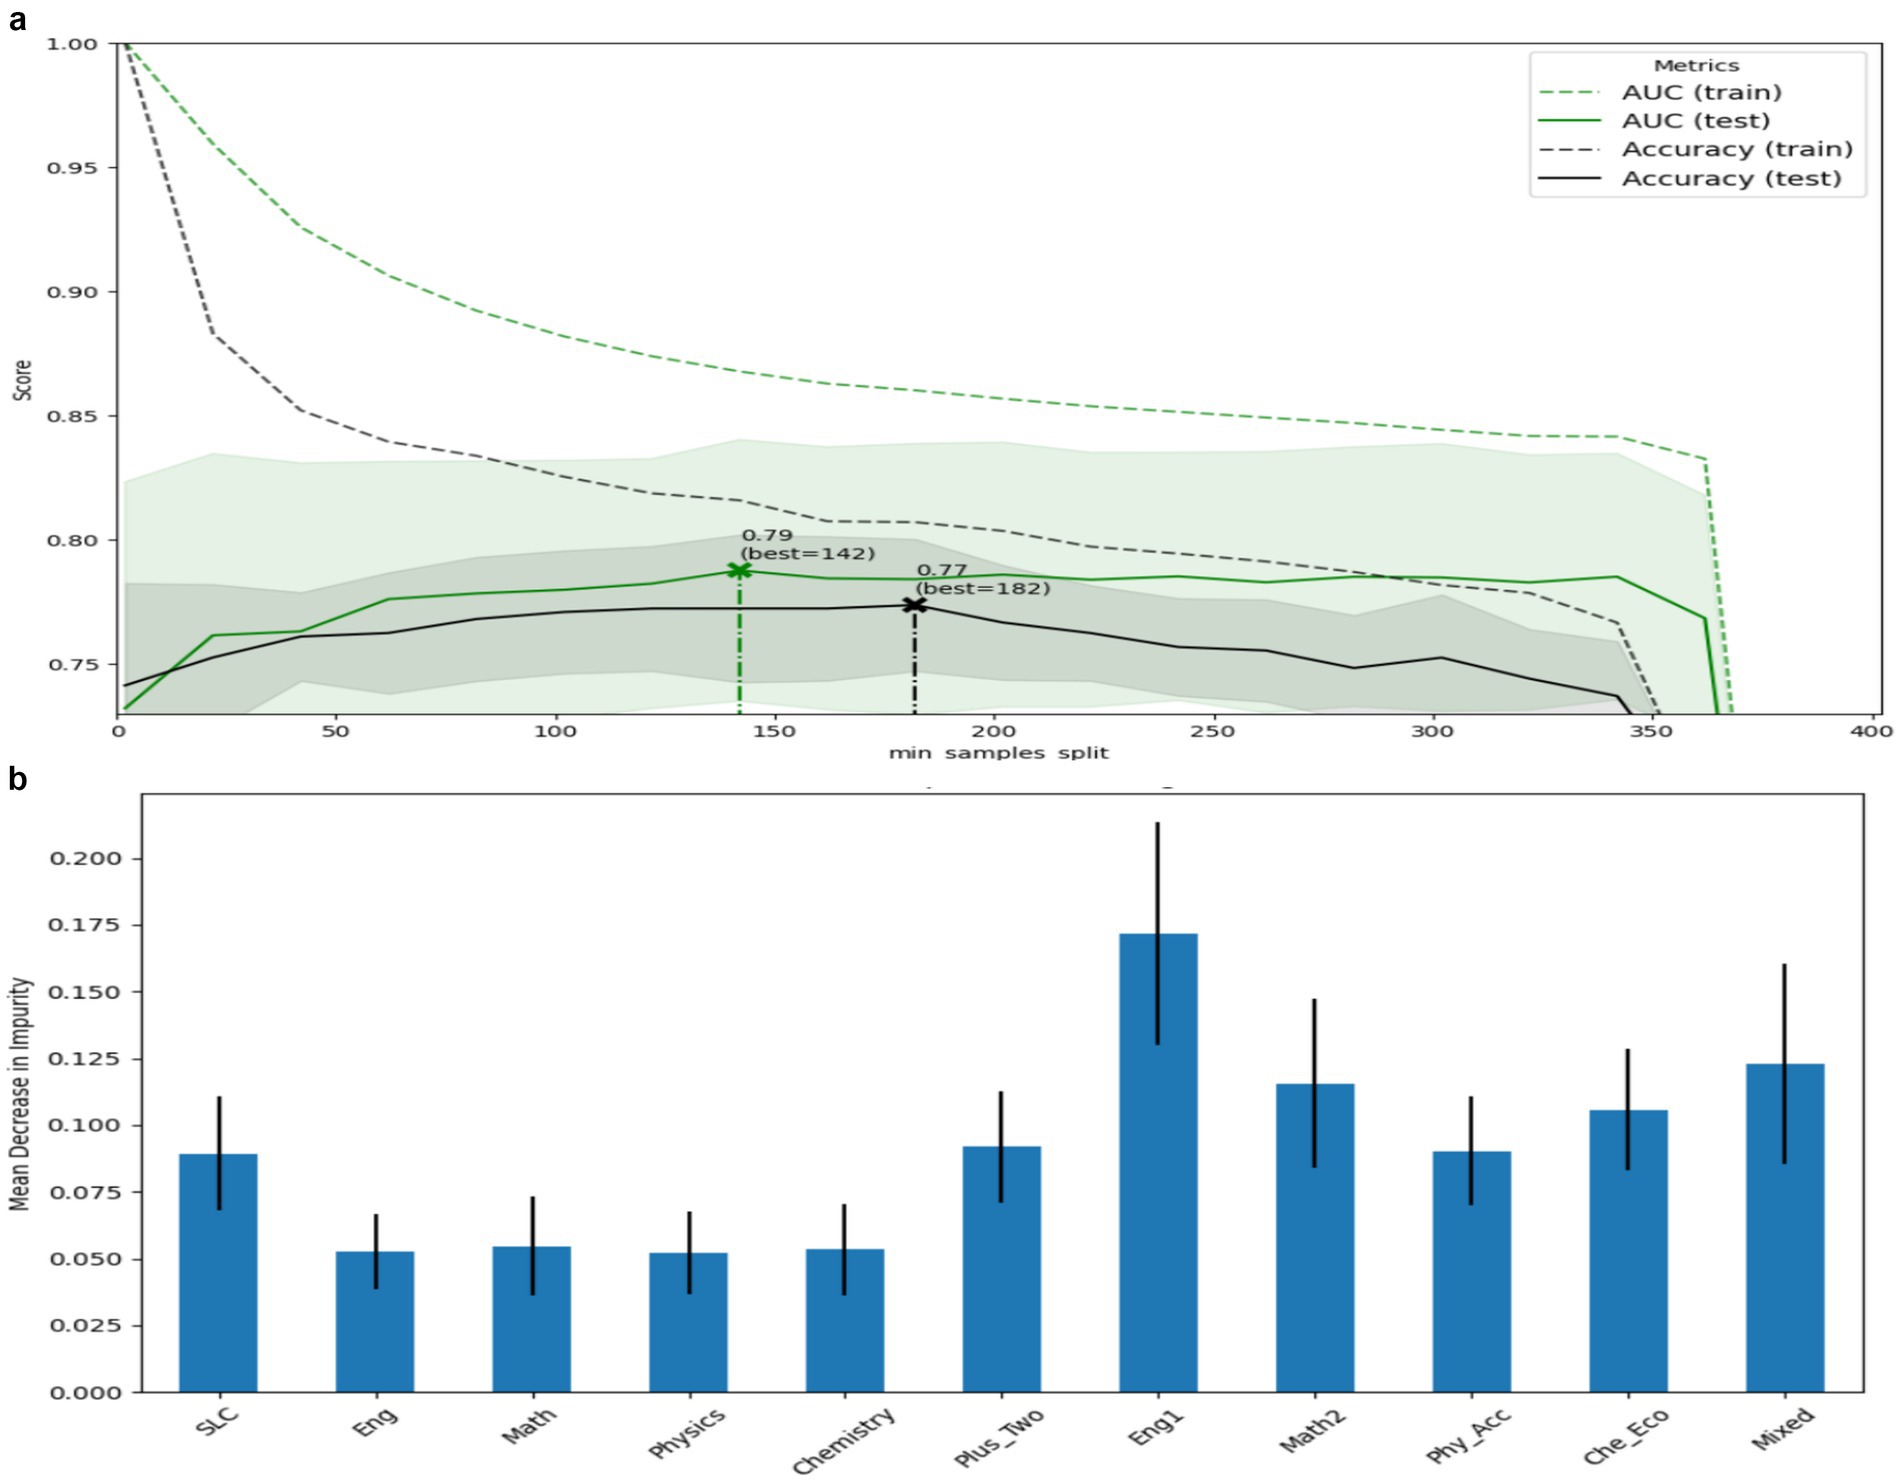
Figure 15. Accuracy summary (a) and feature importance (b).
The above feature importance signifies that the English score had the most significant impact, which could be proved using decision tree algorithms as the central node from where trees grow for classification, as illustrated in Figure 16. Math2 is on the right side, and physics and chemistry are on the left side of the trees. After encoding the target feature label, the XGB regressor with 100 iterations was estimated using the tree explainer of its model. The plot revealed that the “English1” feature had the highest importance, with waterfall SHAP values explaining 64% of the target GPA. In comparison, “English” accounted for 89%, “Math2” contributed 83%, and “Mixed Subjects” explained 67%. On the other hand, “Chemistry” showed a negative contribution of −13%, and “High School Grades” had the lowest impact at −29% when predicting bachelor letter grading in Figure 17.
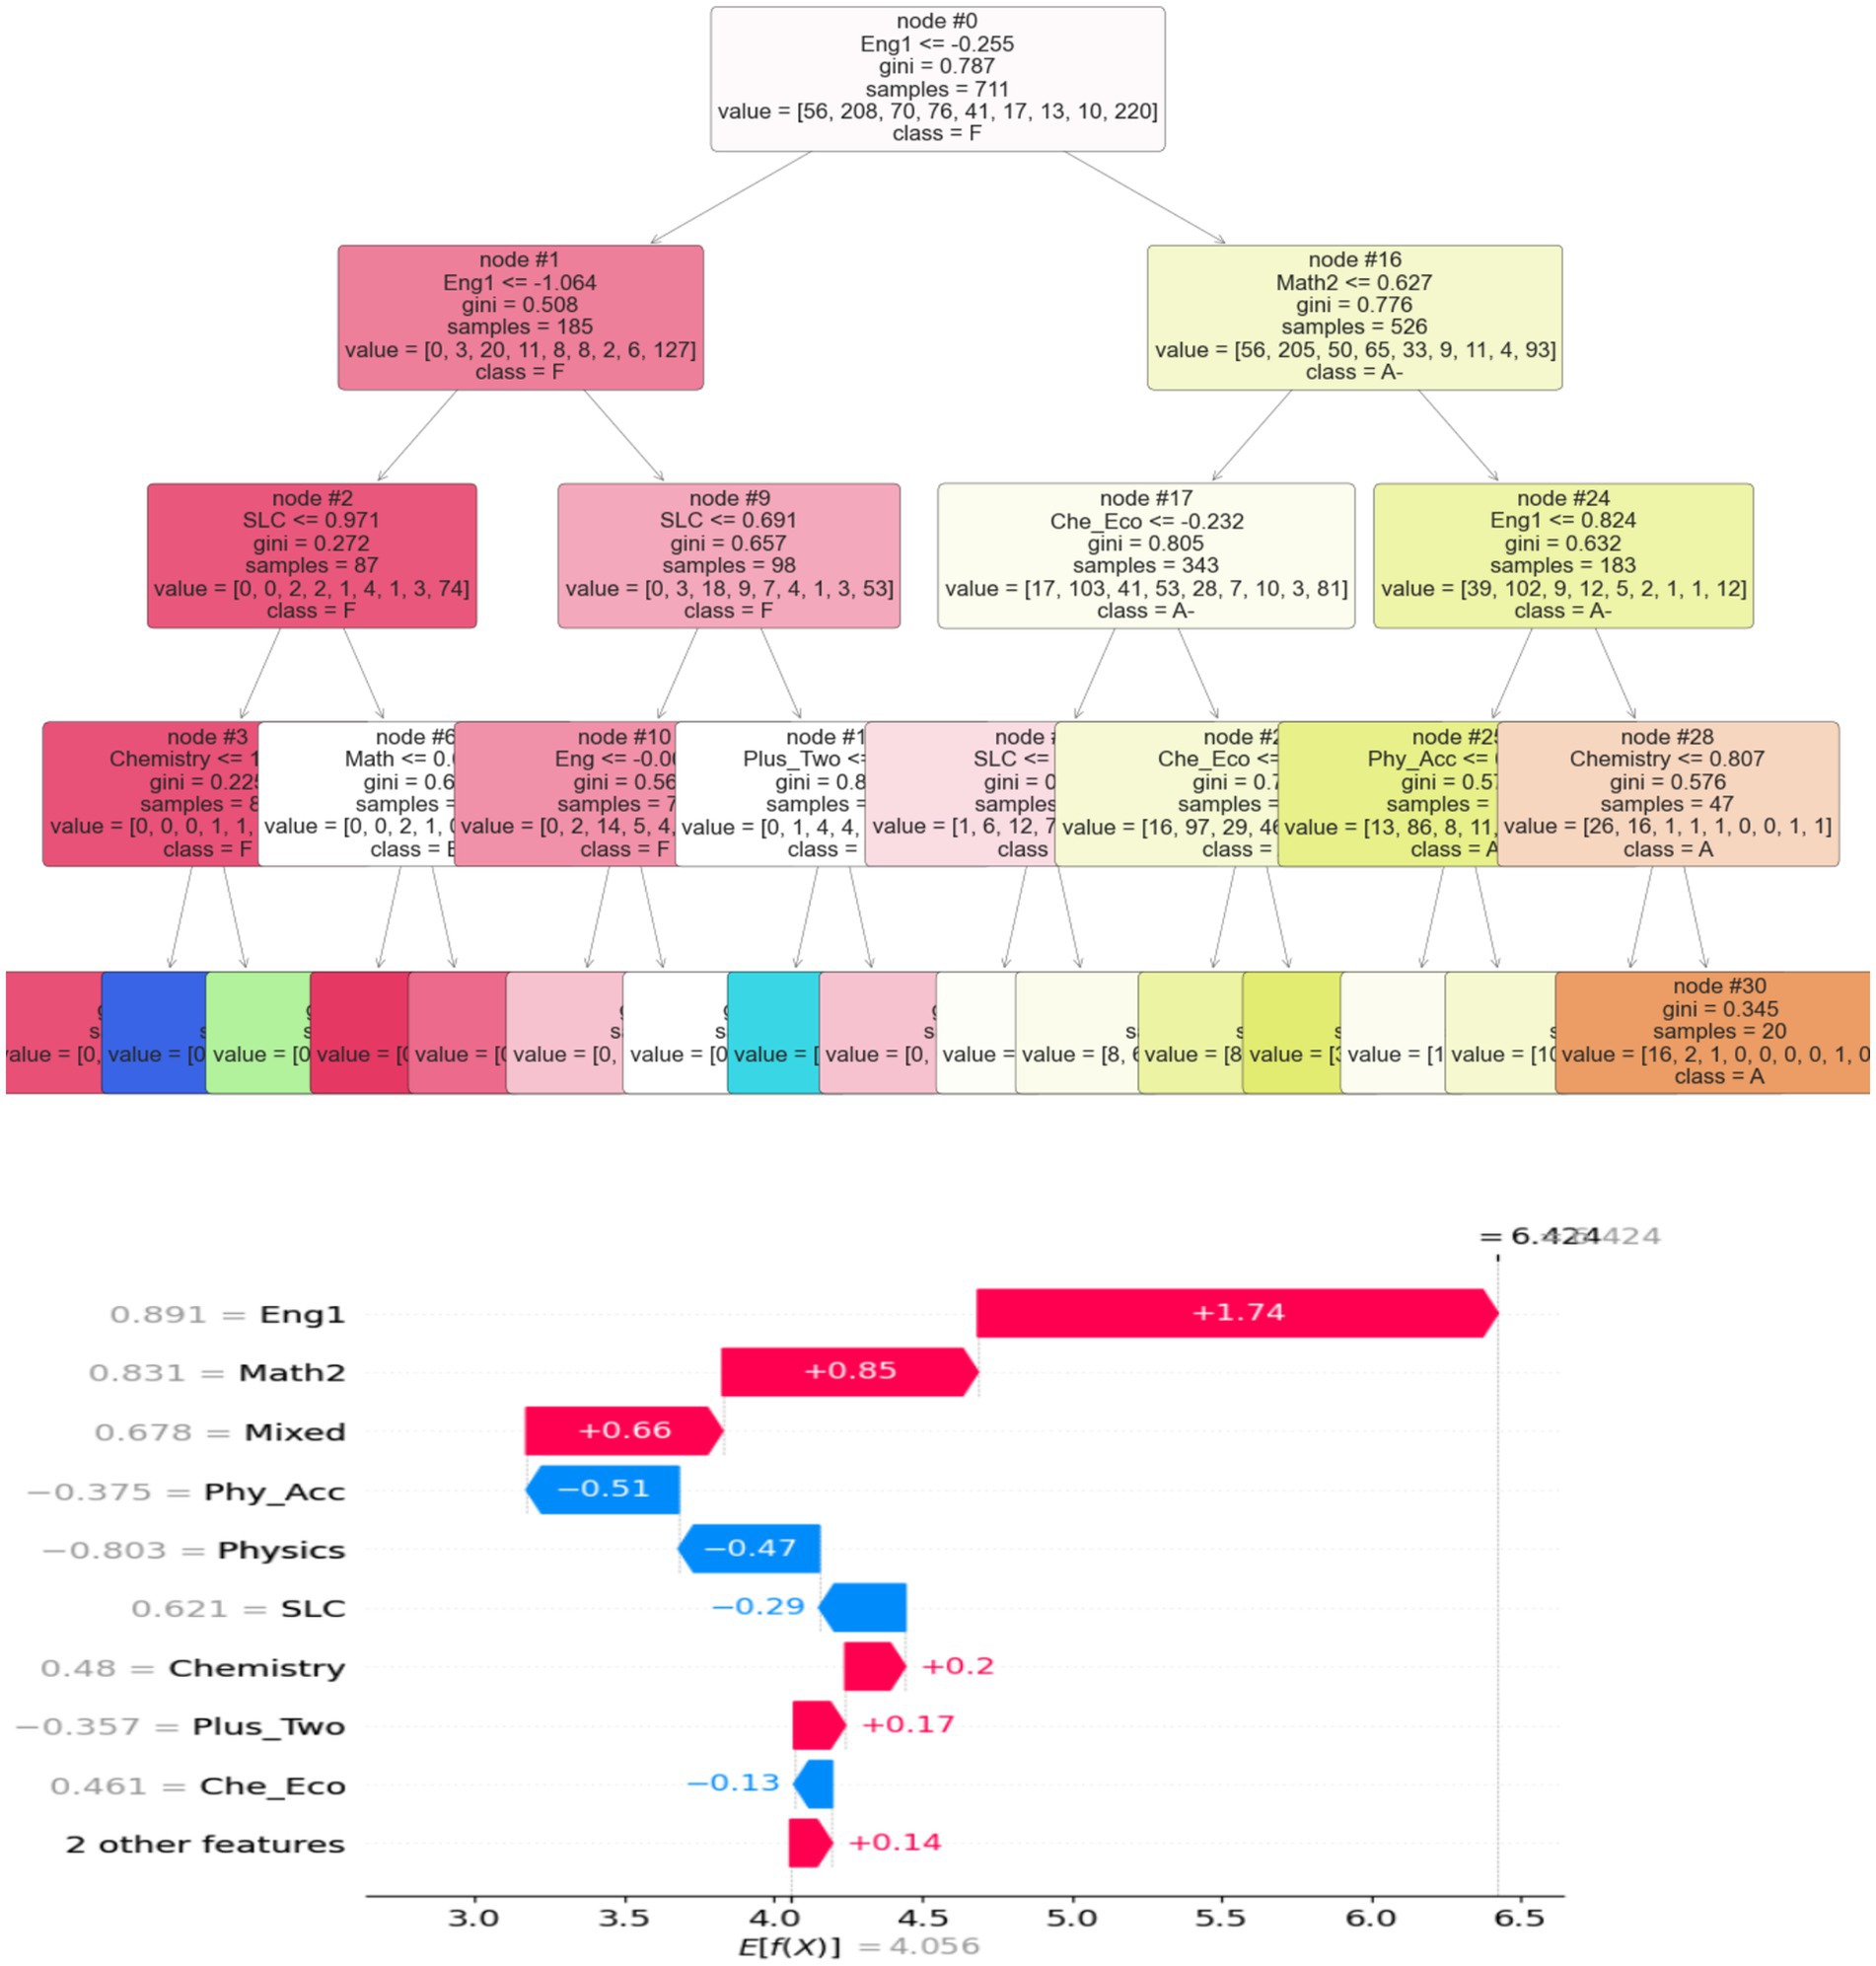
Figure 16. Decision tree and shape score feature importance.
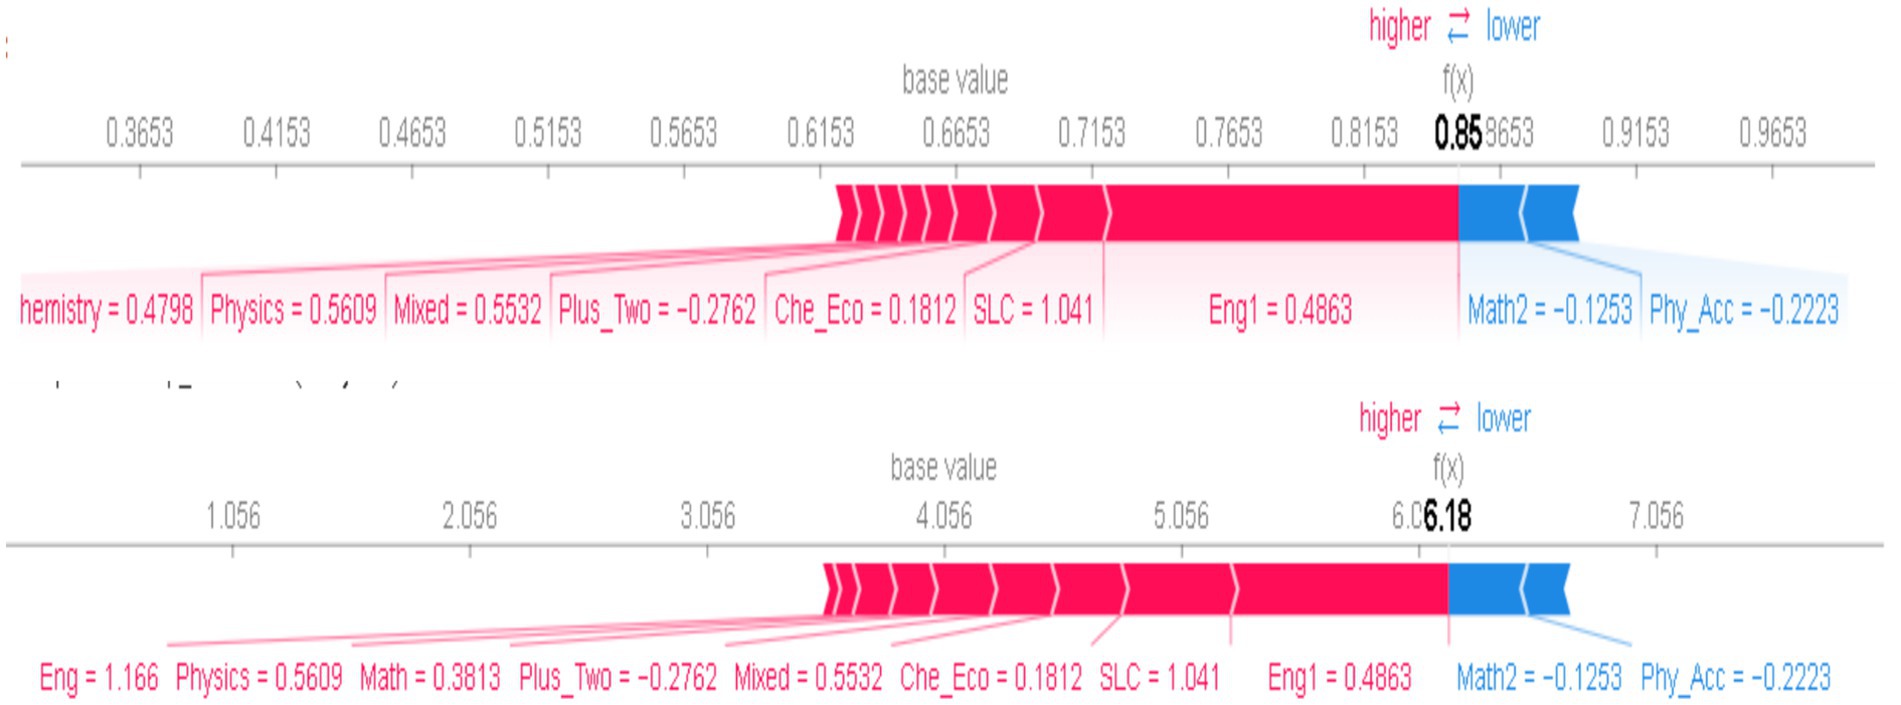
Figure 17. Shape feature importance of each score.
5 Conclusion
AI is revolutionizing the prediction of student letter grades by analyzing vast amounts of data, predicting grades with high accuracy, and identifying patterns. This data-driven approach reduces bias and human error while providing real-time feedback to students. AI also offers personalized insights, guiding students on areas for improvement. It benefits both students and educators by providing early warnings, identifying at-risk students, and adjusting curricula, leading to more effective educational strategies and consistent, equitable grading across large student groups. In conclusion, this research focuses on predicting multiclass outcomes using precision, recall, and F1 scores, with AUC/ROC curves employed to assess global accuracy related to student grades. Although the accuracy of machine learning models largely depends on training data, the sample distribution and target features exhibit polymorphic heterogeneity. To address overfitting and underfitting, model tuning should be guided by comprehensive comparisons, considering not only accuracy but also the local and global influence on the target feature. Further analysis of the accuracy of the single baseline model is required, taking into account both local and global accuracy to determine the best-performing model. Additionally, train-test accuracy and execution time are crucial factors in evaluating model performance. The study found that gradient boosting, random forest, and bagging algorithms outperformed KNN and Bayesian models for multiclass grade prediction. Among the evaluated models, gradient boosting achieved the highest macro prediction accuracy at 67%, followed by random forest (64%), bagging (65%), K-nearest neighbors (60%), XGBoost (60%), decision tree (55%), and support vector machines (59%). At the individual student level, support vector machines, random forests, and XGBoost provided the closest alignment with actual grades. Notably, these models successfully predicted the C grade with 97% accuracy, while predicting an A grade proved more challenging, with an accuracy of only 66%. The ROC plots indicated that support vector machines performed best with one- vs- rest classification. Additionally, while C and C + grades were accurately classified without errors, both random forest and XGBoost models showed significant overlap in predicting different grade classifications. The XGB regressor, when evaluated using SHAP values, indicated that features such as diplomas had a higher importance score, with English and Math contributing over 89%. Based on these findings, this research suggests further exploration of hyperparameter tuning, particularly comparing the CAT Boost and LightGBM algorithms for predicting multi-level student grades.
Data availability statement
The datasets presented in this study can be found in online repositories. The names of the repository/repositories and accession number(s) can be found in the article/supplementary material.
Ethics statement
Ethical review and approval was not required for the study on human participants in accordance with the local legislation and institutional requirements. Written informed consent from the participants was not required to participate in this study in accordance with the national legislation and the institutional requirements.
Author contributions
YR: Conceptualization, Data curation, Formal analysis, Funding acquisition, Investigation, Methodology, Resources, Software, Supervision, Validation, Visualization, Writing – original draft, Writing – review & editing. NS: Supervision, Writing – review & editing.
Funding
The author(s) declare that no financial support was received for the research and/or publication of this article.
Conflict of interest
The authors declare that the research was conducted in the absence of any commercial or financial relationships that could be construed as a potential conflict of interest.
Generative AI statement
The authors declare that no Gen AI was used in the creation of this manuscript.
Publisher’s note
All claims expressed in this article are solely those of the authors and do not necessarily represent those of their affiliated organizations, or those of the publisher, the editors and the reviewers. Any product that may be evaluated in this article, or claim that may be made by its manufacturer, is not guaranteed or endorsed by the publisher.
References
Adnan, M., Uddin, M. I., Khan, E., Alharithi, F. S., Amin, S., and Alzahrani, A. A. (2022). Earliest possible global and local interpretation of students' performance in virtual learning environment by leveraging explainable AI. IEEE Access 10, 129843–129864. doi: 10.1109/ACCESS.2022.3227072
Alangari, N., and Alturki, R., (2020), Predicting students final GPA using 15 classification algorithms. Available online at:. (http://romjist.ro/full-texts/paper660.pdf)
Albreiki, B., Zaki, N., and Alashwal, H. (2021). A systematic literature review of student' performance prediction using machine learning techniques. Edu. Sci. 11:552. doi: 10.3390/educsci11090552
Alnwairan, S., Aldajani, I., and Alshraideh, M. (2022). “Measuring the academic Students' performance at the University of Jordan using Netnography methodology” in Reconciliation, heritage and social inclusion in the Middle East and North Africa. eds. I. M. AlDajani and M. Leiner (Cham: Springer International Publishing), 129–143.
Alsariera, Y. A., Baashar, Y., Alkawsi, G., Mustafa, A., Alkahtani, A. A., and Ali, N. (2022). Assessment and evaluation of different machine learning algorithms for predicting student performance. Comput. Intell. Neurosci. 2022, 1–11. doi: 10.1155/2022/4151487
Alshmrany, S. (2022). Adaptive learning style prediction in e-learning environment using levy flight distribution based CNN model. Clust. Comput. 25, 523–536. doi: 10.1007/s10586-021-03403-3
Arizmendi, C. J., Bernacki, M. L., Raković, M., Plumley, R. D., Urban, C. J., Panter, A. T., et al. (2022). Predicting student outcomes using digital logs of learning behaviors: review, current standards, and suggestions for future work. Behav. Res. Methods 55, 3026–3054. doi: 10.3758/s13428-022-01939-9
Badal, Y. T., and Sungkur, R. K. (2023). Predictive modelling and analytics of students' grades using machine learning algorithms. Educ. Inf. Technol. 28, 3027–3057. doi: 10.1007/s10639-022-11299-8
Bujang, S. D. A., Selamat, A., Ibrahim, R., Krejcar, O., Herrera-Viedma, E., Fujita, H., et al. (2021). Multiclass prediction model for student grade prediction using machine learning. IEEE Access 9, 95608–95621. doi: 10.1109/ACCESS.2021.3093563
Cui, Y., Chen, F., and Shiri, A. (2020). Scale up predictive models for early detection of at-risk students: A feasibility study. Inform Learn Sci 121, 97–116. doi: 10.1108/ILS-05-2019-0041
Deo, R. C., Yaseen, Z. M., Al-Ansari, N., Nguyen-Huy, T., Langlands, T. A. M., and Galligan, L. (2020). Modern artificial intelligence model development for undergraduate student performance prediction: An investigation on engineering mathematics courses. IEEE Access 8, 136697–136724. doi: 10.1109/ACCESS.2020.3010938
Gamie, E. A., El-Seoud, M., Salama, M. A., and Hussein, W. (2019). Multidimensional analysis to predict Students' grades in higher education. Int. J. Emerg. Technol. Learn. 14:4. doi: 10.3991/ijet.v14i02.9905
Goran, R., et al. (2024). Identifying and understanding student dropouts using metaheuristic optimized classifiers and explainable artificial intelligence techniques. IEEE Access 7:99. doi: 10.1109/ACCESS.2024.3446653
Guerrero, M., Heaton, S., and Urbano, D. (2021). Building universities' intrapreneurial capabilities in the digital era: The role and impacts of massive open online courses (MOOCs). Technovation 99:102139. doi: 10.1016/j.technovation.2020.102139
Hasib, K. M., Rahman, F., Hasnat, R., and Alam, M. G. R., "A machine learning and explainable ai approach for predicting secondary school student performance," In 2022 IEEE 12th annual computing and communication workshop and conference (CCWC), Las Vegas, USA: IEEE, (2022).
Hita, J. A., and Bermejo, L. C. (2021). The role of higher education institutions and support entities in creating open technological solutions for language learning by refugees and migrants. Lang. Migr. 13:2. doi: 10.37536/LYM.13.2.2021
Huynh-Cam, T.-T., Chen, L.-S., and Huynh, K.-V. (2022). Learning performance of international students and students with disabilities: Early prediction and feature selection through educational data mining. Big Data Cogn. Comput. 6:94. doi: 10.3390/bdcc6030094
Kamal, M., Chakrabarti, S., Ramirez-Asis, E., Asís-López, M., Allauca-Castillo, W., Kumar, T., et al. (2022). Metaheuristics method for classification and prediction of student performance using machine learning predictors. Math. Probl. Eng. 2022, 1–5. doi: 10.1155/2022/2581951
Keser, S. B., and Aghalarova, S. (2022). HELA: a novel hybrid ensemble learning algorithm for predicting academic performance of students. Educ. Inf. Technol. 27, 4521–4552. doi: 10.1007/s10639-021-10780-0
Matar, N., Matar, W., and AlMalahmeh, T. (2022). A predictive model for students admission uncertainty using Naïve Bayes classifier and kernel density estimation (KDE). Int. J. Emerg. Technol. Learn. 17, 75–96. doi: 10.3991/ijet.v17i08.29827
Motaung, T., Padayachee, K., and Ajoodha, R., "Predicting students at-risk using deep learning neural network: a comparison of performance of different models," In 2022 international conference on electrical, computer, communications and mechatronics engineering (ICECCME), Maldives: IEEE, (2022).
Nuankaew, P., and Nuankaew, W. S. (2022). Student performance prediction model for predicting academic achievement of high school students. Eur. J. Educ. Res. 11, 949–963. doi: 10.12973/eu-jer.11.2.949
Sixhaxa, K., Jadhav, A., and Ajoodha, R., "Predicting students performance in exams using machine learning techniques," In 2022 12th international conference on cloud computing, Data Science & Engineering (confluence), IEEE: New York, (2022).
Subahi, A. F., Khalaf, O. I., Alotaibi, Y., Natarajan, R., Mahadev, N., and Ramesh, T. (2022). Modified self-adaptive Bayesian algorithm for smart heart disease prediction in IoT system. Sustainability 14:14208. doi: 10.3390/su142114208
Tarik, A., Aissa, H., and Yousef, F. (2021). Artificial intelligence and machine learning to predict student performance during the COVID-19. Procedia Comput. Sci. 184, 835–840. doi: 10.1016/j.procs.2021.03.104
Wang, L. (2024). Metaheruistic optimization based machine-learning approach for analysis of academic students' strategies. J. Intell. Fuzzy Syst. 6, 1–13. doi: 10.3233/JIFS-234021
Yağcı, M. (2022). Educational data mining: prediction of students' academic performance using machine learning algorithms. Smart Learn. Environ. 9:11. doi: 10.1186/s40561-022-00192-z
Yeung, M. W. L., and Yau, A. H. Y. (2022). A thematic analysis of higher education students' perceptions of online learning in Hong Kong under COVID-19: challenges, strategies and support. Educ. Inf. Technol. 27, 181–208. doi: 10.1007/s10639-021-10656-3
Keywords: random forest, ensemble model, data analysis, receiver operating characteristic, grade point average
Citation: Rimal Y and Sharma N (2025) Ensemble machine learning prediction accuracy: local vs. global precision and recall for multiclass grade performance of engineering students. Front. Educ. 10:1571133. doi: 10.3389/feduc.2025.1571133
Edited by:
Charity M. Dacey, Touro University Graduate School of Education, United StatesReviewed by:
Miodrag Zivkovic, Singidunum University, SerbiaAleksandra Świetlicka, Poznań University of Technology, Poland
Haiyun Chu, Harbin Medical University, China
Copyright © 2025 Rimal and Sharma. This is an open-access article distributed under the terms of the Creative Commons Attribution License (CC BY). The use, distribution or reproduction in other forums is permitted, provided the original author(s) and the copyright owner(s) are credited and that the original publication in this journal is cited, in accordance with accepted academic practice. No use, distribution or reproduction is permitted which does not comply with these terms.
*Correspondence: Yagyanath Rimal, cmltYWwueWFneWFAZ21haWwuY29t